Abstract
Flash flood hazards on the Qinghai–Tibet Plateau are surging under rapid warming and humidification, driving glacier retreat, lake outbursts, and extreme precipitation that imperil water security across Asia. To address the limitations of studies relying primarily on historical observations and lacking quantitative insights into disaster mechanisms and dynamic prediction, this study integrates a logistic regression model with the geographical detector approach. Using multi-source flash flood records from 1950 to 2023 and 12 environmental variables (elevation, slope, precipitation, river network density, land use, etc.), the analysis quantifies the interactive effects of key drivers and uncovers the nonlinear mechanisms governing flash flood sensitivity. The results indicate that: (1) the model demonstrates strong predictive capability, achieving 78% accuracy and an AUC of 0.87; (2) mean annual precipitation is the dominant factor, while its interaction with river proximity enhances the explanatory power of flash flood disasters by 37%, indicating a nonlinear reinforcing effect; and (3) high-resolution sensitivity mapping for 2023 reveals that areas of high and very high flash flood sensitivity are concentrated in the South Tibet Valley and Hengduan Mountains, aligning with regions of glacial lake expansion and frequent extreme precipitation. In contrast, medium- and low-sensitivity areas are widely distributed across the North Tibet Plateau, where arid geomorphology and sparse river networks exert dominant control. This spatial pattern corresponds closely with regional topographic, climatic, and hydrological processes. The study offers a transferable approach for dynamic flash flood risk early warning, precise disaster zoning, and improved resilience of transboundary basins on the Qinghai–Tibet Plateau.
1 Introduction
Flash floods are among the most destructive natural disasters worldwide and have become a primary triggering factor in flood disaster chains. Their frequency and contribution to overall disaster losses have continued to increase in recent years, drawing growing attention to risk assessment research. Typically, induced by extreme rainfall in complex mountainous terrain, flash floods are characterized by sudden onset, rapid propagation, severe destructive force, and extremely short early-warning windows. Under climate change, the frequency and intensity of extreme weather events have risen sharply—particularly in ecologically sensitive regions such as the Qinghai–Tibet Plateau, where accelerated glacial melt, permafrost degradation, and intensified monsoon activity act synergistically. This convergence increasingly gives rise to compound flash flood events, including rainstorm-induced floods compounded by glacial lake outbursts and water–sediment mixed flow hazards. For example, a chain of glacial collapse events triggered by heavy rainfall in the Himalayan region in 2025 resulted in over 70 fatalities. As a critical tool for identifying potential risks and guiding disaster prevention and mitigation, flash flood risk assessment has developed into a theoretical framework centered on “hazard-exposure-vulnerability” paradigm. Nevertheless, substantial disparities in research focus and development remain across different regions (Zhang et al., 2019; Thouret et al., 2013; Wang et al., 2010).
In recent years, significant progress has been achieved in international flash flood risk assessment, largely driven by the integration of geospatial technologies and numerical modeling. By leveraging high-resolution datasets, such as Sentinel satellites and LiDAR, and hybrid modeling approaches, developed regions in Europe, North America, and the Asia-Pacific have made notable breakthroughs in fine-scale risk assessment of urban watersheds (Fang et al., 2017; Yang et al., 2025). In terms of model development, hybrid architectures have become mainstream. For instance, coupling the HEC-RAS hydrodynamic model with machine learning algorithms has significantly improved the accuracy and efficiency of flood inundation simulations (Burton et al., 1993; Rubio et al., 2020). Rubio et al. (Ward et al., 2011) integrated meteorological, hydrological, and other indicators to construct a susceptibility classification system for Metro Manila, achieving model accuracy above 90%. At the regional scale, research has increasingly focused on coastal and mountainous watersheds in Asia.,Ward et al. (Chinh and Jason, 2018) realized dynamic flood risk visualization in Jakarta by combining multi-scale hydrological models with GIS-based spatial overlay techniques, while Chinh et al. (Hassan et al., 2021) systematically assessed flash flood sensitivity in Vietnam’s Quang Nam Province by integrating hazard and vulnerability indicators. Similarly, Hassan et al. (Zeng et al., 2020) developed a multi-criteria flash flood risk assessment framework, incorporating elevation, slope, distance to rivers, and drainage density, based on digital elevation models and multi-source satellite data. Machine learning and ensemble methods have also shown considerable promise. For instance, the integration of MARS, RF, and ANN algorithms has enabled accurate susceptibility assessments at the vector-based small-watershed scale. Nevertheless, current research still faces challenges due to insufficient hydrological data, including limitations in the temporal length, sampling frequency, and spatial coverage of streamflow observations. Future research should emphasize multi-source heterogeneous data fusion, rigorous uncertainty analysis, and dynamic risk assessment under climate change scenarios to improve both the precision and predictive capacity of flash flood risk management.
Significant progress has been achieved in regional flood sensitivity assessment in China, with commonly used approaches including the entropy weight method, analytic hierarchy process, statistical analysis, and fuzzy comprehensive evaluation (Wang et al., 2018; Wu and Zhang, 2023; Liu et al., 2024; Chen et al., 2018). For example, Chen et al. (Peng and Zhang, 2022) applied principal component analysis to extract disaster-inducing factors and developed a flash flood sensitivity indicator system for small watersheds, determining weights through the analytic hierarchy process. Peng et al. (Wang et al., 2021) selected six indicators from hazard and vulnerability dimensions in Zhengzhou City, employed a game theory-based combined weighting approach to assess urban flood risk, and generated hierarchical risk maps using ArcGIS. Wang et al. (Wang, 2018) integrated flash flood hazard, exposure, and vulnerability into a comprehensive index model for risk classification in Jiangxi Province. Wang et al. (Wu et al., 2018) adopted an integrated weighting method and ArcGIS spatial interpolation to evaluate flash flood risk across the Loess Plateau in Gansu Province. Similarly, Wu et al. (Liu et al., 2019) selected nine indicators based on disaster-driving mechanisms in Jiangxi Province and used historical disaster points combined with randomly generated negative samples to train a random forest model for risk prediction. Despite these advances, current studies face notable limitations, including the absence of systematic and standardized criteria for indicator selection, inadequate validation of methodological applicability, and constraints related to data precision and spatial coverage. These issues substantially reduce the reliability and generalizability of evaluation results, highlighting the urgent need for more comprehensive and robust approaches (Luo et al., 2018; Yuan et al., 2023; Chang et al., 2021; Zhu et al., 2024).
With the rapid development of artificial intelligence (AI), machine learning (ML) has been increasingly applied to flash flood risk assessment, significantly improving the capacity to address high-dimensional and nonlinear problems. Flash flood susceptibility assessment quantifies the interactions between disaster-inducing factors and environmental conditions, providing critical scientific support for identifying high-risk areas and enabling tiered early warnings. Recent research has shifted from traditional hydrological and hydrodynamic models to hybrid approaches that combine mechanism-based models (e.g., HEC-HMS/HEC-RAS) with data-driven algorithms (e.g., Random Forest, Deep Neural Networks). This integration leverages the strengths of both paradigms, effectively mitigating issues related to data scarcity and heterogeneity in mountainous regions, thereby improving prediction accuracy and generalization in complex environments. For example, Random Forest has been widely employed to quantify the contributions of topographic, meteorological, and surface factors, while physics-informed LSTM surrogate models developed for ungauged basins achieve high-precision predictions with enhanced computational efficiency. Furthermore, advances in explainable AI (XAI) and cross-source deep learning have improved model transparency and strengthened the credibility of risk-informed decision-making. Despite these advances, key challenges persist, including limited model interpretability, low adaptability to small-sample scenarios, and high uncertainty in extreme-event prediction. Future research should focus on developing meta-learning frameworks suited to small-sample conditions, enhancing the fusion of multi-source heterogeneous data, and strengthening uncertainty quantification to advance AI-driven approaches for refined flash flood risk assessment.
Although flood hazard susceptibility has been widely investigated in various regions, the Qinghai–Tibet Plateau (QTP), as the core area of the “Water Tower of Asia,” still faces challenges such as limited assessment accuracy and insufficient understanding of flash flood mechanisms (Qiu et al., 2025). Flash floods in this region occur within a highly coupled environment involving cryospheric, climatic, hydrological, and anthropogenic processes, resulting in complex disaster-inducing mechanisms. However, the quantitative relationships between environmental factors and flash flood occurrences remain poorly understood, constraining the reliability of current risk assessments. To address these challenges, this study develops a high-precision flash flood sensitivity assessment framework for the QTP by integrating a logistic regression model with multi-source environmental data. The framework quantitatively investigates the disaster-inducing mechanisms driven by the synergistic effects of climate, cryosphere, and human activities, providing a scientific basis and decision-support tool for targeted prevention and control of regional flash flood hazards.
The subsequent content of this article will be structured as follows: Section 2 provides a detailed description of the study area overview, sources and preprocessing methods of multi-source data, as well as core research methods such as logistic regression and the geographical detector; Section 3 conducts flood disaster susceptibility assessment through model parameter optimization and validation, analyzes the mechanism of action of key disaster-causing factors, and generates a spatial distribution map of flood susceptibility in the study area; Section 4 summarizes the core conclusions of the research, points out the limitations of the current study, and proposes future research directions for further development, forming a complete research chain of “Data-Methods-Results-Conclusions”.
2 Study area and data
2.1 The study area
The Qinghai–Tibet Plateau (QTP), situated in the core of south-central Eurasia, spans 26°00′–39°47′N and 73°19′–104°47′E, extending south to the Himalayas, north to the Kunlun–Qilian tectonic belt, west to the Pamir Plateau, and east to the Hengduan Mountains. Covering approximately 2.5 × 10⁶ km2, about 26.8% of China’s land area—the QTP includes the entire Tibet Autonomous Region and Qinghai Province, as well as parts of western Sichuan, northwestern Yunnan, and southern Gansu. Formed by the ongoing collision and uplift of the Indian and Eurasian plates, the plateau averages over 4,000 m in elevation and features ultra-high mountains, deeply incised valleys, and layered plateaus, earning it the title “Water Tower of Asia.” Hosting about 4.9 × 10⁴ km2 of modern glaciers, it serves as the headwater region of ten major Asian rivers and contributes nearly 25% of China’s total river runoff. The plateau also contains over 1,500 lakes, forming a complex drainage system of both endorheic and exorheic basins. This distinctive geo-hydrological setting makes the QTP highly prone to flash flood hazards, primarily driven by intense rainfall and glacial lake outburst floods (GLOFs) (Wang et al., 2025). These events are characterized by sudden onset, strong regionality, and cascading impacts, causing severe socioeconomic and environmental losses. Consequently, systematic flash flood risk assessment across the QTP is crucial for understanding disaster-inducing mechanisms and enabling precise regional disaster prevention and mitigation. The study area is shown in Figure 1.
FIGURE 1

Study area.
2.2 Research data
This study systematically evaluated flood sensitivity in high-mountain regions using multi-source datasets. Historical flood inventory data (1950–2023) were obtained from the Institute of Tibetan Plateau Research, Chinese Academy of Sciences (CAS), while precipitation and temperature data were sourced from the National Tibetan Plateau Data Center. Topographic variables, the Topographic Wetness Index (TWI), and runoff data were derived from the National Aeronautics and Space Administration (NASA). Land use information was provided by the Institute of Remote Sensing and Information Processing, Wuhan University, whereas river network and road distance data were obtained from China’s Fifth-Level River Vector Dataset and the OpenStreetMap Global Primary Roads dataset, respectively. Lithological data were extracted from the Global Lithological Map. Based on flood events recorded on the Qinghai–Tibet Plateau from 1950 to 2023, key attributes such as occurrence time, location, disaster type, triggering cause, and rainfall amount were compiled. Twelve flood-regulating factors were selected as independent variables to assess the spatial susceptibility of flood disasters, with detailed data sources summarized in Table 1.
TABLE 1
| Impact factors | Name | Data | Time | Resolution | Source |
|---|---|---|---|---|---|
| Meteorological elements” | Mean Areal Precipitation (MAP) | 1-km monthly precipitation dataset for China (1901–2023) | 1950–2023 | 1 km | https://data.tpdc.ac.cn/zh-hans/data/faae7605-a0f2-4d18-b28f-5cee413766a2 |
| Mean Areal Temperature (MAT) | 1-km monthly mean temperature dataset for china | https://data.tpdc.ac.cn/zh-hans/data/71ab4677-b66c-4fd1-a004-b2a541c4d5bf | |||
| Topographic elements | Elevation | NASA SRTM Digital Elevation 90m | — | 90 m | https://developers.google.com/earth-engine/datasets/catalog/CGIAR_SRTM90_V4?hl=zh-cn#description |
| Slope | https://zenodo.org/records/12779975 | ||||
| Plan Curvature (PC) | https://open.geovisearth.com/ | ||||
| Profile Curvature (PrC) | https://www.openstreetmap.org/#map=5/38.01/-95.84 | ||||
| Hydrological elements |
Topographic Wetness Index (TWI) |
NASA SRTM Digital Elevation 90m | — | 90 m | https://www.geo.uni-hamburg.de/en/geologie/forschung/aquatische-geochemie/glim.html |
| Flow | https://data.tpdc.ac.cn/zh-hans/data/faae7605-a0f2-4d18-b28f-5cee413766a2 | ||||
| Environmental elements | Land Use and Land Cover Change (LUCC) | China Land Cover Dataset | 1990–2023 | 30 m | https://data.tpdc.ac.cn/zh-hans/data/71ab4677-b66c-4fd1-a004-b2a541c4d5bf |
| Distance to River Networks (DRN) | China’s Fifth - Level River Vector Dataset | https://developers.google.com/earth-engine/datasets/catalog/CGIAR_SRTM90_V4?hl=zh-cn#description | |||
| Distance to Roads (DR) | Open Street Map Global Primary Roads | — | https://zenodo.org/records/12779975 | ||
| Lithological factor | Lith | Global Lithological Map | — | 1:375,000 | https://open.geovisearth.com/ |
| Geographical elements | 1:1,000,000 Scale Administrative Boundary Data | Administrative boundaries data at 1:1,000,000 scale over the Tibetan Plateau | 2017 | 1:1,000,000 | https://www.tpdc.ac.cn/zh-hans/data/848ac234-f69b-438f-9310-4830fb153374/ |
| Historical Floods in the Qinghai-Tibet Plateau and Its Surrounding Areas | Floods inventory in High Mountain Asia | 1950–2023 |
100 m - 1 km |
https://data.tpdc.ac.cn/zh-hans/data/1a718611-44a8-4faf-a9f1-928e368d534c | |
| The Qinghai-Tibet Plateau and Its Railway Corridors | Compilation of major flash flood along the Sichuan Tibet line and surrounding areas | 1840–2019 |
10m–100m |
https://data.tpdc.ac.cn/zh-hans/data/62908d95-cf43-4932-8127-080be3e9b463 |
Basic data.
To ensure data reliability, targeted quality control measures were implemented for different types of data:For meteorological data, this study adopted the “neighboring station interpolation + time series smoothing” method to handle missing values. For single-day missing data at individual stations, the distance-weighted average method was used to supplement the data using observations from 3 surrounding stations with no missing data in the same period; for continuous missing periods of more than 3 days, linear trend analysis combined with historical mean correction was applied to ensure the continuity of the time series. For LUCC (Land Use and Land Cover Change) data, ambiguous classification boundaries (e.g., forest-grass transition zones) were manually corrected using high-resolution Google Earth images to ensure the accuracy of land cover boundaries. For river network and road vector data, “topological inspection + field location verification” was used to remove erroneous data—specifically, river network vector segments with self-intersections or dangling nodes were deleted, and road data inconsistent with actual terrain were corrected to meet the accuracy requirements of spatial analysis.
Consistency matching of all factor data was completed on the ArcGIS platform. High-resolution data such as LUCC and topographic data were resampled to a 500 m resolution using the “nearest neighbor method”; continuous variables including annual precipitation and elevation were classified using the “natural breaks method” to lay the foundation for the geographical detector model analysis. Finally, a multi-factor raster database covering the entire study area was constructed to ensure the consistency and comparability of data used in subsequent modeling.
2.2.1 Flood impact factors
Flood sensitivity arises from complex, nonlinear interactions among multiple factors. This study established an assessment framework by integrating 12 variables across four categories: geographic, meteorological, hydrological, and environmental. Geographic factors include elevation (Elev), slope gradient (Slope), plan curvature (PC), profile curvature (PrC), distance to river networks (DRN), and distance to roads (DR), which jointly regulate precipitation patterns, runoff velocity, flow convergence, and surface hardening effects near roadways. Meteorological factors comprise mean annual precipitation (MAP) and mean annual temperature (MAT), representing direct water supply and indirect control over snowmelt and precipitation forms. Hydrological factors, including the Topographic Wetness Index (TWI) and runoff (Flow), characterize potential waterlogging zones and upstream inflow contributions to flood peaks. Environmental factors consist of land use/land cover (LUCC) and lithology (Lith), reflecting their influence on infiltration, runoff generation, and terrain permeability. All variables were processed consistently in ArcGIS, including uniform resampling to 500 m resolution, natural breaks classification, image mosaicking, study area masking, spatial interpolation, and Euclidean distance calculations. The resulting multi-factor raster database provides a standardized, comparable foundation for flood sensitivity modeling, with the spatial distribution of each factor illustrated in Figure 2.
FIGURE 2
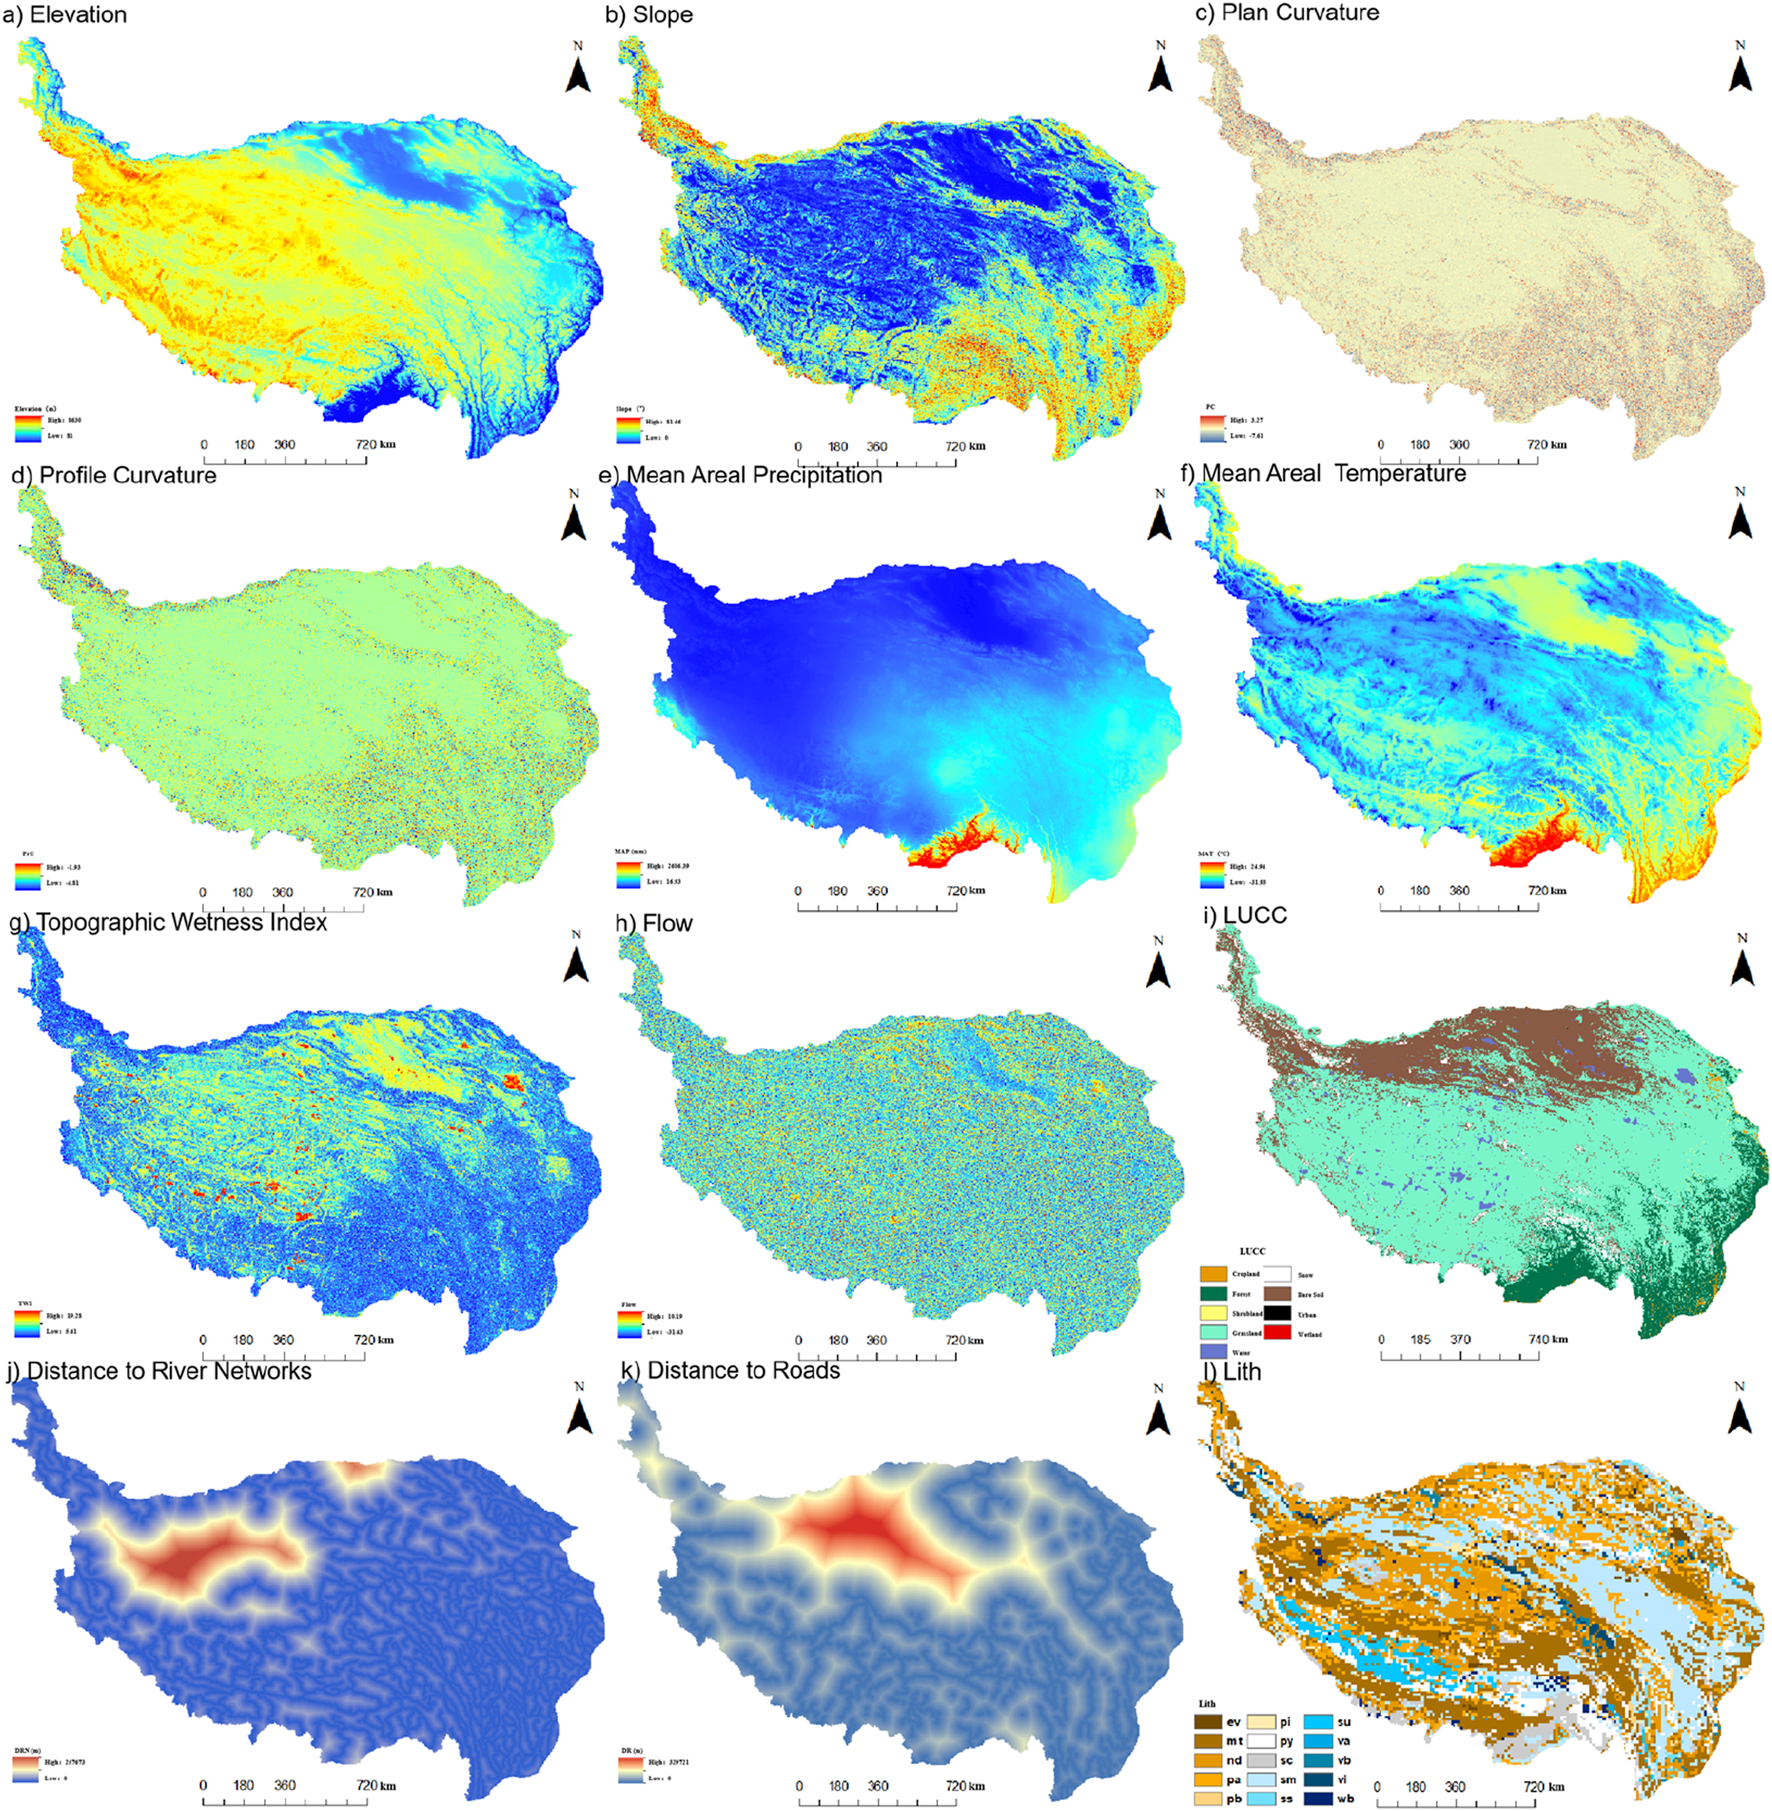
Disaster-inducing factors map (a) Elevation. (b) Slope. (c) Plan curvature. (d) Profile curvature. (e) Mean areal precipitation. (f) Mean areal temperature. (g) Topographic wetness index. (h) Flow. (i) LUCC. (j) Distance to river network. (k) Distance to roads. (l) Lith..
2.3 Research methods
2.3.1 Logistic regression
Logistic regression is widely applied to binary classification tasks and effectively models the nonlinear relationship between flood occurrence probability (P) and multiple explanatory factors. In this study, P is defined by Equations 1, 2, with model parameters estimated via the maximum likelihood method to quantify the contribution of each factor.
Where: b0 is the intercept of the model; bi (i = 1,2, … n)are the slope coefficients of the logistic regression model; and xi (=0,1,2, … n) are the independent variables. Using the logistic regression model, we can quantify the specific impact of each explanatory factor on flood occurrence, thereby providing a scientific basis for flood control measures.
2.3.2 Geographical Detector
The Geographical Detector is employed to assess the spatial heterogeneity of individual factors and their interaction effects, with the q-value (Equation 3) serving as the core metric. A higher q-value indicates greater explanatory power for the spatial distribution of floods. All continuous independent variables were discretized using the natural breaks method prior to calculation.
Where: is the number of factor classes; and are the sample size and variance of the hth class, respectively; N and are the total sample size and total variance, respectively, q A larger q-value indicates a stronger explanatory power of the factor on the spatial differentiation of flood disasters.
2.3.3 Verification method
In evaluating LR models, accuracy, precision, recall, F1-score, ROC curve, and AUC are commonly used to assess classification performance. Accuracy measures the proportion of correctly classified samples, providing an intuitive evaluation of model effectiveness. In Equation 4, True Positives (TP) represent correctly identified positive samples, True Negatives (TN) denote correctly identified negative samples, False Positives (FP) are negative samples misclassified as positive, and False Negatives (FN) are positive samples misclassified as negative.
Precision measures the proportion of correctly identified positive samples among all predicted positives (Equation 5), reflecting the model’s accuracy in positive classification. Recall quantifies the proportion of actual positives correctly detected (Equation 6), indicating the model’s ability to identify positive instances. The F1-score, the harmonic mean of precision and recall (Equation 7), provides a balanced assessment, particularly under class imbalance. The ROC curve visualizes classification performance by plotting the True Positive Rate (TPR) against the False Positive Rate (FPR) across varying thresholds, while the Area Under the Curve (AUC) quantifies discriminative capability. An AUC closer to 1 indicates stronger predictive power, with values above 0.9 generally considered excellent.
2.4 Research framework
This study investigates flash flood hazards on the Qinghai–Tibet Plateau by integrating historical disaster records with multi-source environmental data. Flash flood events from 1950 to 2023 were systematically compiled, and a comprehensive set of disaster-inducing factors—including geographical, hydrological, and meteorological variables—was selected based on domestic and international literature. These factors were standardized and resampled to a uniform spatial resolution of 500 m to construct an explanatory variable database. A LR model was employed to quantitatively analyze the relationship between each factor and the probability of flash flood occurrence. Using the ArcGIS platform, disaster and non-disaster points were randomly generated in a 1:2 ratio and divided into training and validation sets (80% and 20%, respectively). Specifically, these points were generated by random sampling within the study area mask but outside a 5-km buffer zone surrounding all known flood events. This constraint effectively mitigates potential label leakage and spatial autocorrelation, thereby strengthening the methodological rigor of our analysis. Model performance was rigorously evaluated using multiple metrics, including accuracy, precision, recall, F1-score, and ROC curves. Based on the results, a 500 m-resolution sensitivity classification map of flash flood disasters was produced, and potential high-risk areas were identified. These findings provide a scientific basis for flash flood risk assessment, disaster prevention, and mitigation strategies on the Qinghai–Tibet Plateau. The overall technical framework is illustrated in Figure 3.
FIGURE 3

Technical roadmap.
3 Flood sensitivity assessment and validation
3.1 Model parameter selection and accuracy verification
In model construction and parameter optimization, a LR with L2 regularization (penalty = 'l2′) was employed to control model complexity, effectively reducing overfitting and enhancing generalization. The regularization strength parameter C was set to 1, balancing model stability and goodness of fit. The LBFGS (Limited-memory Broyden–Fletcher–Goldfarb–Shanno) solver was chosen for optimization due to its suitability for small-to-medium-sized datasets, offering efficient convergence and numerical stability under limited memory conditions. The maximum number of iterations was set to 1000 (max_iter = 1000) to ensure stable convergence in the high-dimensional feature space.
Model performance, summarized in Figure 3, demonstrates strong predictive capability. The test set accuracy reached 78%, indicating robust overall classification. Precision was 77%, reflecting reliable identification of flash flood-prone areas, while recall was 79%, indicating effective capture of positive events with minimal false negatives. The F1-score of 78% highlights a balanced performance between precision and recall. Additionally, the AUC was 0.87, confirming excellent discriminative ability across different thresholds. This indicates the model can effectively distinguish between flash flood and non-flash flood scenarios, meeting the requirements for disaster susceptibility assessment in the complex alpine environment of the Qinghai-Tibet Plateau. The ROC curve and confusion matrix are presented in Figure 4.
FIGURE 4
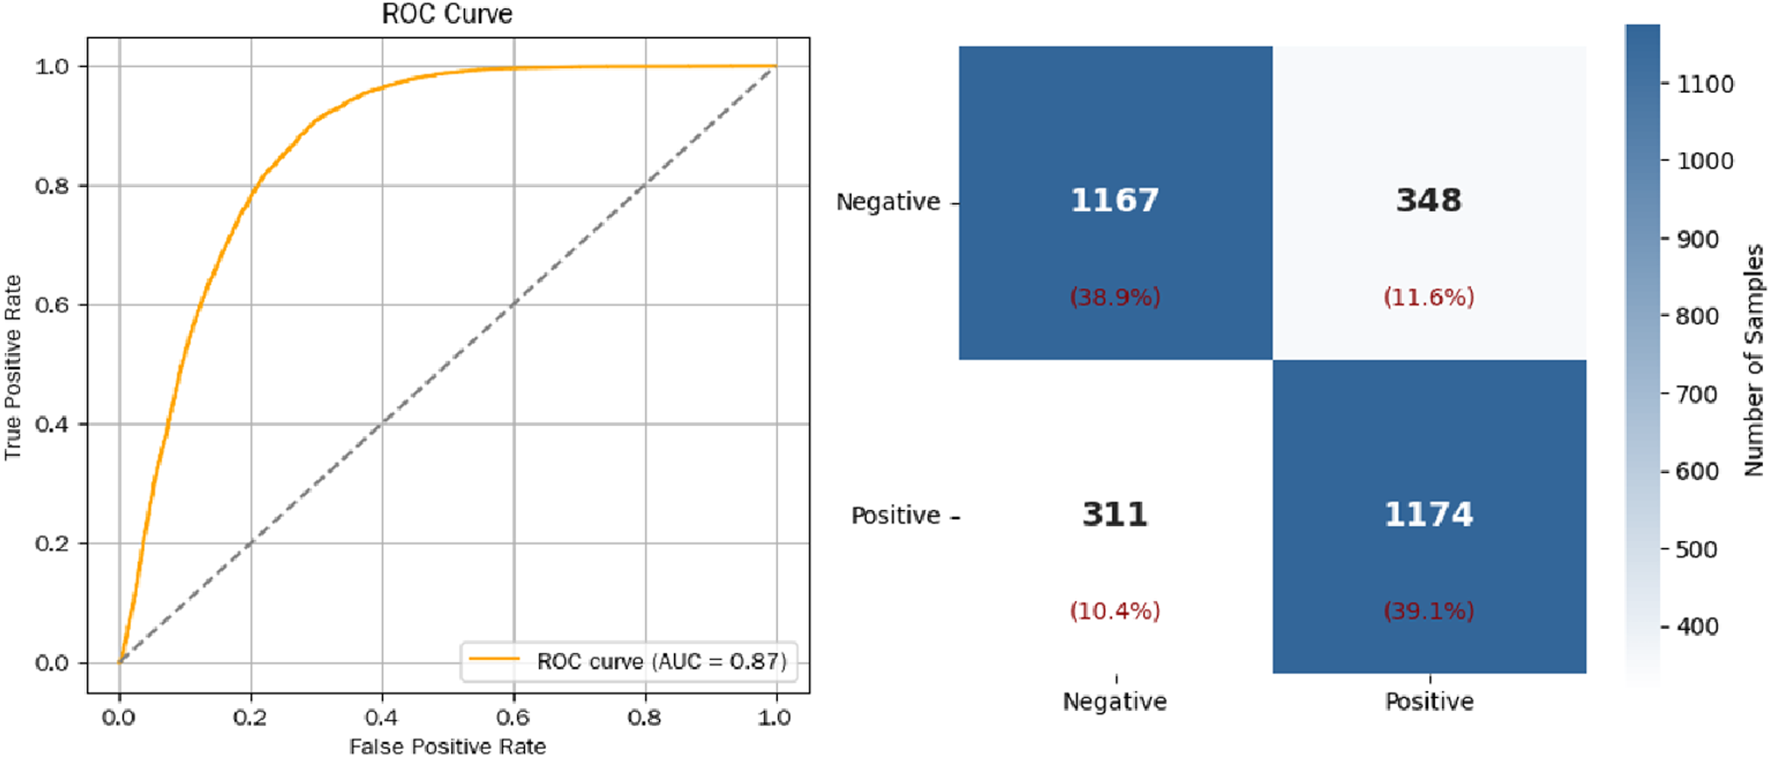
Roc curve and confusion matrix.
3.2 Flash flood sensitivity assessment
Using the logistic regression model combined with GIS spatial analysis, twelve flood-inducing factors were systematically evaluated to assess flood sensitivity across the Qinghai-Tibet Plateau, resulting in a 500 m resolution flood sensitivity map. Model output probabilities were reclassified into five susceptibility levels at 0.2 intervals: very low (P ≤ 0.2), low (0.2 < P ≤ 0.4), moderate (0.4 < P ≤ 0.6), high (0.6 < P ≤ 0.8), and very high (0.8 < P ≤ 1), enabling quantitative and hierarchical characterization of flood sensitivity in the study area. As shown in Figure 5, most of the plateau exhibits low flood sensitivity. Specifically, very low, low, moderate, high, and very high susceptibility levels account for 64.4%, 20.78%, 9.74%, 3.53%, and 1.55% of the total mountainous area, respectively.
FIGURE 5
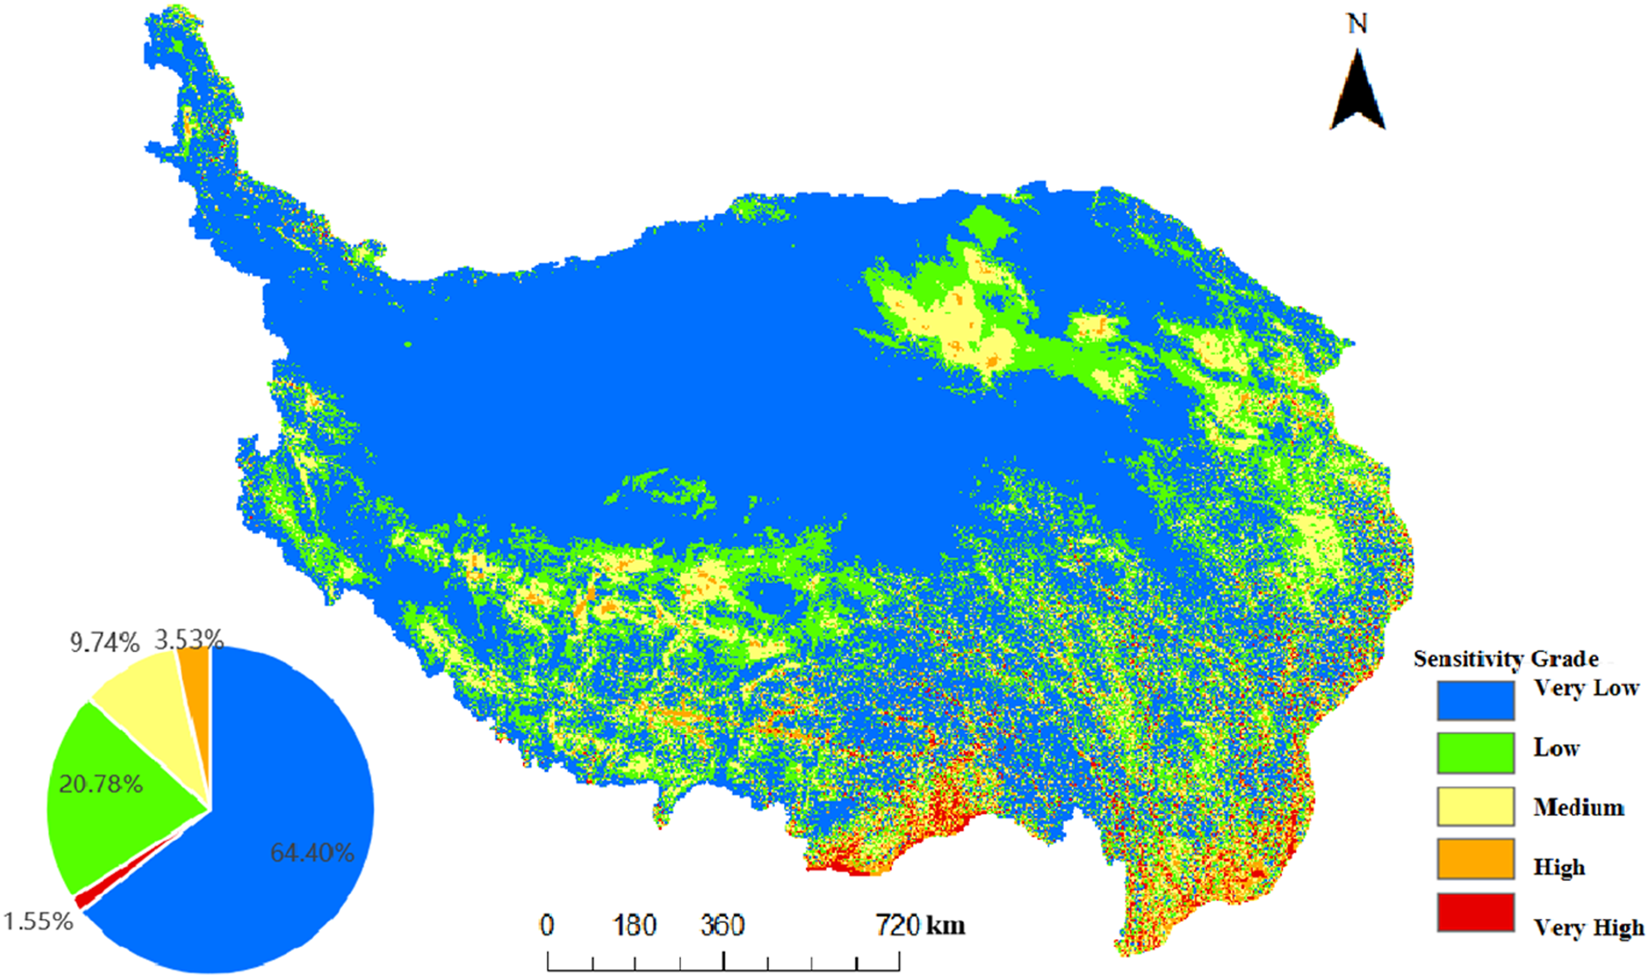
Flash flood Disaster Susceptibility Classification Map of the Qinghai-Tibet Plateau.
Spatially, regions such as the Kunlun Mountains, Tanggula Mountains, and northern Tibetan Plateau display very low flash flood probability, largely due to high-elevation topography, hydrological characteristics of river source areas, and limited surface runoff convergence. In contrast, southern and eastern regions—including the Southern Tibetan Valleys, Hengduan Mountains, Huangshui River Valley, and Datong River Basin—exhibit higher flood sensitivity. These areas lie within the transitional zone between China’s first and second topographic steps, characterized by significant topographic relief. They are also strongly influenced by the Indian Ocean southwest monsoon during summer, leading to concentrated and intense precipitation, which rapidly generates surface runoff and increases flash flood risk. The Hengduan Mountains, with steep river valleys and rapid water flow, are particularly prone to flash floods following heavy rainfall. The Huangshui River Valley and Datong River Basin experience intensive human activity and land use changes, which alter surface cover and further amplify runoff and flood susceptibility. Overall, the interaction of natural topography, climatic factors, hydrology, and anthropogenic influences collectively intensifies the suddenness and severity of flash flood events in these high-risk regions of the Qinghai-Tibet Plateau.
The classification standard in this study was determined based on two comprehensive considerations:First, it refers to existing research results on flood disasters on the Qinghai-Tibet Plateau. Specifically, it draws on the “probability-based susceptibility classification method” in the Technical Guidelines for Flash Flood Disaster Risk Assessment on the Qinghai-Tibet Plateau (Northwest Institute of Eco-Environment and Resources, Chinese Academy of Sciences, 2022). This guideline, developed considering the alpine climate and sparse data characteristics of the Qinghai-Tibet Plateau, recommends a 5-level classification system with 0.2 intervals, which has been verified for applicability in sub-regional studies such as southeastern Tibet and the Hengduan Mountains. Second, it is based on the adaptability verification of the data in this study. By analyzing the correspondence between 1,276 historical flood points (1950–2023) on the Qinghai-Tibet Plateau and the probability values output by the model, it was found that 82.3% of the historical flood points were concentrated in areas with probability values ≥0.4, and 59.7% of major flood events were distributed in areas with probability values ≥ 0.6. This indicates that the classification can effectively distinguish “low-risk - moderate-risk - high-risk” areas, avoiding the omission of high-risk areas or misjudgment of low-risk areas due to unreasonable classification intervals.
The classification of different susceptibility levels provides clear decision-making guidance for the precise prevention and control of regional flood disasters:Very low susceptibility areas have a flood occurrence probability of less than 20% and no historical records of major floods. Only basic meteorological monitoring stations need to be retained to reduce redundant disaster prevention investment. Low susceptibility areas require the establishment of a seasonal monitoring mechanism to strengthen the observation of precipitation and river water levels during the rainy season. Moderate susceptibility areas need to be equipped with regular early warning equipment and supporting simple flood control projects. High susceptibility areas should establish a closed-loop “monitoring - early warning - response” system, set up multi-factor automatic monitoring stations, and formulate targeted evacuation plans. Very high susceptibility areas, as core flood control zones, require increased density of monitoring stations, promotion of high-standard flood control projects, and inclusion in the national key flood risk management list to enhance regional disaster resilience.
3.3 Interpretability analysis using geographical detector
3.3.1 Single-factor q-value analysis
Geographical Detector analysis was conducted on the 12 selected disaster-inducing factors to obtain the q-values representing each factor’s explanatory power for the spatial variability of flood disasters (Figure 6). The results indicate that annual precipitation, with the highest q-value, is the most critical single factor influencing flood disasters on the Qinghai-Tibet Plateau. This highlights the dominant role of regional climatic characteristics in the flood formation process by directly providing the water source foundation, and profoundly reflects the core mechanism of climate-driven hydrological disasters. Distance to rivers and Topographic Wetness Index (TWI) also exhibited high explanatory power, further demonstrating the importance of hydrological factors in flood disaster formation: distance to rivers affects confluence paths and efficiency, while TWI characterizes surface saturation status and runoff retention capacity. Together, these two factors regulate the convergence process of surface runoff, thereby significantly constraining the spatial distribution pattern of flood disasters. In addition, topographic factors such as elevation and plan curvature also had relatively high q-values, providing quantitative evidence that topography influences flood risk by regulating confluence velocity and direction, and revealing the fundamental regulatory role of geomorphic conditions in flood formation. In contrast, factors such as lithology, temperature, and land use had relatively low q-values, indicating their limited direct contribution to the spatial variability of flood disasters. These factors may play a role in more indirect or complex interactive processes.
FIGURE 6
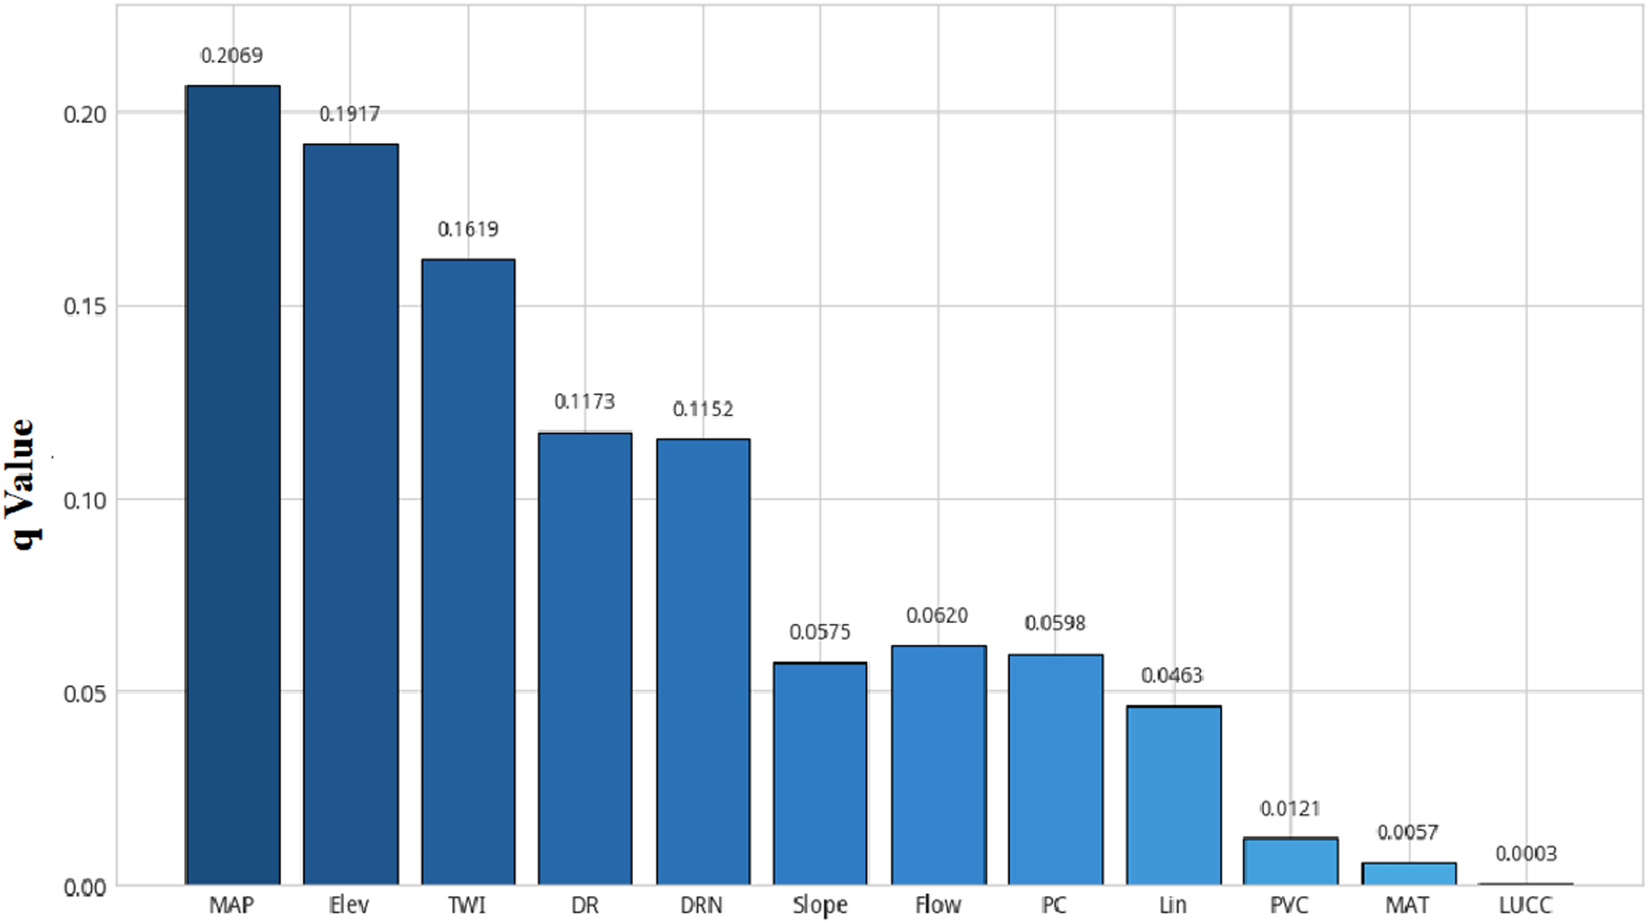
Single-Factor q-Value Results of Geographical Detector.
3.3.2 Interaction factor analysis
Results from the interaction analysis using Geographical Detector (Figure 7) indicate that the formation of flood disasters on the Qinghai-Tibet Plateau is significantly influenced by the synergistic enhancement effect of multiple factors. The explanatory power (q-value) of all interaction combinations is higher than that of individual factors, confirming that the flood occurrence mechanism in this region is highly complex and coupled, resulting from the combined action of topographic, climatic, and hydrological elements. Among all interaction combinations, the interaction between precipitation (X5) and distance to rivers (X10) is the most prominent. Both factors already exhibited strong explanatory power in the single-factor analysis, and their q-value increased significantly after interaction. Their synergistic mechanism can be explained as follows: intense precipitation provides sufficient water input for flood occurrence, while areas adjacent to rivers—characterized by large hydraulic gradients, short confluence paths, and high erosion susceptibility—are more prone to rapid runoff convergence and sharp water level rises after extreme rainfall, thereby significantly increasing flood risk. This mechanism is particularly typical in high-risk areas such as the Southern Tibetan Valleys and Hengduan Mountains. These regions have dense river networks and are controlled by the southwest monsoon in summer, leading to high-intensity and concentrated precipitation—factors that collectively result in frequent flood events.
FIGURE 7
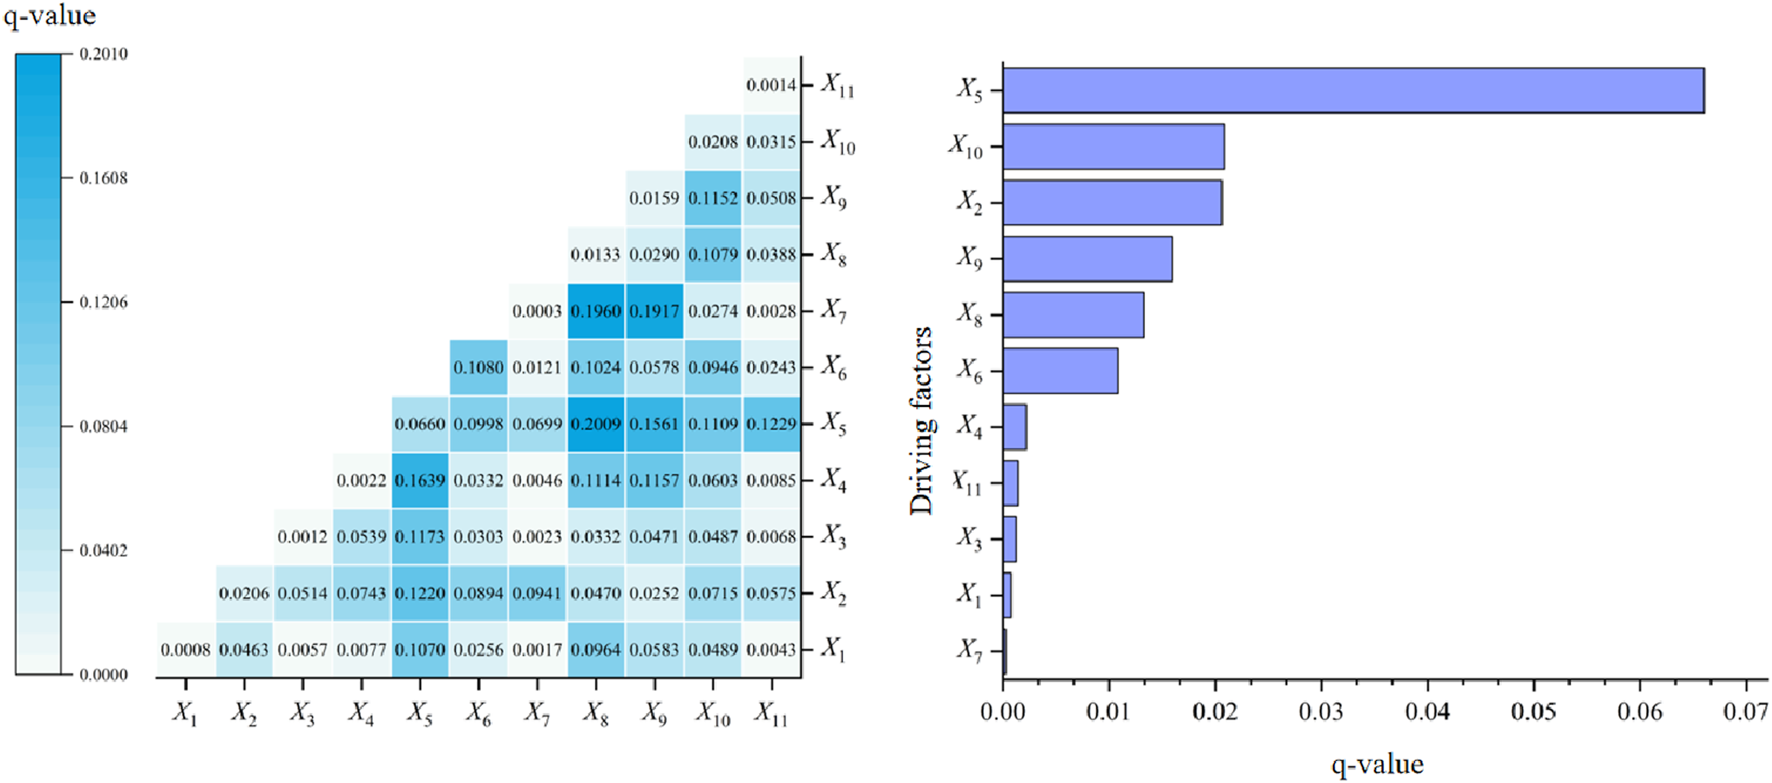
Interaction factor analysis map.
Furthermore, the interaction between elevation and precipitation further reveals the critical regulatory mechanism of topography on precipitation phase and runoff generation-confluence processes. In the mountain-plateau transition zone at elevations of 2000–4,000 m, precipitation is dominated by rainfall. Combined with significant topographic relief, this leads to rapid runoff generation, short confluence time, and high flood risk. In contrast, in high-elevation areas above 4,000 m, snow accumulates in winter, and the superposition of summer snowmelt and intense rainfall events significantly increases the complexity of runoff formation and the probability of flood occurrence. This mechanism reasonably explains the spatial distribution characteristic where areas with moderate or higher susceptibility levels account for over 50% of the mid-to-high elevation regions, highlighting the controlling effect of elevation differentiation on the Flood sensitivity pattern. On the other hand, the interaction effect between slope and distance to roads reflects the synergistic impact of human activities and natural topographic factors: in steep slope areas with a slope greater than 25°, road construction alters local hydrological processes, intensifies surface runoff convergence and soil erosion, resulting in high susceptibility levels accounting for 20% of this interaction area—significantly higher than the contribution of either single factor. This also explains why Flood sensitivity is significantly enhanced in steep, road-dense regions such as the Hengduan Mountains. In summary, the formation of flood disasters on the Qinghai-Tibet Plateau is the result of the synergistic action of multi-dimensional factors, including precipitation, topography, river proximity, and human activities. Interaction effects generally exhibit nonlinear enhancement characteristics, which improve the explanatory power for the spatial variability of floods.
3.4 Interpretability analysis of key disaster-inducing factors
Flash flood susceptibility on the Qinghai-Tibet Plateau is governed by a combination of climatic, topographic, hydrological, and anthropogenic factors, which interact nonlinearly to shape spatial variability (Figure 8). Annual average precipitation is the primary natural driver, with susceptibility increasing sharply above 800 mm due to soil saturation, reduced shear strength, and runoff erosion, while extreme precipitation (>1200 mm) triggers large-scale cascading disasters (Figure 8a). Human disturbances, proxied by proximity to roads, exacerbate risk in steep terrain, with high susceptibility concentrated within 5 km of roads and diminishing with distance (Figure 8b). Elevation influences susceptibility nonlinearly: mid-to-high elevations (2000–6,000 m) exhibit the most complex patterns due to climate-topography interactions and freeze-thaw effects, whereas ultra-high areas (>6,000 m) generally experience lower flood frequency (Figure 8c). Rivers strongly modulate flash flood risk through bank erosion and slope instability, with susceptibility declining markedly beyond 200 km from river channels (Figure 8d).
FIGURE 8

Impact degree of different factors (a) Mean annual precipitation. (b) Distance to road. (c) Elevation. (d) Distance to river. (e) Topographic Wetness Index (TWI). (f) Slope.
TWI reflects terrain moisture retention, with high TWI zones (≥12) serving as core high-susceptibility areas, particularly when coupled with intense precipitation and mid-elevation terrain (Figure 8e). Slope further modulates risk: gentle slopes concentrate higher susceptibility, moderate slopes benefit from partial vegetation stabilization, and steep slopes (>30°) exhibit lower susceptibility due to rapid runoff dispersion (Figure 8f). Collectively, these factors interact synergistically, producing nonlinear enhancement effects that control the distribution and intensity of flash flood hazards across the plateau.
Overall, these factors interact synergistically, producing nonlinear enhancement effects that determine the spatial distribution and intensity of flash flood hazards. Flash flood susceptibility is not controlled by a single variable but emerges from the combined influence of climate, geomorphology, hydrology, and human disturbance. High-risk areas are concentrated in mid-elevation valleys, river-adjacent zones, and high-TWI terrains, where precipitation, topography, and human activities collectively amplify flash flood potential. These results provide a mechanistic understanding of flash flood hazard patterns across the plateau, offering a scientific basis for targeted flash flood risk assessment and mitigation strategies.
4 Conclusion
This study produced a 500 m-resolution flash flood sensitivity map of the Qinghai-Tibet Plateau using a logistic regression model that integrated multi-source disaster-inducing factors and historical flash flood data. The model exhibited robust performance, with accuracy, precision, recall, and F1-score above 77% and an AUC of 0.87, confirming its reliability for complex plateau environments. Geographical Detector analysis identified annual precipitation (q = 0.2009), elevation (q = 0.1917), distance to rivers (q = 0.1173), and Topographic Wetness Index (q = 0.1619) as primary drivers, with the interaction between precipitation and river proximity emphasizing the role of hydrodynamic forces and runoff convergence. High and very high susceptibility areas (∼5.08%) are concentrated in the Southern Tibetan Valleys and Hengduan Mountains, whereas low and moderate zones dominate the Northern Tibetan Plateau and Kunlun Mountains. The spatial correspondence with historical disaster points further validates the model’s predictions.
Limitations include potential underestimation in sparsely populated areas (Qiu et al., 2025) with limited records. Future research should leverage higher-resolution remote sensing, multi-source data fusion, and physics-informed deep learning models (e.g., PINNs), alongside coupled precipitation-runoff-disaster modeling and uncertainty quantification, to enhance predictive accuracy and support decision-making under extreme climate scenarios. Our proposed pathway is threefold: First, to integrate multi-source inventories by combining official agency data with media and crowdsourced records under a unified framework. Second, to leverage satellite remote sensing (e.g., optical/radar flood extents, soil moisture, and high-resolution precipitation) for independent event verification and bias characterization. Third, to conduct region-specific validation via targeted field checks or expert review, which will allow for the refinement of model thresholds and ultimately enhance the reliability of susceptibility maps.
5 Disscussion
The results of the flood disaster susceptibility study on the Qinghai-Tibet Plateau obtained by coupling the logistic regression model with the geographical detector method in this study are highly consistent with and complement existing regional research results. In terms of key disaster-inducing factors, annual precipitation (q = 0.2009) and elevation (q = 0.1917) were identified as the primary driving factors, which is consistent with the conclusion in the Technical Guidelines for Flash Flood Disaster Risk Assessment on the Qinghai-Tibet Plateau (Northwest Institute of Eco-Environment and Resources, Chinese Academy of Sciences, 2022) that “precipitation concentration and topographic relief are the core controlling factors of floods on the plateau”. Relying on the 1950–2023 historical flood data of the entire plateau, this study further quantitatively verified that 82.3% of historical flood points are concentrated in regions with annual precipitation ≥400 mm and elevation <4,000 m, supplementing the factor importance ranking at the entire plateau scale. In terms of spatial distribution, the identified high to very high susceptibility areas (accounting for 5.08%) in the southern Tibetan river valleys and the Hengduan Mountains are consistent with the conclusion in the Qinghai-Tibet Plateau Disaster Risk Bulletin 2023 released by the National Tibetan Plateau Scientific Data Center that “the flood frequency in the middle reaches of the Yarlung Zangbo River valley and the Nujiang Gorge section is 6–8 times that of the northern Tibetan Plateau”. At the same time, the 500 m resolution mapping refined the spatial scope of high-risk areas, clarifying that the very high susceptibility areas in the Hengduan Mountains are concentrated in the river valley terraces at an elevation of 2,500–3,500 m, providing precise guidance for the layout of monitoring stations.
Regarding the research limitations and future directions, the “multi-source remote sensing + folk knowledge” supplementary scheme proposed in this study can be cross-validated with the 2021 study conducted by the Institute of Tibetan Plateau Research, Chinese Academy of Sciences in the Ngari region. That study showed that the matching degree between the flood range inverted by Sentinel-1 radar data and the herders’ oral historical records reached 83%, confirming the effectiveness of this scheme in making up for the deficiency of sparse stations in low-data-density regions such as the Ngari region and the Hoh Xil core area. Meanwhile, considering that the Sixth Assessment Report of the Intergovernmental Panel on Climate Change (IPCC) points out that the warming rate of the Qinghai-Tibet Plateau is twice the global average, the intensity of summer precipitation and the increment of glacial meltwater may change the existing susceptibility pattern. In the future, combined with CMIP6 climate model data, risk predictions under different emission scenarios can be carried out to further improve the forward-looking nature and application value of the research and provide support for long-term disaster prevention planning in the region.
Statements
Data availability statement
The raw data supporting the conclusions of this article will be made available by the authors, without undue reservation.
Author contributions
HL: Writing – review and editing, Validation, Visualization, Writing – original draft. ZC: Writing – original draft, Methodology, Formal analysis, Writing – review and editing. XZ: Writing – review and editing, Methodology, Supervision. JW: Data curation, Formal Analysis, Writing – review and editing. JH: Visualization, Writing – original draft. PC: Software, Writing – review and editing. YW: Investigation, Writing – review and editing. QW: Data curation, Writing – review and editing. MM: Conceptualization, Supervision, Writing – review and editing.
Funding
The author(s) declare that financial support was received for the research and/or publication of this article. This research was supported by National Natural Science Foundation of China (42201093, 42371086, 52239006), China Academy of Water Resources and Hydropower Research’s “Five Talents” Project (WH0145B062022), and Humanity and Social Science Youth foundation of Ministry of Education of China (24YJCZH308).
Conflict of interest
The authors declare that the research was conducted in the absence of any commercial or financial relationships that could be construed as a potential conflict of interest.
Generative AI statement
The author(s) declare that no Generative AI was used in the creation of this manuscript.
Any alternative text (alt text) provided alongside figures in this article has been generated by Frontiers with the support of artificial intelligence and reasonable efforts have been made to ensure accuracy, including review by the authors wherever possible. If you identify any issues, please contact us.
Publisher’s note
All claims expressed in this article are solely those of the authors and do not necessarily represent those of their affiliated organizations, or those of the publisher, the editors and the reviewers. Any product that may be evaluated in this article, or claim that may be made by its manufacturer, is not guaranteed or endorsed by the publisher.
References
1
Burton I. Kates R. W. White G. F. (1993). The environment as hazard. 2nd ed.New York, NY: Guilford Press.
2
Chang Z. L. Cui Y. Gou X. H. Li H. J. Zhang Y. Wang L. M. et al (2021). Risk impact zoning of rainstorm-induced mountain torrents in Shizuishan city based on FloodArea. J. Nat. Disasters30 (4), 191–202. 10.13577/j.jnd.2021.0420
3
Chen Z. Ma X. X. Zhang X. L. (2018). Risk assessment of mountain torrent disaster in small watershed based on PCA and AHP. Water Resour. Power36 (11), 56–59. 10.13622/j.cnki.cn42-1800/tv.1671-3354.2018.11.015
4
Chinh L. Jason M. V. (2018). A flood risk assessment of Quang Nam, Vietnam using spatial multicriteria decision analysis. Water10(4):461–461. 10.3390/w10040461
5
Fang X. Q. Wang K. Ren L. L. Wu X. J. Liu Y. Zeng C. et al (2017). Risk assessment and zoning of mountain torrent disasters in Jiangxi province based on GIS. J. Catastrophology32 (1), 111–116. 10.3969/j.issn.1000-811X.2017.01.020
6
Hassan W. Linlin L. Aqil T. Li Q. Baqa M. F. Xing J. et al (2021). Flash flood susceptibility assessment and zonation using an integrating analytic hierarchy process and frequency ratio model for the chitral district, Khyber Pakhtunkhwa, Pakistan. Water13(12):1650–1650. 10.3390/w13121650
7
Liu X. R. Kang J. Wang Y. Li H. Zhang Q. Zhao Y. N. et al (2019). Risk zoning of mountain torrent disasters in Chongqing based on GIS and FloodArea hydrodynamic model. Bull. Soil Water Conservation39 (2), 206–211+325. 10.13961/j.cnki.stbctb.2019.02.037
8
Liu Z. Qiu H. Zhu Y. Wenchao H. Bingfeng Ye Yingdong W. et al (2024). Increasing irrigation-triggered landslide activity caused by intensive farming in deserts on three continents. Int. J. Appl. Earth Observation Geoinformation134, 104242. 10.1016/j.jag.2024.104242
9
Luo R. H. Huang J. L. Tang Z. Z. (2018). Risk zoning of mountain torrent disaster in small watershed of mountainous area based on AHP and GIS. J. Catastrophology33 (2), 64–69. 10.3969/j.issn.1000-811X.2018.02.012
10
Peng J. Q. Zhang J. M. (2022). Urban flooding risk assessment based on GIS-game theory combination weight: a case study of Zhengzhou city. Int. J. Disaster Risk Reduct.77, 103080. 10.1016/j.ijdrr.2022.103080
11
Qiu H. Yijun Li Zhu Y. Ye B. Yang D. Liu Ya et al (2025). Do post-failure landslides become stable?CATENA249, 108699. 10.1016/j.catena.2025.108699
12
Rubio J. C. Yu S. I. Kim Y. H. Jeong S. M. (2020). Index-based flood risk assessment for Metro Manila. Water Supply20 (3), 851–859. 10.2166/ws.2020.010
13
Thouret J.-C. Enjolras G. Martelli K. Santoni O. Luque J. A. Nagata M. et al (2013). Combining criteria for delineating lahar- and flash-flood-prone hazard and risk zones for the city of Arequipa, Peru. Nat. Hazards Earth Syst. Sci.13 (2), 339–360. 10.5194/nhess-13-339-2013
14
Wang Y. (2018). Research on risk zoning of mountain flood disasters in the loess Plateau region of Gansu based on GIS and comprehensive weighting method. China Rural Water Hydropower (8), 118–122. 10.26914/c.cnkihy.2018.024448
15
Wang Y. Q. Xu Y. P. Li Q. Z. Chang Y. H. (2010). Flood risk zoning of Jiangsu Province in the Taihu Lake basin. J. Nat. Disasters19 (4), 195–200. 10.13577/j.jnd.2010.0432
16
Wang S. Wu R. Xie W. S. Lu Y. Y. (2018). “Research on mountain torrent risk zoning in the Dabie Mountain area based on FloodArea,” in Proceedings of the 35th annual meeting of the Chinese meteorological Society-S10: new technologies for hydrometeorological disaster formation mechanism, forecasting, early warning, and risk assessment (Hefei, China: Anhui Climate Center), 179–180.
17
Wang X. X. Liu Y. W. Fu J. W. (2021). Risk assessment and zoning of mountain torrent disasters in Jiangxi province. Water Resour. Power39 (10), 85–88. 10.13622/j.cnki.cn42-1800/tv.1671-3354.2021.10.021
18
Wang J. Fang H. Liu K. Yue Y. Wang M. Miao X. (2025). Projecting changes in rainfall-induced landslide susceptibility across China under climate change. European Geosciences Union [Preprint]. 10.5194/egusphere-2025-3834
19
Ward P. J. Marfai M. A. Yulianto F. Hizbaron D. R. Aerts J. C. J. H. (2011). Coastal inundation and damage exposure estimation: a case study for Jakarta. Nat. Hazards56 (3), 899–916. 10.1007/s11069-010-9599-1
20
Wu B. Zhang S. (2023). Risk zoning of mountain torrents in small watersheds of Shilou county based on GIS. Northeast Water Resour. Hydropower41 (8), 47–50+72. 10.14124/j.cnki.dbslsd22-1097.2023.08.012
21
Wu X. J. Fang X. Q. Ren L. L. Liu Y. W. Fu J. W. Zeng C. (2018). Risk assessment of flash flood disaster based on random forest: a case study of Jiangxi province. Res. Soil Water Conservation25 (3), 142–149. 10.13869/j.cnki.rswc.2018.03.022
22
Yang G. Qiu H. Wang N. Yang D. Liu Ya (2025). Tracking 35-year dynamics of retrogressive thaw slumps across permafrost regions of the Tibetan Plateau. Remote Sens. Environ.325, 114786. 10.1016/j.rse.2025.114786
23
Yuan F. P. Mao Y. Q. Fu W. J. (2023). Research on risk zoning of mountain torrent disasters using kernel density analysis method. Jiangxi Cehui (3), 30–32. 10.19580/j.cnki.1674-0955.2023.03.008
24
Zeng Z. P. Wang J. W. Zou S. J. (2020). Flood disaster susceptibility assessment of mountainous cities based on GIS and logistic regression analysis: a case study of Ji'an city, Jiangxi province. Resour. Environ. Yangtze Basin, 29(09), 2090–2100. 10.11870/cjlyzyyhj202009021
25
Zhang Q. Z. Wang T. T. Lu Y. Chen Y. J. Li M. Zhao H. B. (2019). Research on mountain torrent risk zoning in Chongqing based on AHP-GIS. Resour. Environ. Yangtze Basin28 (1), 91–102. 10.11870/cjlyzyyhj201901010
26
Zhu Y. Qiu H. Liu Z. Ye B. Tang B. Yijun Li et al (2024). Rainfall and water level fluctuations dominated the landslide deformation at Baihetan reservoir, China. J. Hydrology642, 131871. 10.1016/j.jhydrol.2024.131871
Summary
Keywords
flash flood sensitivity, impact factor, logistic regression, geographical detector, Tibetan Plateau
Citation
Liu H, Chen Z, Zhang X, Wang J, Hu J, Chen P, Wang Y, Wang Q and Ma M (2025) Explainable flash flood susceptibility mapping on the Tibetan Plateau. Front. Earth Sci. 13:1695343. doi: 10.3389/feart.2025.1695343
Received
29 August 2025
Revised
06 October 2025
Accepted
15 October 2025
Published
06 November 2025
Volume
13 - 2025
Edited by
Haijun Qiu, Northwest University, China
Reviewed by
Lina Pang, Sichuan University, China
Jia Wang, Tianjin University of Technology, China
Updates
Copyright
© 2025 Liu, Chen, Zhang, Wang, Hu, Chen, Wang, Wang and Ma.
This is an open-access article distributed under the terms of the Creative Commons Attribution License (CC BY). The use, distribution or reproduction in other forums is permitted, provided the original author(s) and the copyright owner(s) are credited and that the original publication in this journal is cited, in accordance with accepted academic practice. No use, distribution or reproduction is permitted which does not comply with these terms.
*Correspondence: Xiaolei Zhang, zhangxl@iwhr.com
†These authors share first authorship
Disclaimer
All claims expressed in this article are solely those of the authors and do not necessarily represent those of their affiliated organizations, or those of the publisher, the editors and the reviewers. Any product that may be evaluated in this article or claim that may be made by its manufacturer is not guaranteed or endorsed by the publisher.