 Pan Zhang
 Zilong Ren
 Fengjiao Zhang
 Wenhao Wang
 Lijie Cui
 Cheng Feng
 Weibiao Xie
- 1Petroleum Institute, China University of Petroleum-Beijing at Karamay, Karamay, China
- 2Sinopec Matrix Corporation, Qingdao, China
Total Organic Carbon (TOC) is a fundamental parameter for evaluating source rock quality, yet the strong heterogeneity of the Qiongzhusi Formation shale reservoir in the Sichuan Basin severely limits the applicability of conventional TOC prediction models. To address this challenge, this study proposes a novel TOC prediction algorithm (INN-BIC) that integrates an Interpretable Neural Network (INN) with the Bayesian Information Criterion (BIC). By employing feature decoupling and a dynamic polynomial degree selection mechanism, the method enhances both prediction accuracy and model interpretability in complex geological settings. The model successfully quantifies the contribution of well-log parameters such as uranium content, natural gamma ray, and deep/shallow resistivity to TOC, and accurately captures TOC variations in stratigraphic transition zones. Experimental results demonstrate that the INN-BIC model significantly outperforms traditional methods, improving the R2 score by 79% and 25% compared to Backpropagation Neural Network (BPNN) and Support Vector Machine (SVM) models, respectively, and achieving a 65% enhancement over the original INN model. This verifies the model's effectiveness and reliability in strongly heterogeneous environments, supporting its practical application in shale gas sweet spot evaluation and efficient development.
1 Introduction
Total Organic Carbon (TOC) is a fundamental parameter for assessing the quality and hydrocarbon generation potential of source rocks, and its accurate prediction is crucial for the identification of shale gas sweet spots. The Early Cambrian Qiongzhusi Formation in the Sichuan Basin represents a significant target for shale gas exploration in China. However, its strong reservoir heterogeneity poses significant challenges for the accurate prediction of TOC content. Although core analysis offers high accuracy, its high cost and discontinuous nature make it inadequate for comprehensive exploration needs. Consequently, developing a high-precision and interpretable TOC prediction method adapted to strong heterogeneity is of paramount theoretical and practical value for shale gas sweet spot prediction and efficient development.
Currently, the prediction methods for shale reservoir TOC developed by scholars at home and abroad can be classified into three main research systems: traditional prediction methods based on empirical formulas, regression methods based on multivariate statistics, and intelligent algorithms based on neural networks (Table 1) (Aziz et al., 2020). Firstly, the traditional prediction methods based on empirical formulas primarily establish empirical relationships between conventional logging parameters and TOC using formation physical properties. The pioneering work began with the Schmoker method proposed by Schmoker (1979), which used regression analysis of density logs to estimate organic matter content and was subsequently refined (Schmoker, 1981; Schmoker and Hester, 1983). Subsequently, Passey et al. (1990) introduced the ΔLogR method utilizing resistivity and porosity logs, which has become a classic technique for TOC prediction due to its operational simplicity and strong applicability. In recent years, numerous scholars have optimized and improved the ΔLogR method for its application in various basins worldwide, primarily involving the use of variable slopes, baseline adjustments, and replacing the maturity parameter LOM with thermal indicators such as Tmax or Ro (Li et al., 2020; Wood, 2020; Zheng et al., 2021; Mulashani et al., 2021; Zhang et al., 2022). Secondly, the multiple linear regression methods employ trial-and-error to select logging parameters significantly correlated with TOC and simulate the mathematical relationship between multiple logging parameters and TOC through linear regression. By considering the influence of more factors, their prediction accuracy is significantly improved compared to empirical formula methods (Zhang F et al., 2023; Hui et al., 2023; Feng et al., 2023; Zhang H et al., 2023; Zhang et al., 2025). For instance, Zhang et al. (2025) demonstrated that a multiple linear regression prediction model could effectively predict TOC content in marine-continental transitional shales, achieving accuracy comparable to the BP model, through comparative studies with other models. The third category includes artificial intelligence methods, such as neural network algorithms, which build complex nonlinear models that better capture the underlying relationships in the data and improve prediction accuracy. These methods have demonstrated superior performance, especially in handling large-scale and high-dimensional data, effectively enhancing prediction precision (Nyakilla et al., 2022; Gordon et al., 2022; Liu et al., 2023; Lai et al., 2024; Ehsan et al., 2025a). For example, Lai et al. (2024) used principal component analysis to preprocess well log and TOC data, establishing a TOC prediction model based on BP Artificial Neural Network (BPANN) and Gradient Boosting Decision Trees (XGBoost). Their research showed that the XGBoost model offers higher calculation accuracy.
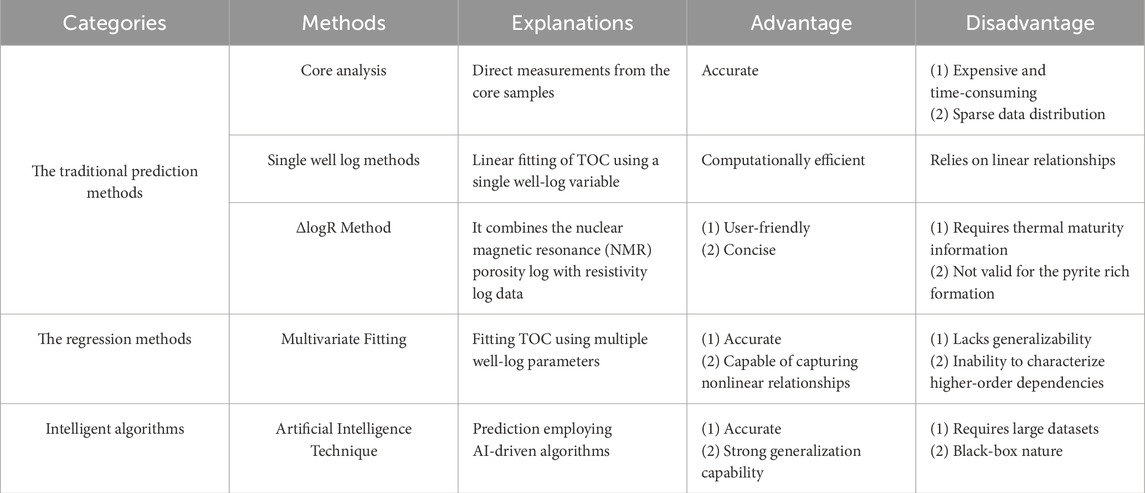
Table 1. Summary of the TOC prediction methods.
However, existing TOC prediction methods perform poorly in the strongly heterogeneous shale of the Qiongzhusi Formation, primarily due to the following reasons: (1) Traditional TOC prediction methods, while practical for evaluating homogeneous lithologies and their explicit expressions that visually reflect the relationship between well log parameters and TOC, fail to predict TOC values accurately in layers with abrupt lithological changes, resulting in lower prediction accuracy (Maroufi and Zahmatkesh, 2023). (2) While neural network algorithms offer better prediction performance and adaptability, they require a large amount of measured data as support and suffer from the “black-box effect,” making it difficult to identify the specific mathematical relationships between well log parameters and TOC.
To address the above challenges, this study focuses on the shelf shale of the Qiongzhusi Formation in the Jingyan-Qianwei area of the Sichuan Basin. This study systematically analyzed the geological characteristics, geochemical properties, and heterogeneity distribution of the reservoir. Based on 361 core measurement datasets and well-logging data from five key wells, key logging parameters sensitive to TOC were selected via Pearson correlation analysis. To tackle the dual issues of insufficient accuracy in strongly heterogeneous intervals and the “black-box” nature of neural networks, an Interpretable Neural Network algorithm based on the Bayesian Information Criterion was proposed. The model first decomposes the complex mapping relationship into transparent sub-networks through feature decoupling. Then, a dynamic polynomial order selection mechanism is introduced, which leverages the BIC to automatically determine the optimal polynomial order for each logging parameter, thereby adaptively characterizing their differentiated nonlinear responses within the highly heterogeneous context. This design not only enhances the prediction accuracy for TOC but also ensures model interpretability by generating mathematical expressions that are directly interpretable by geologists. Consequently, the model effectively reveals the contribution mechanisms of well-log parameters and accurately captures TOC variations across stratigraphic transition zones in the shale reservoir.
The remainder of this paper is structured as follows. Section 2 details the geological setting and heterogeneous characteristics of the Qiongzhusi Formation in the study area. Section 3 elaborates on the fundamental principles of the INN-BIC model and its implementation workflow. Section 4 presents the application of the model to key wells and compares its performance against established methods. Section 5 discusses the advantages of the proposed algorithm and suggests directions for future research. Finally, Section 6 summarizes the principal conclusions of this study.
2 The regional overview
2.1 Geological features of the research block
The Jingyan-Qianwei region is located at the southwestern edge of the Sichuan Basin, at the junction of Leshan and Zigong. Structurally, it belongs to the northwest part of the southwestern Sichuan depression and the southwestern wing of the Weiyuan structure, situated in the gentle slope structural zone to the west of the Mianyang-Changning rifting basin. The Qiongzhusi Formation in the research block is buried at depths ranging from 3,400 to 4,000 m. Its evolution is primarily controlled by the combined effects of the Tongwan and Xingkai movements, forming during the peak period of the early Cambrian rifting basin development. The sedimentary thickness exhibits significant spatial variation, with a “thin-thick-thin” trend from west to east. The stratigraphic contact relationship shows that the Qiongzhusi Formation is in parallel unconformable contact with the underlying Maidiping Formation. The overall structural form is gentle, with weak folding deformation and poorly developed fault structures (Wang et al., 2020; Zhao et al., 2022; Bian et al., 2022; Wang et al., 2023; Guo et al., 2023).
In terms of lithology, the Qiongzhusi Formation can be subdivided into three sections and 11 lithological layers, showing rhythmic interlayers of deep-water shelf-type black shale and shallow-water shelf-type silty shale (Figure 1) (Lan and Shen, 2022; Wang et al., 2023). The lower section develops organic-rich black shale with horizontal fine lamination, commonly containing pyrite nodules and dispersed pyrite. The middle to upper part gradually transitions into silty shale interbedded with calcareous lenses. The upper section is dominated by silty shale interspersed with black organic-rich shale. Overall, the formation exhibits a coarsening-upward cyclical feature, reflecting the sedimentary evolution process under a regressive environment (Wang et al., 2020; Zhao et al., 2022).
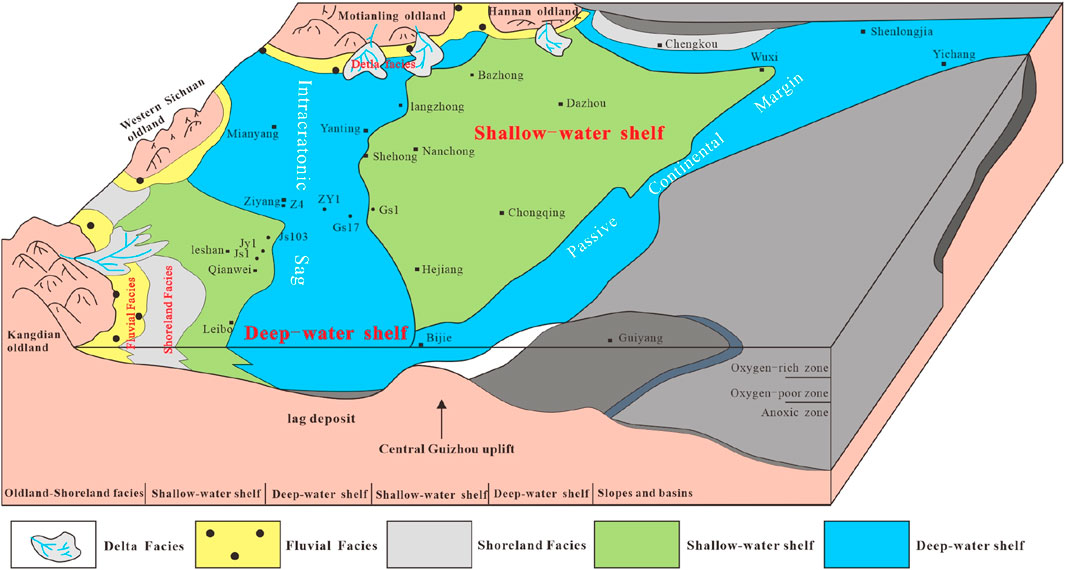
Figure 1. Sedimentary model diagram of Qiongzhusi Formation in Sichuan Basin (Guo et al., 2023).
2.2 Geochemical characteristics of shale
Organic matter abundance, kerogen type, and thermal maturity are the three fundamental geochemical indicators for evaluating the properties of source rocks (Lai et al., 2022; Yan et al., 2025). The organic geochemical analysis of the Qiongzhusi Formation shale reveals its excellent hydrocarbon generation potential. The abundance of organic matter in the rock is typically characterized by TOC, which effectively reflects the hydrocarbon generation potential (Lai et al., 2024; Guo et al., 2023). The TOC content in the research block varies widely (0.01%–3.55%), with an average of 0.49%. The shale in the research block reaches the level of a medium-abundance source rock, with a certain hydrocarbon generation potential (Wang et al., 2024).
Kerogen type analysis (Table 2) shows that the dominant microcomponent of kerogen is the humic group, accounting for an average of 76.11%, followed by the vitrinite group (23.89%), while the exinite and inertinite groups were not detected. Combining the type index (average 58.19) with rock pyrolysis parameters, the kerogen type in the research block is primarily Type II1, indicating that the organic matter mainly comes from the highly degraded products of low-grade aquatic organisms, with excellent hydrocarbon generation potential. The maturity parameters show that the vitrinite reflectance (Ro) ranges from 2.66% to 2.79%, with an average value of 2.72%, indicating that the shale in the Qiongzhusi Formation has entered the overmature stage (Ro > 2.0%). This result suggests that the shale is currently in the dry gas generation window, with its hydrocarbon generation capacity largely depleted, mainly producing dry gas. In this stage of evolution, the gas content in the shale reservoir is mainly controlled by TOC content: on one hand, TOC determines the amount of residual kerogen and methane adsorption capacity; on the other hand, the nanopores formed by the thermal evolution of organic matter provide important storage space for free gas. Therefore, precise TOC prediction is significant for identifying sweet spots.
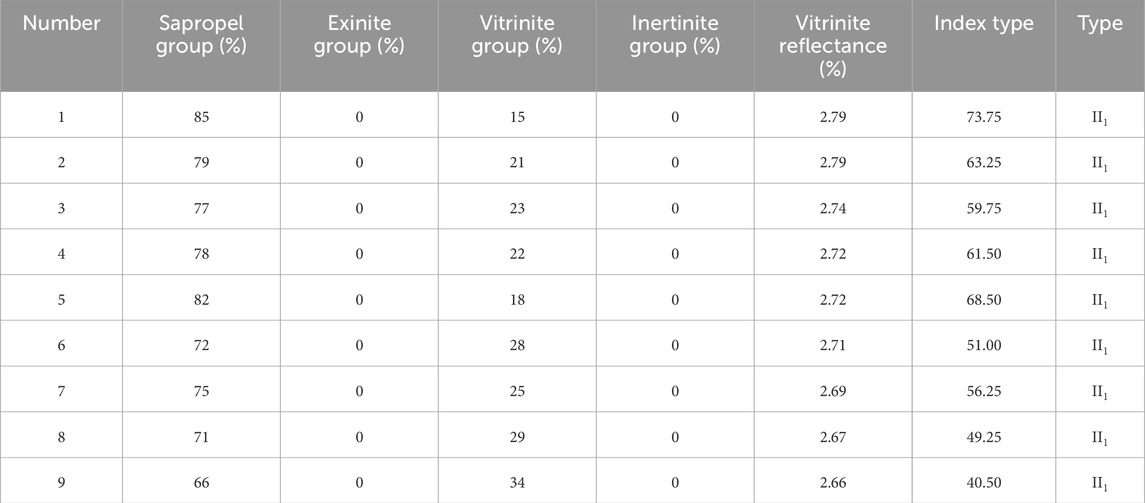
Table 2. Identification of kerogen types in the research block samples.
2.3 Heterogeneity characteristics of the shale
The shale in the research block exhibits a complex and rapidly changing mineral composition, with significant vertical heterogeneity. X-ray diffraction (XRD) analysis of the whole-rock mineral composition (Figure 2) indicates that the shale in the study section is primarily composed of feldspathoid minerals (average content of 64%), followed by clay minerals (21%), with the lowest content of carbonate minerals (15%). The mineral composition shows distinct vertical differentiation, with higher clay mineral content in the upper section (up to 35%), while the lower section contains a significantly higher proportion of brittle minerals (feldspathoid + carbonate minerals), exceeding 80%. This significant variation in mineral composition leads to a complex and diverse distribution of organic matter, posing a severe challenge to accurate TOC prediction.
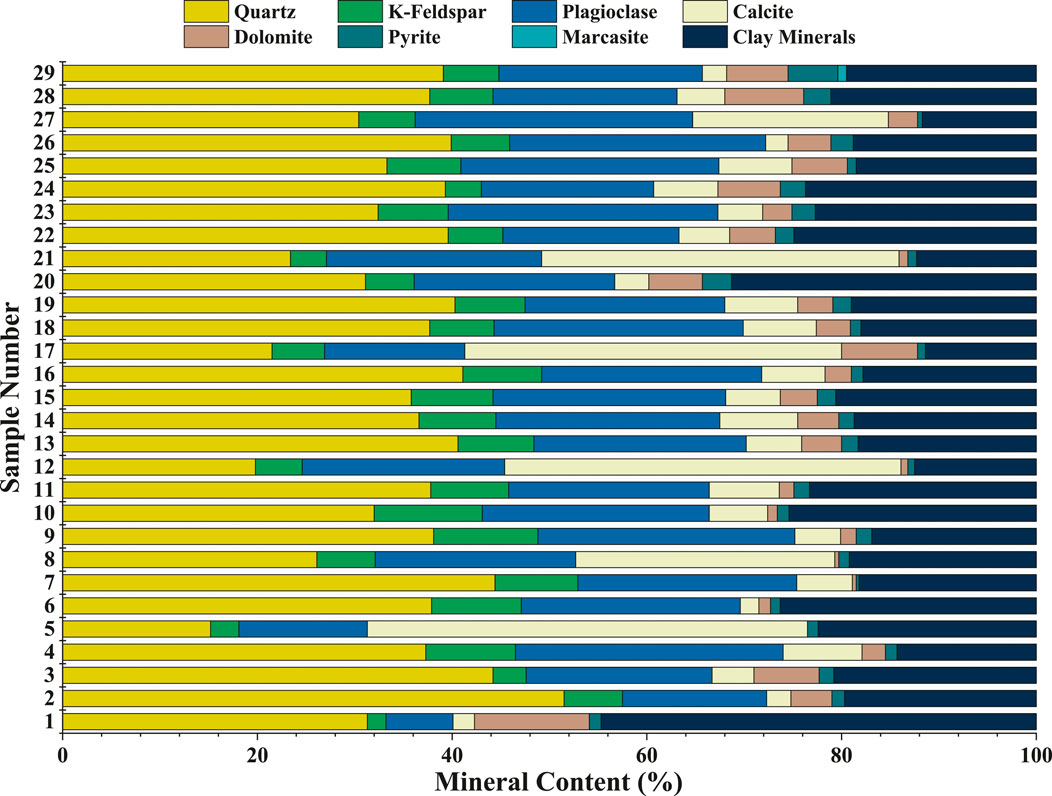
Figure 2. Mineral composition diagram of the Qiongzhusi formation shale in the research block.
The rapid changes in mineral composition affect TOC prediction in three main ways: First, different minerals exhibit significant differences in well log responses. For example, clay minerals usually show high gamma-ray (GR) values, while brittle minerals show low GR values. This interference reduces the correlation between conventional well logs and TOC, making TOC prediction using a single well log parameter more difficult (Lu et al., 2013). Second, organic matter enrichment has clear lithology dependence. In layers with high clay content, organic matter is mainly concentrated by adsorption, whereas in layers with high brittle mineral content, the distribution of organic matter is controlled by the development of microfractures. This difference makes TOC prediction models based on a single well log parameter unable to accurately represent the spatial distribution of organic matter. Lastly, abrupt changes in mineral composition near lithological interfaces further increase the uncertainty in TOC prediction, as seen in the JS103 well section (3,350m–3390m, Figure 8). Rapid changes in mineral composition not only interfere with well log interpretation but also cause significant deviations in predictions across lithological transition zones, adding to the complexity of model development.
3 TOC prediction model establishment
3.1 Basic principles of the interpretable neural network
The Interpretable Neural Network (INN) uses a structured network architecture design (Figure 3) to decouple the complex input-output mapping relationships into nonlinear mathematical expressions between variables, thereby enabling qualitative analysis of the contribution of individual features (Castillo, 1998; Zhang L et al., 2023). In traditional neural networks, when adjusting the connection weights of the hidden layers, all input data are typically processed together to achieve optimal prediction performance, but the correlations between inputs and outputs based on hidden information cannot be evaluated. In contrast, the INN can visualize the interaction relationships between each input feature and the target variable, thus achieving a transition from a “black-box” to a “white-box” model.
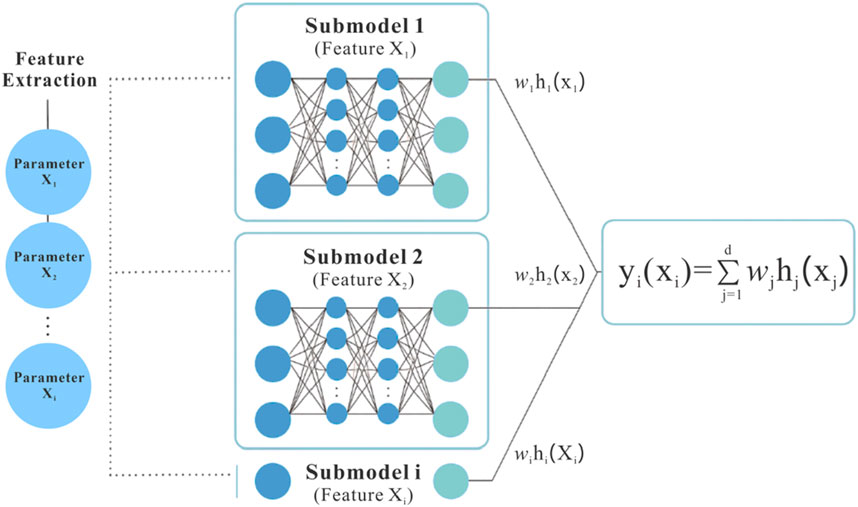
Figure 3. INN framework diagram.
IINN assigns each input feature an independent, simple sub-network module
In the formula,
During end-to-end interpretable training, INN standardizes the input data so that all features are on comparable scales, ensuring the stability of training and the fairness of parameter interpretation. Standard loss functions, such as Mean Squared Error (MSE) (Equation 3), are used, and all sub-network internal parameters and the output layer’s weight coefficients are optimized simultaneously through the backpropagation algorithm and gradient descent optimization method.
3.2 Bayesian Information Criterion-based interpretable neural network
Despite the significant advantages of INN in model transparency, there are still some limitations. First, the original INN forces all input features to be modeled using a uniform polynomial degree (such as a fixed quadratic polynomial), making it difficult to adapt to the differences in nonlinear relationships between features in the actual data. This rigid design can lead to underfitting of high-degree nonlinear features and overfitting of low-degree nonlinear features, reducing the model’s generalization ability. Lastly, the end-to-end random initialization strategy may cause the model to fall into local optima, converging to weight combinations that are physically unreasonable and affecting model reliability.
To address these issues in the prediction of shale TOC content, this study proposes an INN-BIC algorithm based on the Bayesian Information Criterion (BIC). The model improves upon the original INN framework by introducing a dynamic polynomial modeling mechanism, i.e., by introducing the BIC criterion to automatically select the optimal polynomial degree for each geological feature, effectively solving the model rigidity problem caused by manually presetting fixed degrees in the original INN. Specifically, the algorithm independently calculates the BIC values for different polynomial degrees for each feature, autonomously selecting the degree and weight corresponding to the minimum BIC to quantify the balance between model complexity and goodness of fit (Equation 4).
The INN-BIC model adopts a two-stage training optimization strategy (Figure 4). In the pre-training stage, the optimal degree and initial weights of each feature are determined based on the BIC criterion. In the fine-tuning stage, the Adam Optimizer is used for end-to-end fine-tuning, with MSE as the loss function to achieve global parameter optimization (Equation 5). This strategy ensures both the prediction accuracy of the model and the interpretability of the sub-network structure. By analyzing the weight distribution and selected degrees of each sub-network, the model can quantify the contribution of each feature to the output, providing reliable support for the model’s interpretability.
In the formula,
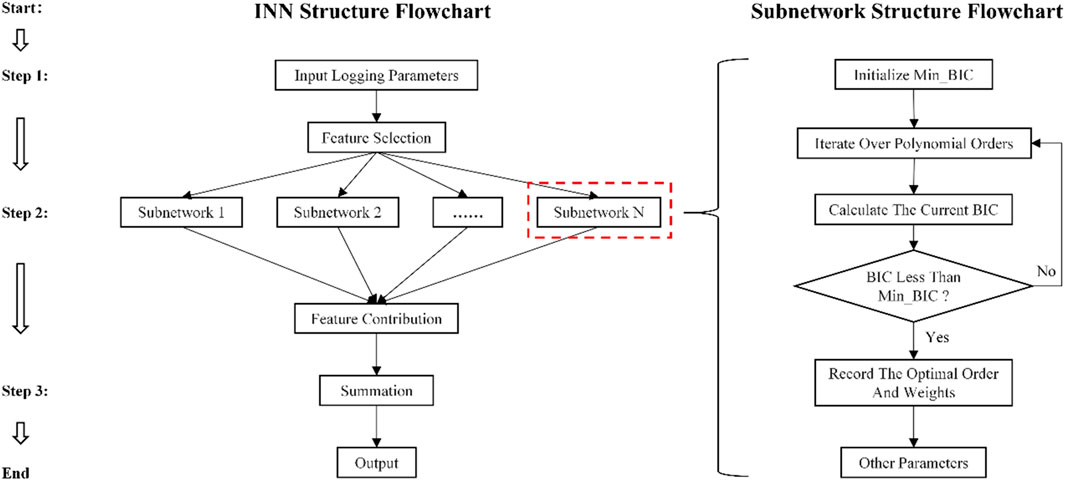
Figure 4. INN-BIC structure flowchart.
The robustness of the INN-BIC model is further enhanced, resulting in an innovative architecture that combines the precision of black-box models with the interpretability of white-box models. Practical applications show that this algorithm not only generates mathematical expressions that can be directly interpreted by geologists but also accurately quantifies the nonlinear contributions of each feature, providing new technical support for shale oil and gas exploration.
3.3 Data source and preprocessing
The model is constructed upon a dataset comprising 361 core samples collected from five key exploration wells (e.g., Well JY1, Well JY2, Well JS103) in the Jingyan-Qianwei area of the Sichuan Basin. The TOC content of all core samples was accurately measured using a Rock-Eval pyrolysis analyzer. Rigorous depth alignment and matching were performed to ensure that each core TOC measurement was precisely correlated with its in-situ well-logging responses.
For input parameter selection, based on prior geological knowledge and Pearson correlation analysis (Figure 5), this study identified six key well-logging curves mechanistically linked to TOC enrichment: Uranium (U), Gamma Ray (GR), Compensated Acoustic Log(AC), Deep Resistivity (RD), and Shallow Resistivity (RS). It is noteworthy that these parameters generally exhibit low linear coefficients of determination (R2) with TOC in Figure 5, which serves as direct evidence of the strong heterogeneity of the shale reservoir in the study area. The rapid vertical variation in mineral composition (as shown in Figure 2) causes the response of any single log to be co-influenced by both lithology and organic matter, preventing the establishment of a stable, global linear relationship with TOC.
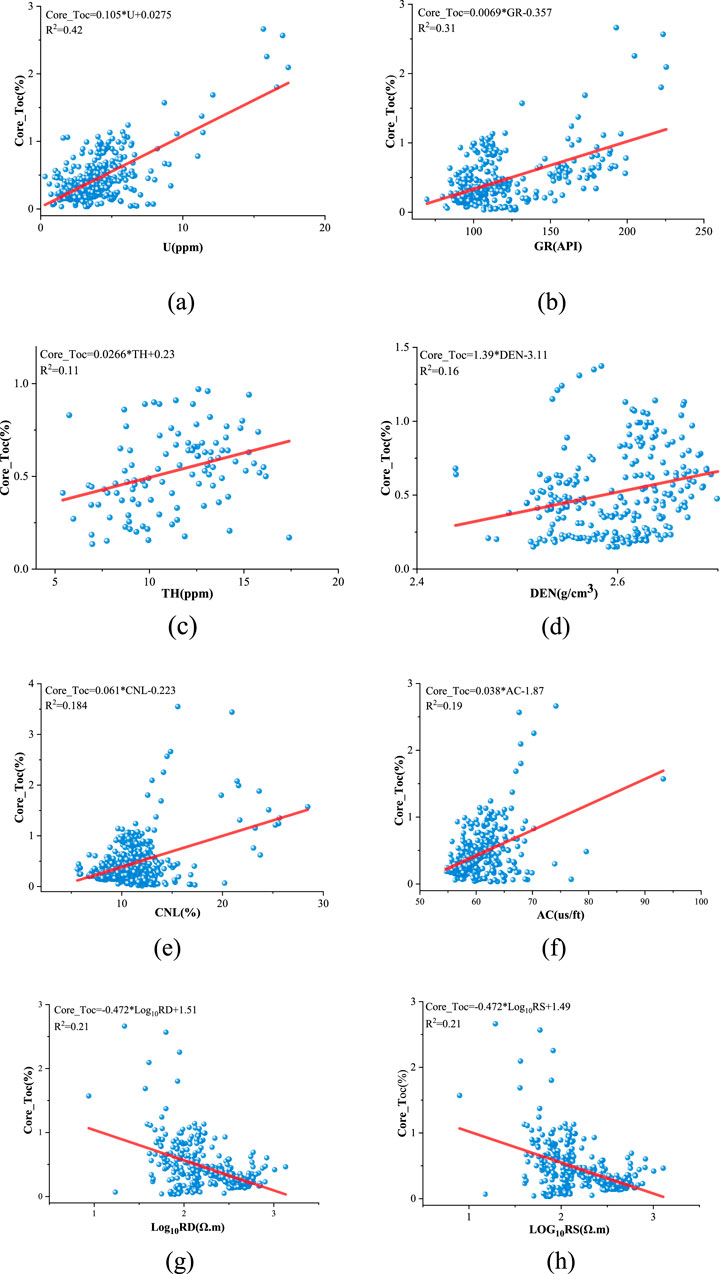
Figure 5. Correlation analysis between logging parameters and TOC. (a) U and TOC. (b) GR and TOC. (c) TH and TOC. (d) DEN and TOC. (e) CNL and TOC. (f) AC and TOC. (g) RD and TOC. (h) RS and TOC.
This observation clearly highlights the limitations of traditional linear prediction models in our study area and, concurrently, establishes the core motivation for this study: the necessity to employ an advanced algorithm capable of capturing complex nonlinear relationships. Consequently, this study introduce the Interpretable Neural Network based on the Bayesian Information Criterion (INN-BIC). This model does not rely on strong linear assumptions. Its “feature decoupling” and “dynamic order selection” mechanisms enable it to adaptively uncover the potential nonlinear associations between each parameter and TOC, ultimately achieving high prediction accuracy by integrating the complementary information from multiple parameters.
To ensure training stability and fairness, all input logging parameters were subjected to Z-score standardization to eliminate unit differences. Finally, the entire set of 361 samples was randomly split into a training set (80%, 289 samples) and a testing set (20%, 72 samples) for model construction and independent performance evaluation, respectively.
3.4 Model validation
Through the feature-decoupling architecture of the INN model, each well log parameter independently enters its corresponding interpretable sub-network for polynomial base transformations, ultimately resulting in a prediction model with explicit mathematical expressions (Equation 6):
In the formula, n is the number of sample points;
In the model expression, the relationship between different well log parameters and TOC is represented by adaptive polynomial transformations. The research results show that U and GR follow quadratic and cubic polynomial relationships, respectively. This feature corresponds to the complexity of the rock and mineral composition in the research block and the differences in organic matter adsorption capacity due to different clay minerals, revealing the intrinsic relationship between uranium and natural gamma responses and organic matter enrichment in the anoxic environment of the early Cambrian. RD and RS exhibit significant quadratic polynomial relationships with TOC, reflecting the electrical response characteristics of the lithological interface between overlying silty shale and underlying black shale in the research block. AC, in contrast, maintains a linear relationship with TOC, consistent with the brittle mineral content shown by XRD analysis, indicating the impact of the microfracture system formed by the thermal evolution of organic matter on acoustic wave propagation characteristics (Fu et al., 2025). These features have significant correlations with the rhythmic interlayer structure of “deep-water-shallow-water alternating shelf deposition” in the Qiongzhusi Formation of the research block. The INN model, through its adaptive feature selection mechanism, effectively identifies the organic matter enrichment patterns in the research block, providing a new technical approach for evaluating overmature shale gas reservoirs.
The INN-BIC model’s prediction results are shown in Figure 6. The coefficient of determination (R2) between the predicted and measured TOC values for the training, testing, and total sample sets all exceed 0.89, showing good fitting performance. This result validates the accuracy and reliability of the INN-BIC model in predicting TOC for source rocks, providing reliable technical support for subsequent research.
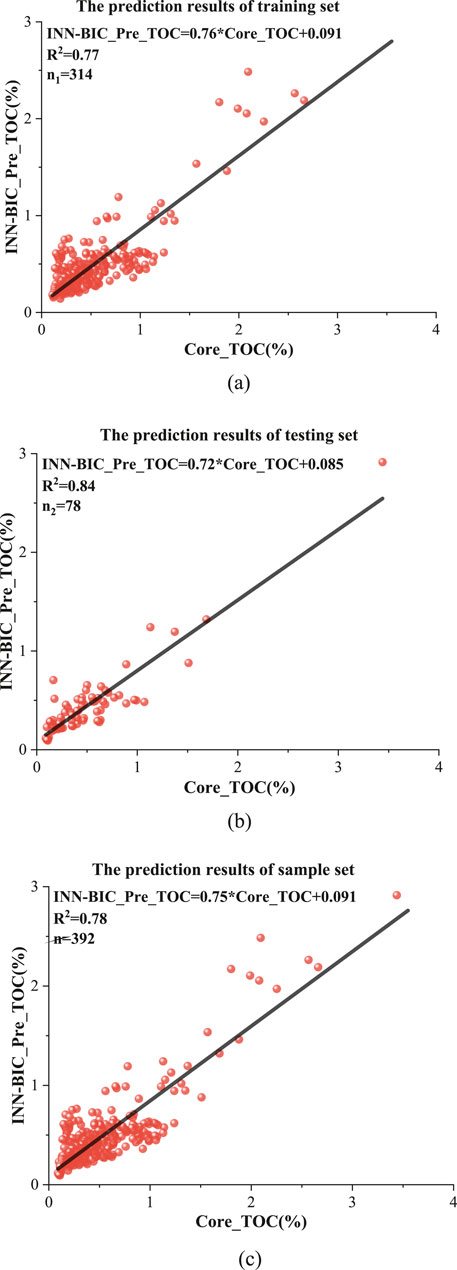
Figure 6. Analysis of INN model prediction results and measured results. (a) The prediction results of training set. (b) The prediction results of INN testing set. (c) The prediction results of INN sample set.
4 Application
To verify the prediction accuracy of the INN-BIC model, systematic validation was carried out on three key wells, JY1, JY2, and JS103 (Figure 7). Specifically, the INN-BIC model demonstrated excellent fitting performance in the three wells, with coefficients of determination (R2) reaching 0.93, 0.90, and 0.86, respectively. This clearly indicates the INN-BIC model’s significant ability to explain the variability of TOC data. At the same time, the model’s prediction error metrics were also outstanding, as shown in Table 3. The average absolute error (MAE) and root mean square error (RMSE) for Well JY1 were 0.119 and 0.198, respectively, while for Well JY2, the MAE and RMSE were 0.184 and 0.227, respectively. Among them, the well with the largest sample size, JS103, showed the highest prediction accuracy, with an MAE of only 0.0467 and an RMSE of 0.0647. These results fully validate the INN-BIC model’s robust, high-precision prediction capability and broad adaptability under different data scales and geological conditions.
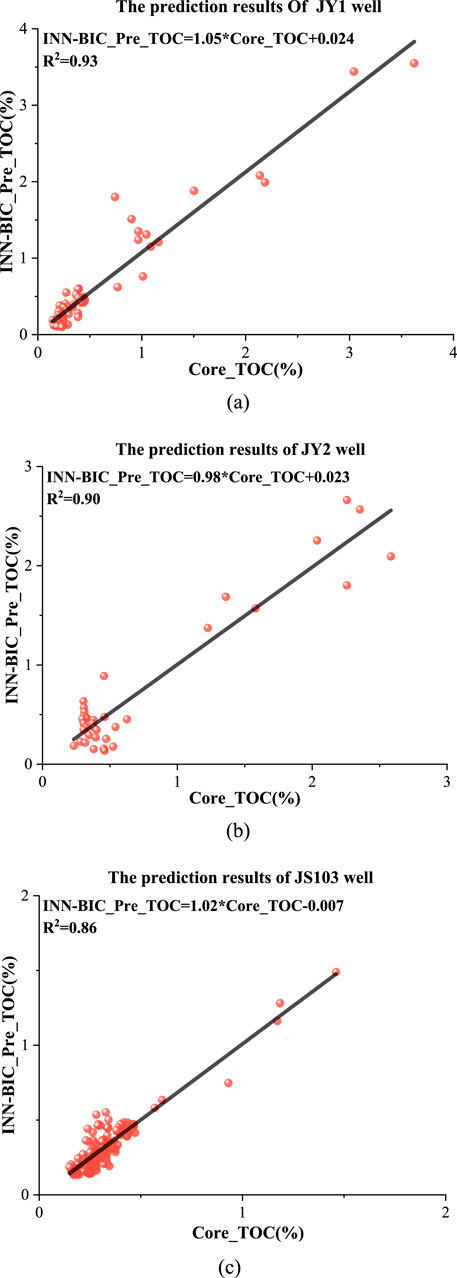
Figure 7. The prediction results of three key wells in Jingyan-Qianwei area. (a) The prediction results of INN-BIC algorithm in JY1. (b) The prediction results of INN-BIC algorithm in JY2. (c) The prediction results of INN-BIC algorithm in JS103.
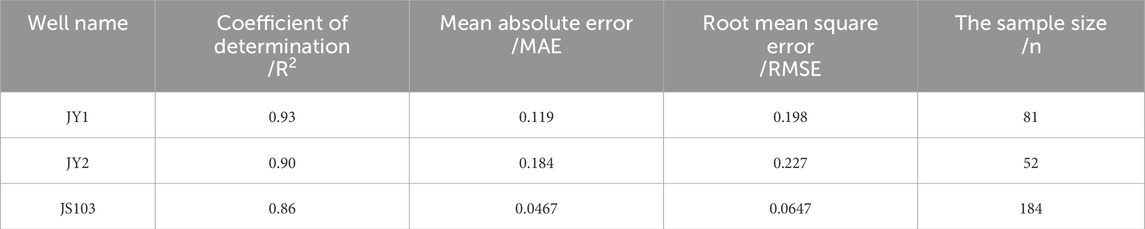
Table 3. Comparative analysis of TOC error between prediction method and measured TOC in Qiongzhusi Formation in the research block.
The actual application results for Well JS103, shown in Figure 8, indicate that the INN-BIC model’s predictions are in good agreement with the core experimental results, with accuracy significantly improved over the original INN model. The model effectively overcame the modeling bottleneck of TOC prediction in highly heterogeneous shale reservoirs (e.g., the 3,350 m–3,390 m section). Under small sample conditions, the INN-BIC model exhibited exceptional prediction accuracy and demonstrated efficient offline inversion capability based on analytical formulas, providing a technical tool for shale organic matter abundance evaluation. The research results show that the INN, optimized using the BIC, is applicable for TOC prediction in highly heterogeneous reservoirs.
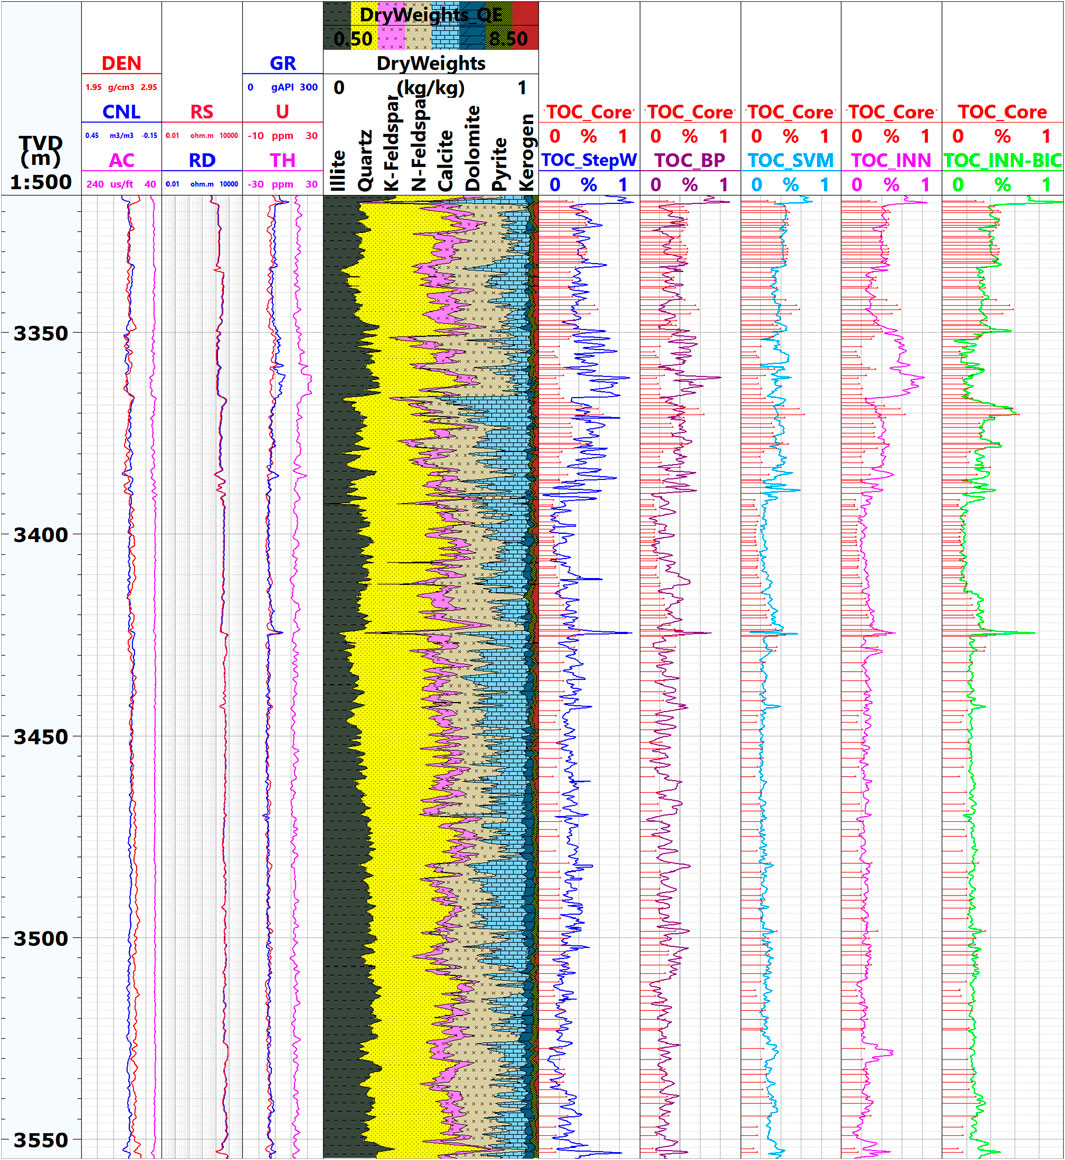
Figure 8. Comparison of TOC calculation models of JS103 well in the research block. The figure above shows, from left to right, the following columns:1–4: Depth (m); Density (DEN: g/cm3)/Neutron Porosity (CNL: %)/Acoustic Time Difference (AC: μs/ft.); Resistivity (RD/RS: ohm·m); Natural Gamma (GR: gAPI)/Uranium Content (U: ppm)/Potassium Content (K: ppm).5: Mineral Content (Illite/Quartz/Potassium Feldspar/Sodium Feldspar/Calcite/Dolomite/Pyrite/Kerogen: kg/kg).6: Core Measured TOC (TOC-Core: %)/Stepwise Regression Method Calculated TOC (TOC-StepW: %).7: Core Measured TOC (TOC-Core: %)/BP Neural Network Calculated TOC (TOC-BP: %).8: Core Measured TOC (TOC-Core: %)/Support Vector Machine Algorithm Calculated TOC (TOC-SVM: %).9: Core Measured TOC (TOC-Core: %)/Original INN Model Calculated TOC (TOC-INN: %).10: Core Measured TOC (TOC-Core: %)/INN-BIC Model Calculated TOC (TOC-INN-BIC: %).
5 Discussion and future work
5.1 Method comparison discussion
To further verify the superiority of the INN-BIC model, a multi-method comparison analysis was conducted on Well JS103 (Table 4). In this analysis, the original INN neural network used both quadratic and cubic polynomial terms for fitting, and the model achieved its best performance with the following expression (Equation 7):
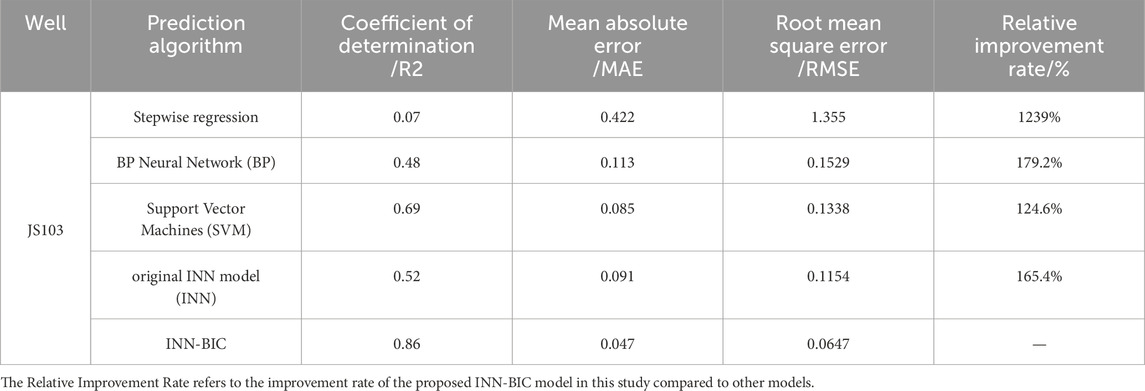
Table 4. Comparison of results of different prediction methods.
In the formula, n is the number of sample points;
The results show that the coefficient of determination (R2) of the INN-BIC model is approximately 11 times, 79%, and 25% higher than the three traditional computational methods: stepwise regression, BP neural network, and SVM models, respectively. Compared to the original INN model, the INN-BIC model improved by 65%. Furthermore, the INN-BIC model achieved the lowest average absolute error (MAE) and root mean square error (RMSE), highlighting the model’s advantages in prediction accuracy and stability.
From the example application of Well JS103 in Figure 7, it can be seen that, in the depth interval of 3,350 m–3390 m, where the mineral composition undergoes dramatic changes and strong heterogeneity is developed, the three traditional prediction models (stepwise regression, BP neural network, SVM) as well as the original INN model show clear limitations. Specifically, the four algorithms exhibit a delayed response to rapid fluctuations in TOC content, struggling to accurately identify such complex changes and showing poor convergence. Additionally, under the limited sample conditions of core experiments, traditional methods fail to capture the complex nonlinear relationships between reservoir parameters and well log responses. In lithological transition zones, significant deviations in prediction results are observed. In contrast, the INN model, with its reversible computation architecture, demonstrates unique advantages. Through the backpropagation mechanism, the model decodes the implicit mapping relationship between geological parameters and well log responses, accurately tracking TOC content changes and effectively reducing fitting errors. The prediction results show a high degree of agreement with the core experimental data, confirming the model’s applicability to highly heterogeneous shale layers. More importantly, this model supports offline high-precision inversion of TOC content based on analytical formulas, without relying on artificial intelligence platforms.
5.2 Algorithm advantages discussion
This study innovatively introduces the INN into the field of shale TOC prediction, overcoming the challenge of low prediction accuracy of traditional algorithms in highly heterogeneous geological environments. Various prediction methods were examined in this study. The stepwise regression method performs linear transformations for highly correlated parameters, but its prediction accuracy significantly decreases when there is a complex nonlinear relationship between well log parameters and TOC. On the other hand, SVM and BP neural network can perform nonlinear fitting, which improves prediction accuracy to some extent; however, their processes are hidden within the network, making it difficult to interpret the geological significance between the predicted results and output parameters. The original INN model can effectively solve this problem, but its network structure is relatively rigid, with activation functions typically using fixed-degree polynomials. In such cases, parameter optimization must consider the contribution of each degree of every feature, which greatly increases the training complexity, leading to potential underfitting and increased prediction bias.
The INN-BIC model proposed in this paper improves upon this by using the BIC value as an adaptive dynamic parameter to optimize the input degree of each feature (as shown in Equation 6). This mechanism automatically discards unnecessary higher-order terms of features to reduce model fitting dimensions, enabling the model to quickly converge to a global optimal solution and accurately characterize TOC variations in lithological transition zones. Ultimately, by summing the weighted outputs of each sub-network model, a mathematical expression with clear geological and physical meaning is obtained, which can explain the geological significance between well log parameters and TOC. Additionally, the model can be processed offline without relying on artificial intelligence platforms. The application examples from three key wells in the research block demonstrate that the model significantly improves the prediction accuracy and interpretability of TOC in highly heterogeneous shale layers, providing effective technical support for shale gas sweet spot.
5.3 Future work
Although the INN model demonstrates significant advantages in predicting TOC content in the Qiongzhusi Formation shale, several directions for further exploration remain.
A. Multi-source Data Fusion Expansion. The current model primarily relies on well log data to construct the prediction relationship. Future research can integrate seismic attributes (such as velocity and acoustic impedance, which are sensitive to source rocks), geochemical indicators, and other multi-source information to build a more comprehensive TOC prediction system. For example, seismic profiles can be used to represent and characterize the spatial distribution and variations of organic matter (Ehsan et al., 2025b; Yu et al., 2023; Wang et al., 2023; Sahoo et al., 2021).
B. Co-inversion with Nuclear Magnetic Resonance (NMR) Technology. Exploring the integration of Nuclear Magnetic Resonance (NMR) technology into the analytical framework could allow for the simultaneous quantification of other key reservoir parameters (such as porosity and water saturation). Although the nuclear dipole coupling effect in organic matter may cause specific signal attenuation, new NMR analysis methods could be developed to utilize signal differences to quantitatively assess organic matter abundance and characteristics, providing complementary information for TOC prediction (Guo et al., 2025; Garro Linck et al., 2024; Feng et al., 2023; Jia et al., 2018).
6 Conclusion
The INN-BIC model proposed in this study has been shown to be highly applicable in predicting the Total Organic Carbon (TOC) content in the heterogeneous shelf-type shale of the Qiongzhusi Formation in the Sichuan Basin. The following important conclusions were drawn.
A. The INN-BIC model, through feature decoupling and adaptive degree selection, improves prediction accuracy by 11 times compared to stepwise regression, 79% compared to BP neural network, 25% compared to SVM, and 65% compared to the original INN model. The prediction error is reduced by 82%, significantly improving the evaluation accuracy of highly heterogeneous shale miner reservoirs.
B. The INN-BIC model quantitatively characterizes the nonlinear relationships between well log parameters and TOC through adaptive feature selection, effectively identifying the organic matter enrichment patterns in the research block. It also reveals the “deep-water-shallow-water alternating shelf deposition” rhythmic interlayer structure of the Qiongzhusi Formation in the research block, providing a new technical approach for evaluating overmature shale gas reservoirs.
C. The INN-BIC model combines the high accuracy of machine learning with the interpretability of statistical models. Its formulaic output is suitable for real-time well log interpretation and provides reliable quantitative data for shale gas sweet spot evaluation, driving the transition of shale gas reservoir evaluation from “experience-driven” to “data-mechanism integration.”
Data availability statement
The data analyzed in this study is subject to the following licenses/restrictions: The data will be provided upon reasonable request. Requests to access these datasets should be directed to ZR, MjcyNjEwMjI1OEBxcS5jb20=.
Author contributions
PZ: Writing – original draft. ZR: Writing – review and editing. FZ: Methodology, Writing – review and editing. WW: Data curation, Writing – review and editing. LC: Formal Analysis, Writing – review and editing. CF: Data curation, Writing – review and editing. WX: Formal Analysis, Writing – review and editing.
Funding
The author(s) declare that financial support was received for the research and/or publication of this article. This research was funded by Research Foundation of China University of Petroleum-Beijing at Karamay (XQZX20230009), Natural Science Foundation of Xinjiang Uygur Autonomous Region (2022D01B140, 2021D01E22), National Natural Science Foundation of China(42204121, 42364007), Research project of the Tianchi Talent Introduction Plan in Xinjiang Uygur Autonomous Region, the key research and development project (Nos. 2024B01016, 2024B01016-1 and 2024B01016-3), the Tianshan talent program (No. 2024TSYCCX0069).
Conflict of interest
Author FZ was employed by Sinopec Matrix Corporation.
The remaining authors declare that the research was conducted in the absence of any commercial or financial relationships that could be construed as a potential conflict of interest.
Generative AI statement
The author(s) declare that no Generative AI was used in the creation of this manuscript.
Any alternative text (alt text) provided alongside figures in this article has been generated by Frontiers with the support of artificial intelligence and reasonable efforts have been made to ensure accuracy, including review by the authors wherever possible. If you identify any issues, please contact us.
Publisher’s note
All claims expressed in this article are solely those of the authors and do not necessarily represent those of their affiliated organizations, or those of the publisher, the editors and the reviewers. Any product that may be evaluated in this article, or claim that may be made by its manufacturer, is not guaranteed or endorsed by the publisher.
References
Aziz, H., Ehsan, M., Ali, A., Khan, H. K., and Khan, A. (2020). Hydrocarbon source rock evaluation and quantification of organic richness from correlation of well logs and geochemical data: a case study from the sembar formation, southern indus basin, Pakistan. J. Nat. Gas Sci. Eng. 81, 103433. doi:10.1016/j.jngse.2020.103433
Bian, L., Schovsbo, N. H., Chappaz, A., Rudra, A., Xu, J., Luo, Q., et al. (2022). Paleoenvironmental reconstruction and organic matter accumulation of the Lower Cambrian qiongzhusi formation in the Sichuan Basin, south China. ACS Earth Space Chem. 6 (10), 2519–2529. doi:10.1021/acsearthspacechem.2c00224
Castillo, E. (1998). Functional networks. Neural Process. Lett. 7 (3), 151–159. doi:10.1023/a:1009656525752
Ehsan, M., Chen, R., Abbasi, M. U. H., Abdelrahman, K., Ullah, J., and Naseer, Z. (2025a). Lithology identification and estimation of total organic carbon in organic shale through machine learning approaches: insight from geochemical analysis for source rock evaluation. Int. J. Energy Res. 2025 (1), 6624763. doi:10.1155/er/6624763
Ehsan, M., Chen, R., Abdelrahman, K., Manzoor, U., Hussain, M., Ullah, J., et al. (2025b). Application of petrophysical analysis, rock physics, seismic attributes, seismic inversion, multi-attribute analysis, and probabilistic neural networks for estimating petrophysical parameters for source and reservoir rock evaluations in the lower indus Basin, Pakistan. Nat. Resour. Res., 1–29. doi:10.1007/s11053-025-10550-6
Feng, C., Feng, Z., Mao, R., Li, G., Zhong, Y., and Ling, K. (2023). Prediction of vitrinite reflectance of shale oil reservoirs using nuclear magnetic resonance and conventional log data. Fuel 339, 127422. doi:10.1016/j.fuel.2023.127422
Fu, L. Y., Yang, H., Fu, B. Y., and Müller, T. M. (2025). Stress-dependent wave propagation in fractured rocks with nonlinear elastic and hyperelastic deformations. J. Geophys. Res. Solid Earth 130 (6), e2024JB030889. doi:10.1029/2024jb030889
Garro Linck, Y., Martínez Delfa, G., and Donadelli, J. A. (2024). Total organic carbon determination by 13C CP/MAS solid-state NMR in unconventional oil/gas source rocks: a case study from the Neuquén and cuyo basins in Argentina. Energy and Fuels 38 (6), 5098–5105. doi:10.1021/acs.energyfuels.3c04777
Gordon, J. B., Sanei, H., and Pedersen, P. K. (2022). Predicting hydrogen and oxygen indices (HI, OI) from conventional well logs using a Random forest machine learning algorithm. Int. J. Coal Geol. 249, 103903. doi:10.1016/j.coal.2021.103903
Guo, T., Xiong, L., Ye, S., Dong, X., Wei, L., and Yang, Y. (2023). Theory and practice of unconventional gas exploration in carrier beds: insight from the breakthrough of new type of shale gas and tight gas in Sichuan Basin, SW China. Petroleum Explor. Dev. 50 (1), 27–42. doi:10.1016/s1876-3804(22)60367-7
Guo, X., Sang, Q., Dong, M., Fu, J., Niu, X., and Zhou, X. (2025). Quantitative characterization of oil–water occurrence states in organic-rich, high-clay, and multi-lithofacies shale reservoirs using vacuum-imbibition and two-dimensional nuclear magnetic resonance. Phys. Fluids 37 (6), 063122. doi:10.1063/5.0275228
Hui, G., Chen, Z., Yan, J., Wang, M., Wang, H., Zhang, D., et al. (2023). Integrated evaluations of high-quality shale play using core experiments and logging interpretations. Fuel 341, 127679. doi:10.1016/j.fuel.2023.127679
Jia, Z., Xiao, L., Chen, Z., Liao, G., Zhang, Y., Wang, Z., et al. (2018). Determining shale organic porosity and total organic carbon by combining spin echo, solid echo and magic echo. Microporous Mesoporous Mater. 269, 12–16. doi:10.1016/j.micromeso.2017.11.049
Lai, J., Wang, G., Fan, Q., Pang, X., Li, H., Zhao, F., et al. (2022). Geophysical well-log evaluation in the era of unconventional hydrocarbon resources: a review on current status and prospects. Surv. Geophys. 43 (3), 913–957. doi:10.1007/s10712-022-09705-4
Lai, J., Zhao, F., Xia, Z., Su, Y., Zhang, C., Tian, Y., et al. (2024). Well log prediction of total organic carbon: a comprehensive review. Earth-Science Rev. 258, 104913. doi:10.1016/j.earscirev.2024.104913
Lan, Z., and Shen, J. (2022). Depositional paleo-environments of Lower Cambrian Qiongzhusi formation in the western middle Yangtze block and its controlling effect on the organic matter enrichment. Energies 15, 3761. doi:10.3390/en15103761
Li, J., Wang, M., Lu, S., Chen, G., Tian, W., Jiang, C., et al. (2020). A new method for predicting sweet spots of shale oil using conventional well logs. Mar. Petroleum Geol. 113, 104097. doi:10.1016/j.marpetgeo.2019.104097
Liu, B., Rostamian, A., Kheirollahi, M., Mirseyed, S. F., Mohammadian, E., Golsanami, N., et al. (2023). NMR log response prediction from conventional petrophysical logs with XGBoost-PSO framework. Geoenergy Sci. Eng. 224, 211561. doi:10.1016/j.geoen.2023.211561
Lu, L., Cai, J., and Liu, W. (2013). Occurrence and thermostability of absorbed organic matter on clay minerals in mudstones and muddy sediments. Oil Gas Geol. 34 (1), 16–26. [in Chinese].
Maroufi, K., and Zahmatkesh, I. (2023). Effect of lithological variations on the performance of artificial intelligence techniques for estimating total organic carbon through well logs. J. Petroleum Sci. Eng. 220, 111213. Part B. doi:10.1016/j.petrol.2022.111213
Mulashani, A. K., Shen, C., Asante-Okyere, S., Kerttu, P. N., and Abelly, E. N. (2021). Group method of data handling (GMDH) neural network for estimating total organic carbon (TOC) and hydrocarbon potential distribution (S1, S2) using well logs. Nat. Resour. Res. 30 (5), 3605–3622. doi:10.1007/s11053-021-09908-3
Nyakilla, E. E., Silingi, S. N., Shen, C., Jun, G., Mulashani, A. K., and Chibura, P. E. (2022). Evaluation of source rock potentiality and prediction of total organic carbon using well log data and integrated methods of multivariate analysis, machine learning, and geochemical analysis. Nat. Resour. Res. 31 (1), 619–641. doi:10.1007/s11053-021-09988-1
Passey, Q., Creaney, S., and Kulla, J. (1990). A practical model for organic richness from porosity and resistivity logs. AAPG Bull. 74, 1777–1794. doi:10.1306/0c9b25c9-1710-11d7-8645000102c1865d
Sahoo, T. R., Funnell, R. H., Brennan, S. W., Sykes, R., Thrasher, G. P., Adam, L., et al. (2021). Delineation of coaly source rock distribution and prediction of organic richness from integrated analysis of seismic and well data. Mar. Petroleum Geol. 125, 104873. doi:10.1016/j.marpetgeo.2020.104873
Schmoker, J. W. (1979). Determination of organic content of Appalachian Devonian shales from formation-density logs: geologic notes. AAPG Bull. 63, 1504–1509. doi:10.1306/2f9185d1-16ce-11d7-8645000102c1865d
Schmoker, J. W. (1981). Determination of organic-matter content of Appalachian Devonian shales from gamma-ray logs. AAPG Bull. 65, 1285–1298. doi:10.1306/03b5949a-16d1-11d7-8645000102c1865d
Schmoker, J. W., and Hester, T. C. (1983). Organic carbon in bakken formation, United States portion of Williston Basin. AAPG Bull. 67, 2165–2174. doi:10.1306/ad460931-16f7-11d7-8645000102c1865d
Wang, N., Li, M., Tian, X., Hong, H., Wen, L., and Wang, W. (2020). Climate-ocean control on the depositional watermass conditions and organic matter enrichment in Lower Cambrian black shale in the upper yangtze platform. Mar. Petroleum Geol. 120, 104570. doi:10.1016/j.marpetgeo.2020.104570
Wang, Y., Chen, D., Wang, Y., Lei, W., and Wang, F. (2023). Characteristics and controlling factors of pores in different shale lithofacies reservoirs of Lower Cambrian qiongzhusi formation, Southwestern Sichuan Basin, China. Minerals 13, 1442. doi:10.3390/min13111442
Wang, X., Liu, G., Wang, X., Ma, J. F., Wang, Z. L., Wang, F. L., et al. (2024). Geophysical prediction of organic matter abundance in source rocks based on geochemical analysis: a case study of southwestern Bozhong Sag, Bohai Sea, China. Petroleum Sci. 21 (1), 31–53. doi:10.1016/j.petsci.2023.09.005
Wood, D. A. (2020). Total organic carbon predictions from lower Barnett Shale well-log data applying an optimized data matching algorithm at various sampling densities. Pure Appl. Geophys. 177, 5451–5468. doi:10.1007/s00024-020-02566-1
Yan, Z., Wang, F., Liu, Y., Zhang, J., Liu, L., and Gao, M. (2025). Effects of CO2 pressure on the dynamic wettability of the kerogen surface: insights from a molecular perspective. Appl. Surf. Sci. 694, 162822. doi:10.1016/j.apsusc.2025.162822
Yu, S., Zong, Z., Yin, X., Lang, K., and Chen, F. B. (2023). Rock physics and seismic reflectivity parameterization and amplitude variation with offsets inversion in terms of total organic carbon indicator. Petroleum Sci. 20 (4), 2092–2112. doi:10.1016/j.petsci.2023.02.012
Zhang, W., Shan, X., Fu, B., Zou, X., and Fu, L. Y. (2022). A deep encoder-decoder neural network model for total organic carbon content prediction from well logs. J. Asian Earth Sci. 240, 105437. doi:10.1016/j.jseaes.2022.105437
Zhang, L., Yuan, X., Luo, L., Tian, Y., and Zeng, S. (2023). Seepage characteristics of broken carbonaceous shale under cyclic loading and unloading conditions. Energy and Fuels 38 (2), 1192–1203. doi:10.1021/acs.energyfuels.3c04160
Zhang, X., Meng, Y., Yan, T., Zhong, J., Qiu, Z., Zhao, W., et al. (2025). A new method for total organic carbon prediction of marine-continental transitional shale based on multivariate nonlinear regression. Front. Earth Sci. 19, 322–339. doi:10.1007/s11707-025-1149-y
Zhang, F., Deng, S., and Chen, Y. (2023). A model for modeling unconventional reservoir parameters based on interpretable neural networks. J. China Univ. Petroleum Nat. Sci. Ed. 47 (03), 62–69. [in Chinese].
Zhang, H., Wu, W., and Wu, H. (2023). TOC prediction using a gradient boosting decision tree method: a case study of shale reservoirs in Qinshui Basin. Geoenergy Sci. Eng. 221, 111271. doi:10.1016/j.petrol.2022.111271
Zhao, L., Liu, S., Li, G., Zhang, M., Liang, X., Li, J., et al. (2022). Sedimentary environment and enrichment of organic matter during the deposition of Qiongzhusi formation in the upslope areas—A case study of W207 well in the Weiyuan area, Sichuan Basin, China. Front. Earth Sci. 10, 867616. doi:10.3389/feart.2022.867616
Keywords: Qiongzhusi Formation, shale, total organic carbon, interpretable neural network, heterogeneity
Citation: Zhang P, Ren Z, Zhang F, Wang W, Cui L, Feng C and Xie W (2025) A total organic carbon prediction algorithm for heterogeneous shale based on interpretable neural network: a case study of Qiongzhusi Formation shale in the Sichuan Basin. Front. Earth Sci. 13:1696607. doi: 10.3389/feart.2025.1696607
Received: 03 September 2025; Accepted: 13 October 2025;
Published: 05 November 2025.
Edited by:
Soroush Abolfathi, University of Warwick, United KingdomReviewed by:
Muhsan Ehsan, Bahria University, PakistanXingye Liu, Chengdu University of Technology, China
Copyright © 2025 Zhang, Ren, Zhang, Wang, Cui, Feng and Xie. This is an open-access article distributed under the terms of the Creative Commons Attribution License (CC BY). The use, distribution or reproduction in other forums is permitted, provided the original author(s) and the copyright owner(s) are credited and that the original publication in this journal is cited, in accordance with accepted academic practice. No use, distribution or reproduction is permitted which does not comply with these terms.
*Correspondence: Zilong Ren, MjAyMzIxNjc0OUBzdC5jdXBrLmVkdS5jbg==