 Dabao Xu1
 Yuhang Ma
- 1China Petroleum Pipeline Engineering Corporation, Hebei, China
- 2College of Architecture and Environment, Sichuan University, Chengdu, China
To break through the lithological constraints on the surrounding rock for the construction of underground water-sealed oil storage caverns, and considering limestone as a potential host rock for such caverns, the dynamic evolution law of fracture aperture in the surrounding rock under hydrodynamic dissolution remains unclear. This study takes the limestone from Yangmu Town, Guangyuan as the research object, replicates the in-situ environment of the storage layer, and systematically investigates the effects of water flow rate and concentration on the dissolution characteristics of limestone fractures through simulated hydrodynamic dissolution tests under in-situ conditions. A dynamic dissolution model was developed based on mass conservation and laminar seepage theory. The results indicate a significant coupling relationship between flow rate and dissolution rate. When the flow rate increases, the difference in concentration between the inlet and outlet decays exponentially, and the mass dissolved per unit time increases sharply. The initial concentration in the solution inhibits dissolution, and when the concentration reaches 34.2 ppm, dissolution is effectively suppressed. The error between the fracture aperture calculated by the theoretical model and the results from 3D scanning is less than 16%, demonstrating that the model can quantitatively characterize the coupling effect. The findings of this study can provide support for predicting water inflow into caverns and conducting safety assessments.
1 Introduction
Underground water-sealed oil storage is a critical component in ensuring energy security. It operates on the principle that the fissure water pressure in the surrounding rock mass of the cavern is greater than the pressure of the crude oil inside the storage caverns, which thereby effectively seals and stores the oil (Åberg, 1978). However, due to the extended operational lifespan and structural complexity of this energy storage method, its siting requirements are more stringent compared to conventional underground projects. It is typically situated in crystalline rock masses such as granite, characterized by low permeability and high strength (Novakova et al., 2016). However, with the continuous development of the national economy and the increasing demands for security, conventional rock masses can no longer adequately meet the requirements for energy storage. Nevertheless, the recent construction of several underground engineering projects in limestone formations has demonstrated the potential of limestone to serve as a viable surrounding rock medium for storage caverns (Khoo and Ooi, 2023). These alterations in seepage characteristics are inherently linked to the vertical heterogeneity of the reservoir. As observed in vertically heterogeneous shale reservoirs, “high-porosity and high-permeability zones serve as preferential flow pathways” (Zhang et al., 2025). Similarly, in limestone formations, due to vertical variations in calcite distribution and natural fracture development, water curtain flow tends to preferentially dissolve the more permeable layers. This process can rapidly enlarge local seepage channels, further disrupting the original hydraulic equilibrium in the surrounding rock and increasing the risk of containment failure. However, as limestone is a type of carbonate rock, the flow of water from the water curtain system through the surrounding rock mass can lead to increased groundwater velocity and hydraulic head, thereby altering the seepage characteristics. These changes may further affect the long-term stability and seal integrity of the water-sealed underground storage system (Xue et al., 2022). Therefore, investigating the dynamic dissolution characteristics of fractured limestone under water flow is crucial for the safety assessment of water-sealed caverns and the prevention and control of dissolution-related issues.
Currently, researchers worldwide have developed various methods to study the dissolution characteristics of carbonate rocks. Based on experimental control conditions, these methods can generally be categorized into static dissolution and dynamic dissolution experiments. Static dissolution methods primarily include the static pH method (Morse, 1978), the standard dissolution coupon test (Zhang, 2011; GAMS, 1985), the free-drift method (Svensson and Dreybrodt, 1992; Berner and Morse, 1974), and in-situ testing (DAY, 1984). Dynamic dissolution methods primarily include the rotating disk method (HITOSI et al., 1939), fractured flow simulation experiments, and flowing liquid-phase reactor tests. Dong et al. (2024) found that the dissolution rate of carbonate rocks is higher in dynamic tests than in static tests. As early as the 1980s, researchers had already discovered that certain ions in aqueous solutions could exacerbate the dissolution and degradation of rocks (Feucht and Logan, 1990; Dunning et al., 1994). Zhang et al. (2024). Investigated the acid etching characteristics of carbonate rocks under hydrodynamic conditions. Their study revealed that the dissolution behavior of carbonate rocks is significantly influenced by dissolution time, rock composition, flow rate, and acid concentration. Furthermore, a positive correlation was observed between the dissolution rate and the flow rate of the acidic solution. Additionally, the increase in dissolved
During the operational phase of an underground water-sealed cavern, it is essential to continuously maintain the surrounding rock water pressure higher than the stored medium pressure. Once the reservoir location is determined, hydrological conditions (e.g., hydraulic gradients) and lithological properties become fixed parameters. However, due to dissolution processes, seepage channels within the surrounding rock gradually expand, leading to increased fluid flow. Consequently, flow rate plays a critical role in evaluating the dissolution characteristics of the surrounding rock in water-sealed caverns. In carbonate rock displacement experiments, Qi et al. (2017) observed that face dissolution occurred when the acid injection rate was below 2 mL/min, while wormhole dissolution formed when the rate exceeded 2 mL/min. The optimal injection rate was found to be 3–4 mL/min, resulting in the lowest acid consumption. Menke et al. (2023) observed that as flow rate increases, the dissolution pattern transitions from compact dissolution to “wormhole” dissolution, and further evolves into uniform dissolution. Jiang et al. (2022) conducted experiments on gypsum rock under different flow rates and found that the deterioration phenomenon caused by dissolution became more pronounced as the flow rate increased. Xu et al. (2024) found that storm events increased river basin runoff by 7–14 times, resulting in an average increase of 270% in carbonate weathering and associated
During the long-term operation of a water-sealed underground cavern, the interplay between surrounding rock flow, seepage channels, and dissolution rates mutually reinforces one another, posing new challenges for evaluating the long-term stability and sealing integrity of the surrounding rock pressure in the cavern. Although numerous studies have investigated the influence of flow rate on dissolution kinetics, a comprehensive model for limestone dissolution rates that incorporates the coupled effects of these three factors has not yet been established. This study focuses on limestone from the Guangyuan area of Sichuan Province, utilizing an experimental system for hydrodynamic dissolution tests and an ICP-MS (Inductively Coupled Plasma Mass Spectrometry) system for ion concentration measurements. Specifically targeting the dissolution of single fractures in cavern surrounding rock, this study investigates the dynamic dissolution characteristics of limestone under varying flow rates and
2 Research methodology
2.1 Test samples
The limestone samples used in the experiment were collected from the YM5 borehole core (depths of 270–280 m) during the preliminary investigation of a proposed water-sealed underground cavern in Yangmu Town, Guangyuan City, as summarized in Table 1. XRD analysis revealed that the mineral composition of the YM5 core sample is as follows: quartz (11.6%), calcite (69.7%), plagioclase (0.9%), K-feldspar (0.2%), ankerite (2.6%), pyrite (0.7%), and clay minerals, including illite, chlorite, and illite-smectite mixed layers (14.3%). The clay minerals are predominantly composed of illite, chlorite, and illite-smectite mixed layers.

Table 1. Relative mineral content of limestone samples with different bedding orientations.
Nitrogen adsorption-desorption analysis (Figure 1) reveals that the limestone pores are primarily distributed between 25–50 nm, with a monomodal distribution peaked in the micropore region. The H4-type hysteresis loop, along with a significant gap between the adsorption and desorption isotherms at P/P0 of 0.4–1.0, suggests a pore geometry dominated by slit-shaped/cylindrical channels and a high proportion (>60%) of open and semi-open pores (Sing, 1985). Given that open pores exhibit a mean dissolution rate 1.43 and 2.7 times higher than semi-open and closed pores, respectively (Liu et al., 2018), the pore structure of the Guangyuan limestone is highly susceptible to pronounced dissolution.
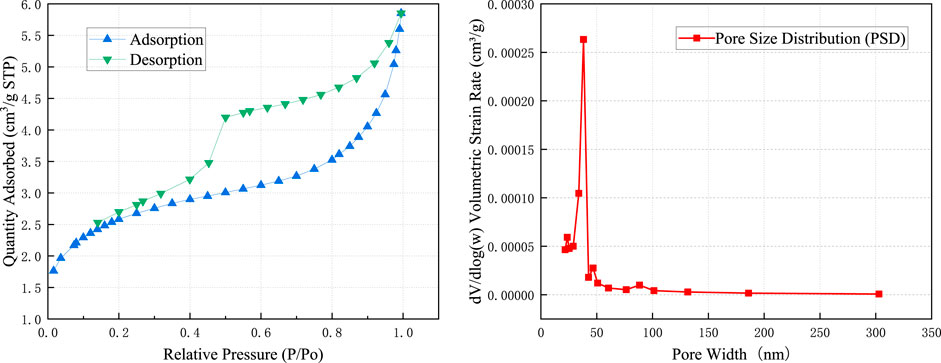
Figure 1. BET adsorption-desorption isotherms of the samples.
2.2 Experimental methods
Prior to the dissolution experiments, core samples were machined into cylindrical specimens measuring 50 mm in diameter and 100 mm in height. To establish a single-fracture system with a precisely controlled initial aperture, each cylinder was bisected along its diameter into two semi-cylindrical halves. Natural rock fractures are irregular and their apertures are difficult to quantify. Therefore, a parallel-plate fracture geometry was created by inserting rigid spacers of specific thicknesses between the split halves. This configuration ensured that the fracture aperture was the sole variable, effectively eliminating confounding factors from natural fracture roughness and branching, and satisfying the geometric assumptions of laminar flow theory for model development, as illustrated in Figure 2a.

Figure 2. Morphology of dissolution specimens: (a) sample geometry; (b) configuration of initial fracture apertures.
All prepared specimens were rinsed with deionized water to remove surface debris and subsequently oven-dried at 80 °C for 12 h. The initial dimensions and mass of each specimen were recorded. For the dynamic dissolution experiments, different initial fracture apertures were systematically reconfigured by employing spacers of different thicknesses within the specimen assemblies, as shown in Figure 2b. A schematic diagram of the experimental apparatus for the dissolution tests is presented in Figure 3.
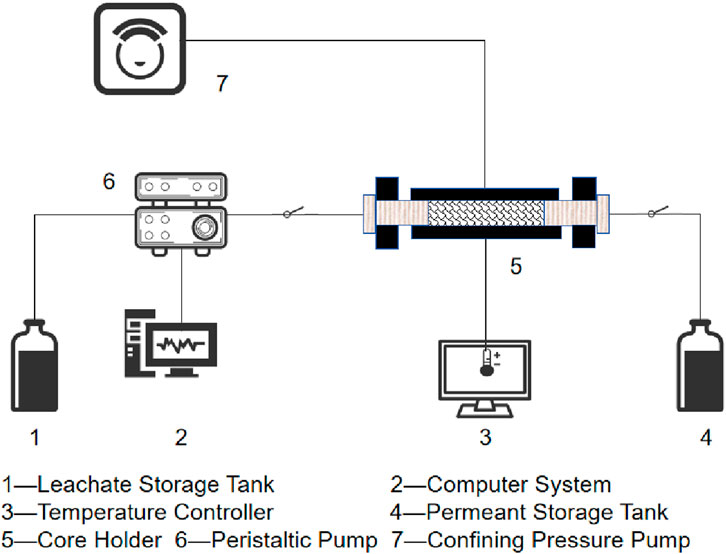
Figure 3. Schematic diagram of the dissolution experimental apparatus.
According to geological data indicating minimal temperature variation in the relevant cavern reservoir, the experiment was conducted at in situ temperature (20 °C) corresponding to a depth of 280 m. A temperature controller was set to maintain a constant temperature of 20 °C, while a confining pressure device applied 2 MPa of confining pressure to the specimen. A constant-flow pump was activated to circulate the dissolution fluid through the core holder. To prevent interference from extraneous ions and ensure the accuracy of experimental results, deionized water and solutions with varying
To quantitatively characterize the influence of
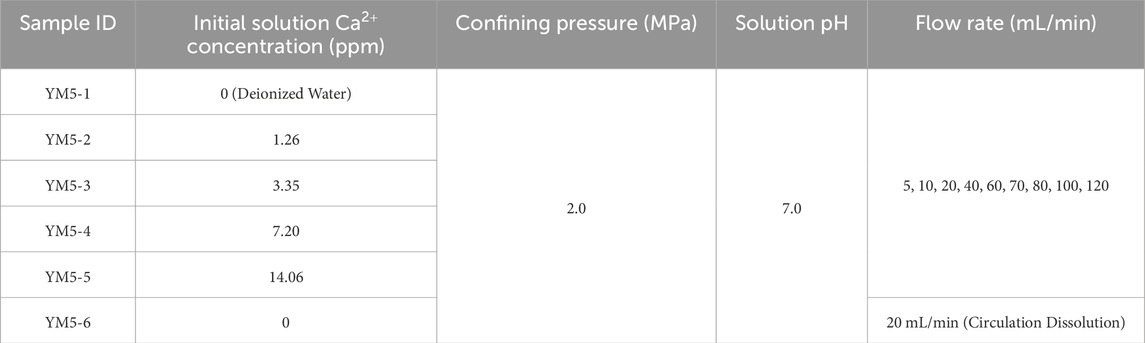
Table 2. Summary of experimental protocols.
3 Results and discussion
3.1 Effects of flow rate on limestone dissolution characteristics
Figure 4a illustrates the variation in
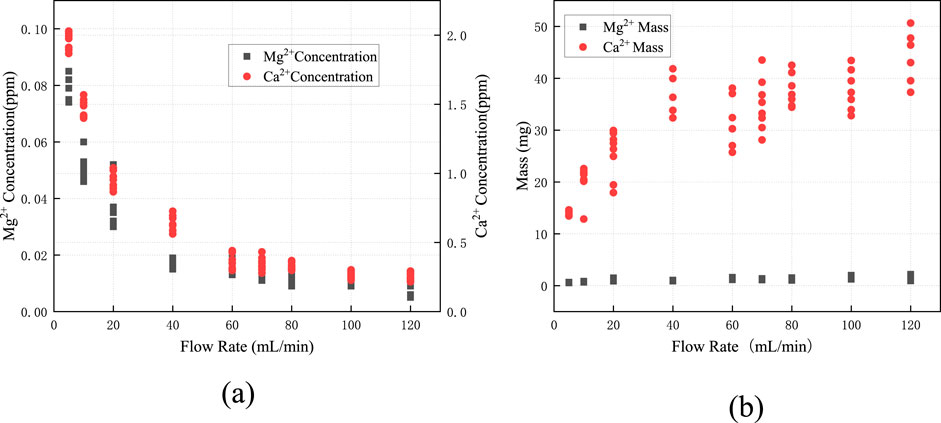
Figure 4. Variations in (a)
By multiplying the ion concentration corresponding to each flow rate in Figure 4a by the daily total fracture flow, the daily total dissolution mass was obtained, as shown in Figure 4b. It can be observed that as the total flow rate within the fracture increases, the daily dissolution mass at corresponding flow rates increases sharply. Analysis of the relationship between flow rate, ion concentration, and dissolution mass reveals that although the ion concentration decreases with increasing flow rate, the overall increase in total flow leads to a net rise in dissolution mass. Therefore, the impact of flow rate variations on dissolution processes must be emphasized. Consistent with the findings of Pokrovsky et al. (2005) regarding flow rate effects, an increase in flow rate rapidly removes dissolved products from mineral surfaces, diminishing the inhibitory effect of the “concentration boundary layer” and resulting in an accelerated rate of dissolution-induced mass loss. In the design and operation of water-sealed underground caverns, it is critical to account for how dissolution impacts fracture aperture. Post-dissolution, the increased fracture width leads to progressively higher flow rates under constant hydraulic head conditions, which in turn intensifies wall dissolution. This positive feedback mechanism between flow rate and dissolution causes non-linear growth in both the mass of dissolved surrounding rock and fracture aperture over time, ultimately posing significant risks to the long-term stability and sealing performance of the rock mass.
3.2 Effects of initial Ca2+ concentration on limestone dissolution characteristics
During the dissolution of long fractures, the ion concentration in the solution gradually increases and may even reach saturation, which can significantly inhibit the dissolution process downstream. Therefore, elucidating the inhibitory mechanism of
Figure 5 shows the dissolution characteristics of limestone under different initial
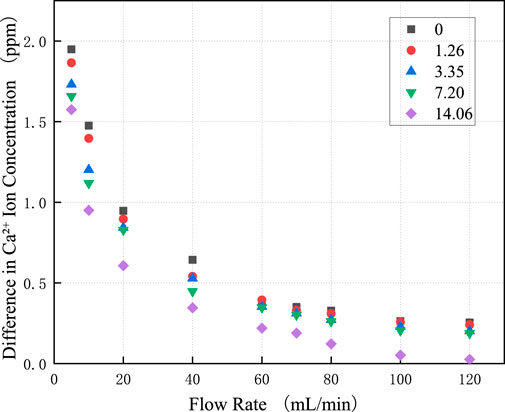
Figure 5. Dissolution patterns under varying flow rates and initial ion concentrations.
Figure 6 illustrates the experimental configuration where the upstream and downstream solution containers (5 L each) were combined into a single closed-loop system at a constant flow rate of 20 mL/min, using deionized water as the initial dissolution fluid. After rock dissolution commenced,
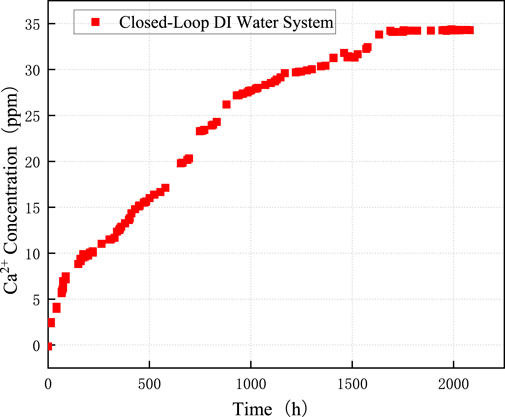
Figure 6. Variation of
4 Derivation and validation of the theoretical model
4.1 Modeling the dynamic evolution of fracture apertures under dissolution
As evidenced by the preceding analysis, although factors such as solution pH, flow rate, temperature,
If we neglect the influence of stress redistribution in the surrounding rock of the storage cavern induced by dissolution, we can assume that the evolution of the fracture hydraulic aperture is solely attributable to dissolution processes. Assuming the fracture fluid is incompressible and viscous under laminar flow conditions, and the rock fracture is represented by two smooth, straight, and infinitely long parallel plates, the theory of seepage flow in fractured rock can be derived from the Navier-Stokes equations for steady laminar flow between parallel plates.
The parameters are defined as follows: q denotes the real-time seepage velocity (m3/s) in the rough fracture, D is the diameter (m) of the rock specimen, b represents the equivalent hydraulic fracture width (m), Δp signifies the pressure difference (Pa) between the inlet and outlet, μ is the dynamic viscosity (Pa·s) of water, and L refers to the length (m) of the flow cross-section.
When water flows through the fracture surface, minerals on the specimen surface gradually migrate into the aqueous solution. The mass loss of the specimen due to dissolution per unit time dt is denoted as dm1. Assuming uniform dissolution across the specimen surface, the resulting change in fracture width is represented as db. The relationship between these parameters is given by Equation 1.2:
The parameters are defined as follows: A is the contact area (m2) between the rock sample and the fluid during reaction, α is the dimensionless experimental coefficient determined by the mineral composition and microstructure of the core (representing the ratio of total mass to the mass of soluble components in the rock, obtained experimentally), ρ denotes the rock density (g/m3), and t is the time (s) elapsed since the onset of dissolution.
For the dissolution tests on fractured limestone, the effluent ion concentration Rt at a flow rate q is described by an exponential function. The parameters a and c for this function were optimized from the data in Section 2.1 via a least squares regression, minimizing the sum of squared residuals. The corresponding dissolved mass change, defined as the product of Rt and MP, is given by Formula 1.3:
The parameters are defined as follows: dm2 denotes the mass (g) of the specimen dissolved in the solution, MP represents the molar mass (g/mol) of the soluble mineral, and Rt signifies the ion concentration (mol/m3) which varies with flow rate.
Since the mass dissolved from the limestone surface entirely enters the solution, the mass loss of the specimen dm1 due to dissolution must equal the mass dissolved in the solution dm2 based on the principle of mass conservation. Thus, combining Equations 1.2, 1.3 yields:
In Equation 1.4, the ion concentration Rt in the solution is closely related to the flow rate, and the relationship between them can be obtained by fitting the experimental data from Chapter 2. Generally, the ion concentration exhibits an exponential dependence on the flow rate.
Where a and c are experimental parameters determined by fitting the experimental data.
Substituting Equation 1.5 into Equation 1.4 yields:
Integrating Equation 1.6 yields:
4.2 Model validation
Based on hydrogeological surveys and measurements of surrounding rock samples, relevant parameters of limestone and the dissolution fluid were obtained. The pressure difference (Δp) was determined according to the typical water-oil pressure differential in water-sealed underground caverns. The parameter values used in the model are listed in Table 3. In Model 1.7, the only unknown variable is Rt. As derived from the experimental results shown in Figure 7a, the dissolved mass in Equation 1.3 equals the product of the change in ion concentration (Rt), the molar mass of the rock (Mp), and the total flow rate (q). After obtaining the expression for Rt, it is substituted into Equation 1.7 to derive the fracture aperture-time relationship curve, as shown in Figure 7b. The graph demonstrates that the aperture of the parallel-plate fracture increases over time due to dissolution.
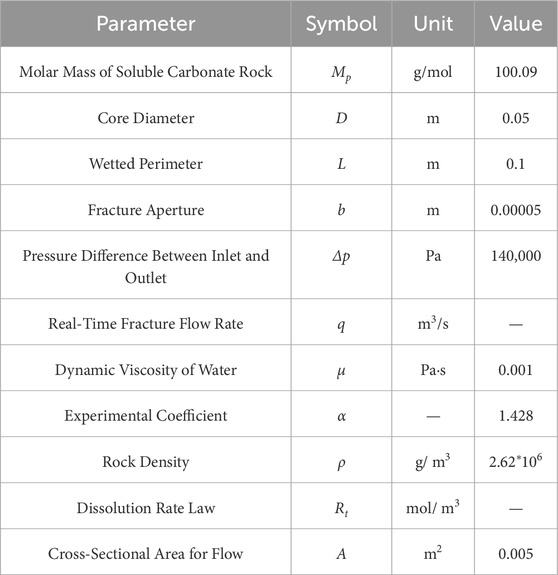
Table 3. Parameter values used in the model.
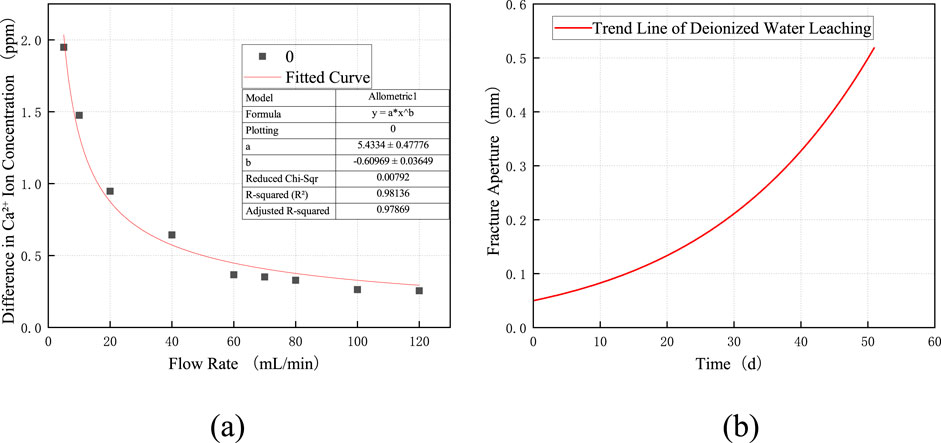
Figure 7. (a) Fitted curve for deionized water; (b) Schematic diagram of dissolution development with deionized water.
To validate the applicability of Model 1.7, dissolution experiments were conducted using a dynamic dissolution apparatus. A parallel-plate single fracture with an initial aperture of 0.05 mm was constructed for the test. Deionized water was circulated through the fracture at a constant flow rate of 20 mL/min. Effluent samples were regularly collected at the outlet to measure ion concentrations. After 3 weeks of dissolution, the sample was carefully retrieved, and the dissolved fracture surface was scanned using a 3D profilometer to obtain high-resolution topographic height data. Figure 8 presents the X-coordinate (specimen length) and Z-coordinate (dissolution depth) distribution of the dissolved fracture surface after 21 days of dissolution. The reference plane was defined by the average height of insoluble minerals, while the average height of all points below this reference plane was calculated as the dissolution depth. The calculated average dissolution depth was −0.078 mm, which deviates from the numerically modeled result of −0.09 mm by 0.012 mm, representing an error of 15.4%. This comparison demonstrates the feasibility of the proposed model.
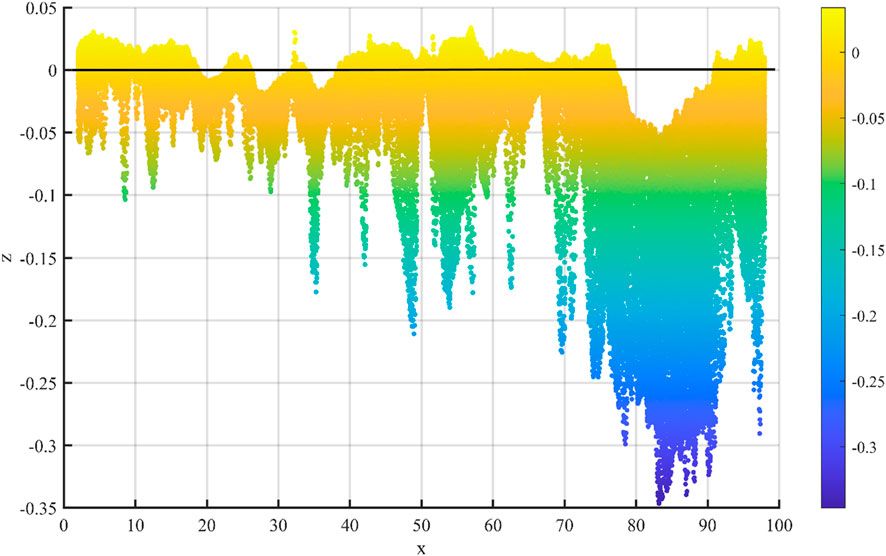
Figure 8. Coordinate plot of the dissolved surface.
5 Conclusion
When carbonate rocks are selected as the surrounding rock for water-sealed underground caverns, the dissolution of carbonate minerals under hydrodynamic conditions may lead to fracture propagation and increased water inflow, potentially compromising the integrity and safety of the storage facility. This study investigates the effects of flow rate and
1. A significant coupling relationship exists between the flow rate within fractures and the limestone dissolution rate: as the flow rate increases, the
2. Initial
3. Based on a model developed using mass conservation and laminar flow theory, the calculated results indicate that the hydraulic aperture of the fracture increases exponentially with dissolution time. After 21 days of dissolution, the fracture aperture expanded by 0.09 mm. This model can quantitatively characterize the coupling effect between flow rate and dissolution, providing a quantitative tool for predicting fracture propagation rates. A comparison between the model predictions and the surface roughness scanning results shows a difference of 0.012 mm compared to the actual scanned result of 0.078 mm, indicating that the model calculations are in good agreement with the experimental measurements, with an error of less than 16%.
6 Science, engineering and humanities and social sciences references
For articles submitted in the domains of Science, Engineering or Humanities and Social Sciences please apply Author-Year system for in-text citations. For Humanities and Social Sciences articles please include page numbers in the in-text citations.
For some examples please click here.
For more examples of citing other documents and general questions regarding reference style, please refer to the Chicago Manual of Style.
7 Health, physics and mathematics references
For articles submitted in the domain of Health or the journals Frontiers in Physics and Frontiers in Applied Mathematics and Statistics please apply the Vancouver system for in-text citations.
In-text citations should be numbered consecutively in order of appearance in the text–identified by Arabic numerals in the parenthesis [square parenthesis for Physics and Mathematics].
For some examples please click here.
For more examples of citing other documents and general questions regarding reference style, please refer to Citing Medicine.
Data availability statement
The raw data supporting the conclusions of this article will be made available by the authors, without undue reservation.
Author contributions
DX: Funding acquisition, Methodology, Writing – review and editing. YM: Investigation, Methodology, Writing – review and editing. BF: Methodology, Supervision, Validation, Writing – original draft. MF: Investigation, Methodology, Writing – original draft. ZH: Investigation, Validation, Writing – original draft.
Funding
The author(s) declare that financial support was received for the research and/or publication of this article. This research was funded by China Petroleum Pipeline Engineering Co., Ltd. (Grant No. 25H2280). The authors would like to express their gratitude to China Petroleum Pipeline Engineering Co., Ltd. for its financial support. Additionally, the authors acknowledge the company’s funding for the project entitled “Theoretical Analysis and Experimental Research on the Impact of Seepage Channel Dissolution in Underground Storage Caverns in Soluble limestone”, conducted in Chengdu, Sichuan Province. The funder was not involved in the study design, data collection, analysis, interpretation, writing of the manuscript, or the decision to submit it for publication.
Conflict of interest
Authors DX, BF, MF, and ZH were employed by China Petroleum Pipeline Engineering Corporation.
The remaining author declares that the research was conducted in the absence of any commercial or financial relationships that could be construed as a potential conflict of interest.
Generative AI statement
The author(s) declare that no Generative AI was used in the creation of this manuscript.
Any alternative text (alt text) provided alongside figures in this article has been generated by Frontiers with the support of artificial intelligence and reasonable efforts have been made to ensure accuracy, including review by the authors wherever possible. If you identify any issues, please contact us.
Publisher’s note
All claims expressed in this article are solely those of the authors and do not necessarily represent those of their affiliated organizations, or those of the publisher, the editors and the reviewers. Any product that may be evaluated in this article, or claim that may be made by its manufacturer, is not guaranteed or endorsed by the publisher.
References
Åberg, B. (1978). Prevention of gas leakage from unlined reservoirs in rock storage in excavated rock caverns: rockstore 77. Pergamon, 399–413.
Baedecker, P. A., and Reddy, M. M. (1993). The erosion of carbonate stone by acid rain: laboratory and field investigations. J. Chem. Educ. 70 (2), 104. doi:10.1021/ed070p104
Berner, R. A., and Morse, J. W. (1974). Dissolution kinetics of calcium carbonate in sea water; IV, theory of calcite dissolution. Amer. J. 274 (2), 108–134. doi:10.2475/ajs.274.2.108
Day, M. (1984). Carbonate erosion rates in Southwestern Wisconsin. Phys. Geogr. 5(2): 142–149. doi:10.1080/02723646.1984.10642249
Deng, H., Fitts, J. P., Crandall, D., McIntyre, D., and Peters, C. A. (2015). Alterations of fractures in carbonate rocks by CO2 - acidified brines. Environ. Sci. & Technol. 49 (16), 10226–10234. doi:10.1021/acs.est.5b01980
Dong, W., Li, Z., Shen, L., Liu, W., Guo, Y., Xu, H., et al. (2024). Study on the process of mass transfer and deterioration of limestone under dynamic dissolution of CO2 solution. Sci. Rep. 14, 5278. doi:10.1038/s41598-024-56038-w
Dunning, J., Douglas, B., Miller, M., and McDonald, S. (1994). The role of the chemical environment in frictional deformation: stress corrosion cracking and comminution. Pure Appl. Geophys. 143 (1), 151–178. doi:10.1007/bf00874327
Feucht, L. J., and Logan, J. M. (1990). Effects of chemically active solutions on shearing behavior of a sandstone. Tectonophysics 175 (1/2/3), 159–176. doi:10.1016/0040-1951(90)90136-v
Gabrovšek, F., and Dreybrodt, W. (2001). A model of the early evolution of karst aquifers in limestone in the dimensions of length and depth. J. hydrology 240 (3-4), 206–224. doi:10.1016/s0022-1694(00)00323-1
Gams, I. (1985). International comparative measurement of surface solution by means of standard limestone tablets. Zb. Ivana Rakovica Razpr. Razrada Sazu.
He, Z., Ding, Q., Wo, Y., Zhang, J., Fan, M., and Yue, X. (2017). Experiment of carbonate dissolution: implication for high quality carbonate reservoir formation in deep and ultradeep basins. Geofluids 2017, 1–8. doi:10.1155/2017/8439259
Hitosi, T., Hiroshi, A., and Taro, I. (1939). Viscosity effect on the rate of solution of calcium carbonate in hydrochloric acid. Bull. Chem. Soc. Jpn. 14 (9), 348–352. doi:10.1246/bcsj.14.348
Jiang, S., Huang, M., Jiang, Y., Xu, C., and Li, B. (2022). NMR-based investigation on the wet–dry deterioration characteristics of gypsiferous rocks surrounding underground excavations. Rock Mech. Rock Eng. 55, 2323–2339. doi:10.1007/s00603-022-02780-4
Khoo, C.-M., and Ooi, T.-A. (2023). Geotechnical challenges and innovations in urban underground construction – the klang valley mass rapid transit project. Geomechanics Tunn. 16, 243–262. doi:10.1002/geot.202300007
Li, L., Ma, S., Liu, X., Liu, J., Lu, Y., Zhao, P., et al. (2024). Coal measure gas resources matter in China: review, challenges, and perspective. Phys. Fluids 36 (7), 071301. doi:10.1063/5.0218328
Liu, M., Shabaninejad, M., and Mostaghimi, P. (2018). Predictions of permeability, surface area and average dissolution rate during reactive transport in multi-mineral rocks. J. Petroleum Sci. Eng. 170, 130–138. doi:10.1016/j.petrol.2018.06.010
Meng, J., Chen, S., Wang, J., Chen, Z., and Zhang, J. (2022). Development and application of carbonate dissolution test equipment under thermal–hydraulic–chemical coupling condition. Materials 15 (20), 7383. doi:10.3390/ma15207383
Menke, H. P., Maes, J., and Geiger, S. (2023). Channeling is a distinct class of dissolution in complex porous media. Sci. Rep. 13, 11312. doi:10.1038/s41598-023-37725-6
Morse, J. W. (1978). Dissolution kinetics of calcium carbonate in sea water; VI, the near-equilibrium dissolution kinetics of calcium carbonate-rich deep sea sediments. Am. J. Sci. 278 (3), 344–353. doi:10.2475/ajs.278.3.344
Novakova, L., Broz, M., Zaruba, J., Sosna, K., Najser, J., Rukavickova, L., et al. (2016). Βedrock instability of underground storage systems in the Czech Republic, central Europe. Appl. Geophys. 13, 315–325. doi:10.1007/s11770-016-0563-z
Pokrovsky, O. S., Golubev, S., and Schott, J. (2005). Dissolution kinetics of calcite, dolomite and magnesite at 25°C and 0 to 50 atm PCO2-ScienceDirect. Chem. Geol. 217 (3), 239–255. doi:10.1016/j.chemgeo.2004.12.012
Přikryl, J., Jha, D., Stefánsson, A., and Stipp, S. (2017). Mineral dissolution in porous media: an experimental and modeling study on kinetics, porosity and surface area evolution. Appl. Geochem. 87, 57–70. doi:10.1016/j.apgeochem.2017.05.004
Qi, N., Li, B., Chen, G., Fang, M., Li, X., and Liang, C. (2017). Optimum fluid injection rate in carbonate acidizing based on acid dissolution morphology analysis. Energy & Fuels 31 (12), 13448–13453. doi:10.1021/acs.energyfuels.7b02674
Sing, K. S. W. (1985). Reporting physisorption data for gas/solid systems with special reference to the determination of surface area and porosity (recommendations 1984). Pure Appl. Chem. 57 (4), 603–619. doi:10.1351/pac198557040603
Svensson, U., and Dreybrodt, W. (1992). Dissolution kinetics of natural calcite minerals in CO2-water systems approaching calcite equilibrium. Chem. Geol. 100, 129–145. doi:10.1016/0009-2541(92)90106-f
Wright, V. P. (2022). The mantle, CO2 and the giant Aptian chemogenic lacustrinecarbonate factory of the south Atlantic: some carbonates are made, not born. Sedimentology 69 (1), 47–73. doi:10.1111/sed.12835
Xu, Y., Jin, Z., Zhang, F., Gou, L.-F., Li, C., Wang, J., et al. (2024). Intensified carbonate weathering during storm events in a highly-erosion river catchment. J. Hydrology, 642–0022. doi:10.1016/j.jhydrol.2024.131860
Xue, Y., Ning, Z., Kong, F., Qiu, D., Liu, Y., and Jiang, X. (2022). Water-sealing performance assessment of the water curtain system in underground water-sealed oil-storage caverns. Environ. Earth Sci. 81, 172. doi:10.1007/s12665-022-10294-z
Zhang, C. (2011). Carbonate rock dissolution rates in different landuses and their carbon sink effect. Sci. Bull. 56, 3759–3765. doi:10.1007/s11434-011-4404-4
Zhang, J., Chu, X., Fu, H., Zhang, Q., and Zong, S. (2024). Investigating the acid erosion characteristics of carbonate rocks under hydrodynamic action. ACS Omega 9 (17), 18922–18931. doi:10.1021/acsomega.3c08557
Zhang, S. Q., Abdallah, K. B., Li, L., Hamdi, E., and Liu, J. (2025). Multiphase flow controlled by synergistic injection-production pressure: enabling CO2 geo-sequestration with additional gas recovery from vertically heterogeneous depleted shale reservoirs. Fuel 398, 135591. doi:10.1016/j.fuel.2025.135591
Keywords: limestone, dissolution, flow velocity, fracture width, ion concentration
Citation: Xu D, Ma Y, Feng B, Fan M and Han Z (2025) The impact of water flow rate on the dynamic dissolution kinetics of fractured limestone formations. Front. Earth Sci. 13:1701477. doi: 10.3389/feart.2025.1701477
Received: 09 September 2025; Accepted: 03 October 2025;
Published: 22 October 2025.
Edited by:
Manoj Khandelwal, Federation University Australia, AustraliaReviewed by:
Zhengzheng Cao, Henan Polytechnic University, ChinaFu Helin, Central South University, China
Copyright © 2025 Xu, Ma, Feng, Fan and Han. This is an open-access article distributed under the terms of the Creative Commons Attribution License (CC BY). The use, distribution or reproduction in other forums is permitted, provided the original author(s) and the copyright owner(s) are credited and that the original publication in this journal is cited, in accordance with accepted academic practice. No use, distribution or reproduction is permitted which does not comply with these terms.
*Correspondence: Yuhang Ma, MTczOTAyOTgyNjBAMTYzLmNvbQ==