 XiaoShan Li1,2
 Kai Li
- 1Research Institute of Exploration and Development, PetroChina Xinjiang Oilfield Company, Karamay, China
- 2Key Labortary of Conglomerate Reservoir Exploration and Development, cnpc, Karamay, Xinjiang, China
- 3Xinjiang Uygur Autonomous Region Geological Research Institute, Xinjiang, China
Enhancing the efficient development of these low-permeability and ultra-low-permeability sandstone oil reservoirs is an important support for maintaining and increasing production in Xinjiang Oilfield. To explored the morphological characteristics of fractures created by fracturing-flooding, The true three-axis hydraulic fracturing and the equivalent hydraulic model in PFC2D were adopted. The result shows that with the increase of in situ stress, due to the capillary action, the corresponding flow rate for the fracture becomes lower. At the same time, the in situ stress inhibits the expansion of the fracture cracks. The distance that the cracks extend along the vertical principal stress direction gradually also decreases with the increase of in situ stress, while the area of micro-damage around the fracturing holes gradually increases. During the fracturing-flooding process, acoustic emissions will be generated, combined with the CT scan results, it can be obtained that fracturing-flooding will cause micro-damage around the fracture hole. And, the in situ stress magnitudes will also be conducive to the formation of micro-damage around the fracture holes.
1 Introduction
The low-permeability and ultra-low-permeability sandstone oil reservoirs in Xinjiang Oilfield have a large recoverable reserves, but a low production rate. Enhancing the efficient exploration of low-permeability and ultra-low-permeability sandstone oil reservoirs serves as a critical foundation for sustaining and increasing oil production in the Xinjiang Oilfield. The fracturing⁃flooding technique injects water into the oil reservoir at a high flow rate or near fracture pressure through hydraulic fracturing equipment or fracturing⁃flooding pumps. This creates a short and wide network of micro-cracks, enhancing the permeability of reservoir and replenishing the energy of reservoir. It has the functions of energy replenishment + seepage absorption + flooding + fracturing (as shown in Figure 1) (He et al., 2023). From the function of fracturing⁃flooding, it can be seen that the formation of wide and short fractures around the well is the main mechanism by which fracturing⁃flooding achieves the effect of increasing production. In recent years, fracturing-flooding technology has achieved a series of successful practices in the development of low-permeability oil reservoirs (Cai et al., 2023; Guo et al., 2022). However, the morphological characteristics of fractures created by fracturing-flooding are not well understood. Therefore, scholars have conducted extensive research on the distribution of fracture during the fracturing-flooding process.
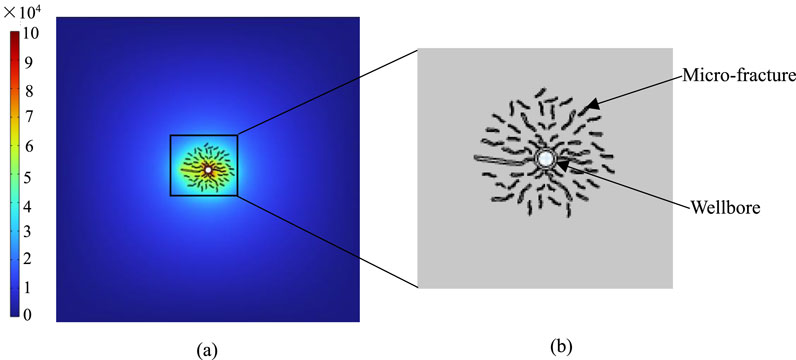
Figure 1. Schematic diagram of the mechanism of pressure drive, (a) distribution of pore pressure, (b) distribution characteristics of microcracks near the wellbore.
Compared with conventional hydraulic fracturing, fracturing⁃flooding injection has a greater impact on the pore pressure field of the reservoir, and the influence of fluid-solid coupling during the crack initiation and expansion process is more significant (Zhou et al., 2017). However, most of the experts just focused on the hydraulic fracturing process. Fan and Zhang (2014) based on the experiments to study the influence of injection rate and fluid viscosity on the morphology of hydraulic fractures and the hydraulic pressure, it was shown that as the injection rate and fluid viscosity increased, the complexity of the hydraulic fractures decreased, and straight single fractures were formed. Fu et al. (2024) established a large-scale hydraulic fracturing technology that quantitatively relates to the cementation performance of natural fractures. They identified three simple modes regarding interactions between hydraulic fractures and natural fractures: namely, natural fracture opening, shearing, and crossing. Jiang et al. (2025) investigated the stress shadow effect in multi-hole hydraulic fracture propagation with varying borehole spacing while examining interactions among hydraulic fractures. Their results indicated a significant stress shadow effect during multiple fracture propagation phases, which notably influenced the path taken by these propagating fractures. Tan et al. (2023) performed true triaxial hydraulic fracturing experiments to simulate both hydraulic fracture propagation and penetration behavior. They studied how factors such as in situ stress conditions, injection rate variations, presence of natural fractures, and well type impact fracture growth dynamics. However, the crack evolution characteristics of fracturing⁃flooding and hydraulic fracturing are significantly different. Zhang et al. (2022) conducted a fracturing⁃flooding experiment to study the influencing factors of the fracture pressure. The results showed that the greater the injection rate, the greater the fracture pressure of the rock specimen. As the rock permeability increases, the fracture pressure decreases exponentially. As the confining pressure increases, the fracture pressure increases linearly. Sun et al. (2024) conducted five sets of experiments on fracturing-flooding and hydraulic fracturing utilizing natural sandstone within a true triaxial hydraulic fracturing platform. They examined the influence of injection rate on both the pressure during the fracturing-flooding process and the morphology of fractures, as well as analyzed how different injection methods affect fracture morphology. The findings revealed that during the fracturing-flooding process, there were distinct initiation pressure and rupture pressure observed. The development of fractures was characterized by three stages: elastic deformation, micro-fracturing, and unstable rupture.
Due to its economic efficiency and repeatability, numerical simulation has garnered significant attention from scholars in recent years (Lyu et al., 2023; Wang et al., 2023). Through numerical simulation methods, the expansion characteristics of hydraulic fracturing can be observed comprehensively and vividly, thereby facilitating the exploration of fracture mechanisms. The finite element method is widely used in simulating the fracturing process due to its high computational efficiency. Sarmadi et al. (2023) employed phase-field theory within the framework of finite element methods to analyze toughness-dominated hydraulic fracture propagation in layered heterogeneous rocks. Song et al. (2023). Established a fractured reservoir model utilizing ABAQUS to investigate the influence of crack deformation parameters on hydraulic fracturing. The study revealed that the initiation pressure of hydraulic fractures increases with factors such as horizontal stress difference, crack bonding strength, injection rate, and fracturing fluid viscosity; conversely, it decreases with increasing normal and shear stiffness of cracks. Zhou et al. (Zhou et al., 2025) developed a coupled thermal-hydraulic-mechanical-fatigue damage model for fracture propagation during soft hydraulic fracturing in hot dry rock, taking into account thermos-poroelastic effects within the rock, the constitutive relationship governing fatigue deterioration under cyclic loading, elastic-brittle failure criteria, and wellbore stress superposition effects. Li et al. (2025) constructed a series of large-scale three-dimensional numerical models using ABAQUS finite element software to analyze the distribution of induced stresses resulting from both hydraulic fractures and bedding fractures. Wang X. et al. (2024) established a dual medium model that accounts for anisotropic characteristics and designed multiple sets of conventional water injection transitions alongside multi-cycle fracturing-flooding operations. The results demonstrated that accumulated oil production from multi-cycle fracturing-flooding exceeds that achieved through conventional water injection.
Discrete element method has received extensive attention in recent years because it can simulate the crack propagation process well. Yin et al. (2023) utilized a fluid–solid coupling model in PFC2D to establish a discrete element method (DEM) model for hydraulic fracturing in shale reservoirs. Their findings indicated that coalescence of interbedding fractures is the primary factor affecting the formation of a fracture network within the vertical section of shale reservoirs. Wu et al. (2023) developed four distinct simulation models by integrating combined finite discrete element methods with various discrete fracture networks (DFNs). Their study revealed that conventional DFN approaches may underestimate bending propagation characteristics and fracturing time while overestimating tensile failure proportions when applied to relatively homogeneous and heterogeneous models. Wang et al. (Wang YW. et al., 2024) simplified layered reservoirs to a transversely isotropic medium and created a model aimed at accurately estimating borehole deformation while examining various factors affecting borehole deformation, fracture initiation pressure, and initiation angle. Li et al. (Li et al., 2022) developed a discrete fracture network model for a shale reservoir located in the southeastern Ordos basin. The findings revealed that preexisting discontinuities significantly influence fracture complexity; they often act as barriers to fracture growth, resulting in reduced fracture area and elevated fluid pressure during fracture extension. Shi et al. (Shi et al., 2024) investigated the stress induced by natural fractures under both open and closed states, examining the interactions among open and closed natural fractures, reservoirs, hydraulic fractures, and the corresponding evolution of fracture properties. Zhao et al. (Zhao et al., 2025) simulated the real-time dynamic expansion process of micro-level fractures during hydraulic fracturing, integrating this with numerical simulations of well pressure dynamics to optimize hydraulic flooding parameters. Their results indicated that higher displacement correlates with increased pressure near the bottom of the well; however, there was minimal variation in spreading area.
Previous research has sufficiently addressed hydraulic fracturing. However, the emerging technology of fracturing-flooding still presents numerous challenges (Cao et al., 2024). Therefore, this paper first conducts experiments to investigate the fracture characteristics of specimens subjected to both hydrofracturing and fracturing-flooding processes. Subsequently, numerical simulation methods are employed to analyze crack distribution characteristics and examine the mechanisms of fracture generation from a mesoscopic perspective.
2 Experimental design and modeling produce
2.1 Specimen preparation
Natural sandstone with a side length of 100 mm was selected as the experimental specimen. Its porosity is measured at 9.34%, categorizing it as low-porosity sandstone. Additionally, the permeability of this sandstone is relatively low, recorded at 5.04 mD. The relaxation time (T2) is directly proportional to the pore radius; thus, the distribution characteristics of cracks can be analyzed through the amplitude corresponding to the relaxation time. As illustrated in Figure 2a, it is evident that the pores within the rock core are predominantly micro-pores. The relaxation curve exhibits a single peak, with maximum signal intensity occurring around a relaxation time of 10.72 m. Through triaxial compression experiments, we obtained stress-strain curves (as shown in Figure 2b), from which strength and deformation parameters were derived. The uniaxial compressive strength was determined to be 29.73 MPa, with cohesion at 13.27 MPa and an internal friction angle of 32.48°. The elastic modulus was calculated to be 12.1 GPa, while Poisson’s ratio was found to be 0.24. A fracturing hole measuring 50 mm in length and having a radius of 9 mm was established parallel to σV direction (see Figures 2c,d). Subsequently, a fracturing pipe was inserted into this hole and sealed using AB glue (refer to Figure 2e).
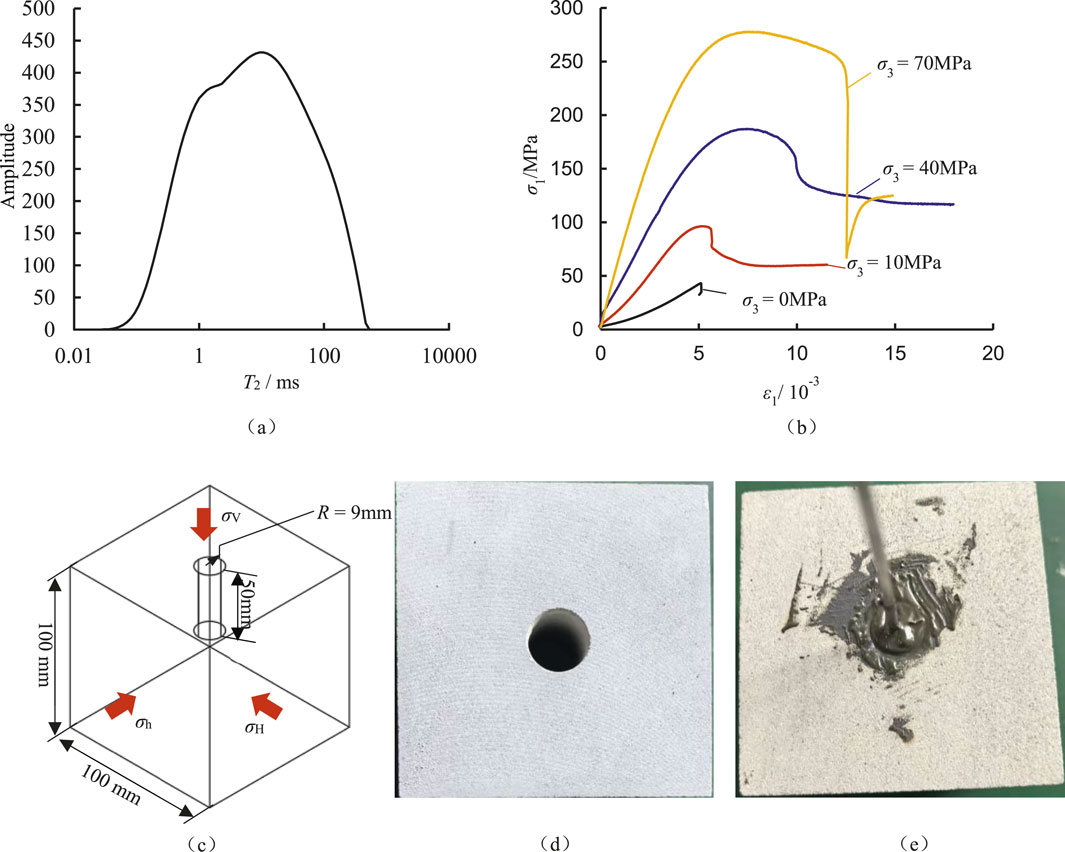
Figure 2. Specimen preparing for fracturing. (a)T2 relaxation time of sandstone. (b) Stress-strain curve. (c) Dimension of specimen. (d) Inserted the fracturing pipe. (e) Inserted the fracturing pipe.
2.2 Testing system
Experiments were conducted using the self-developed true triaxial hydraulic fracturing equipment by Xinjiang University. This equipment can carry out true triaxial fracturing experiments of different media (water, gas, supercritical CO2) under real-time high-temperature conditions. It contained oil pump, controller, loading platform and pore pressure loading module, as shown in Figure 3. The maximum gas pressure can reach 80 MPa, and the water pressure is 120 MPa. The simulated formation pressure can be 100 MPa with an accuracy of 0.1 MPa. A 16-channel acoustic emission monitoring instrument is equipped, allowing for three-dimensional acoustic emission positioning. The rock specimens can be designed in various sizes such as 100 × 100 × 100 mm, 150 × 150 × 150 mm, and 150 × 150 × 300 mm. During the experiment, acoustic emission is monitored simultaneously to monitor the fracture process of the specimen.
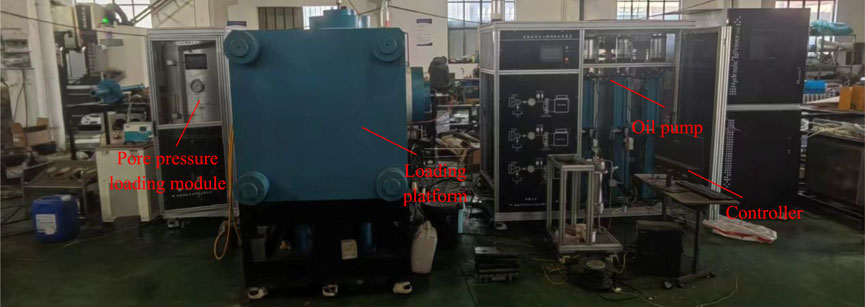
Figure 3. True three-axis hydraulic fracturing equipment.
The X-ray tube generates electrons through heating by the cathode, which are then accelerated by the high-voltage electric field and collide with the anode target material to produce X-rays. When the X-ray beam is directed in a fan-shaped or narrow beam form at an object, due to the different degrees of absorption of the rays by different substances, the intensity of the penetrated X-rays received by the detector array can be converted into an electrical signal and digitized to obtain the distribution characteristics of the fractures within the rock mass. This time, the X5000-X-ray CT system from the North Star Imaging Company was used, as shown in Figure 4. This equipment can scan components with a maximum size of 81 cm × 121 cm. The system adopts a dual X-ray tube configuration (including a 225 kV microfocus and a 450 kV small focus X-ray source) and a dual DDA (plasma detector)/LDA (linear array detector) detector configuration.
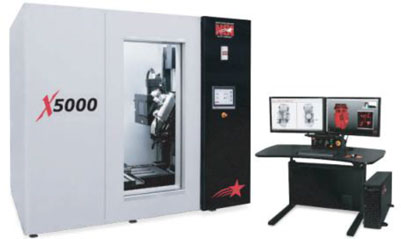
Figure 4. CT scanning equipment (CT scanning equipment).
2.3 Fracture testing procedure
Before conducting the fracturing test, a triaxial stress loading was carried out first. The triaxial stresses were set as σV = 95 MPa, σH = 80 MPa, σh = 50 MPa and σV = 45 MPa, σH = 40 MPa, σh = 25 MPa. To obtain the initiation and fracture pressure, different injection rates for fracturing are adopted after the triaxial stress is loaded to the set value. The injection rates are set at 1.0 mL/min, 2 mL/min, 4 mL/min, 6 mL/min and 8 mL/min. Each level maintains a stable pressure until the final fracture occurs. Based on the change of hydraulic pressure over time, the initiation pressure and fracture pressure are obtained. During the experiment, acoustic emission events are monitored simultaneously. After obtained the initiation and fracture pressure, start the fracturing⁃flooding experiment. Inject water at a constant flow rate. When the pressure reaches the initiation pressure, stop the injection. When the pressure drops to 60% of the fracture pressure, then restart the injection. This process is repeated for five cycles.
2.4 Equivalent hydraulic model in PFC2D
To streamline the calculation process, an equivalent fracturing method is employed in PFC2D to simulate the fracturing dynamics. Upon initiating the fracturing process, an equivalent radial force is applied around the fracture holes, with its magnitude determined by multiplying the water pressure by the particle diameter, as described in Equation 1 and illustrated in Figure 5a. Following hydraulic crack propagation, the hydraulic pressure generated on newly formed crack surfaces further accelerates this propagation. Zhang et al. (2020) introduced a novel approach for applying equivalent hydraulic pressure on crack surfaces. In their model, hydraulic pressure is administered through adaptive discrimination and real-time tracking of newly created crack surfaces, under the assumption that consistent hydraulic pressure exists across all particles; thus, the force direction is represented as a vector from the crack center to each particle center. To monitor fluid pressure exerted on new crack surfaces (comprising two particles), a pair of equal and opposite pressure vectors Pw is applied to these fractured particles. Furthermore, Pw can be expressed as shown in Equation 2:
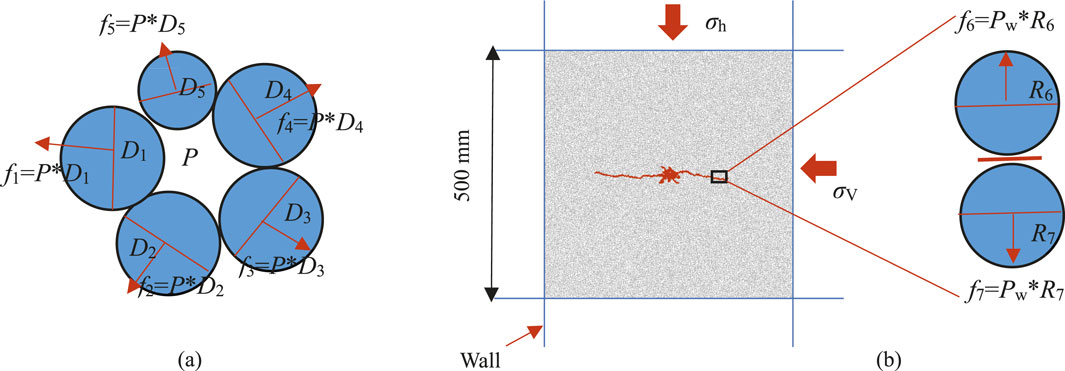
Figure 5. Force diagram of hydraulic fracturing. (a) Before fracturing. (b) After fracturing.
Where fn is the force applied on the particle numbered n, P is the hydraulic pressure, Dn is the diameter of the particle numbered n, Pw is the pressure on the hydraulic crack, δ is the maximum distance between the center of the fracturing hole and boundary of specimen, γ is the distance between hydraulic crack and the center of the fracturing hole, c is an undetermined coefficient, there defined as 1.0.
In the simulation of the fracturing process, a cubic specimen with dimensions of 500 mm × 500 mm is first established. Subsequently, wall elements are used at the boundaries of the model to apply in situ stress, as shown in Figure 5b.
3 Experimental result
3.1 Evolution of hydraulic pressure
Figure 6a illustrates the evolution characteristics of hydraulic pressure and acoustic emission events during the hydraulic testing of sandstone specimen 1# when σV = 90MPa, σH = 80MPa, σh = 50 MPa. It is observed that when the flow rate is less than 2 mL/min, the hydraulic pressure initially increases with an increase in flow rate, and the rate of increase continues to rise as the flow rate escalates. Subsequently, a stable stage is reached, primarily attributed to diffusion effects. The increase in pressure enhances these diffusion effects. When equilibrium between flow rate and diffusion rate is achieved, the pressure stabilizes. However, at a flow rate of 4 mL/min, there is a rapid rise in pressure. At this elevated flow rate, equilibrium cannot be attained with respect to diffusion effects, leading to specimen fracturing. Analysis of acoustic emission events reveals that there are virtually no occurrences in the early stages. However, once the flow rate reaches 4 mL/min and hydraulic pressure attains 43.5 MPa, some acoustic emission events are detected. This indicates that stress has reached its cracking initiation threshold at this point. Following an increase in pressure to 46.9 MPa, a rapid decline occurs alongside significant acoustic emission activity—this suggests that stress has now reached fracture pressure. Figure 6b presents the hydraulic pressure curve for sandstone specimen 2# during its fracturing process. A comparison with Figure 6a shows similar variation characteristics between both sandstones. The initial cracking pressure for sandstone specimen two# is recorded at 46.65 MPa while its fracture pressure stands at 48.31 MPa—values closely resembling those observed for sandstone specimen 1#. This similarity indicates good homogeneity within both specimens.
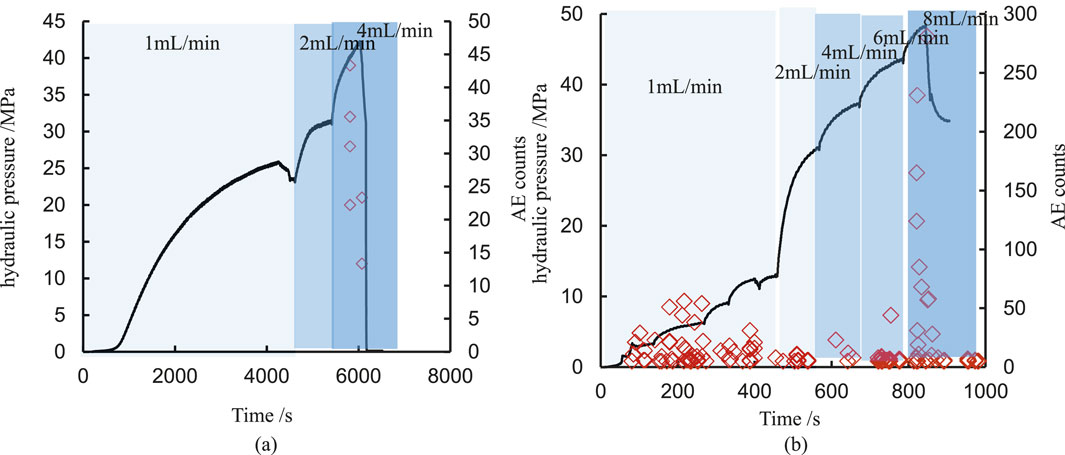
Figure 6. Evolution characteristics of hydraulic pressure and acoustic emission events during hydraulic processes (σV = 90MPa, σH = 80MPa, σh = 50 MPa). (a) Sandstone 1#. (b) Sandstone 2#.
To investigate the impact of in situ stress values on the fracturing characteristics of specimens, a variable injection rate fracturing experiment was designed under low in situ stress conditions, building upon previous experiments. In this scenario, the in situ stress was set to half of the previously mentioned value, with the stresses measured in three directions as follows: σV = 47.5 MPa, σH = 40 MPa, and σh = 25 MPa. The experimental results are presented in Figure 7a. Comparing these findings with those shown in Figure 6a reveals that under low in situ stress conditions, hydraulic pressure exhibits a stepwise increase corresponding to an increase in flow rate. Notably, the maximum flow rate observed is 6 mL/min, which exceeds that recorded under high in situ stress conditions. The elevation of in situ stress leads to the closure of certain flow channels to some extent, thereby reducing specimen permeability. Under identical flow rate conditions, hydraulic pressure within the specimen rises more rapidly; consequently, this makes the specimen more susceptible to fracture and results in a decrease of the corresponding flow rate when subjected to high in situ stress. Acoustic emission events indicate that a significant number will occur once hydraulic pressure reaches 26.3 MPa—this threshold represents the initiation pressure for fracturing. Afterward, as the fracturing pressure increases to 34.5 MPa, the hydraulic pressure experiences a rapid decline, while the corresponding number of acoustic emission events rises significantly. This observation indicates that a substantial fracturing crack has formed. In comparison to the acoustic emission events observed under high in situ stress conditions, there is a markedly higher number of acoustic emission events during failure under low in situ stress conditions. This suggests that fractures develop more intensely under low in situ stress conditions and that the resulting fracturing cracks are more pronounced. Simultaneously, we compared the differences in the fracturing process under identical stress conditions, as illustrated in Figure 7b. It is evident that the hydraulic pressures for both cases increase incrementally with rising injection rates. Furthermore, for sandstone specimen 4#, the initiation and fracture pressures are recorded at 34.5 MPa and 36.93 MPa respectively; notably, this difference is minimal.
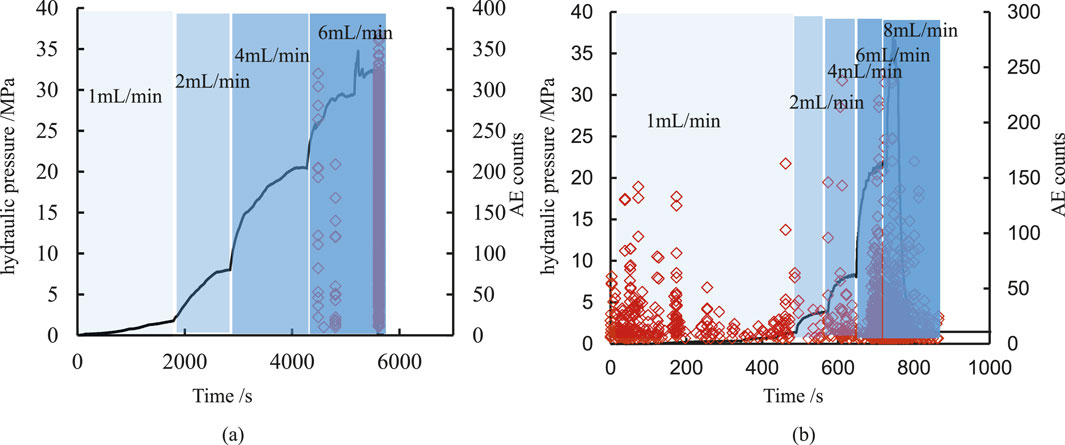
Figure 7. Evolution characteristics of hydraulic pressure and acoustic emission events during hydraulic processes (σV = 45MPa, σH = 40MPa, σh = 25 MPa). (a) Sandstone 3#. (b) Sandstone 4#.
It can be seen from Figures 6, 7 that although the two specimens are under the same in situ stress, the corresponding flow rates at the time of their rupture are different. This is mainly due to the heterogeneity of the specimens. The porosity of the specimens is in a cubic relationship with the flow rate, and the change in porosity has a significant impact on permeability, which leads to the different flow rates at the time of rupture for different specimens. However, the rupture pressure is linearly related to the in situ stress and the tensile strength of the specimens so the rupture pressures of the two are similar.
Figure 8a illustrates the evolution characteristics of hydraulic pressure and acoustic emissions during the fracturing-flooding processes under triaxial stress conditions of σV = 90 MPa, σH = 80 MPa, and σh = 50 MPa. It is observed that the hydraulic pressure initially increases slowly, followed by a linear rise; as it approaches the set value of 35 MPa, the increase slows once more. Upon cessation of injection, there is a rapid decline in hydraulic pressure. When it reaches the set value of 27 MPa, injection is resumed, resulting in a rapid increase in hydraulic pressure at this stage. This fracturing-flooding process is repeated five times while simultaneously recording acoustic emission evolution characteristics. Analysis of these characteristics reveals that during the initial injection phase, there are almost no recorded acoustic emissions. In contrast, during the first cycle of fracturing-flooding, only a limited number of acoustic emissions are detected. However, with an increasing number of cycles in the fracturing-flooding process, there is also an observable rise in acoustic emission events. This trend suggests that cyclic injections may induce damage within the specimen; such damage becomes increasingly pronounced with each successive cycle. Notably, micro-crack damage zones around fracture holes may develop at this juncture. Figure 8b presents similar data regarding hydraulic pressure and acoustic emission evolution characteristics obtained from triaxial stress tests conducted under conditions where σV = 45 MPa, σH = 40 MPa, and σh = 25 MPa. It can be noted that fluctuations in hydraulic pressure correspond to detectable levels of acoustic emission events.
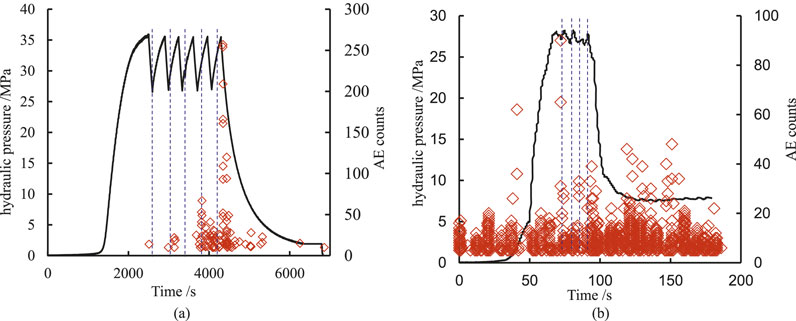
Figure 8. Evolution characteristics of hydraulic pressure and acoustic emission events during fracturing⁃flooding processes (σV = 90MPa, σH = 80MPa, σh = 50 MPa). (a) σ V = 90MPa, σ H = 80MPa, σ h = 50 MPa. (b) σ V = 50MPa, σ H = 40MPa, σ h = 25 MPa.
3.2 Crack distribution characteristic
Figure 9 illustrates the three-dimensional CT morphology of the specimens following fracturing along different paths. It is evident that no cracks or defects are present in the intact specimen. Under high in situ stress conditions, damage occurs at the edges of the specimen surrounding the loading plate, resulting in a distinct fracture on one side of the specimen. Conversely, under low in situ stress conditions, a fracture also emerges; however, its size is significantly larger compared to that observed under high in situ stress conditions. This observation aligns with previous acoustic emission data and further corroborates that elevated stress levels can inhibit the intensity of crack propagation to some extent. Notably, under fracturing-flooding effects, no discernible cracks were detected within the specimen.
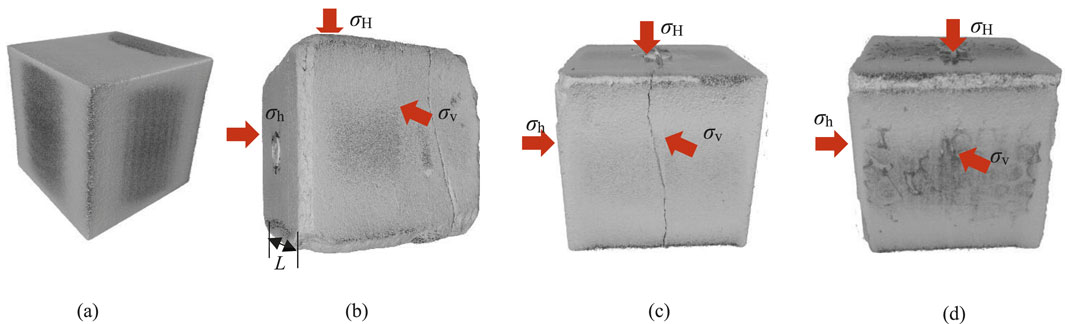
Figure 9. The three-dimensional CT morphology of the specimen after fracturing under different fracturing paths. (a) Intact specimen. (b) High in situstress. (c) Low in situstress. (d) fracturingandhybull;flooding.
To investigate the distribution of fracture cracks within the specimens under various fracturing paths more clearly, each specimen was sectioned at intervals of 10 mm, with the resulting sections illustrated in Figure 10. The red dots represent the low-density areas, which can make the cracks in the specimen more obvious. As shown in Figure 10a, the pixel gray values remain relatively constant throughout the intact specimen, indicating that it is close to a uniform mean value overall. However, certain areas exhibit brighter scattered points due to a higher density of quartz particles present within the specimen. In contrast, under high-stress conditions (Figure 10b), a distinct fracture is evident in the section. Observing the section at L = 50 mm reveals that this fracture initiates from the lower end of the fracturing hole and extends toward the boundary of the specimen. As one examines deeper sections where depth increases and fracture width gradually decreases, it becomes apparent that crack propagation exhibits non-uniform characteristics.
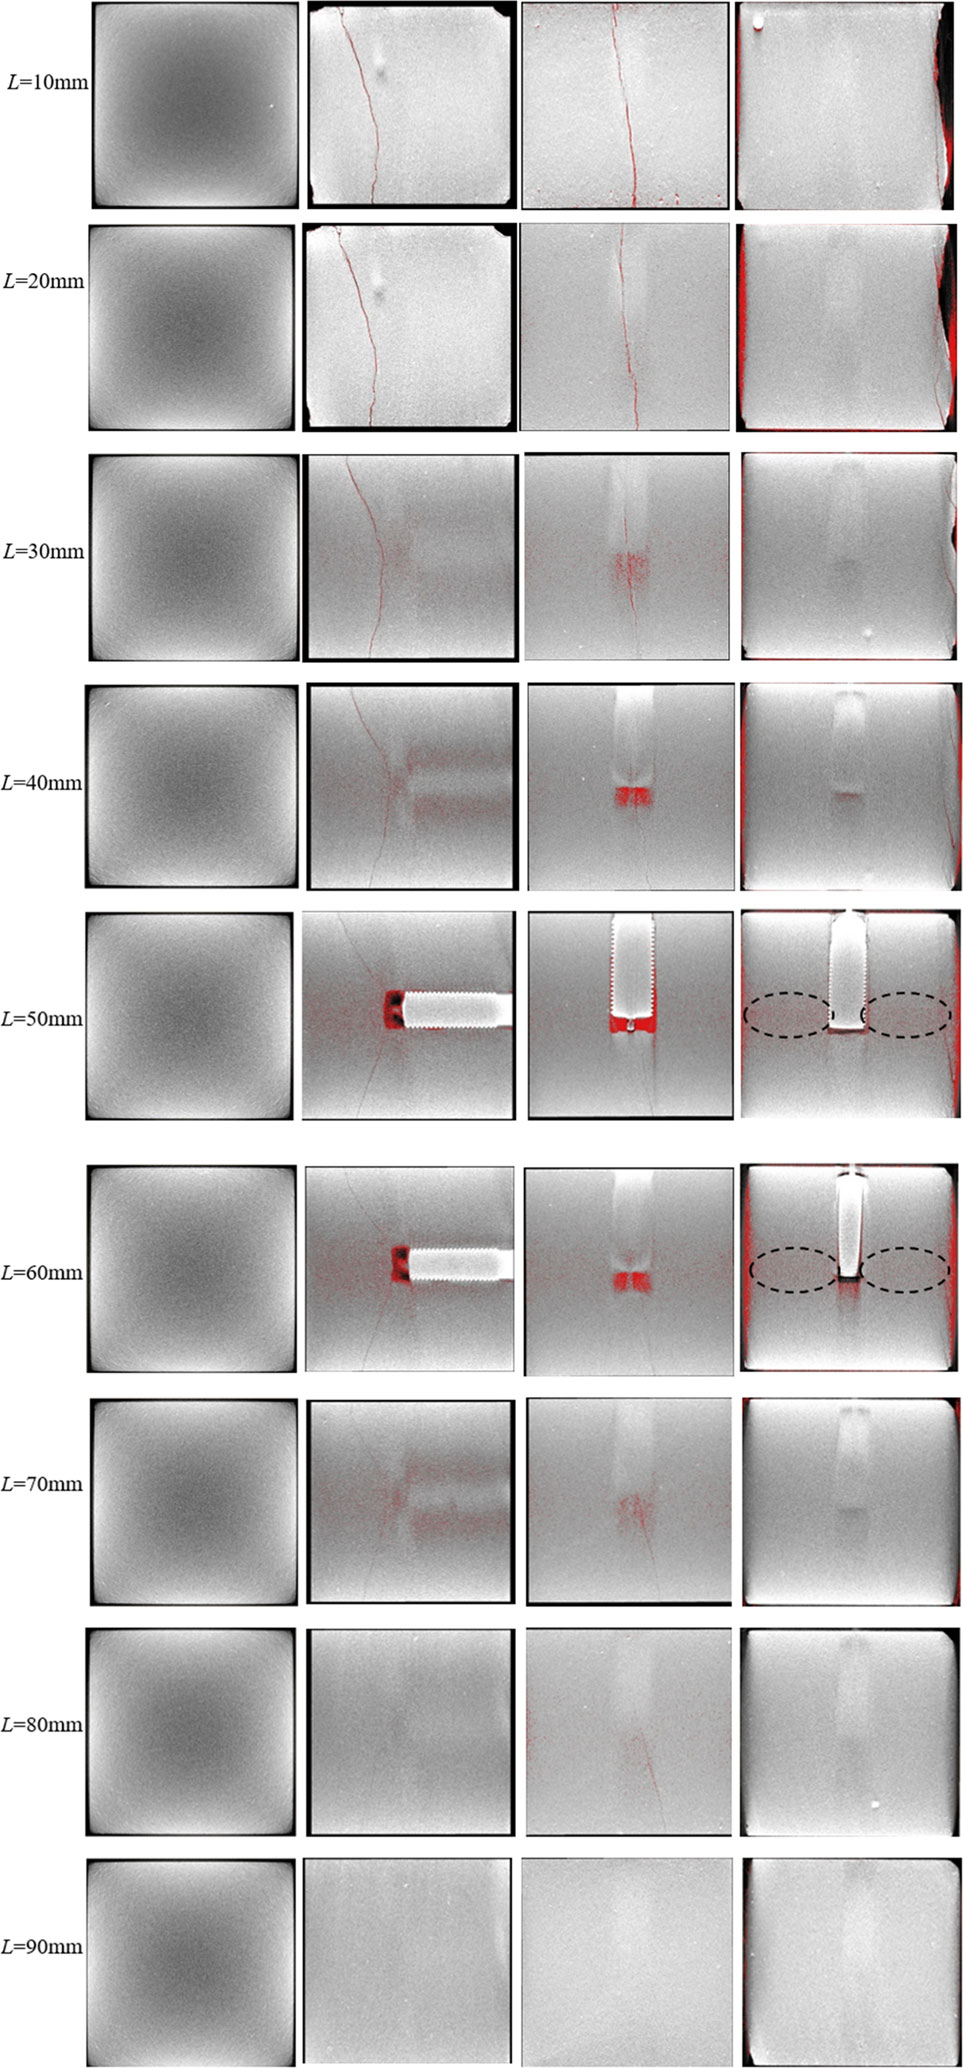
Figure 10. The effect of CT sectioning of specimens after fracturing under different fracturing paths. (a) Intact specimen. (b) High in situstress. (c) Low in situstress. (d) fracturingandhybull;flooding.
In the low in situ stress state (Figure 10c), a distinct vertical fracture is observed, extending along the direction of the fracturing hole and penetrating through the entire specimen. This fracture exhibits uniform expansion, with its width gradually decreasing as the depth of the section increases. Under fracturing-flooding conditions (Figure 9d), within a length of L = 30mm, the specimen resembles an intact specimen, showing no significant differences in pixel brightness throughout the specimen, which indicates good homogeneity. Between L = 40 mm and L = 60mm, certain spots emerge on the section; these spots are primarily concentrated around the fracturing hole, suggesting that changes have occurred in the pore structure and that pores have increased in specific areas. Similarly, beyond L = 70mm, this section appears similar to that of an intact specimen, indicating no damage has occurred at this location. When combined with acoustic emission evolution characteristics during the fracturing-flooding process, these observations further confirm that micro-damage develops around fracturing holes during this process.
4 Numerical simulation result
4.1 Verification of micro-parameters
In the numerical simulations pertaining to rock mechanics conducted in PFC2D, it is important to note that no constitutive relations or relevant elastic-plastic mechanical parameters associated with rock materials are incorporated. Consequently, the mechanical parameters derived from laboratory tests cannot be directly applied as microscopic parameters for simulation purposes. Currently, numerous studies have undertaken comprehensive investigations into various microscopic parameters within PFC, analyzing their influence on macroscopic mechanical behavior and conducting detailed sensitivity analyses of these microscopic parameters in rock models. These investigations have elucidated the impact of microscopic parameters in the PFC model on the macroscopic mechanical properties of test specimens (Tian et al., 2024). Therefore, building upon previous research findings, the microscopic parameters of rock specimens were calibrated using a “trial-and-error method” (Wu JY. et al., 2025; Wu J. et al., 2025). The specific parameter values are presented in Table 1.
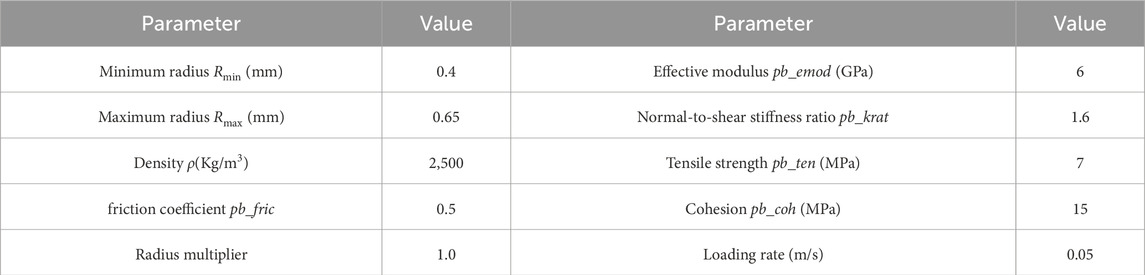
Table 1. Micro-parameters for PFC2D of sandstone.
Figure 11 presents a comparison between the numerical simulation and experimental results of the natural sandstone triaxial compression stress-strain curves. It is evident that confining pressure significantly influences the characteristics of these stress-strain curves. Under uniaxial compression conditions, the specimens exhibit brittle failure after reaching peak strength; however, as confining pressure increases, pronounced stress fluctuations occur near the peak, indicating notable plastic behavior. This plasticity becomes increasingly apparent with higher confining pressures. The numerical simulation results effectively capture this phenomenon. Moreover, it is observed that the peak strength of the specimens shows a marked increasing trend with rising confining pressure, which is also well-represented in the numerical simulations. In contrast, experimental findings indicate that while the elastic modulus of specimens increases with elevated confining pressure, this parameter remains nearly constant in numerical simulations despite similar increases in confining pressure. This discrepancy arises because during the process of generating numerical specimens, they are already compacted and do not undergo further compaction when subjected to additional confining pressures; consequently, their elastic modulus remains relatively unchanged.
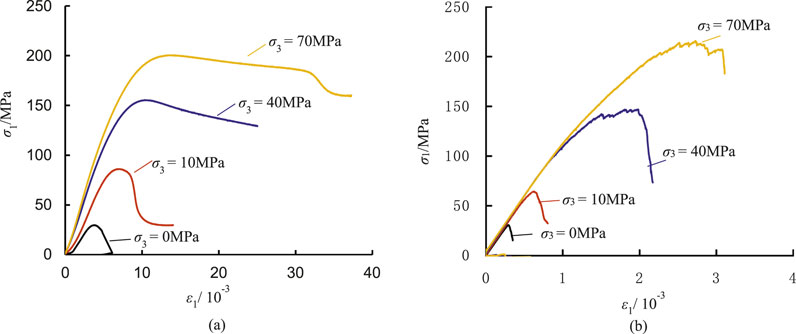
Figure 11. Comparison of numerical simulation and experimental results of stress-strain curves of natural sandstone. (a) Experimental result. (b) Numerical result.
Figure 12 illustrates the comparison between numerical simulations and experimental results regarding the evolution characteristics of hydraulic pressure. The hydraulic pressure exhibits a non-linear increase over time, followed by a rapid decline after reaching peak stress, as depicted in Figure 12a. The evolution of hydraulic pressure obtained through numerical simulation closely resembles that derived from experimental data, as shown in Figure 12b. Notably, the hydraulic pressure increases almost linearly with time before experiencing a swift drop post-peak stress; this behavior can be attributed to the fact that the numerical algorithm does not account for capillary effects. During the initial pressurization stage, no cracks were observed; however, there was a subsequent non-linear increase in hydraulic pressure, indicating that the numerical simulation method is more effective for monitoring crack evolution processes. In the numerical simulation results, microcracks also start to increase only after the hydraulic pressure reaches a certain value. However, acoustic emission, due to the need to filter out noise, cannot effectively monitor when there are few cracks. It can only effectively monitor when cracks suddenly increase.
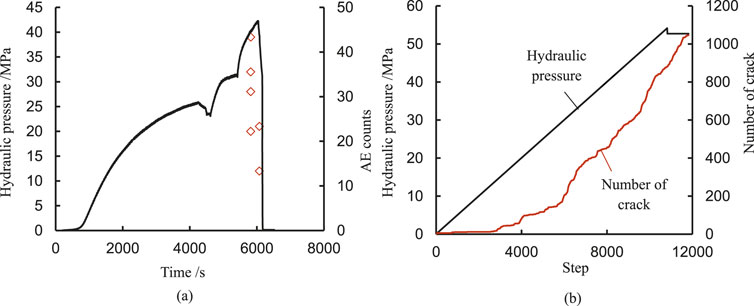
Figure 12. Comparison of numerical simulation and experimental results of evolution characteristics of hydraulic pressure. (a) Experimental result. (b) Numerical result.
Figure 13 illustrates the comparison between numerical simulations and experimental results regarding the characteristics of fracture distribution under hydraulic fracturing. It is evident that hydraulic fractures propagate along the direction of vertical principal stress while extending perpendicularly to the minimum horizontal principal stress. In addition to the fracturing cracks that extend in alignment with the vertical principal stress, micro-damage resulting from the fracturing process can also be observed around the fracture holes, as depicted in Figures 13a,b. The numerical simulation results further confirm that hydraulic fractures predominantly extend in a direction perpendicular to the principal stress, with numerous instances of micro-damage surrounding the fracture holes, as shown in Figure 13c. When combined with Figure 12, it becomes apparent that this numerical algorithm effectively simulates the fracturing process.
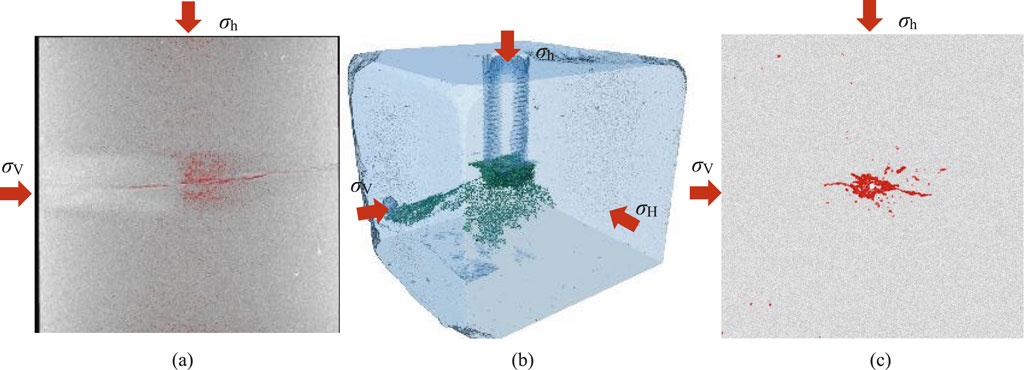
Figure 13. Comparison of numerical simulation and experimental results of fracture distribution characteristics. (a) CT slice. (b) CT three-dimensional reconstruction. (c) Numerical result.
4.2 Fracture characteristics of sandstone under hydraulic fracturing
To investigate the influence of in situ stress magnitude on fracture propagation characteristics, Figure 14 illustrates the evolution of hydraulic pressure and the number of cracks during the fracturing process under varying in situ stress magnitudes. It is observed that hydraulic pressure continuously increases as loading progresses, followed by a decrease to a certain extent after reaching a specific level. During the fracturing process, the number of fractures begins to increase gradually once hydraulic pressure attains a particular threshold, with a rapid escalation occurring as it approaches its peak value. Subsequently, when hydraulic pressure decreases and reaches equilibrium, the rate of increase in crack numbers significantly diminishes. As in situ stress increases, both overall hydraulic pressure and crack numbers exhibit an upward trend.
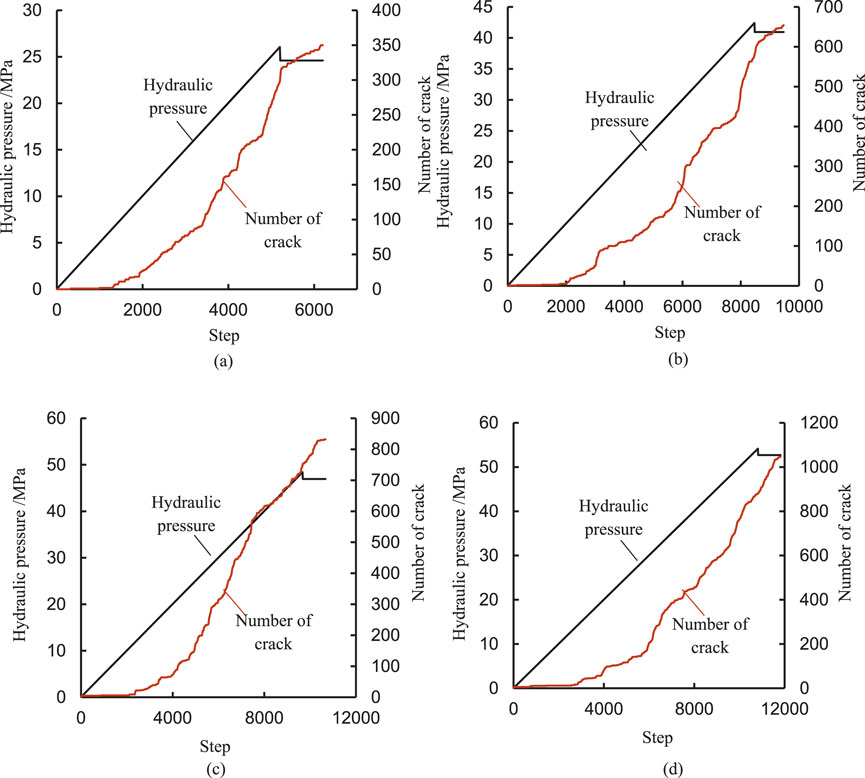
Figure 14. Evolution of hydraulic pressure pressure and crack number under different stress under hydraulic fracturing. (a) σV = 20MPa, σh = 12.5 MPa. (b) σV = 40MPa, σh = 25 MPa. (c) σV = 60MPa, σh = 37.5 MPa. (d) σV = 80MPa, σh = 50MPa.
Figure 15 illustrates the crack patterns resulting from hydraulic fracturing under varying in situ stress magnitudes. Generally, the magnitude of in situ stress significantly influences the expansion pattern of fractures. When σV = 20 MPa and σh = 12.5 MPa, the crack distribution is relatively straightforward, characterized by tensile cracks that extend along the direction of vertical principal stress. However, additional cracks may also form around the fracture holes. The length of these fractures about 224.5 mm, while the width of cracks surrounding the fracture holes is recorded at 28.7 mm. In contrast, when σV = 40 MPa and σh = 25 MPa, there is minimal change in fracture length—approximately 228.5 mm—yet an increase in width around the fracture holes to 33.7 mm is observed. As we further increase to σV = 60 MPa and σh = 37.5 MPa, a slight reduction in crack length occurs to approximately 147.3 mm; concurrently, the width expands to reach 43.4 mm. Finally, with conditions set at σV = 80 MPa and σh = 50 MPa, we observe a further decrease in crack length to about 170.7 mm alongside an increase in width to approximately 47.1 mm. Through this analysis, it becomes evident that maintaining a constant ratio between maximum and minimum stress magnitudes while increasing their absolute values promotes the formation of an elliptical fracture network.
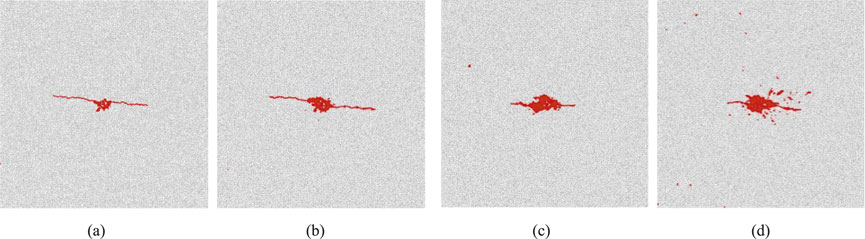
Figure 15. The crack patterns of hydraulic fracturing under different in situstress. (a) σV = 20MPa, σh = 12.5 MPa. (b) σV = 40MPa, σh = 25 MPa. (c) σV = 60MPa, σh = 37.5 MPa. (d) σV = 80MPa, σh = 50 MPa.
4.3 Fracture characteristics of sandstone under fracturing⁃flooding
Figure 16 illustrates the evolution of hydraulic pressure and the number of cracks during the fracturing-flooding process under varying in situ stress magnitudes. It is evident that fracturing-flooding significantly influences the development of crack numbers. At lower levels of hydraulic pressure, the number of cracks remains nearly zero. As hydraulic pressure increases, there is a corresponding rise in the number of cracks observed. When hydraulic pressure reaches higher levels, the increase in crack numbers becomes rapid. Overall, as the fracturing-flooding process progresses, the number of cracks exhibits a stepwise increase pattern. Furthermore, with an increasing number of cycles, this increment in crack numbers becomes increasingly pronounced.
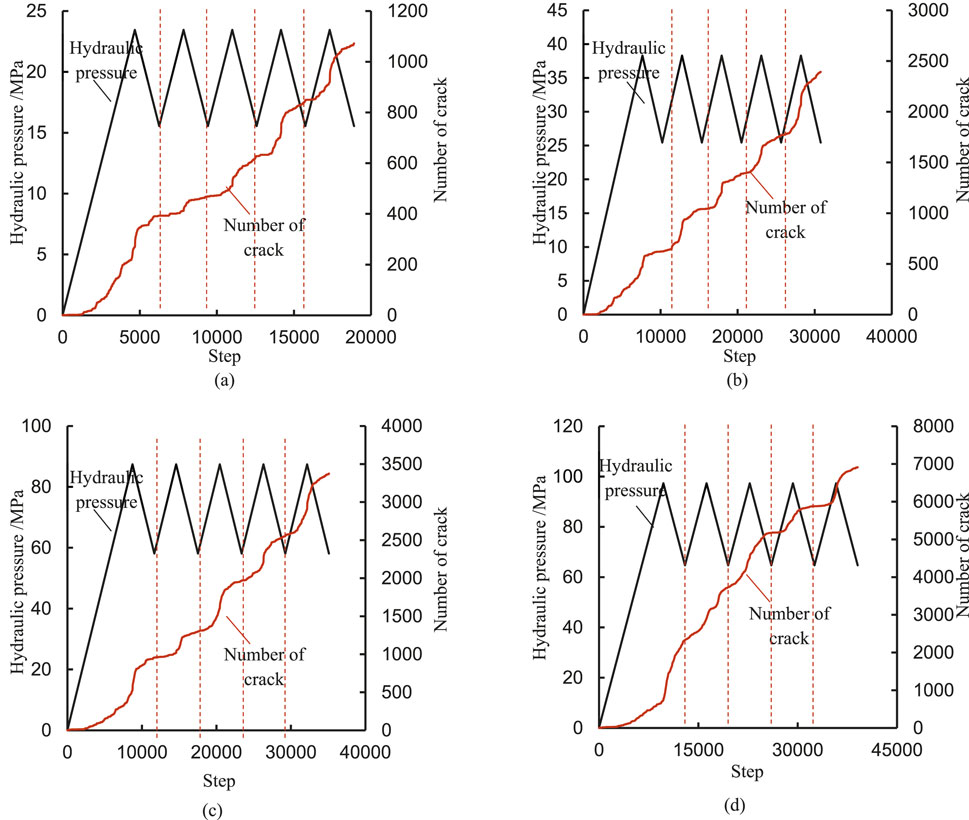
Figure 16. Evolution of hydraulic pressure pressure and crack number under different stress under fracturing⁃flooding. (a) σV = 20MPa, σh = 12.5 MPa. (b) σV = 40MPa, σh = 25 MPa. (c) σV = 60MPa, σh = 37.5 MPa. (d) σV = 80MPa, σh = 50 MPa.
The magnitude of in situ stress significantly influences the evolution of crack formation during the fracturing-flooding process. As the magnitudes of in situ stress increase, there is a general trend toward an increase in the number of cracks. Concurrently, the characteristic stepwise increase in fracture numbers at elevated in situ pressure levels becomes progressively less pronounced. This phenomenon can be attributed to the fact that as the value of in situ stress continues to rise, so too does the hydraulic pressure require for rupture within the formation. Furthermore, this escalation in hydraulic pressure may lead to some degree of damage within the formation itself, resulting in micro-damage prior to reaching higher hydraulic pressure levels and consequently initiating an increase in crack numbers.
Figure 17 illustrates the crack patterns resulting from fracturing-flooding under varying in situ stress magnitudes. A comparison with Figure 15 reveals that the fracturing-flooding primarily expands the damage area surrounding the fracturing holes. When σV = 20 MPa and σh = 12.5 MPa, the length of the fracturing crack measures 246.4 mm, while the width of the damage zone around the fracturing hole is recorded at 49.6 mm. In contrast, when σV = 40 MPa and σh = 25 MPa, these measurements increase to a crack length of 273.2 mm and a damage zone width of 78.72 mm. At higher stress levels, specifically when σV = 60 MPa and σh = 37.5 MPa, the length of the fracturing crack decreases slightly to 236.1 mm; however, this is accompanied by an increase in damage zone width to 84.12 mm. Finally, at maximum tested values where σV = 80 MPa and σh = 50 MPa, we observe a significant increase in both parameters: a fracture length of approximately 410.19 mm and a damage zone width reaching up to 88.1 mm. Overall, as stress values escalate, there is a consistent increase in both size and extent of damage around each fracturing hole; furthermore, elliptical characteristics within these damaged zones become increasingly pronounced.
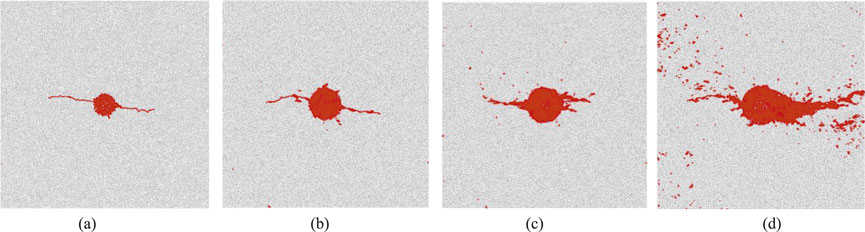
Figure 17. The crack patterns of fracturing⁃flooding under different in situstress. (a) σV = 20MPa, σh = 12.5 MPa. (b) σV = 40MPa, σh = 25 MPa. (c) σV = 60MPa, σh = 37.5 MPa. (d) σV = 80MPa, σh = 50MPa.
Figure 18 presents the crack evolution of specimen under different in situ stress condition, as the in situ stress increases, the number of cracks corresponding to the final rupture significantly increases. Under hydraulic fracturing, High in situ stress inhibits the generation of cracks. The growth rate of cracks gradually decreases as the in situ pressure increases, but the number of cracks significantly increases in the final rupture, as shown in Figure 18a. However, under fracturing⁃flooding, the rate of crack growth and the total number of cracks will continue to increase as the in situ stress rises, as shown in Figure 18b.
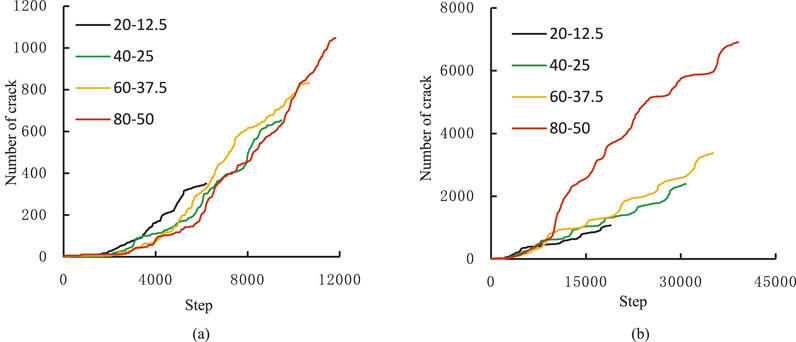
Figure 18. The crack evolution of specimen under different in situstress condition. (a) Under hydraulic fracturing. (b) Under fracturing flooding.
5 Conclusion
In this study, the fracture characteristics of low permeability sandstone subjected to hydraulic fracturing and fracturing-flooding were investigated through experimental methods and PFC2D simulations. Initially, a true triaxial hydraulic fracturing apparatus was utilized to conduct both fracturing and fracturing-flooding experiments under true triaxial conditions. The distribution characteristics of fractures within the specimens were subsequently analyzed using CT scanning technology. Following this, an equivalent hydraulic model in PFC2D was developed to examine the distribution patterns of cracks under varying in situ stress conditions. The primary conclusions drawn from this research are as follows.
1. As the injection flow rate increases, the hydraulic pressure rises in a step-like manner, reaching the peak and then rapidly decreasing, and the specimen is then fractured. With the increase of in situ stress, due to the capillary action, the corresponding flow rate for the fracture becomes lower. At the same time, the in situ stress inhibits the expansion of the fracture cracks. Under high in situ stress conditions, the acoustic emission phenomenon is not obvious, and the CT slices also indicate that the crack propagation is not significant.
2. During the process of fracturing and flooding, acoustic emissions are generated, with their frequency increasing as the number of fracturing-flooding cycles rises. When combined with the results from CT scans, this observation supports the conclusion that fracturing and flooding induce micro-damage in the vicinity of the fracture hole.
3. During hydraulic fracturing, as the magnitudes of in situ stress increase, the distance that cracks extend along the vertical principal stress direction gradually decreases. Concurrently, the area of micro-damage surrounding the fracturing holes progressively increases, which facilitates the formation of elliptical fracture zones.
4. The fracturing-flooding process induces micro-damage in the vicinity of fracture holes, and the number of fractures is expected to increase with each successive cycle of fracturing and flooding. Additionally, the magnitudes of in situ stress will facilitate the development of micro-damage around these fracture openings.
Data availability statement
The raw data supporting the conclusions of this article will be made available by the authors, without undue reservation.
Author contributions
XL: Conceptualization, Project administration, Resources, Writing – review and editing. KL: Conceptualization, Data curation, Writing – original draft, Writing – review and editing. SY: Funding acqcisition, Supervision, Writing – review and editing. QL: Conceptualization, Data curation, Methodology, Writing – review and editing. JL: Conceptualization, Investigation, Software, Writing – original draft. GS: Data curation, Formal Analysis, Funding acquisition, Writing – review and editing.
Funding
The author(s) declare that financial support was received for the research and/or publication of this article. The research was supported by the Youth Science and Technology Foundation Project of Xinjiang Oilfield (2024XJKT0108) and the Xinjiang Uygur Autonomous Region Tianshan Talent Program Funding Project (2023TSYCLJ0005).
Conflict of interest
Authors XL, KL, QL, JL, and GS were employed by PetroChina Xinjiang Oilfield Company. Authors XL, KL, QL, JL, and GS were employed by cnpc.
The remaining author declares that the research was conducted in the absence of any commercial or financial relationships that could be construed as a potential conflict of interest.
Generative AI statement
The author(s) declare that no Generative AI was used in the creation of this manuscript.
Any alternative text (alt text) provided alongside figures in this article has been generated by Frontiers with the support of artificial intelligence and reasonable efforts have been made to ensure accuracy, including review by the authors wherever possible. If you identify any issues, please contact us.
Publisher’s note
All claims expressed in this article are solely those of the authors and do not necessarily represent those of their affiliated organizations, or those of the publisher, the editors and the reviewers. Any product that may be evaluated in this article, or claim that may be made by its manufacturer, is not guaranteed or endorsed by the publisher.
References
Cai, X., Huang, Y., and Jin, Z. (2023). Research and practice of pressure flooding in low-permeability reservoirs of complex fault block in jiangsu oilfield. Complex Hydrocarb. Reserv. 16 (03), 343–346.
Cao, H., Zhang, G. Q., Li, S. Y., Zhou, D., Yu, C., and Sun, Q. (2024). Fracturing initiation and breakdown pressures in fracturing-flooding sandstone reservoirs. Rock Mech. Rock Eng. doi:10.1007/s00603-024-04186-w
Fan, T. G., and Zhang, G. Q. (2014). Influence of injection rate and fracturing fluid viscosity on hydraulic fracture geometry in coal. J. China Univ. Petroleum 38 (4), 117–123.
Fu, H. F., Huang, L. K., Hou, B., Weng, D., guan, B., Zhong, T., et al. (2024). Experimental and numerical investigation on interaction mechanism between hydraulic fracture and natural fracture. Rock Mech. Rock Eng. 57, 10571–10582. doi:10.1007/s00603-024-04101-3
Guo, J., Ma, L., and Lu, C. (2022). Progress and development directions of fracturing flooding technology for tight reservoirs in China. Acta Pet. Sin. 43 (12), 1788–1797.
He, Q., Peng, G., Liu, Y., and Shi, Q. (2023). Research on fracturing–flooding water injection technology in low permeability reservoir. Pet. Petrochem Today 31 (09), 26–29.
Jiang, Y. L., Liang, W. G., Lian, H. J., and He, W. (2025). Experimental study of hydraulic fracture propagation in multi-hole synchronous fracturing in horizontal Wells in sandstone. Int. J. Rock Mech. Min. Sci. 186, 106013. doi:10.1016/j.ijrmms.2024.106013
Li, Y. Y., Hu, W., Wei, S. Y., Li, L., Zhang, Z., and Song, S. (2022). Influence of preexisting discontinuities on hydraulic fracture complexity in a naturally fractured reservoir. Eng. Geol. 311 (20), 106919. doi:10.1016/j.enggeo.2022.106919
Li, Y., Yang, H. Q., Li, B. Q., and Li, Z. (2025). Interference behaviour between bedding planes and hydraulic fractures and its influence on the complex fracture network in shale. Rock Mech. Rock Eng. 58 (1), 181–201. doi:10.1007/s00603-024-04167-z
Lyu, Z., Pan, L. Y., and Hao, L. H. (2023). Numerical simulation of factors influencing hydraulic fracture propagation in sandstone-mudstone interbedded reservoirs. Xinjiang Pet. Geol. 44 (6), 729–738.
Sarmadi, N., Harrison, M., and Nezhad, M. M. (2023). Hydraulic fracture propagation in layered heterogeneous rocks with spatially non-gaussian random hydromechanical features. Rock Mech. Rock Eng. 57 (10), 8117–8140.
Shi, S. Z., Wang, M. X., Tang, W., Pan, Y., Jin, H., He, J., et al. (2024). Study of stress field induced by natural fracture and its influence on hydraulic fracture propagation. J. petroleum Explor. Prod. Technol. 14 (4), 1085–1099. doi:10.1007/s13202-024-01762-2
Song, X. T., Liu, H. Y., and Zheng, X. H. (2023). Numerical simulation of hydraulic fracture propagation in fractured reservoir using global cohesive zone method. Front. Phys. 11, 1272563. doi:10.3389/fphy.2023.1272563
Sun, Q., Zhang, Y. F., Yu, C. L., Sun, Z. G., Cao, H., and Yang, L. H. (2024). Experimental study on fracture initiation and propagation characteristics caused by pressure drive in low-permeability sandstone reservoirs. Petroleum Geol. Recovery Effic. 31 (6), 160–167.
Tan, P., Chen, Z. W., Fu, S. H., and Zhao, Q. (2023). Experimental investigation on fracture growth for integrated hydraulic fracturing in multiple gas bearing formations. Geoenergy Sci. Eng. 231, 212316. doi:10.1016/j.geoen.2023.212316
Tian, W. L., Yang, S. Q., Yin, P. F., Zhu, Z., and Huang, Y. (2024). Influence of different cooling treatments on the mechanical properties of granite under Brazilian splitting test by grain-based model 3D. Int. J. Numer. Anal. methods geomechanics 48 (4), 1046–1059. doi:10.1002/nag.3675
Wang, T., Wang, J., and Jiang, H. S. (2023). 3D geological simulation of hydraulic fracture propagation and frac⁃Hit preventionin horizontal shale gas Wells. Xinjiang Pet. Geol. 44 (6), 720–728.
Wang, X., Yu, W. J., Xie, Y. X., He, Y., Xu, H., Chu, X., et al. (2024a). Numerical simulation of the dynamic behavior of low permeability reservoirs under fracturing-flooding based on a dual-porous and dual-permeable media model. Energies 17, 6203. doi:10.3390/en17236203
Wang, Y. W., Wang, M., Niu, Z. H., Chen, Z., Min, R., and Zheng, J. (2024b). Fracture initiation pressure prediction of hydraulic fracturing for layered reservoirs considering borehole deformation. Front. Earth Sci. 11, 1334175. doi:10.3389/feart.2023.1334175
Wu, M. Y., Jiang, C. B., Song, R., Liu, J., Li, M., Liu, B., et al. (2023). Comparative study on hydraulic fracturing using different discrete fracture network modeling: insight from homogeneous to heterogeneity reservoirs. Eng. Fract. Mech. 284, 109274. doi:10.1016/j.engfracmech.2023.109274
Wu, J. Y., Yang, S., Williamson, M., Wong, H. S., Bhudia, T., Pu, H., et al. (2025a). Microscopic mechanism of cellulose nanofibers modified cemented gangue backfill materials. Adv. Compos. Hybrid Mater. 8, 177. doi:10.1007/s42114-025-01270-9
Wu, J., Zhang, W., Wang, Y., Ju, F., Pu, H., Riabokon, E., et al. (2025b). Effect of composite alkali activator proportion on macroscopic and microscopic properties of gangue cemented rockfill: experiments and molecular dynamic modelling. Int. J. Min. Metall. Mater 32, 1813–1825. doi:10.1007/s12613-025-3140-8
Yin, P. F., Yang, S. Q., Gao, F., Tian, W. L., and Zeng, W. (2023). Numerical investigation on hydraulic fracture propagation and multi-perforation fracturing for horizontal well in longmaxi shale reservoir. Theor. Appl. Fract. Mech. 125, 103921. doi:10.1016/j.tafmec.2023.103921
Zhang, Y., Huang, D., Cai, Z., and Xu, Y. (2020). An extended ordinary state-based peridynamic approach for modelling hydraulic fracturing. Eng. Fract. Mech. 234, 107086. doi:10.1016/j.engfracmech.2020.107086
Zhang, Y. F., Yang, Y., and Sun, Z. G. (2022). Physical simulation of fracturing-flooding and quantitative characterization of fractures in low-permeability oil reservoirs. Petroleum Geol. Recovery Effic. 29(4): 143–149.
Zhao, Z. T., Jiang, S., Lei, T., Wang, J., and Zhang, Y. (2025). Optimization of key parameters of fracturing flooding development in offshore reservoirs with low permeability based on numerical modeling approach. J. Mar. Sci. Eng. 13 (2), 282. doi:10.3390/jmse13020282
Zhou, D. W., Zhang, G. Q., and Liu, Z. B. (2017). Influences of pore-pressure field on multi-fracture propagation during the multi-stage cluster fracturing of tight sandstone. Acta Pet. Sin. 38 (7), 830–839.
Keywords: low-permeability sandstone, fracturing-flooding, equivalent hydraulic model, fractures, in situ stress, numerical simulation
Citation: Li X, Li K, Yang S, Luo Q, Liu J and Shi G (2025) Fracture characterization of low-permeability oil reservoirs under hydrofracturing and fracturing-flooding processes under varying in-situ stress conditions. Front. Earth Sci. 13:1701732. doi: 10.3389/feart.2025.1701732
Received: 09 September 2025; Accepted: 30 September 2025;
Published: 13 November 2025.
Edited by:
Jiangyu Wu, China University of Mining and Technology, ChinaReviewed by:
Jing Yang, Anhui University of Science and Technology Affiliated Fengxian Hospital, Fengxian, Shanghai, ChinaYuanchao Zhang, School of Foreign Language, Fuzhou University, China
Miao Chen, Shandong University of Science and Technology, Qingdao, China
Copyright © 2025 Li, Li, Yang, Luo, Liu and Shi. This is an open-access article distributed under the terms of the Creative Commons Attribution License (CC BY). The use, distribution or reproduction in other forums is permitted, provided the original author(s) and the copyright owner(s) are credited and that the original publication in this journal is cited, in accordance with accepted academic practice. No use, distribution or reproduction is permitted which does not comply with these terms.
*Correspondence: Kai Li, MTgyNjM2NTA4MjZAMTYzLmNvbQ==; Shuguang Yang, MTM5MTQ4OTIyNDZAMTYzLmNvbQ==