 Xiaohong Zhou1
 Yin Xing2*
- 1Nanjing Changtian Surveying and Mapping Technology Co., Ltd., Nanjing, China
- 2School of Geography Science and Geomatics Engineering, Suzhou University of Science and Technology, Suzhou, China
Currently, although various landslide susceptibility models can achieve high prediction accuracy, their results have significant differences in spatial distribution, resulting in high prediction uncertainty, which poses a challenge to optimizing assessment methods applicable to such complex geological hazards. In order to reduce uncertainty, this study proposes a machine learning ensemble modeling method that combines spatial consistency analysis. Taking Ruijin City in Jiangxi Province as the research area, based on the selection of 12 influencing factors and hyperparameter optimization, three algorithms including XGBOOST, Random Forest (RF), and Support Vector Machine (SVM) were used to generate landslide susceptibility maps. All models performed well, with AUC values ranging from 0.84 to 0.93. However, spatial consistency analysis shows that the spatial correlation between maps between models is only 0.78 to 0.84, indicating that although the prediction accuracy is high, there is still significant spatial heterogeneity and uncertainty. Therefore, a logistic regression (LR) fusion model based on historical landslides was constructed. Use the compilation results as the dependent variable and the results of the three models as the independent variables. The results indicate that XGBOOST contributes the most, followed by RF and SVM. By integrating the three prediction results, a comprehensive vulnerability map was finally obtained, which was superior to the single model in terms of spatial consistency (correlation coefficient 0.87–0.91) and prediction accuracy (AUC = 0.95). This research framework effectively reduces the uncertainty of landslide prediction and improves the reliability and accuracy of evaluation results.
1 Introduction
Landslides are highly destructive natural disasters that threaten human safety, socioeconomic stability, and ecological sustainability (Alcántara-Ayala, 2025; Wang X. et al., 2021; Ahmed, 2021). Their abruptness and uncertainty make timely landslide information crucial for risk management (Bao et al., 2022). Consequently, landslide susceptibility assessment has become a key tool for identifying potential hazards and supporting disaster prevention planning (Alam and Ray-Bennett, 2021; Dahmani et al., 2024; Li and Samsudin, 2024). Advances in remote sensing have significantly improved the availability of high spatio-temporal resolution Earth observation data, enhancing landslide susceptibility mapping. High-resolution satellite imagery enables the extraction of key environmental parameters—including topography, vegetation cover, geological structure, and hydrology—which are vital for landslide indication. Additionally, remote sensing plays a pivotal role in identifying and compiling historical landslide inventories, providing reliable data for disaster records (Sousa et al., 2021). As data quality continues to improve, methodological choices increasingly determine assessment reliability (Lu et al., 2024). Researchers have developed various models using GIS and remote sensing, such as weight of evidence, logistic regression, analytic hierarchy process, and evidential belief function. Recently, machine learning applications have grown substantially (Liu et al., 2022). Early introduced methods like K-nearest neighbor (KNN) have been followed by widely adopted algorithms including Logistic Regression (LR) and Support Vector Machine (SVM), valued for their adaptability (Shu and Ye, 2023). Advanced techniques like extreme gradient boosting (e.g., XGBoost) and ensemble learners such as Random Forests (RF) have demonstrated superior predictive performance (Kavzoglu and Teke, 2022a). However, differences in model selection, data sources, and human judgment often introduce substantial uncertainties in landslide susceptibility assessments (Wang and Nanehkaran, 2024). Since high-prediction landslide maps are critical for disaster decision-making, they must undergo rigorous validation before use (Guo et al., 2022). Currently, two main challenges remain: how to accurately evaluate susceptibility maps, and how to identify the optimal method combination to enhance efficiency. Conventional verification involves susceptibility simulation and result-field comparison, demanding reliability, robustness, and predictive capability from the method (Zhai et al., 2024; Ahmad et al., 2025a). Notably, even when models perform similarly on test datasets, their spatial predictions may still vary significantly (Ahmad et al., 2025b).
While different machine learning algorithms have been employed for landslide susceptibility mapping, the pixel-level consistency among these methods is not well studied. The spatial heterogeneity they produce further elevates assessment uncertainty (Tehrani et al., 2022; Ahmad et al., 2025c; Ahmad et al., 2021). Hence, this study introduces an integrated modeling approach to minimize prediction uncertainty. This is achieved by evaluating the consistency among three machine learning results and fusing them into a comprehensive susceptibility map. Our case study is Ruijin City, Jiangxi Province, where complex geological conditions, high rainfall, and documented landslide events make it a representative area. The method’s effectiveness and applicability will be further verified through field data and historical landslide records.
2 Materials and methods
This study consisted of three main phases. In the first stage, three machine learning algorithms, including XGBOOST, Random Forest (RF) and Support Vector Machine (SVM), were used to generate landslide susceptibility maps in the study area. In the second stage, the consistency of the spatial prediction patterns of landslide probability maps obtained by different methods was evaluated based on pixel-by-pixel correlation analysis. In the third stage, the output results of the three models are fused to synthesize a comprehensive landslide susceptibility regionalization map.
2.1 Study area
This study focuses on Ruijin City, Jiangxi Province (25°30′–26°20′N, 115°42′–116°22′E), a hilly and mountainous region prone to landslides. The area experiences high annual rainfall (>1,600 mm) and frequent human activities, which collectively contribute to slope instability (Figure 1). Historical landslides, triggered by heavy rainfall and construction, have repeatedly damaged infrastructure and threatened public safety. Therefore, landslide susceptibility assessment is crucial for disaster prevention and spatial planning in Ruijin.
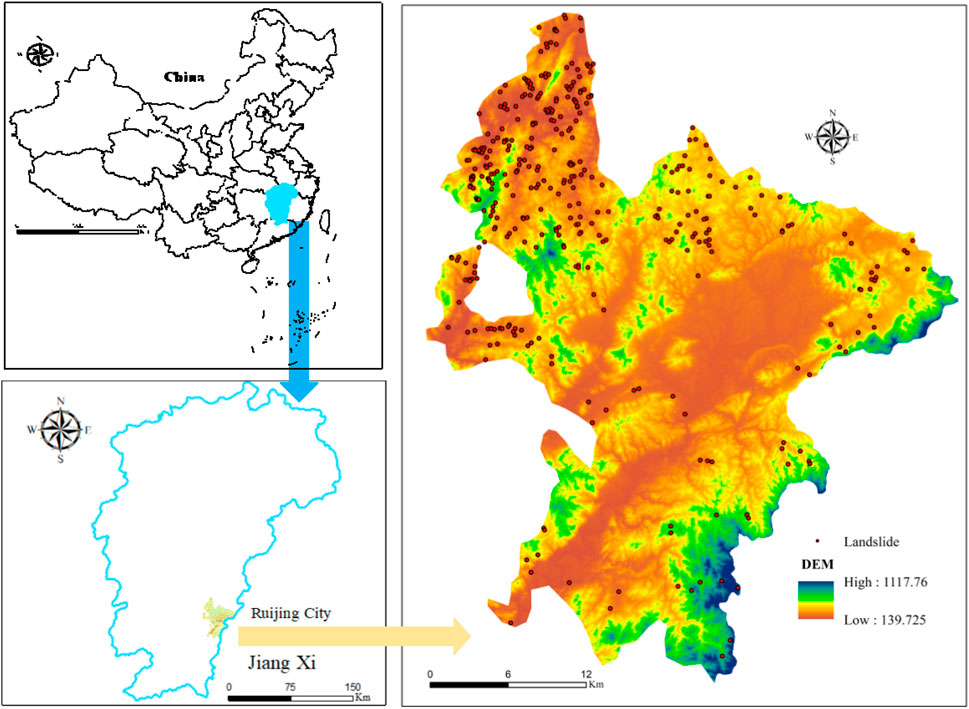
Figure 1. Regional geological location and landslide distribution in Ruijin city.
2.2 Landslide cataloging and mapping
Landslide inventory mapping is a fundamental step in landslide susceptibility assessment (Sharma et al., 2024). This study utilized the official landslide inventory map of Ruijin City, produced by the Jiangxi Provincial Geological Bureau. This map integrates historical landslide records from various sources, verified through GPS and field surveys. Additionally, our field investigations provided detailed reports on landslide movement types, distribution patterns, damages, displacement, materials, and triggers. The study is based on 370 identified landslide sites. Since landslide susceptibility mapping is a binary classification task, non-landslide samples are equally critical. Following (Liu et al., 2023; Batar and Watanabe, 2021), who outlined three methods for selecting non-landslide samples, this study adopted the second approach: randomly selecting points from areas with no landslide history. Using ArcGIS, we generated 10 sets of non-landslide data, each containing 370 points. The entire dataset (landslide and non-landslide) was then divided, with 70% allocated for model training and 30% for testing.
2.3 Landslide influencing factors
The effectiveness of landslide susceptibility mapping largely depends on the selection of influencing factors (Ullah et al., 2022; Sajid et al., 2022; Ahmad et al., 2024). In this study, the following principles were followed in selecting these factors (Zeng et al., 2021; Cui et al., 2022; Pacheco Quevedo et al., 2023): (1) the factor must have a known mechanical or statistical association with landslide occurrence; (2) the factor must be quantifiable and spatially mappable; (3) redundancy among factors should be minimized to reduce multicollinearity issues in the model; and (4) the factor must align with the geomorphological and geological characteristics of the study area (Table 1).

Table 1. Frequency ratio and related description of each influencing factor.
Based on the aforementioned principles, existing literature, and professional understanding of the study area, an initial set of factors encompassing topography, geology, hydrology, vegetation cover, and human activities was selected. It should be specifically noted that although rainfall is a key dynamic trigger for landslides, it was not directly incorporated into the model due to its limited spatial variability at the regional scale and the study’s focus on assessing long-term static susceptibility. Similarly, high-resolution soil moisture data and detailed construction activity data were excluded because they were difficult to systematically obtain and standardize across the study area. As an alternative, remotely sensed indices (e.g., NDBI) and distance-based factors (e.g., proximity to roads) were used to indirectly yet effectively represent the intensity and distribution of human activities. Ultimately, 12 influencing factors were identified for modeling (Table 1). All factors were derived from 30-m spatial resolution ALOS DEM and Landsat satellite imagery, processed via the Google Earth Engine platform. The following (Figure 2) provides a detailed description of each factor category:
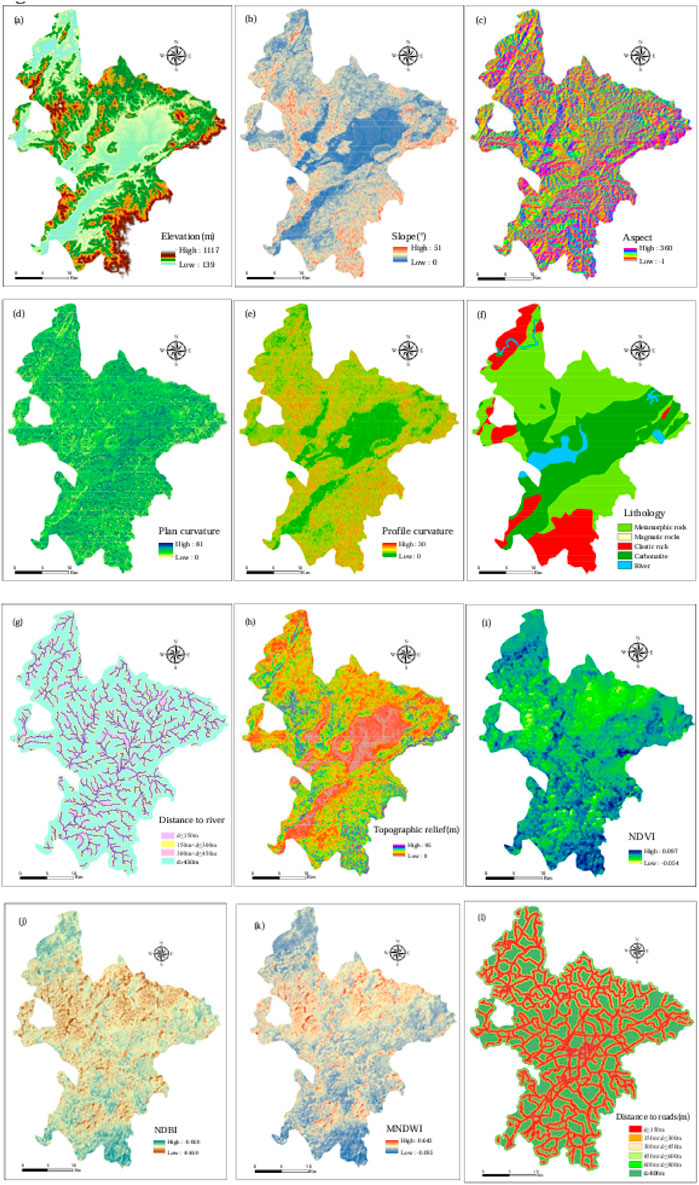
Figure 2. Basic environmental factors of landslide in Ruijin County: (a) Elevation; (b) Slope; (c) Aspect; (d) plan curvature; (e) profile curvature; (f) Lithology; (g) Distance to river; (h) Topographic relief; (i) NDVI; (j) NDBI; (k) MNDWI; (l) Distance to roads.
Topographic Factors: These include elevation, slope, aspect, plan curvature, profile curvature, and topographic relief. Collectively, they govern slope morphology, stress distribution, and surface drainage conditions, forming the intrinsic basis for landslide occurrence (Selamat et al., 2025; Kab et al., 2023; Saha et al., 2021). For instance, slope directly influences gravity-driven shear stress, while curvature relates to the convergence or divergence of surface materials.
Geological Factor: Lithology. Variations in the strength and permeability of different rock and soil types directly control slope stability and failure mechanisms.
Hydrological Factor: Distance to rivers. Riverbank erosion is a significant external force triggering landslides. A distance-to-river map was generated using the Euclidean distance algorithm.
Vegetation and Surface Cover Factors: This study incorporated three complementary remote sensing indices to comprehensively characterize the surface environment:
Normalized Difference Vegetation Index (NDVI): Quantifies vegetation density. Dense vegetation enhances soil shear strength through root reinforcement, while sparse vegetation areas are more prone to shallow landslides.
Modified Normalized Difference Water Index (MNDWI): Accurately extracts water bodies. Areas near water are not only threatened by lateral erosion but are also affected by dynamic groundwater levels that influence slope stability.
Normalized Difference Built-up Index (NDBI): Identifies built-up areas. This index effectively reflects the alteration and disturbance of natural slopes by human activities (e.g., land excavation, engineering loads). The combined use of NDBI, NDVI, and MNDWI holistically captures the spatial pattern of “vegetation-water-built-up” areas, providing a more integrated perspective on how human-environment interactions influence landslide risk.
Human Activity Factor: Distance to roads. Road construction often involves large-scale cutting and filling, significantly disrupting the natural equilibrium of slopes. A distance-to-roads map was generated using the Euclidean distance algorithm.
Prior to modeling, the variance inflation factor (VIF) for all 12 factors was calculated using the R platform to assess multicollinearity. As shown in Table 2, all factors had VIF values below 2.8, indicating no severe multicollinearity issues, thus confirming their suitability for subsequent modeling analysis.
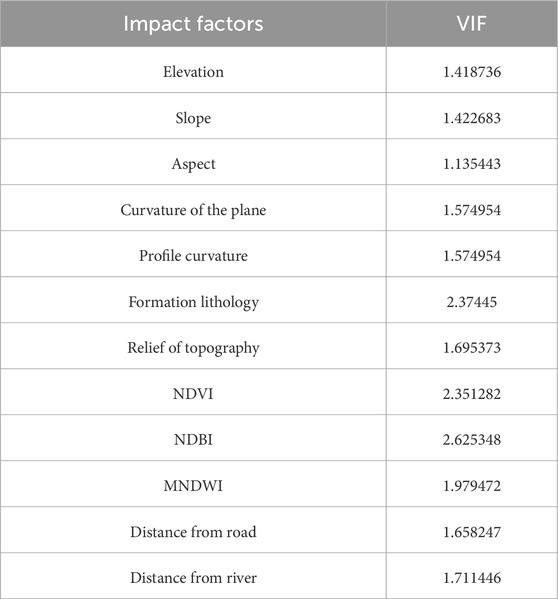
Table 2. Estimated variance inflation factors of landslide impact condition factors.
2.4 Multicollinearity analysis
Before modeling landslide susceptibility, it is necessary to test the correlation between various potential hazard factors to identify possible multicollinearity problems (Wang et al., 2023). To this end, with the help of the R language platform, this study calculated the variance inflation factor (VIF) for each of the selected 12 landslide impact factors, which is often used to evaluate the degree of collinearity between independent variables. A VIF value of more than 5 for a variable is generally considered to indicate significant multicollinearity. As shown in Table 2, the VIF values of all the factors in this study were below 2.8, which indicated that there was no significant collinearity problem between these variables and could be used for subsequent modeling analyses.
3 Modeling landslide susceptibility
3.1 Data preprocessing
In the GIS platform, the corresponding values of 12 influencing factors were extracted according to the spatial distribution of landslide sites and non-landslide sites. These factors included 8 continuous variables and 4 discrete variables. Discrete categorical variables were converted to composite binary feature forms, generating dummy variables that were consistent with the number of categories (Morales-Hernández et al., 2023). Specifically, one-hot encoding method is used for processing. For example, geological types contain 11 categories, and if a location belongs to one of these categories, this category is coded as 1, and the other categories are marked as 0. Other discrete variables are also coded in the same way. To further improve modeling efficiency, all continuous variables were standardized: the mean and standard deviation of each variable were calculated, and each observation was divided by the standard deviation after subtracting the mean. This process not only unifies the dimensions, but also helps to narrow the parameter search range of the optimization algorithm, thus speeding up the model training process.
3.2 Hyperparameter optimization
Hyperparameter optimization systematically evaluates different parameter combinations to identify the optimal configuration, thereby improving the prediction accuracy of machine learning models (Stuke et al., 2021). In this study, we implemented hyperparameter tuning using grid search with five-fold cross-validation on the training set. The resulting optimal hyperparameters were used for final model training and testing. For instance, the Random Forest model achieved best performance with 500 decision trees (Table 3). This sufficient number of trees helps integrate diverse predictions, mitigate the impact of individual tree randomness on susceptibility mapping, and enhance overall robustness. All hyperparameter settings, search ranges, and final values are documented in Table 2.
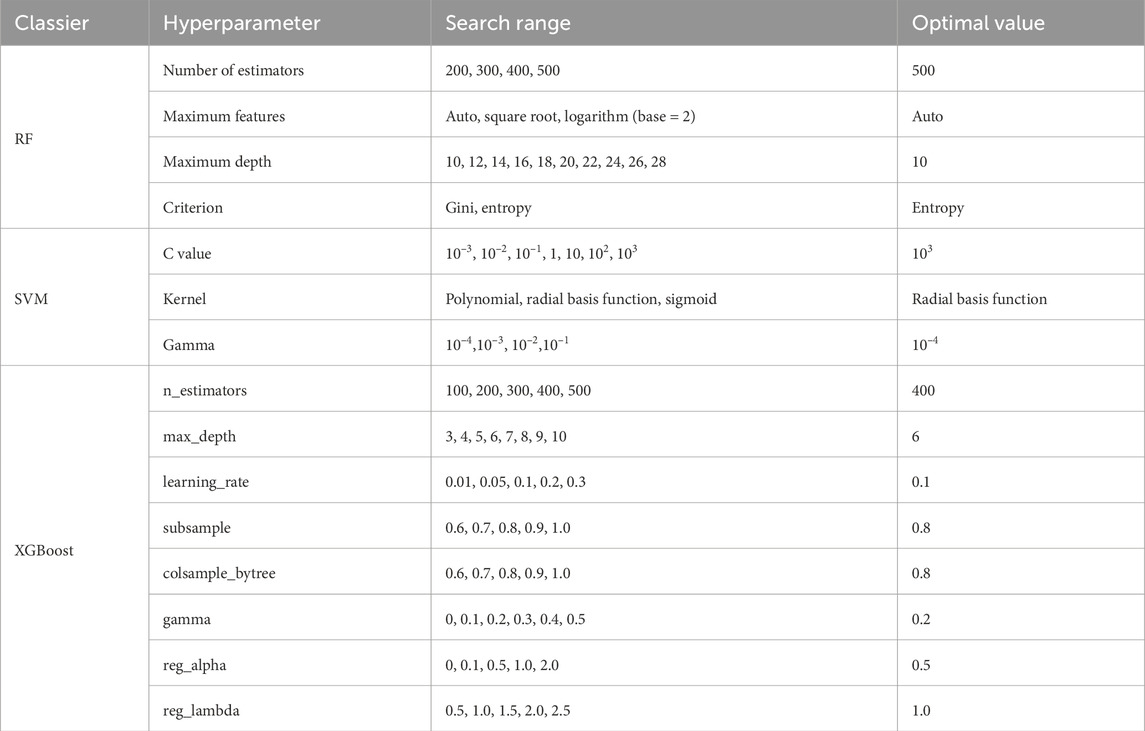
Table 3. Hyperparameters, search ranges, and optimal values of landslide susceptibility models based on machine learning.
3.3 Machine learning models
3.3.1 RF
As an ensemble learning algorithm, Random Forest (RF) has shown good performance in landslide susceptibility prediction in recent years (Wei et al., 2022; Kumar et al., 2023; Kavzoglu and Teke, 2022b). By constructing multiple decision trees and performing ensemble voting, the model can effectively deal with high-dimensional nonlinear data, and has excellent generalization ability and anti-overfitting characteristics. In the application of landslide prediction, RF model can comprehensively deal with a variety of environmental factors (such as elevation, slope, lithology, rainfall, etc.), generate diversified decision trees by Bootstrap sampling and random feature selection, and finally output the landslide potential of each region in the form of probability. The results show that RF can not only evaluate the importance of each influencing factor, but also stably generate high-precision prediction results in complex geographic environments, which provides a reliable basis for regional landslide risk management and land planning.
3.3.2 XGBOOST
XGBoost (Extreme Gradient Boosting) is a kind of efficient Gradient to promote integration algorithm, susceptibility in landslide prediction shows good performance (Lin et al., 2023; Wang S. et al., 2021). In this model, multiple decision trees are built iteratively, and each tree is dedicated to correcting the prediction error of the previous round, so as to gradually improve the overall prediction accuracy. XGBOOST can automatically deal with the complex interaction between features, and has good compatibility for continuous and categorical variables. It is suitable for integrating multi-source environmental factors (such as elevation, slope, lithology, rainfall, land cover, etc.) to assess landslide sensitivity. Its key advantages include regularization to prevent overfitting, built-in cross-validation, and parallel computing to accelerate the training process. In landslide prediction applications, XGBOOST can not only output the probability of landslide occurrence for each spatial unit, but also provide feature importance ranking to help identify key impact factors and enhance the interpretability of the model. Studies show that XGBoost is usually superior to traditional machine learning models (such as logistic regression or single decision tree) in dealing with high-dimensional geospatial data, which can more accurately depict the nonlinear relationship between landslides and driving factors, and provide high-precision prediction basis for regional landslide risk management and land planning.
3.3.3 SVM
SVM (Support Vector Machine, SVM) in landslide prone forecasts are widely used in dealing with high-dimensional nonlinear classification (Teng et al., 2024; Xu et al., 2024; Jaafari, 2024). The model by looking for the optimal hyperplane and maximizing in the feature space between the positive and negative samples (with the landslide) the classification of the interval, which have good generalization ability. When dealing with landslide prediction tasks, SVM can comprehensively utilize multiple environmental factors such as topography, geology, hydrologic and human activities, and map nonlinear relationships through kernel functions (such as RBF kernel) to effectively depict the complex interactions between landslide occurrence and influencing factors. The results show that SVM can maintain high classification accuracy in the case of limited sample size, and its robustness to noise data and clear mathematical derivation mechanism make it a reliable and interpretable modeling tool in landslide hazard assessment.
3.3.4 Performance evaluation methods
Model performance was evaluated using the receiver operating characteristic (ROC) curve and its area under the curve (AUC) as the primary criteria. The ROC curve was plotted using 30% of the test data, with the false positive rate (1 - specificity) on the x-axis and sensitivity (recall) on the y-axis. Sensitivity measures the model’s ability to correctly identify landslides, calculated as the proportion of true positives among all actual landslides. Specificity, the proportion of true negatives among all non-landslide samples, indicates how well the model excludes non-landslide areas. AUC values were interpreted as: 0.5–0.6 (poor), 0.6–0.7 (fair), 0.7–0.8 (good), 0.8–0.9 (excellent), and 0.9–1.0 (outstanding). Additional metrics derived from the confusion matrix—including accuracy, precision, recall, and F1-score—provided further validation of model performance.
3.3.5 Spatial consistency analysis and multi-model ensemble optimization for landslide susceptibility prediction
In order to analyze the consistency of the prediction results of different models, this study evaluated the consistency of landslide susceptibility maps generated by multiple machine learning algorithms in spatial distribution by pixel-by-pixel comparison. For four kinds of models of six possible combination of two, the Pearson correlation coefficient are calculated respectively. The coefficient is defined as the ratio of the covariance between the predictions of the two models and the product of their respective standard deviations, with values ranging from −1 to +1:0 for no correlation, less than ±0.29 for low agreement, ±0.30 to ±0.49 for moderate agreement, ±0.50 to ±1 (excluding ±1) for high agreement, and ±1 for perfect agreement. After complete the spatial consistency analysis, the further integration of the four machine learning model output, to generate an optimized integrated landslide prone figure. Integrated methods using logistic regression (LR) model, with dual landslide logging data (that is, the point with the landslide points) as the dependent variable, in four different forecast results as the independent variable of the model. The regression coefficients of each model output were obtained by fitting, and the landslide occurrence probability (P) of each pixel was calculated based on the Equation 1 in the Geographic Information System (GIS) platform, so as to obtain the comprehensive landslide probability distribution map of the study area.
Where,
Where
4 Results
4.1 Landslide prediction
Figure 3 shows the landslide susceptibility distribution maps generated based on three different machine learning methods in Ruijin City. In the GIS platform, all the output probability maps were divided into five susceptibility levels by using the natural breakpoint method: (1) very low susceptibility (0-0.1), (2) low susceptibility (0.11-0.3), (3) medium susceptibility (0.31-0.5), (4) high susceptibility (0.51-0.85), and (5) very high susceptibility (0.86-1). It can be seen from Figure 3 that there is a significant difference in the proportion of areas predicted by each model for high susceptibility regions. The total area of “high” and “extremely high” areas identified by XGBoost model accounted for the largest proportion, reaching 38.2%. However, the proportion of these three types of areas in the results obtained by the SVM model was the lowest, only 20.2%.
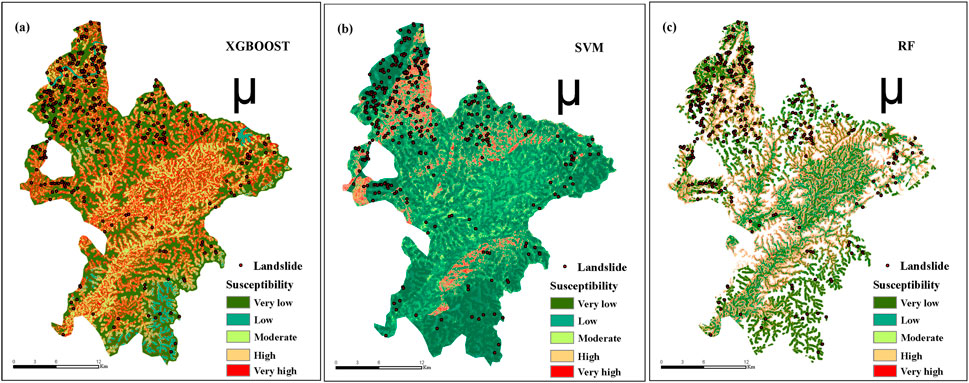
Figure 3. Landslide susceptibility maps drawn by three machine learning algorithms: (a) XGBOOST, (b) SVM, and (c) RF.
4.2 Model performance evaluation
To assess the performance of different landslide susceptibility model, this study randomly selected 30% of the data as a test set, and on the basis of constructing the performance comparison matrix (see Table 3). All the evaluation indicators showed that all the models showed high prediction accuracy. In terms of the overall classification accuracy, XGBOOST method performed the best, reaching 90.16%. This was followed by RF (88.39%) and SVM (84.28%). However, as a comprehensive performance index, the overall accuracy is difficult to identify the classification bias in specific categories. Therefore, in order to further test the consistency of the model in the discrimination of landslide points and non-landslide points, this paper additionally calculated the precision, recall and F1 score (Table 4). From the results, XGBOOST keeps leading in all indicators, and RF also performs stably and closely behind. Meanwhile, in terms of the area under the receiver operating characteristic curve (AUC), XGBOOST also ranked first with 0.930, while RF and SVM were 0.885 and 0.845, respectively (Figure 4). The excellent performance of RF and SVM models can be attributed to their ability to effectively capture the complex nonlinear relationship between regional geographical characteristics and landslide occurrence.
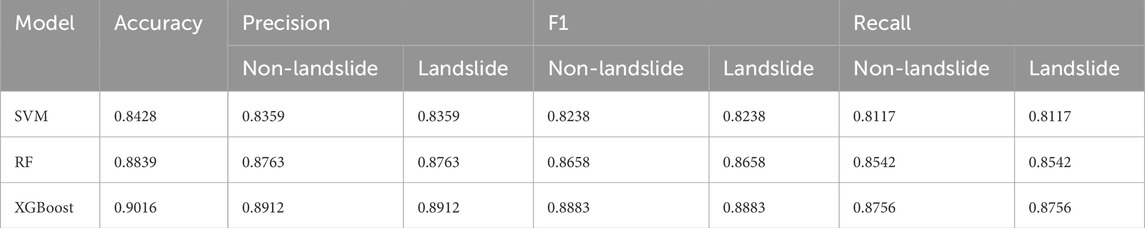
Table 4. Performance evaluation indicators of landslide susceptibility models.
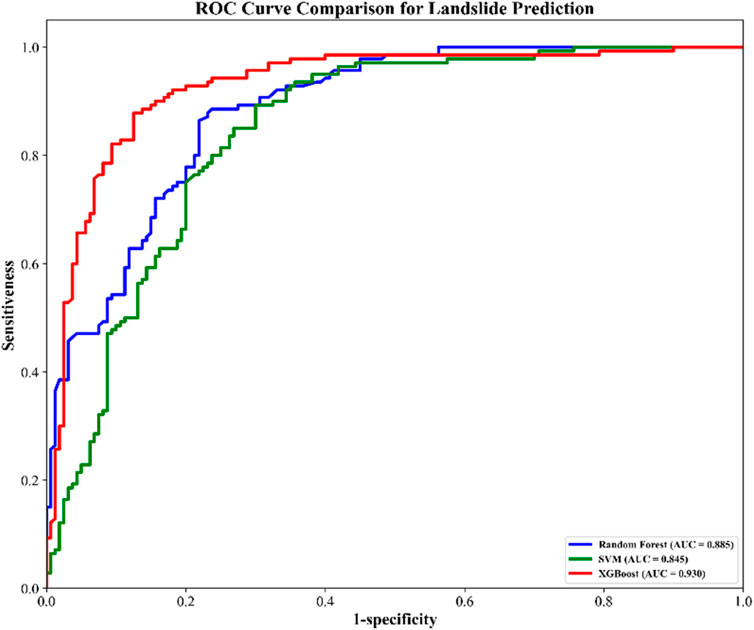
Figure 4. Receiver Operating Characteristic (ROC) curve of the model.
4.3 Spatial consistency of different methods
In this study, a correlation matrix (Figure 5) was constructed by comparing the landslide occurrence probabilities obtained by different methods pixel by pixel to analyze the level of agreement between various landslide susceptibility models. The results showed that although the AUC values of different models were similar, the spatial consistency of landslide susceptibility distribution maps (LSM) generated by them was still significantly different. In general, the correlation coefficients between the models ranged from 0.78 to 0.84. Among them, the combination of XGBOOST and RF shows the highest consistency, while the combination of SVM and RF shows the lowest consistency. An integrated landslide susceptibility map (LSM) was generated by substituting the logistic regression (LR) coefficients and intercepts of the three models into Equation 2. The resulting LSM was divided into five vulnerability levels following the natural breakpoint classification method. Compared with the prediction results of a single model, the area under the ROC curve (AUC) reached the highest 0.9537 (Figure 4). In the study area, the total area classified as “high” and “extremely high” risk level accounted for about 27.3%. From the perspective of spatial consistency, the comprehensive landslide susceptibility map showed high correlation with the results of each single model, and the correlation coefficients ranged from 0.87 to 0.91 (Figure 5).
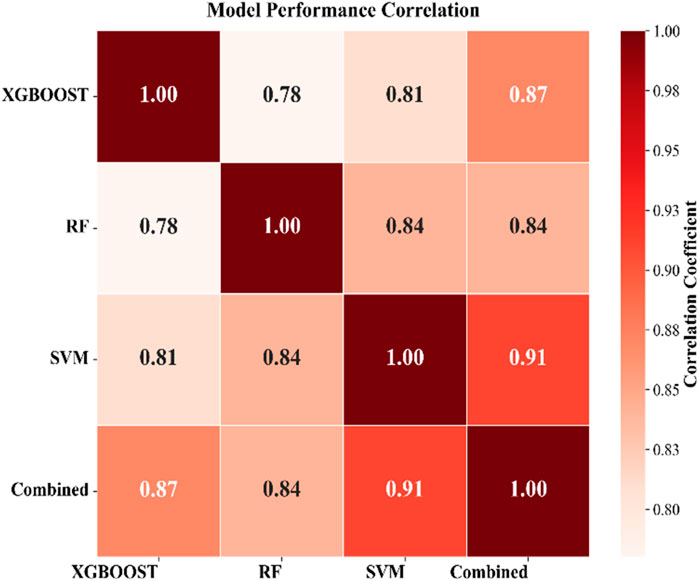
Figure 5. Correlation plots of the consistency between three landslide susceptibility models: XGBOOST, RF, and SVM.
4.4 Comprehensive landslide susceptibility mapping
Different machine learning methods often show significant spatial heterogeneity in landslide prediction. In order to reduce the uncertainty caused by a single model, this study generates a comprehensive landslide susceptibility map by integrating the output results of multiple algorithms. A regression-based fusion strategy was used to construct a multiple Logistic regression (LR) model with the binary landslide cataloging data as the dependent variable and the prediction results of the three models as the independent variables. The results of the regression model showed that the regression coefficients of SVM, Random Forest (RF) and XGBOOST methods were statistically significant (P < 0.05). The overall goodness-of-fit of the model was high, and the coefficient of determination (R2) reached 0.80. The regression coefficients showed that the XGBOOST model had the strongest consistency with the real landslide distribution, followed by RF and SVM. This ranking is consistent with the performance of each model as reflected by the AUC value when predicting the landslide separately (Figure 4), indicating that the regression weight effectively reflects the contribution of different models in the ensemble.
There were obvious spatial differences in the landslide susceptibility distribution of different township units in Ruijin city. The landslide susceptibility level was relatively high in Xifang Town and Yeping town, and the area of “high” and “extremely high” susceptibility grade in these two towns accounted for more than 7% of the total area of the corresponding grade in the study area. Town and cortex phellodendri conventions in addition, as 6.5% of the area were classified as high rock landslide. It is worth noting that the built-up areas and infrastructure coverage of some villages and towns located in hilly areas significantly overlap with the areas with high susceptibility to landslides. Surveys in recent years have shown that with the intensification of urban and rural construction activities, local slope excavation, vegetation damage, and hydrological changes have further increased the risk of landslide hazards in these areas, posing potential threats to residents’ safety and engineering facilities.
This study further integration the prediction results of three kinds of machine learning algorithm, and generate a map on integrated landslide susceptibility (LSM). The results showed that the combined results were superior to any single model in terms of prediction accuracy. Despite research also tries to a variety of machine learning methods applied to landslide susceptibility cartography, and mainly depends on the comparison of the quantitative indicators evaluation, although these measures have certain reference significance, however, is difficult to fully reflect the effectiveness and reliability of the model. In contrast, the integrated mapping method proposed in this study effectively reduces the uncertainty caused by relying on a single model by combining the advantages of different models.
5 Discussion
Different modeling methods often produce inconsistent spatial distribution results in landslide susceptibility prediction, which makes it difficult to optimize the prediction map in disaster risk management. In order to alleviate this problem, this study proposes a method to integrate effective information by quantifying the spatial consistency between models and fusing multiple prediction results to improve the reliability of landslide prone zoning. Taking Ruijin City, a high landslide incidence area in Jiangxi Province, as a case study, three machine learning methods including SVM, XGBOOST and Random Forest (RF) were used to generate the landslide susceptibility distribution map based on hyperparameter tuning. Compared with previous studies on this area, this study used the updated impact factor data, and excluded low-lying areas (including water bodies and areas below 5 m above sea level) in the mapping process to avoid overestimation of the landslide prone range as in some recent studies. The performance evaluation showed that all the models showed excellent predictive ability, with AUC values ranging from 0.84 to 0.93, which was consistent with the conclusions of multiple current studies on the high accuracy of machine learning in landslide prediction. This study suggests that, even based on the same set of cataloged landslide data, different modeling methods may still generate spatially diverse prediction results. Based on the analysis of the spatial consistency of the model outputs, it was found that there was obvious regional heterogeneity in landslide prediction, and the pixel-by-pixel correlation coefficients between the models ranged from 0.78 to 0.84. In addition, there are some differences between the prone zone map drawn in this study and another recent study on Ruijin city. These differences indicate that although each model shows high AUC values and excellent classification performance, there are still uncertainties in the prediction results that cannot be ignored. Most of the current researches on landslide susceptibility based on machine learning focus on the optimal prediction method, but pay less attention to the uncertainty caused by the spatial inconsistency between different models. Based on an actual case, this study is the first to systematically investigate this issue, and fills the gap of existing research in related fields.
By integrating the prediction results of multiple machine learning landslide susceptibility models, this study aims to reduce the uncertainty in the prediction and improve the accuracy of landslide spatial probability assessment. The proposed modeling framework is transferable and can be applied to other landslide prone areas. Landslide susceptibility maps (LSM) can provide a scientific basis for urban planners to identify suitable areas for construction. Taking Ruijin City as an example, the comprehensive susceptibility map generated in this study can assist policy makers and engineers to determine the implementation focus and timing of landslide risk management measures. The model is an improvement of the existing landslide prediction methods, which is helpful to achieve more accurate spatial prediction of landslide hazard. The output of the model can be used to optimize the landslide warning system, thereby enhancing the effectiveness of disaster risk mitigation strategies and supporting local communities to build a more disaster resilient development environment.
Data availability statement
The raw data supporting the conclusions of this article will be made available by the authors, without undue reservation.
Author contributions
XZ: Data curation, Writing – original draft. YX: Formal Analysis, Funding acquisition, Writing – review and editing.
Funding
The author(s) declare that financial support was received for the research and/or publication of this article. This research was funded by the CRSRI Open Research Program (Program SN:CKWV20241187/KY); Key Laboratory of Land Satellite Remote Sensing Application, Ministry of Natural Resources of the People’s Republic of China (KLSMNR-G202304); Key Laboratory of Coastal Salt Marsh Ecosystems and Resources, Ministry of Natural Resources (KLCSMERMNR202306); Suzhou University of Science and Technology Talent Introduction Initiation Project (332214808); Vice President of Science and Technology of Jiangsu Province (1106); The Natural Science Foundation of the Jiangsu Higher Education Institutions of China (25KJB420006).
Acknowledgments
The authors would like to thank the Department of Surveying and Mapping of Jiangxi Province for providing relevant data.
Conflict of interest
Author XZ was employed by Nanjing Changtian Surveying and Mapping Technology Co., Ltd.
The remaining author declares that the research was conducted in the absence of any commercial or financial relationships that could be construed as a potential conflict of interest.
Generative AI statement
The author(s) declare that no Generative AI was used in the creation of this manuscript.
Any alternative text (alt text) provided alongside figures in this article has been generated by Frontiers with the support of artificial intelligence and reasonable efforts have been made to ensure accuracy, including review by the authors wherever possible. If you identify any issues, please contact us.
Publisher’s note
All claims expressed in this article are solely those of the authors and do not necessarily represent those of their affiliated organizations, or those of the publisher, the editors and the reviewers. Any product that may be evaluated in this article, or claim that may be made by its manufacturer, is not guaranteed or endorsed by the publisher.
References
Ahmad, S., Rizvi, Z. H., Arp, J. C. C., Wuttke, F., Tirth, V., and Islam, S. (2021). Evolution of temperature field around underground power cable for static and cyclic heating. Energies 14 (23), 8191. doi:10.3390/en14238191
Ahmad, H., Yaqub, M., and Lee, S. H. (2024). Environmental-social-and governance-related factors for business investment and sustainability: a scientometric review of global trends. Environ. Dev. Sustain. 26 (2), 2965–2987. doi:10.1007/s10668-023-02921-x
Ahmad, S., Ahmad, S., Akhtar, S., Ahmad, F., and Ansari, M. A. (2025a). Data-driven assessment of corrosion in reinforced concrete structures embedded in clay dominated soils. Sci. Rep. 15, 22744. doi:10.1038/s41598-025-08526-w
Ahmad, S., Prakash, R., and Abedi, S. (2025b). “Microscale chemo-mechanics of shale-reactive brine interaction,” in The Biot-Bazant Conference. 2021, Conference contribution. doi:10.6084/m9.figshare.14787516.v1
Ahmad, S., Rizvi, Z. H., and Wuttke, F. (2025c). Unveiling soil thermal behavior under ultra-high voltage power cable operations. Sci. Rep. 15, 7315. doi:10.1038/s41598-025-91831-1
Ahmed, B. (2021). The root causes of landslide vulnerability in Bangladesh. Landslides 18 (5), 1707–1720. doi:10.1007/s10346-020-01606-0
Alam, E., and Ray-Bennett, N. S. (2021). Disaster risk governance for district-level landslide risk management in Bangladesh. Int. J. Disaster Risk Reduct. 59, 102220. doi:10.1016/j.ijdrr.2021.102220
Bao, H., Zeng, C., Peng, Y., and Wu, S. (2022). The use of digital technologies for landslide disaster risk research and disaster risk management: progress and prospects. Environ. Earth Sci. 81 (18), 446. doi:10.1007/s12665-022-10575-7
Batar, A. K., and Watanabe, T. (2021). Landslide susceptibility mapping and assessment using geospatial platforms and weights of evidence (WoE) method in the Indian Himalayan region: recent developments, gaps, and future directions. ISPRS Int. J. Geo-Information 10 (3), 114. doi:10.3390/ijgi10030114
Cui, S., Wu, H., Pei, X., Yang, Q., Huang, R., and Guo, B. (2022). Characterizing the spatial distribution, frequency, geomorphological and geological controls on landslides triggered by the 1933 Mw 7.3 Diexi earthquake, Sichuan, China. Geomorphology 403, 108177. doi:10.1016/j.geomorph.2022.108177
Dahmani, L., Laaribya, S., Naim, H., Tunguz, V., and Dindaroglu, T. (2024). Assessing landslide susceptibility in Chefchaouen, Morocco: an application of the landslide numerical risk factor method for sustainable urban development and disaster risk management. Biosyst. Divers. 32 (3), 389–397. doi:10.15421/012442
Guo, F. Y., Meng, X. M., Qi, T. J., Dijkstra, T., Thorkildsen, J. K., Yue, D. x., et al. (2022). Rapid onset hazards, fault-controlled landslides and multi-method emergency decision-making. J. Mt. Sci. 19 (5), 1357–1369. doi:10.1007/s11629-021-6941-x
Jaafari, A. (2024). Landslide susceptibility assessment using novel hybridized methods based on the support vector regression. Ecol. Eng. 208, 107372. doi:10.1016/j.ecoleng.2024.107372
Kab, A., Djerbal, L., and Bahar, R. (2023). Implementation of PCA multicollinearity method to landslide susceptibility assessment: the study case of Kabylia region. Arabian J. Geosciences 16 (4), 291. doi:10.1007/s12517-023-11374-5
Kavzoglu, T., and Teke, A. (2022a). Predictive performances of ensemble machine learning algorithms in landslide susceptibility mapping using random forest, extreme gradient boosting (XGBoost) and natural gradient boosting (NGBoost). Arabian J. Sci. Eng. 47 (6), 7367–7385. doi:10.1007/s13369-022-06560-8
Kavzoglu, T., and Teke, A. (2022b). Advanced hyperparameter optimization for improved spatial prediction of shallow landslides using extreme gradient boosting (XGBoost). Bull. Eng. Geol. Environ. 81 (5), 201. doi:10.1007/s10064-022-02708-w
Kumar, C., Walton, G., Santi, P., and Luza, C. (2023). An ensemble approach of feature selection and machine learning models for regional landslide susceptibility mapping in the arid mountainous terrain of southern Peru. Remote Sens. 15 (5), 1376. doi:10.3390/rs15051376
Li, H., and Samsudin, N. A. (2024). A systematic review of landslide research in urban planning worldwide. Nat. Hazards 121, 6391–6411. doi:10.1007/s11069-024-07064-4
Lin, N., Zhang, D., Feng, S., Ding, K., Tan, L., Wang, B., et al. (2023). Rapid landslide extraction from high-resolution remote sensing images using SHAP-OPT-XGBoost. Remote Sens. 15 (15), 3901. doi:10.3390/rs15153901
Liu, R., Yang, X., Xu, C., Wei, L., and Zeng, X. (2022). Comparative study of convolutional neural network and conventional machine learning methods for landslide susceptibility mapping. Remote Sens. 14 (2), 321. doi:10.3390/rs14020321
Liu, Q., Tang, A., and Huang, D. (2023). Exploring the uncertainty of landslide susceptibility assessment caused by the number of non–landslides. Catena 227, 107109. doi:10.1016/j.catena.2023.107109
Lu, Z., Liu, G., Song, Z., Sun, K., Li, M., Chen, Y., et al. (2024). Advancements in technologies and methodologies of machine learning in landslide susceptibility research: current trends and future directions. Appl. Sci. 14 (21), 9639. doi:10.3390/app14219639
Morales-Hernández, A., Van Nieuwenhuyse, I., and Rojas Gonzalez, S. (2023). A survey on multi-objective hyperparameter optimization algorithms for machine learning. Artif. Intell. Rev. 56 (8), 8043–8093. doi:10.1007/s10462-022-10359-2
Pacheco Quevedo, R., Velastegui-Montoya, A., Montalván-Burbano, N., Morante-Carballo, F., Korup, O., and Daleles Rennó, C. (2023). Land use and land cover as a conditioning factor in landslide susceptibility: a literature review. Landslides 20 (5), 967–982. doi:10.1007/s10346-022-02020-4
Saha, S., Roy, J., Pradhan, B., and Hembram, T. K. (2021). Hybrid ensemble machine learning approaches for landslide susceptibility mapping using different sampling ratios at east Sikkim himalayan, India. Adv. Space Res. 68 (7), 2819–2840. doi:10.1016/j.asr.2021.05.018
Sajid, M., and Płotka-Wasylka, J. (2022). Green analytical chemistry metrics: a review. Talanta 238, 123046. doi:10.1016/j.talanta.2021.123046
Selamat, S. N., Majid, N. A., and Taha, M. R. (2025). Multicollinearity and spatial correlation analysis of landslide conditioning factors in langat River basin, Selangor. Nat. Hazards 121 (3), 2665–2684. doi:10.1007/s11069-024-06903-8
Sharma, N., Saharia, M., and Ramana, G. V. (2024). High resolution landslide susceptibility mapping using ensemble machine learning and geospatial big data. Catena 235, 107653. doi:10.1016/j.catena.2023.107653
Shu, X., and Ye, Y. (2023). Knowledge discovery: methods from data mining and machine learning. Soc. Sci. Res. 110, 102817. doi:10.1016/j.ssresearch.2022.102817
Sousa, J. J., Liu, G., Fan, J., Perski, Z., Steger, S., Bai, S., et al. (2021). Geohazards monitoring and assessment using multi-source earth observation techniques. Remote Sens. 13 (21), 4269. doi:10.3390/rs13214269
Stuke, A., Rinke, P., and Todorović, M. (2021). Efficient hyperparameter tuning for kernel ridge regression with Bayesian optimization. Mach. Learn. Sci. Technol. 2 (3), 035022. doi:10.1088/2632-2153/abee59
Tehrani, F. S., Calvello, M., Liu, Z., Zhang, L., and Lacasse, S. (2022). Machine learning and landslide studies: recent advances and applications. Nat. Hazards 114 (2), 1197–1245. doi:10.1007/s11069-022-05423-7
Teng, F., Mao, Y., Li, Y., Qian, S., and Nanehkaran, Y. A. (2024). Comparative models of support-vector machine, multilayer perceptron, and decision tree predication approaches for landslide susceptibility analysis. Open Geosci. 16 (1), 20220642. doi:10.1515/geo-2022-0642
Ullah, I., Aslam, B., Shah, S. H. I. A., Tariq, A., Qin, S., Majeed, M., et al. (2022). An integrated approach of machine learning, remote sensing, and GIS data for the landslide susceptibility mapping. Land 11 (8), 1265. doi:10.3390/land11081265
Wang, Y., and Nanehkaran, Y. A. (2024). GIS-based fuzzy logic technique for mapping landslide susceptibility analyzing in a coastal soft rock zone. Nat. Hazards 120 (12), 10889–10921. doi:10.1007/s11069-024-06649-3
Wang, X., Zhang, C., Wang, C., Liu, G., and Wang, H. (2021). GIS-based for prediction and prevention of environmental geological disaster susceptibility: from a perspective of sustainable development. Ecotoxicol. Environ. Saf. 226, 112881. doi:10.1016/j.ecoenv.2021.112881
Wang, S., Zhuang, J., Zheng, J., Fan, H., Kong, J., and Zhan, J. (2021). Application of Bayesian hyperparameter optimized random forest and XGBoost model for landslide susceptibility mapping. Front. Earth Sci. 9, 712240. doi:10.3389/feart.2021.712240
Wang, T., Zilinskas, R., Li, Y., and Qu, Y. (2023). Missing data imputation for a multivariate outcome of mixed variable types. Statistics Biopharm. Res. 15 (4), 826–837. doi:10.1080/19466315.2023.2169753
Wei, A., Yu, K., Dai, F., Gu, F., Zhang, W., and Liu, Y. (2022). Application of tree-based ensemble models to landslide susceptibility mapping: a comparative study. Sustainability 14 (10), 6330. doi:10.3390/su14106330
Xu, Z., Che, A., and Zhou, H. (2024). Seismic landslide susceptibility assessment using principal component analysis and support vector machine. Sci. Rep. 14 (1), 3734. doi:10.1038/s41598-023-48196-0
Zeng, L., Brignardello-Petersen, R., Hultcrantz, M., Siemieniuk, R. A., Santesso, N., Traversy, G., et al. (2021). GRADE guidelines 32: GRADE offers guidance on choosing targets of GRADE certainty of evidence ratings. J. Clin. Epidemiol. 137, 163–175. doi:10.1016/j.jclinepi.2021.03.026
Keywords: uncertainty, landslide, prediction, susceptibility, machine learning (ML)
Citation: Zhou X and Xing Y (2025) Spatial consistency assessment and landslide susceptibility prediction optimization. Front. Earth Sci. 13:1702688. doi: 10.3389/feart.2025.1702688
Received: 10 September 2025; Accepted: 17 October 2025;
Published: 31 October 2025.
Edited by:
Hans-Balder Havenith, University of Liège, BelgiumReviewed by:
Zarghaam Rizvi, GeoAnalysis Engineering GmbH, GermanySudesh Pundir, Pondicherry University, India
Copyright © 2025 Zhou and Xing. This is an open-access article distributed under the terms of the Creative Commons Attribution License (CC BY). The use, distribution or reproduction in other forums is permitted, provided the original author(s) and the copyright owner(s) are credited and that the original publication in this journal is cited, in accordance with accepted academic practice. No use, distribution or reproduction is permitted which does not comply with these terms.
*Correspondence: Yin Xing, eHlpbjAzMjBAMTYzLmNvbQ==