 Yu Wu
Yu Wu Lin Zhou1
- 1Bijie Power Supply Bureau of Guizhou Power Grid Co., Ltd., CSG, Bijie, Guizhou, China
- 2Electrical Science Institute of Guizhou Power Grid Co., Ltd., CSG, Guiyang, China
- 3Powerchina Guizhou Electric Power Engineering Co., Ltd, Guiyang, China
The mechanisms by which continuous underground coal mining induces surface subsidence and adversely affects transmission towers within the region remain incompletely understood. This study takes the Wenjiaba mining area in Zhijin County, Bijie City, Guizhou Province, China, as a case study to elucidate these mechanisms. The research integrates field forensic investigations, laboratory-scale physical modeling, and two-dimensional discrete element numerical simulations. The study revealed that coal mining induces progressive failure of the overlying strata, with primary joints serving as the dominant pathways for fracture propagation. When the coal face advances to 150 m, the goaf roof collapses in a simply supported beam failure mode. By the time the coal face reaches 200 m, fractures have extended to the surface. As mining continues, the fractal dimension of cracks in the slope model progressively increases, with rock mass failure primarily governed by the activation of primary joints and bedding planes. Surface subsidence is identified as the key factor driving the differential settlement of transmission tower foundations. The 2D DEM simulation results further reveal that transmission tower 1, located at the edge of the mined-out area, has a tilt of approximately 0.55%, whereas transmission tower 2, situated at the center, exhibits a foundation tilt exceeding 2.2% due to greater subsidence. This study provides scientific support for risk assessment of power transmission infrastructure in coal mining regions of southwestern China.
1 Introduction
Coal remains the cornerstone of China’s energy structure and holds significant strategic importance. As the focus of coal mining shifts westward, regions such as Sichuan and the Yunnan–Guizhou regions have emerged as new hubs of production. However, intense mining activities in these regions have led to increasingly severe surface subsidence problems. For every 10,000 tons of coal mined, a 0.29 km2 subsidence area is generated. In the Yunnan–Guizhou region, the cumulative subsidence area caused by mining has reached 1,600 km2, accounting for 10% of the national total national area. Simultaneously, the west-to-east power transmission strategy has driven the large-scale expansion of ultrahigh-voltage power grids through regions with complex geological conditions. This renders goafs a significant threat to transmission safety. Mining-induced strata stress redistribution, characterized by a “three-zone” movement pattern—comprising the caving zone, fracture zone, and bending zone—leads to the formation of surface subsidence basins (Shi, 2016). This results in differential settlement and horizontal displacement of tower foundations, which subsequently lead to tower inclination, stress concentration within structural components, and in extreme cases, instability or collapse. Such failures can trigger cascading power outages. Notably, the combined effects of rock mass fracturing and mining-induced disturbances in the Yunnan–Guizhou karst region significantly exacerbate the risk of tower deformation.
The theoretical understanding of ground surface deformation mechanisms due to coal mining has evolved over time. Early models, such as the cantilever beam and pressure arch theories, were supplanted by critical layer theory, which emphasizes stress redistribution driven by stiffness variations in overlying strata (Qian et al., 2001; Qian et al., 1994). In terms of prediction methods, approaches such as the probability integral method (Gou et al., 2019), three-dimensional rheological models (Kratzsch, 1986), and multifield coupling algorithms (Wang et al., 2022) have laid a theoretical foundation for subsidence control. However, these traditional models are typically based on assumptions suitable for plain regions and fail to adequately account for the terrain effects in mountainous regions. To address this gap He and Kang (1992) introduced a topographic gradient correction factor, which improved the prediction accuracy in mountainous regions to 82%. Nevertheless, the deformation and failure mechanisms of steeply inclined fractured rock slopes under mining activities remain inadequately understood. Recent advances in numerical simulation techniques, such as the FEM-DEM coupled algorithm, have significantly enhanced the efficiency of subsidence prediction for steeply inclined coal seams (Zhang et al., 2022). Additionally, three-dimensional elastoplastic models have achieved millimeter-level dynamic corrections for deformation in kilometer-deep shafts (Sepehri et al., 2017). Despite these advancements, current models still exhibit limitations in representing anisotropic behavior and accurately characterizing ground surface cracking. With respect to the impact of coal mining on transmission towers, previous studies have identified a composite damage mechanism involving both vertical and horizontal displacements. Differential settlement increases the overturning moment on tower foundation, whereas horizontal displacement leads to asymmetric loading on the tower structures. Furthermore, ground curvature deformation, governed by the foundation–structure coupling effect, induces additional concentrated bending moments (Fu et al., 2022; Yuan et al., 2018; Lu et al., 2024; Li et al., 2012). Numerical simulation results indicate that excessive differential settlement in tower foundations leads to stress concentrations in structural components (Dai et al., 2009; Sun, 2017). While studies on the interaction between towers and foundations have developed antideformation design methods, enhanced composite foundation performance, and introduced settlement evaluation systems for transmission towers (Guo and Zheng, 2011; Zhang et al., 2018), a systematic understanding of the deformation mechanisms of tower foundations and structures under extremely gentle slope mining conditions is still lacking. This is particularly true for the dynamic response patterns of fractured rock masses. Furthermore, there is an urgent need to refine the relevant safety evaluation criteria for transmission towers in such environments.
To address these limitations, this study investigated the disaster chain mechanisms in the Yunnan–Guizhou karst region, with a focus on the full process of coal mining-induced slope deformation and its impacts on tower structures. The research methodology combined physical model experiments with two-dimensional discrete element numerical simulations. A scaled physical model of a gently inclined fractured rock slope was constructed to simulate the deformation and failure mechanisms induced by coal mining. A two-dimensional discrete element model was subsequently developed to characterize the rock mass fracture network. This integrated approach revealed the mechanisms of slope failure and tower foundation deformation during coal mining. The findings provide a scientific basis for risk assessment of transmission towers in coal mining areas in the Yunnan–Guizhou region.
2 Geological and engineering background of the study area
The study area is located at the Wengjiaba coal mine, which is located in the Wengteng subdistrict of Zhijin County, Bijie city, Guizhou Province, China (Figure 1a). Its geographical coordinates range from 26°35′58″N to 26°39′56″N and 105°37′19″E to 105°42′12″E. The region has an average elevation of approximately 1,443 m and is located just 157 km from the provincial capital, Guiyang. This ensures convenient accessibility. The study area falls within a subtropical plateau monsoon humid climate zone, which is characterized by a long-term average temperature of approximately 15 °C. The average temperature during the coldest period is −2.8 °C, whereas it is approximately 22.5 °C during the hottest period. The study area receives abundant rainfall, with an average annual precipitation of approximately 1393.3 mm. However, the spatial and temporal distributions of rainfall are relatively uneven. The rainy season (May-October) accounts for 87.4% of the total annual precipitation, whereas the dry season (December-March of the following year) contributes only 6.1%. The annual precipitation varies significantly from 791.5 to 2105.5 mm (Figure 1b). In recent years, extreme weather events have exacerbated the vulnerability of the region. Heavy rainfall has caused widespread flooding, which has damaged numerous houses, triggered multiple landslides, and disrupted traffic transportation networks. Additionally, underground coal mining has resulted in the formation of numerous mining-induced cracks on the slope surfaces, which further compromise slope stability. These factors have posed severe implications for the foundations of high-voltage transmission towers in this area.
The results of field investigations revealed that since February 2024, the study area has experienced extensive ground deformation and cracking. Multiple surveys were conducted to document ground surface cracks above the mining face from February to October 2024. As a result, a total of approximately 42 ground surface cracks were identified, as shown in Figure 2a. These cracks are predominantly located above or near the edges of goafs within forested and agricultural lands. Their orientations are generally aligned with those of the underlying goafs. The presence of these ground surface cracks has caused significant disruptions and damage to roads, and in some cases, cracks have extended beneath transmission towers, compromising the stability of their foundations. Figure 2b illustrates the conditions of ground surface cracks beneath Tower 1. A penetrating crack was observed directly beneath Tower 1. This caused significant differential settlement on either side of the tower foundation, which has led to a noticeable tower inclination. For Tower 2, which is located in the same region (Figure 2c), two parallel penetrating cracks were identified during the on-site investigation. Although these cracks did not directly intersect the tower foundation, they still adversely affected its stability. Both transmission towers, which are located above the goaf, are within the influence zone of overlying strata movement and deformation. The observed deformation of the transmission towers is attributed to subsidence and deformation of the overlying strata in the goaf. Overall, the transmission towers exhibit localized inclination as a result of ground deformation. They remain at risk of further instability due to residual deformation in the goaf and potential future subsidence from planned mining activities. The likelihood of additional foundation subsidence or cracking poses a significant threat to the safe and reliable operation of transmission towers.
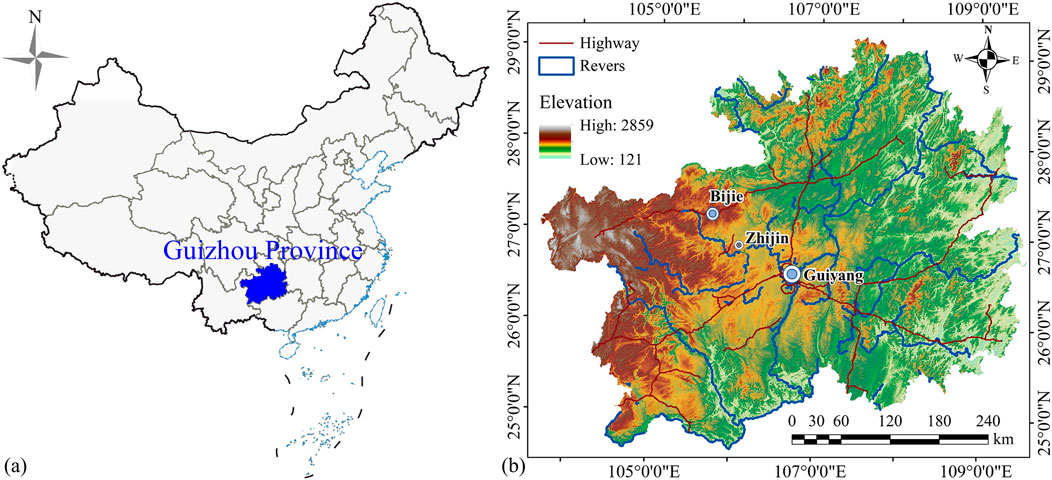
Figure 1. Location of the study area. (a) Geographical location of Guizhou Province. (b) Location of the Wengjiaba coal mine in Zhijin County, Bijie city, Guizhou Province, China.
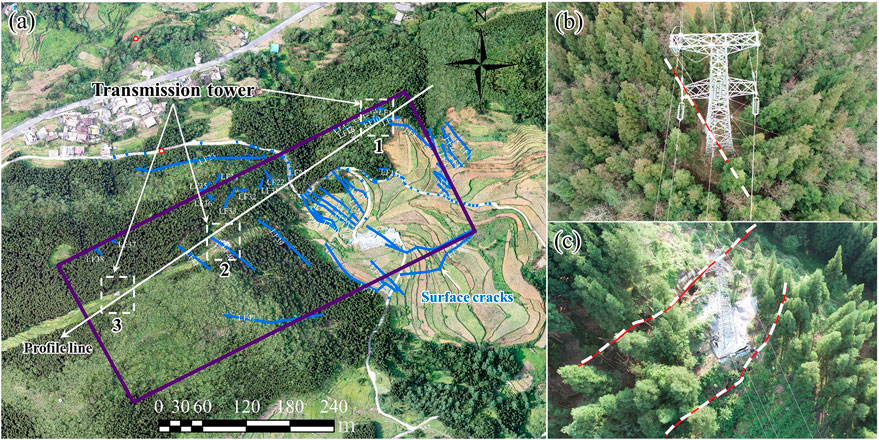
Figure 2. Current situation of the study area: (a) Ground surface cracks and projection above the goaf at the Wengjiaba coal mine, which were identified through field investigations. (b) Penetrating crack beneath Tower 1. (c) Penetrating cracks on both sides of Tower 2.
Field investigations conducted on May 22, 2024 revealed that the penetrating crack beneath Tower 1 has a width ranging from 5 to 10 cm and a locally visible depth of approximately 1.5 m. The displacement difference on both sides of the crack measured approximately 3–5 cm, and the deformation continued to progress at a slow rate (Figure 3). This has caused misalignment of the tower foundation and visible deformation of the tower structure, which potentially leads to an overall collapse of the transmission tower. Therefore, the impact of ground surface cracking induced by underground mining activities on the stability of transmission tower foundations in the study area requires urgent attention. This is particularly critical for assessing the failure risks of transmission towers in coal mining areas, which are prevalent throughout the Yunnan–Guizhou region.

Figure 3. Cracks at the foundation of Tower 1: (a) Overview of the penetrating cracks; (b) Current situation of the tower foundation after being split by penetrating crack.
Figure 4 shows a representative geological cross-section of the study area, where the section line is indicated in Figure 2a, and the section direction is 243°WS. The exposed strata in the study area, from oldest to youngest, are the upper Permian Longtan Formation (P3l), the upper Permian Changxing-Dalong Formation (P3c+d), the Lower Triassic Yelang Formation (T1y), and the Quaternary (Q) residual and slope deposits. The lithological characteristics of these strata are detailed as follows: (1) Upper Permian Longtan Formation (P3l): The lithology of this formation primarily consists of gray and dark gray sandstone, siltstone, and mudstone, which are interbedded with bioclastic limestone and siliceous limestone. This formation contains seven known mineable coal seams. The total thickness of the strata ranges from 247.4 m to 351.3 m. The rock mass is generally dense but prone to weathering. The weathered rock mass is relatively fragmented with well-developed fractures. (2) Upper Permian Changxing-Dalong Formation (P3c+d): This formation is primarily composed of shallow marine chert-bearing limestone, with interbedded calcareous siltstone and mudstone. The layer thickness ranges from 22.67 m to 36.86 m. The rocks exhibit significant hardness and high mechanical strength. (3) Lower Triassic Yelang Formation (T1y): This formation comprises shallow marine limestone, marl, mudstone, sandy mudstone, and siltstone. Although the rock structure is dense, it is prone to weathering. The weathered rock mass is relatively fragmented with well-developed fractures. The mechanical strength of the rock is low, and the integrity of the rock mass is poor. (4) Quaternary Residual and Slope Deposits (Q): These deposits primarily consist of slope deposits, talus, residual subclay, clay, alluvial sand, and gravel. They are predominantly distributed in gullies, gentle slope platforms, and karst depressions in the study area. The thickness of these deposits generally varies from 0 to 20 m. The deposits are mainly composed of subclay and alluvial sand, most of which exhibit a loose structure, although some are relatively dense. The overall mechanical strength of these deposits is low.
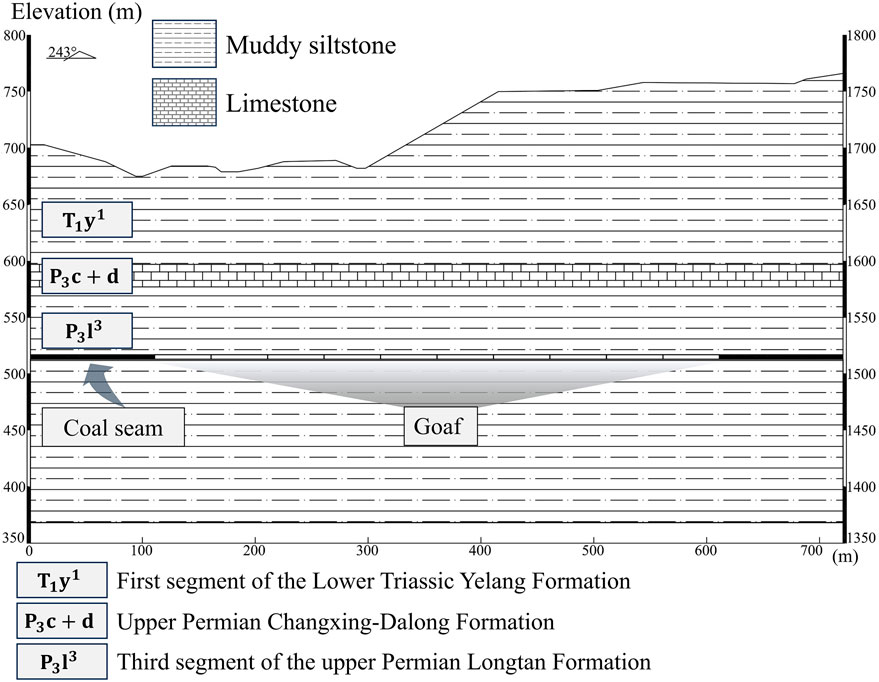
Figure 4. Geological cross section of the study area.
The strata in Figure 4 were simplified on the basis of field investigation results to facilitate laboratory-scale physical model experiments. The strata, from top to bottom, included mudstone siltstone, limestone, and coal rock, with the limestone interbedded within the mudstone‒siltstone layers. The cross-section had a bottom length of approximately 720 m and a height of approximately 400 m. The dip angle of the rock layers was very gentle. Coal mining was conducted along the strike direction, resulting in a coal seam dip angle of 0°. Only one coal seam was mined, with an average mining thickness of approximately 2.84 m. The study area is characterized by the development of two prominent joint sets. The first joint set (J1) has a dip direction of 36° and a dip angle of 88°, whereas the second joint set (J2) has a dip direction of 309° and a dip angle of 85°. The average visible trace lengths of J1 and J2 are 1.24 m and 0.78 m, respectively. Similarly, the average spacings of J1 and J2 are 0.82 m and 0.53 m, respectively. These joint parameters serve as the basis for constructing joints in laboratory-scale physical model experiments and for two-dimensional discrete element numerical simulations. Coal mining operations began in November 2023. By October 2024, the working face had advanced 513 m, resulting in a goaf area of 11,299 m2. The mining operation was divided into 10 mining zones, and each zone advanced 50 m, resulting in a total progress of 500 m. On the basis of the dimensions of the laboratory model box, a similarity coefficient CL of 600 was adopted for the physical model.
3 Research protocol
3.1 Laboratory physical model test
In this study, the geological cross section illustrated in Figure 4 was used as the prototype for the laboratory physical model test. Physical simulation experiments were conducted to reveal the deformation and failure mechanisms of slopes during coal mining activities. The prototype was scaled down to develop a new similarity model. This requires ensuring physical similarity between the new model and the prototype to accurately simulate the real processes and patterns accurately (Zhang, 2013). The principle of physical similarity plays a central role in constructing physical models and guiding model tests, as it is able to effectively reveal comparable physical phenomena. This principle typically requires adherence to geometric similarity, kinematic similarity, dynamic similarity, and material/medium similarity. According to the fundamental principles of similarity theorems and dimensional analysis (Buckingham, 1914; Zhang et al., 2024; Yi et al., 2022), specific physical quantities were selected as fundamental dimensions for physical simulation experiments, and the similarity coefficients for other variables were derived accordingly. Considering the operability and dimensions of the model box, the model size, mass density, and gravitational acceleration were chosen as the basic control variables. The similarity ratio for model size was set to 600, whereas the similarity ratios for mass density and gravitational acceleration were both set to 1. The similarity coefficients for other variables were then derived on the basis of these similarity relationships. Table 1 presents the variables considered in this experiment and their respective similarity coefficients.
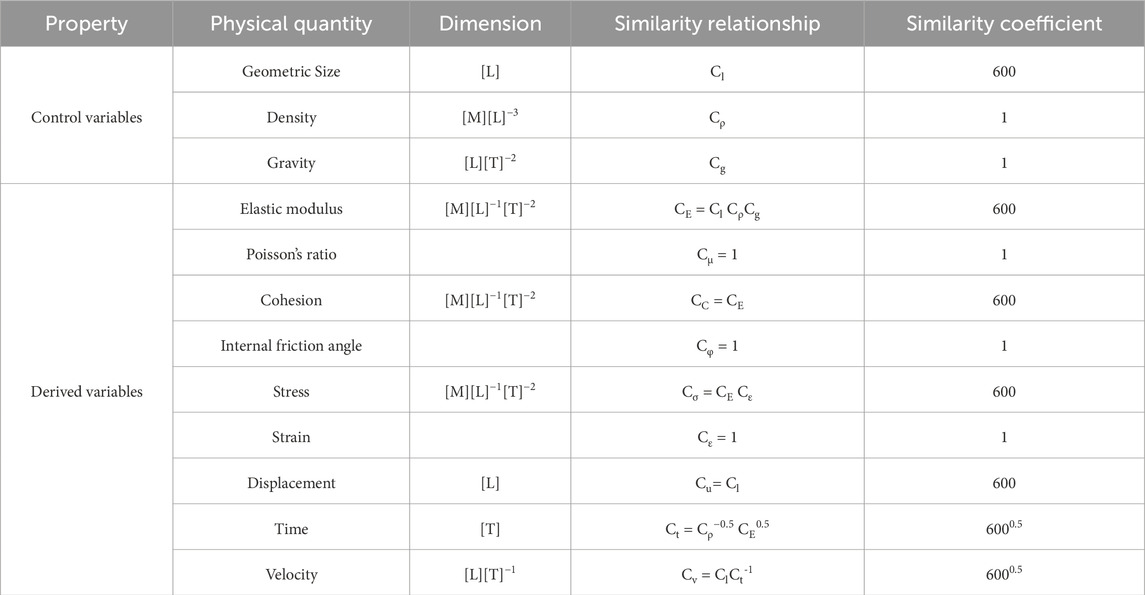
Table 1. Similarity coefficients of the physical quantities in the scaled physical model test.
3.1.1 Physical model testing setup
The physical model testing setup consists of a model box and high-speed photography equipment, as illustrated in Figure 5. The model box measured 180 cm in length, 50 cm in width, and 150 cm in height. Three sides of the model box are made of removable transparent acrylic panels to facilitate the observation of experimental phenomena. The entire structure is reinforced with a stainless steel frame to ensure structural integrity and to meet the requirements of model testing. The high-speed camera used in the experiments is the Qianyanlang 2F04M high-speed camera, which offers a high frame rate of 190 FPS at its highest resolution (2320 × 1720). Additionally, it is capable of achieving an ultrahigh frame rate of up to 2,000 FPS at a lower resolution (640 × 480). This camera is characterized by high performance, high definition, low power consumption, and low noise. These features make it particularly well suited for capturing the deformation and failure processes on the model surface.
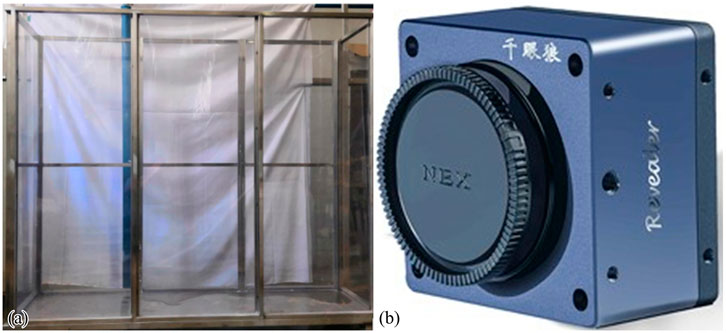
Figure 5. Equipment used in the physical model test: (a) Model test box. (b) Qianyanlang 2F04M high-speed camera.
3.1.2 Design of similar material proportions
Limestone and mudstone samples were selected from the study area and processed into standard samples under laboratory conditions. Uniaxial compression tests and Brazilian split tests were conducted to determine the compressive and tensile strengths of the samples. Other parameters were derived from previous studies (Zhang et al.). The results of the physical and mechanical properties of the primary rock types in the study area are presented in Table 2.
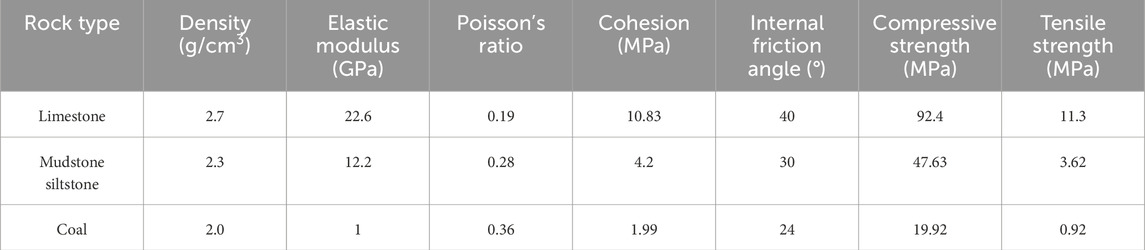
Table 2. Physical and mechanical parameters of the rock mass in the study area.
The selection and configuration of similar materials for physical model testing are critical to ensure the reliability of the test results. The choice and mixing of similar materials directly affect their physical and mechanical properties, which in turn determine the outcomes of the model tests. Similar materials commonly utilize barite powder as the primary material, whereas gypsum or liquid paraffin oil serve as binders. Auxiliary materials, such as quartz sand, zinc oxide powder, iron powder, and bentonite powder, are incorporated to enhance the material’s properties. The specific gravity and elastic modulus of the materials were adjusted to meet the similarity requirements. Owing to its high density and low strength, barite powder is particularly suitable for simulating high-density, low-strength rock masses. In this study, barite powder was chosen as the primary material, liquid paraffin oil was selected as the binder, and quartz sand was chosen as the auxiliary material. This combination not only effectively replicated the properties of the target geological formations but also enhanced the accuracy and reliability of the model tests. Given the low strength and low density characteristics of coal rock, the material combination was further optimized by incorporating bentonite powder, which has a lower strength and density than those of quartz sand. This optimized material combination satisfied the similarity criteria and effectively simulated the complex mechanical behavior of the geological formations.
When laboratory-scale model tests are conducted, discrepancies between experimental results and actual conditions may arise. These differences arise primarily from variations in the physical and mechanical properties of similar materials and actual rock masses, as well as the inherent complexity of real geological conditions, which cannot be fully replicated in laboratory experiments. The primary focus of this experiment was on the influence of gravity on the research target. Therefore, the material proportions were carefully selected to ensure similarity in density and uniaxial compressive strength. Based on the similarity ratios of physical quantities derived from the similarity theorem and relevant parameters, the corresponding material proportions were determined from previous mixing experiments (Yu, 2020; Zhang, 2023), and samples were prepared to validate the feasibility of these proportions. For the Lopingian Changxing-Dalong Formation limestone, a mixture of barite powder, liquid paraffin oil, and quartz sand (30–50 mesh) at a ratio of 65:10:25 was used. For the mudstone siltstone of the upper Permian Longtan Formation, a mixture of barite powder, liquid paraffin oil, and quartz sand (100 mesh) at a ratio of 59:10:31 was employed. A mixture of barite powder, liquid paraffin oil, and bentonite powder at a ratio of 78:11:11 was chosen for the coal.
The mixed materials were weighed and thoroughly stirred to ensure uniformity. The stirred materials were then sequentially loaded into standard cylindrical molds with a diameter of 50 mm and a height of 100 mm. Vaseline was applied to the inner surfaces of the molds to facilitate easy removal of the samples. The materials were manually compacted within the molds, and the tops were trimmed to create smooth, even surfaces. The samples were left undisturbed for 30 min under natural conditions, after which they were removed from the molds and cured under natural conditions for 3 days before the mechanical tests. Uniaxial compression tests were performed under stress control mode at a loading rate of 0.004 MPa/s to determine the compressive strength of similar materials. The detailed compressive strength parameters are presented in Table 3.
Table 3. Proportions and strengths of similar materials.
3.1.3 Physical simulation test plan
The mining of coal seams plays a crucial role in physical experiments, as coal seam extraction significantly affects the deformation and failure behavior of the overlying rock mass. Minimizing disturbance during the mining process is essential for ensuring rock mass stability. Previous research (Li, 2020; Ma, 2017; Lan, 2015) has identified several methods for simulating coal seam excavation, including the wooden stick extraction method, the sandbag mining method, and the wax melting method. The wooden stick extraction method involves pre-embedding cylindrical wooden sticks in the model, which are then sequentially removed to simulate mining. This method is cost-effective, intuitive, and provides clear visualization of roof collapse. However, it lacks precision and is unable to replicate complex geological conditions. The sandbag mining method simulates stratified mining by gradually removing stacked sandbags and allows for the simulation of coal seam inclinations ranging from 15° to 60° at a moderate cost. However, the mobility of sand particles increases the risk of accidental model collapse and presents challenges for the installation of precision sensors. The wax melting method uses heating to melt wax in predefined areas to simulate mining. This method offers high precision, supports the simulation of multiple coal seams and irregular coal pillars, and allows wax to be reused more than 50 times after cooling. Nevertheless, it requires a temperature control system, is operationally complex, and poses a risk of thermal interference.
In this study, sand was selected to simulate the initial state of the coal seam extraction area. The sand was densely packed to provide sufficient load-bearing capacity. During the mining process, the sand is removed using small wooden sticks, a method that causes less disturbance than the other two methods, is cost-effective, and allows for material reuse (Xiong, 2022). After the material proportions were determined, the model was constructed in layers, with each layer having a thickness of 1–2 cm. Since the joints in the rock mass in the study area significantly affect the deformation, failure, and instability of the slope, the joints must be considered in the experiment. To enhance the realism and operability of the model, after each layer was placed, it was left to air dry naturally before the joints were manually incised using a small knife. The joints were arranged as a random fracture network based on field survey statistics, with the density of joints increasing closer to the ground surface. Finally, transmission towers were placed on the slope surface to complete the model. A photograph of the finalized model is shown in Figure 6. The mining zone spans 500 m, and each working face advances by 50 m, which corresponds to 8.33 cm in the physical model. After each mining step, the model was left to rest for 1 day before the next mining step.
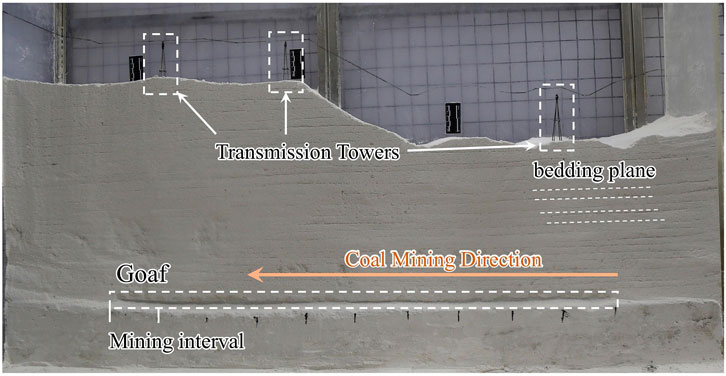
Figure 6. Laboratory scaled physical model.
3.2 Two-dimensional discrete element numerical simulation
A two-dimensional discrete element numerical model, similar to the physical model shown in Figure 6, was constructed to conduct numerical simulations. The porosity control method was used to generate homogeneous particles within the model. Wall servo technology was employed to compact the particles to prevent them from remaining suspended. While using smaller discrete element particle radii can better replicate the mechanical properties of real rock masses, it also increases computational complexity and may hinder the successful completion of numerical simulations. Based on the performance limitations of the workstation, the total number of discrete element particles was kept below 400,000 to balance accuracy and computational feasibility. Accordingly, the slope model was designed to contain approximately 400,000 particles. The minimum particle radius was set to 0.3 m, whereas the maximum-to-minimum particle radius ratio was set to 1.66, resulting in a maximum particle radius of 0.498 m. Smaller particles with a minimum radius of 0.1 m and a maximum radius of 0.166 m were used for regions near the foundations of the transmission towers and the adjacent ground surface. The porosity of all particles was uniformly set to 0.1. As illustrated in Figure 7a, the two-dimensional discrete element numerical model comprises 409,990 particles. The model was brought to equilibrium under gravitational forces to establish the initial stress state. The left and right boundaries of the model were set as displacement-restricted boundaries. The contact between the particles and walls was defined as linear contact, which only allows only vertical displacement. The bottom boundary restricted the vertical movement of the particles.
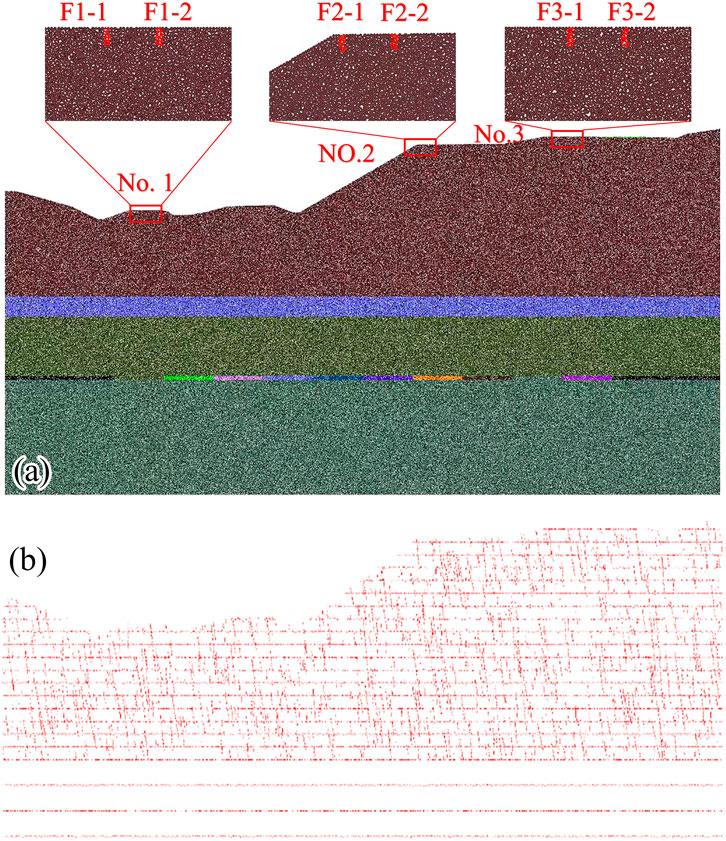
Figure 7. Two-dimensional discrete element numerical model of the Wenjiaba coal mine mining zone. (a) Discrete element numerical model. (b) Geometries of bedding planes and joints present in the model.
The particles corresponding to the mudstone siltstone, limestone, coal seam, and tower foundation were grouped, as shown in Figure 7a, and the model was subsequently brought to equilibrium under gravitational forces. The presence of internal structural planes significantly alters the mechanical properties of rock masses. Therefore, considering both the mechanical properties of rocks and the effects of structural planes is crucial for simulating the mechanical behavior of rock masses via a particle flow model. The rock masses in the study area exhibit thin-to medium-thick layers, and their layer thicknesses range from a few centimeters to several meters. Considering the dimensions of the model and the particle size, the thickness of individual rock layers in the model was set to 10 m. For the joints in the rock mass, a fracture network was constructed based on the results of the structural plane survey. Random parameters conforming to a deterministic mathematical statistical model were generated using the Monte Carlo method and a normal distribution. These parameters were employed to simulate random fractures, and therefore a fracture network model was constructed. The synthetic rock mass technique was utilized within discrete element modeling framework. This was implemented through Fish language programming. This technique allows the joint and fracture network to be embedded into the contact model of the particles. The resulting slope model incorporates joints and accurately reflects the presence of structural planes. The final layering and joint distribution within the slope model are shown in Figure 7b.
3.2.1 Calibration of the micromechanical parameters in the discrete element model
The discrete element model simulates the mechanical behavior of rocks by assigning bonding parameters to the contacts between particles. Due to the complex relationship between microscale and macroscale mechanical parameters, macroscopic mechanical parameters of rocks cannot be directly applied in numerical simulations. Therefore, the micromechanical contact parameters in the discrete element model need to be appropriately calibrated. Rocks are typically modeled via the parallel bond model (PBM) (Wang, 2022; Yan and Wang, 2023; Zhao et al., 2021; Deo and Neithalath, 2010; Liu et al., 2021). The calibration process for the micromechanical contact parameters involves several key steps. First, standard virtual samples were created to replicate laboratory conditions. Next, uniaxial compression simulations were conducted on these virtual samples. Finally, a trial-and-error method was employed to iteratively adjust the microscale parameters based on the macroscopic mechanical properties of the rocks. This process continued until the mechanical parameters of the virtual samples closely matched those of the actual rock specimens. The final stress‒strain curves obtained from the numerical simulations for limestone, mudstone siltstone, and coal are shown in Figure 8. The strength parameters of the virtual samples aligned closely with the macroscopic mechanical parameters of the real rock samples. The final micromechanical parameters are presented in Table 4.

Figure 8. Stress‒strain curves for different rock samples obtained from discrete element simulations: (a) limestone. (b) Mudstone siltstone. (c) Coal.
Table 4. Micromechanical parameters for numerical simulations.
The smooth joint model (SJM) was employed for the joints in the rock mass, as it allows particles to slide freely along the joint planes without producing a bumping effect, thereby accurately capturing the mechanical behavior of the joints (Bahaaddini et al., 2015; Zhang et al., 2019). Previous studies have demonstrated that the micromechanical parameters of the smooth joint model closely align with the macroscopic parameters. Therefore, the macroscopic parameters can be used as approximate substitutes for the micromechanical parameters. The structural plane parameters used in this study were derived from previous studies (Ding, 2014), as detailed in Table 5. Once these values were assigned, the particle assembly was allowed to reach equilibrium under gravitational forces.
Table 5. Micromechanical parameters of the structural planes.
3.2.2 Numerical simulation setup
Once the two-dimensional discrete element model was constructed, monitoring points were set at the foundation of the transmission towers to monitor foundation displacement. The simulated mining method involved removing two-dimensional disks to represent the excavated material. The length of the mining zone is 500 m, and each working face advanced by 50 m. After each mining step, the model is equilibrated before the next mining step.
4 Analysis of the deformation and failure of extremely gently inclined slopes during mining
4.1 Deformation characteristics of overlying strata from physical model tests
Figure 9 shows the deformation evolution of the overlying strata at different mining stages. When the mining face advanced to 50 m (Figure 9a), no significant deformation was observed in the overlying strata. As the mining face advanced to 100 m (Figure 9b), the immediate roof exhibited slight bending and subsidence, accompanied by the formation of minor interlayer fractures. When the mining face reached 150 m (Figure 9c), the immediate roof suddenly collapsed, while the overlying strata above the collapse zone experienced slight bending and subsidence, which resulted in the formation of distinct interlayer fractures. When the mining face advanced to 200 m (Figure 9d), the collapse zone extended both toward the mining face and into the overlying strata. This led to the development of a series of significant interlayer fractures. When the coal seam was mined between 200 m and 250 m (Figures 9d,e), the immediate roof behaved like a “cantilever beam” under load, and it deformed as mining progressed. Over time, fractures in the overlying strata propagated upward toward the ground surface. When the mining face advanced to 300 m (Figure 9f), the deformation of the overlying strata further intensified. This exacerbated the impact on the ground surface and led to the appearance of tension cracks at the slope toe. When the mining face advanced to 350 m (Figure 9g). Lateral collapse of rock masses began, and significant tension cracks developed in the middle and lower parts of the slope. Additionally, some irregular cracks formed in the middle of the slope. Finally, as the mining face advanced to 400 m (Figure 9h), tension cracks along the joints in the middle of the slope became more pronounced.
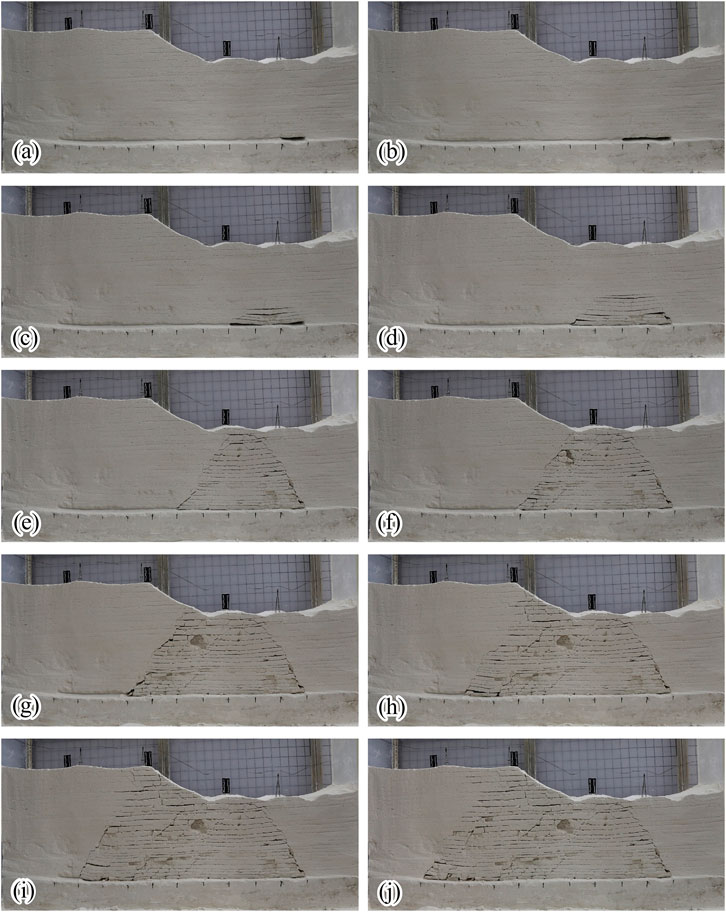
Figure 9. Deformation evolution of overlying strata during coal seam mining. (a) 50 m, (b) 100 m, (c) 150 m, (d) 200 m, (e) 250 m, (f) 300 m, (g) 350 m, (h) 400 m, (i) 450 m, and (j) 500 m.
Figure 10 shows the local deformation characteristics of the slope and overlying strata during coal mining. As depicted in Figure 10a, the goaf formed by coal extraction significantly impacted the slope. This impact was manifested primarily through the activation of preexisting fractures, the propagation of interlayer fractures, and the extension of these fractures to the ground surface, which ultimately led to various ground surface cracking phenomena. Since the unfractured original rock mass possesses a high strength, the internal damage within the rock layers was relatively limited. The primary mechanism driving deformation and failure was the unloading effect of mining activities, which disturbed, activated, and propagated preexisting fractures in the slope. This process reveals the deformation and failure control mechanisms of extremely gently inclined, layered, and fractured rock slopes under coal mining conditions. Figure 10b shows that when the mining face advanced to 150 m, the immediate roof of the goaf typically exhibited simply supported beam fracture characteristics. This observation highlights the reliability of the similar material configuration used in the physical model and clearly demonstrates the stepwise unloading and failure characteristics of the overlying strata in the goaf. As depicted in Figure 10c, when the mining face advanced to 250 m, roof fractures and localized collapse occurred within the goaf. The roof rock mass in the unmined zone exhibited a cantilever beam phenomenon, which may lead to preferential fracturing in subsequent mining operations.
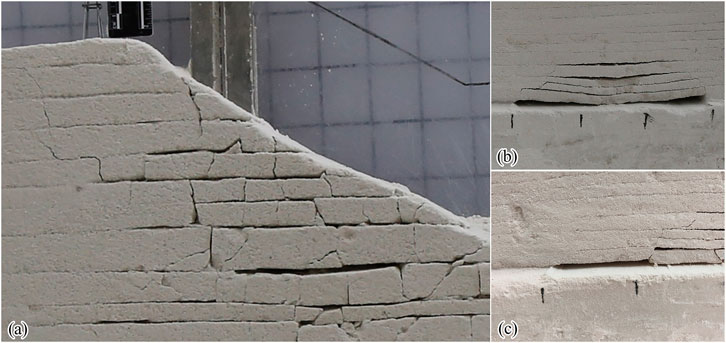
Figure 10. Local deformation characteristics of the slope and overlying strata during mining: (a) deformation in the middle of the slope at a mining distance of 400 m; (b) collapse characteristics of the coal seam roof at a mining distance of 150 m; (c) deformation and failure characteristics of the rock layers at a mining distance of 250 m.
4.2 Fractal characteristics of fracture networks in overlying strata
As the mining face advances, mining-induced fractures continuously initiate, propagate, and evolve into fracture networks. These fracture networks often exhibit complex geometric shapes and distribution patterns, which makes it challenging to comprehensively and accurately describing their characteristics using traditional geometric parameters challenging. The fractal dimension, which quantifies the self-similarity of fracture networks across different scales, provides a robust and scientific approach for analyzing the development and distribution of fractures.
In this study, the box-counting dimension (DB) method was employed to calculate the fractal dimension of fracture networks. In accordance with the definition of the box-counting dimension, grids with different side lengths ε were used to cover the nonempty, bounded subset (F set) in n-dimensional Euclidean space. Based on the image resolution, the grid sizes were set to [2:9], and the number of grids occupied by the fracture network, Nε(F), was calculated for each coverage. The relationship between lg (Nε) and lg (1/ε) was then fitted to a straight line, and the slope of this line represented the box-counting dimension (DB). The detailed implementation process is outlined as follows: (1) Image preprocessing: A crack analysis system was used to convert the images to grayscale and perform binary processing (Chun et al., 2018). (2) Image loading: Binary-processed fracture network images were loaded for further analysis. (3) Definition of box size: Different box sizes were defined to systematically cover the image. (4) Box-counting algorithm: The box-counting method was applied to count the number of boxes required to cover the image at different box sizes. (5) Data preprocessing: Invalid data were filtered out, and the logarithmic values were calculated. (6) Linear regression: Linear regression analysis was performed on the logarithmic values.
Figure 11 shows the distribution of the fracture network in the overlying strata after binary processing. The overlying strata at a mining distance of 100 m (see Figures 11a,b) exhibited only slight deformation prior to mining. The black areas in the images represent the goafs; therefore, the images for mining distances of 50 m and 100 m were excluded from calculating the fractal dimension of the fracture network. The lg(Nε) - lg(1/ε) relationship curves for the fracture networks in the overlying strata at other mining distances are shown in Figure 12. All linear correlation coefficients (R2) exceeded 0.9, indicating a high degree of self-similarity in the fracture network distribution. This result confirms that the fracture network possesses typical fractal characteristics. Consequently, the processes of formation, propagation, connectivity, and closure of the fracture network during mining can be described via the fractal dimension.
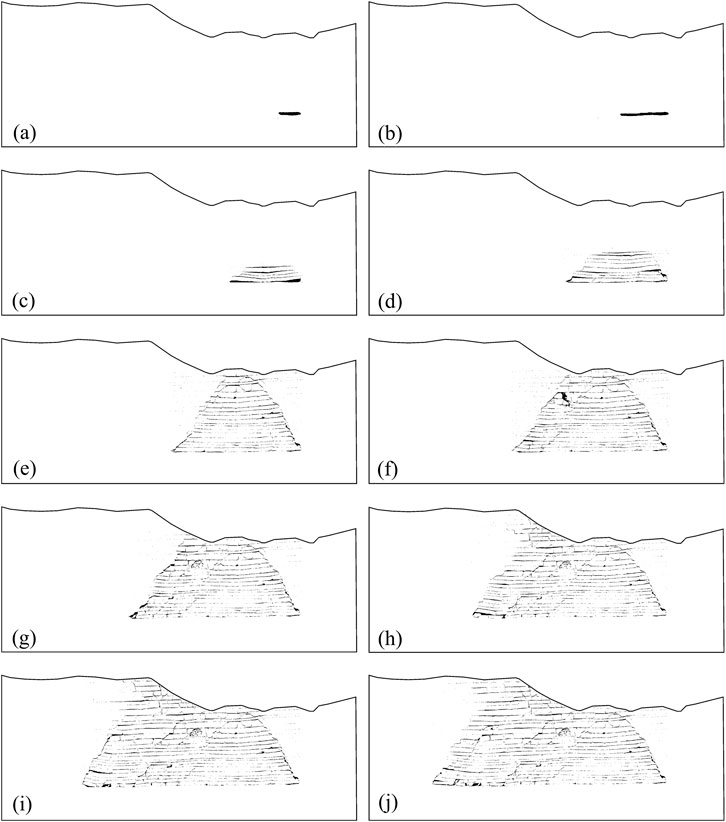
Figure 11. Distribution of the fracture network in the overlying strata at various simulated mining distances. (a) 50 m, (b) 100 m, (c) 150 m, (d) 200 m, (e) 250 m, (f) 300 m, (g) 350 m, (h) 400 m, (i) 450 m, and (j) 500 m.
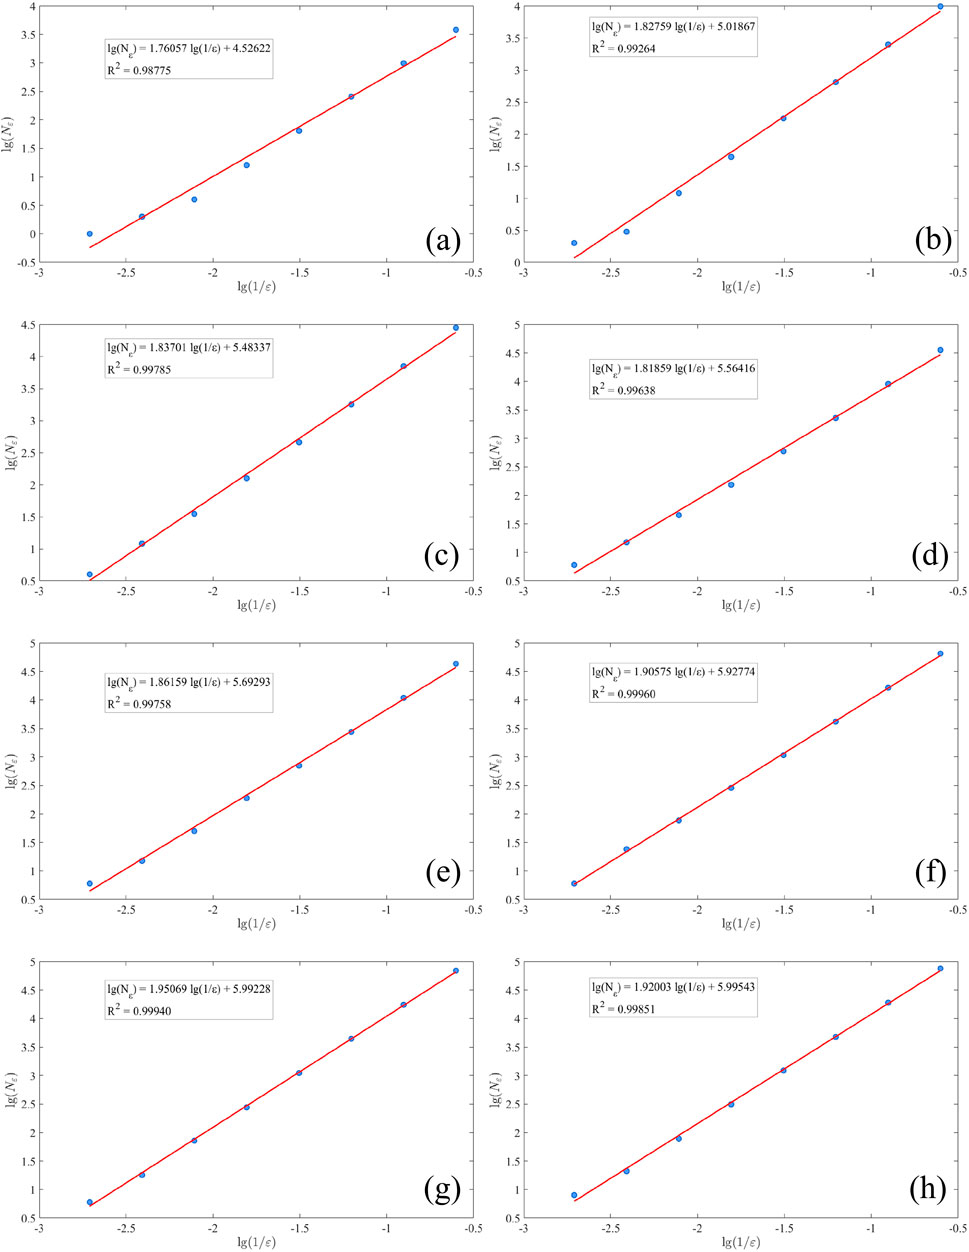
Figure 12. Relationship curves (lg(Nε) - lg(1/ε)) of the fracture network in the overlying strata at various simulated mining distances. (a) 150 m, (b) 200 m, (c) 250 m, (d) 300 m, (e) 350 m, (f) 400 m, (g) 450 m, and (h) 500 m.
When the mining face advanced to 150 m (Figure 12a), the immediate roof collapsed, and interlayer fractures formed in the overlying strata. The fractal dimension was calculated to be 1.76057. As the mining face advanced to 200 m (Figure 12b), the fracture network rapidly expanded with the advancement of the mining face. This expansion occurred both toward the mining face and the overlying strata, resulting in the formation of a series of significant interlayer fractures. Correspondingly, the fractal dimension increased sharply to 1.82759. When the mining face advanced to 250 m (Figure 12c), the fracture network became increasingly complex and irregular due to the formation of new fractures or the extension of existing fractures. This led to an increase in the fractal dimension to 1.83701. When the mining face advanced to 300 m (Figure 12d), the fractal dimension decreased to 1.81859, indicating significant compaction of the overlying strata. This compaction reduced the complexity of the fracture network and led to partial closure or simplification of fractures during mining operations. When the mining face advanced to 350 m and 450 m (Figures 12e–g), the fractures continued to extend and branch, further increasing the irregularity and complexity of the fracture network. The fractal dimensions increased to 1.86159, 1.90575, and 1.95069, respectively. When the mining face advanced to 500 m (Figure 12h), the complexity of the fracture network diminished. Fracture extension became limited, and the closure or simplification of fractures led to a decrease in the fractal dimension to 1.92003.
As the mining face advanced, the evolution of the fracture network was characterized by the formation and expansion of new fractures, as well as the compaction and closure of existing fractures. The fractal dimension of the fracture network in the mined rock mass exhibited localized decreases but demonstrated an overall increasing trend (Figure 13). This indicated that, despite temporary reductions in complexity due to fracture closure, the complexity and irregularity of the fracture network were generally increased.
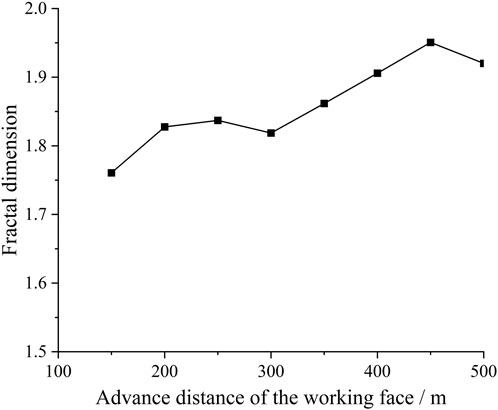
Figure 13. Relationship between the mining face advance distance and the fractal dimension of fractures.
4.3 Deformation of the slope and its impact on transmission towers
Photographs at various mining face advancement stages were captured during the simulation experiment (Figure 14) to document the deformation and failure of the slope surface and transmission towers. When the mining face advanced to 250 m (Figure 14a), the deformation of the rock layers propagated upward through the fracture network. This resulted in the formation of tensile‒shear composite cracks on the slope surface. Three primary cracks nearly perpendicular to the mining direction developed and were surrounded by tree-like branch cracks. When the mining face advanced to 300 m (Figure 14b), the slope surface cracks expanded outward, and a new crack nearly perpendicular to the mining direction formed near the slope toe. When the mining face advanced to 350 m (Figure 14c), the surface cracks continued to extend in the direction of the mining face, and the existing surface cracks gradually closed. Two new cracks nearly perpendicular to the mining direction developed in the lower part of the slope. When the mining face advances to 400 m (Figure 14d), the deformation in the middle and lower parts of the slope intensifies. In addition to cracks nearly perpendicular to the mining direction, numerous branching cracks extending in multiple directions were observed. As the mining face advanced to 450 m (Figure 14e), two prominent penetrating cracks appeared on the ground surface to the left of Tower 2, which was located in the middle of the model. The slope showed signs of deformation toward the free face, and Tower 2 also tended to deform toward the free face due to the ground surface deformation. When the mining face advanced to 500 m (Figure 14f), new cracks appeared on the ground surface to the left of Tower 2, whereas the existing cracks in this region began to close gradually. Simultaneously, new cracks emerged on the ground surface to the right of Tower 2. The overall deformation of the slope and Tower 2 toward the free face intensified.
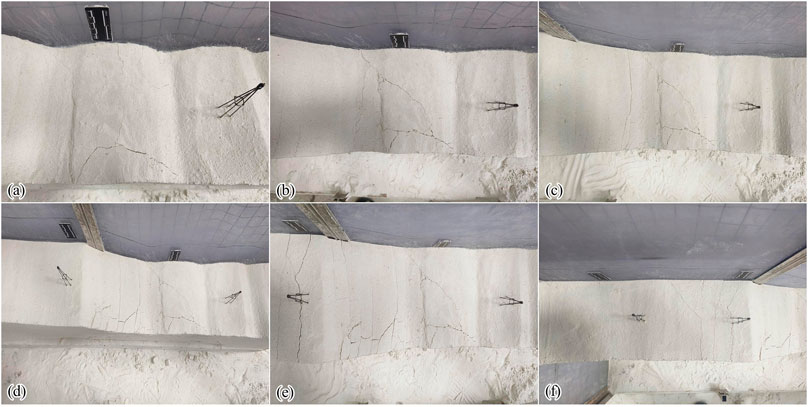
Figure 14. Distribution of ground surface cracks at various simulated mining distances. (a) 250 m, (b) 300 m, (c) 350 m, (d) 400 m, (e) 450 m, and (f) 500 m.
The deformation and failure of the slope and their effects on transmission towers during coal mining are illustrated in Figure 15. The stress release in rock layers during underground mining led to the loss of support in the roof rock and subsequent failure of the rock mass. This resulted in the collapse of the overlying strata into the goaf, forming a collapse zone. The disruption of the stress equilibrium in the rock layers above the collapse zone led to fracturing and layer separation. The overlying rock layers underwent overall downward bending. The movement, deformation, and failure of the rock layers caused deformation in the surface soil and rock, including subsidence, horizontal deformation, inclination, and curvature changes.
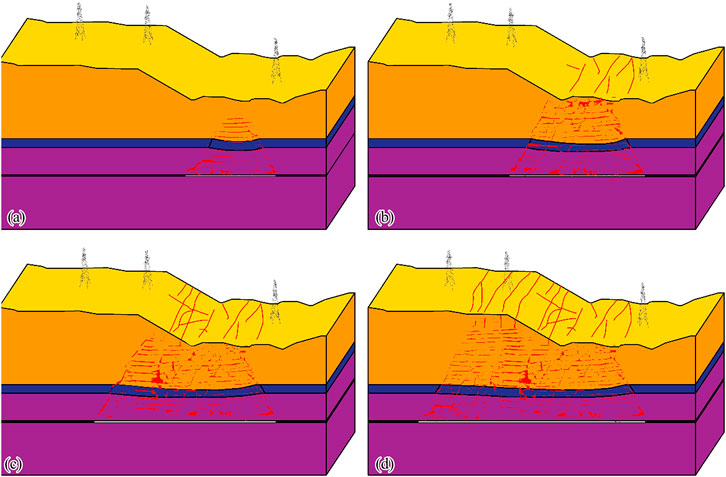
Figure 15. Deformation and failure of the slope and their impact on transmission towers during mining. The mining face advanced to (a) 150 m, (b) 250 m, (c) 350 m, and (d) 500 m.
Surface subsidence can be either uniform or nonuniform. In the case of uniform subsidence, the foundation and transmission towers experienced overall movement, which did not generate additional internal forces. Consequently, the impact on the transmission towers was relatively minor. However, when the subsidence was nonuniform, the foundation underwent differential settlement, which caused the transmission towers to tilt and develop additional internal forces. These forces can significantly affect the structural stability of the towers. The horizontal deformation included both tensile deformation and compressive deformation. The effects of horizontal deformation were transmitted through the foundation. This process causes additional horizontal stress on the transmission towers, which can lead to structural damage or cracking in the tower foundation.
The combined effects of ground surface deformation directly affected the foundation of the transmission towers. This led to additional internal forces and deformation in the tower components. These changes in the stress state and deformation within the tower structure were transmitted through the foundation to the surrounding soil. This process further exacerbates the additional internal forces and deformation in the transmission towers. The advancement of the mining face triggered a dynamic process of internal stress changes and deformation development. If the inclination of the transmission tower exceeds a certain threshold or the additional stress surpasses the structural strength of the tower, structural failure may occur. Therefore, the dynamic deformation caused by mining is the primary factor driving the combined deformation of the ground surface, foundation, and transmission towers.
4.4 Analysis of discrete element simulation results for slope deformation
Figure 16 shows the vertical displacement contour map of the slope under mining activity. When the mining face advanced to 50 m (Figure 16a), the immediate roof exhibited slight bending and subsidence under gravitational forces, and the maximum subsidence of approximately 0.01 m occurred at the center of the goaf. The floor showed significant unloading. When the mining face advanced to 100 m (Figure 16b), the bending and subsidence of the immediate roof intensified, and the maximum subsidence was approximately 0.05 m. The upward propagation of deformation in the overlying strata followed a trapezoidal pattern, with its magnitude decreasing progressively. The maximum surface subsidence was approximately 0.045 m. When the mining face advanced to 150 m (Figure 16c), the immediate roof demonstrated significant bending and subsidence, and the maximum bending of approximately 0.3 m occurred at the center of the goaf. The maximum surface displacement was approximately 0.2 m. When the mining face advanced to 200 m (Figure 16d), the immediate roof experienced its first collapse, and interlayer fractures formed in the overlying strata. The compaction was most significant at the center of the goaf, with a deformation value of approximately 4 m. The maximum surface displacement was approximately 1 m. When the mining face advanced to 250 m (Figure 16e), the displacement contour map revealed an irregular trapezoidal pattern propagating upward. The roof of the new goaf collapsed completely. The maximum vertical displacement reached approximately 4 m, while the maximum surface displacement was approximately 2.25 m. When the mining face advanced to 300 m (Figure 16f), the roof of the new goaf did not collapse; however, displacement continued to propagate upward to the ground surface. Consequently, the maximum surface displacement reached approximately 2.5 m. Tension cracks began to develop in the upper part of the slope above the goaf. When the mining face advanced to 350 m (Figure 16g), the goaf roof between 300 m and 350 m collapsed completely, while the tension cracks in the middle of the slope became compacted. The maximum surface displacement was approximately 3 m, and two large tension cracks formed in the upper part of the slope above the new goaf. These findings are consistent with field survey results. When the mining face advanced to 400 m (Figure 16h), the roof of the new goaf underwent significant bending and subsidence, while previously formed tension cracks were compacted. The maximum surface displacement was approximately 3.25 m, and large tension cracks formed in the upper part of the slope above the new goaf. When the mining face advanced to 400 m and 450 m (Figures 16i,j), the goaf roof collapsed completely, and the previously formed tension cracks were further compacted. Large tension cracks continued to appear in the upper part of the slope above the new goaf, and the maximum surface displacement reached approximately 3.5 m.

Figure 16. Numerical vertical deformation of the slope at various simulated mining distances. (a) 50 m, (b) 100 m, (c) 150 m, (d) 200 m, (e) 250 m, (f) 300 m, (g) 350 m, (h) 400 m, (i) 450 m, and (j) 500 m.
Figure 17 shows the numerical horizontal deformation characteristics of the slope during mining. Before mining reached a distance of 200 m (Figures 17a–d), the maximum horizontal displacement was located at the goaf roof, and the impact of this displacement was relatively minor. The horizontal displacement exhibited a symmetric distribution centered around the goaf. This symmetry arose from the horizontal orientation of the goaf and the relatively flat upper surface, which induced horizontal components as the roof deformed toward the goaf. When the mining face advanced to 250 m (Figure 17e), the horizontal displacement began to influence the ground surface. The maximum surface horizontal displacement reached approximately 0.13 m. However, owing to the influence of the ground surface topography, the horizontal displacement symmetry was disrupted, and most horizontal displacement occurred in the direction opposite to the mining face advancement. As the mining face advanced to 300–350 m (Figures 17f,g), the overlying strata underwent horizontal deformation toward the center of the goaf, which significantly impacted the ground surface. The maximum surface horizontal displacement reached approximately 0.7 m and was directed toward the free face. These pronounced differences in horizontal displacement caused tension cracks to form on the slope. When the mining face advanced to 400–450 m (Figures 17h,i), significant horizontal displacement was primarily observed near the ground surface, whereas the slope deformed further toward the free face. The maximum surface horizontal displacement reached approximately 1 m and was directed toward the free face. The large differences in horizontal displacement led to the formation of tension cracks at the rear of the slope. When the mining face advanced to 500 m (Figure 17j), the overall horizontal deformation of the slope stabilized.
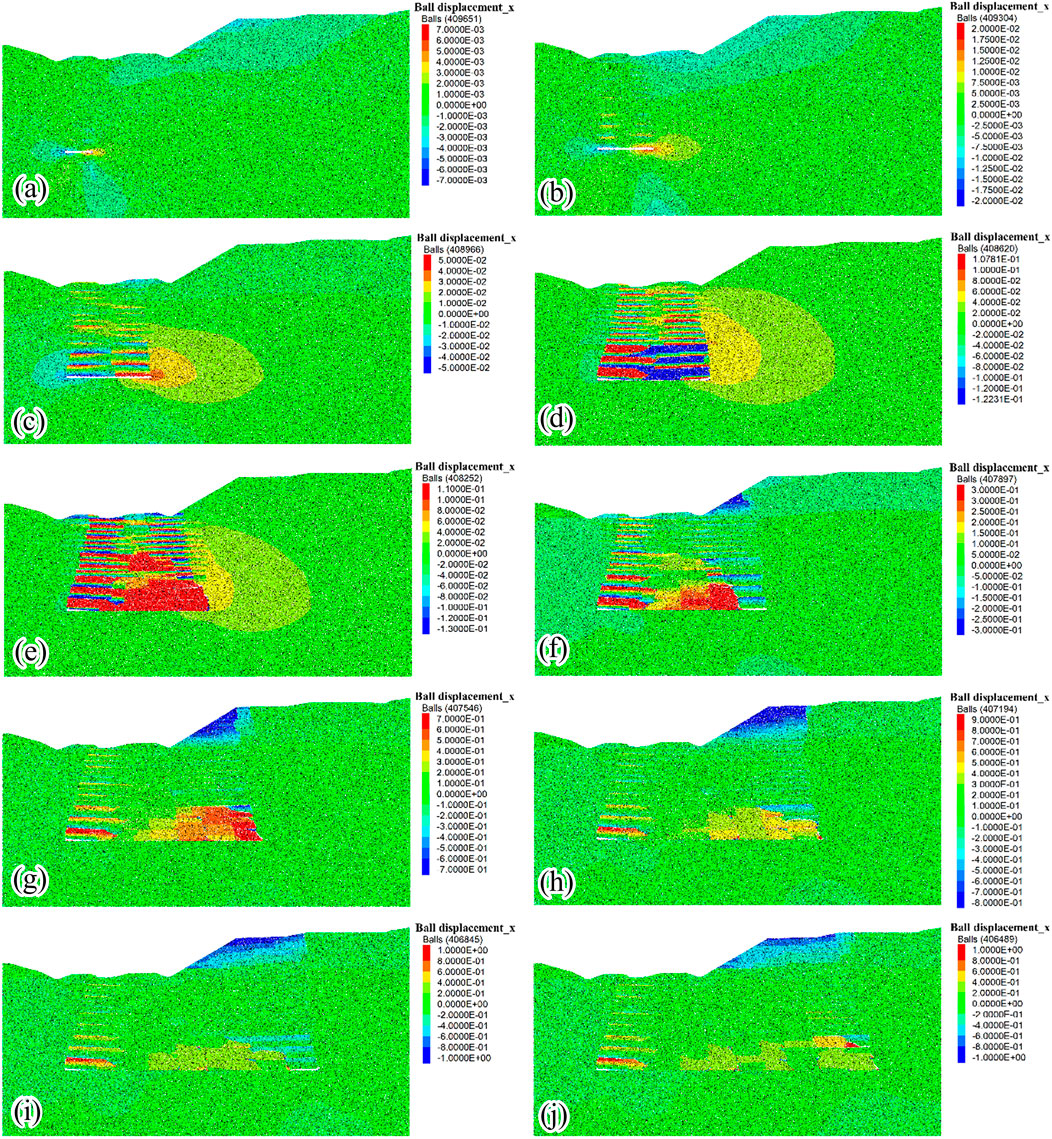
Figure 17. Numerical horizontal deformation of the slope at various simulated mining distances. (a) 50 m, (b) 100 m, (c) 150 m, (d) 200 m, (e) 250 m, (f) 300 m, (g) 350 m, (h) 400 m, (i) 450 m, and (j) 500 m.
4.5 Evolution of stress in the slope
Figure 18 shows the vertical stress distribution in the slope during mining. When the mining face advanced to 50 m (Figure 18a), the vertical stress within the slope exhibited a generally stratified pattern, and the maximum compressive stress reached approximately 7.4 MPa at the bottom of the model. Stress concentration was observed at both ends of the goaf. The direction of the maximum principal stress deviated, and the maximum compressive stress was approximately 6.75 MPa. As the mining face advanced from 100 m to 150 m (Figures 18b,c), the stress concentration at both ends of the goaf became more pronounced, and the maximum compressive stress values were 8.24 MPa and 10.7 MPa, respectively. As the mining face advanced from 200 m to 500 m (Figures 18d–j), significant stress concentration persisted at both ends of the goaf. The corresponding maximum stress values were 10.2 MPa, 11.26 MPa, 13.1 MPa, 12.6 MPa, 10.7 MPa, 12.8 MPa, and 12.7 MPa, respectively. The overlying strata at the center of the goaf experienced cyclical processes of caving and compaction as mining progressed. These processes effectively restored the stress state in the central regions to conditions resembling the original in situ stress.
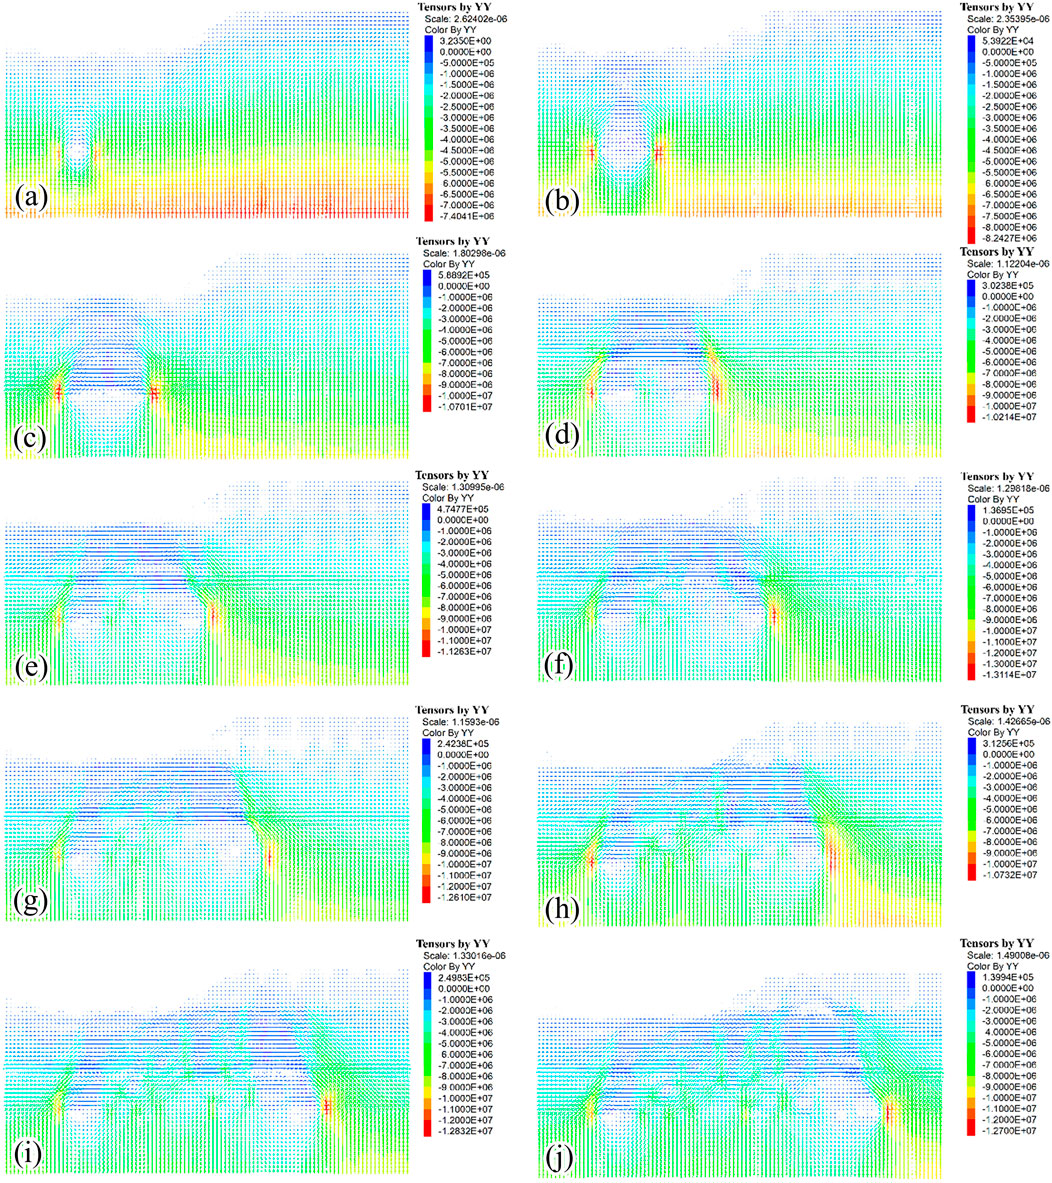
Figure 18. Evolution of stress in the slope at various simulated mining distances. (a) 50 m, (b) 100 m, (c) 150 m, (d) 200 m, (e) 250 m, (f) 300 m, (g) 350 m, (h) 400 m, (i) 450 m, and (j) 500 m.
4.6 Evolution of cracks in the slope
Figure 19 illustrates the evolution of fractures in a moving slope during the mining process. Before mining reached a distance of 100 m (Figures 19a,b), no significant fractures developed in the upper part of the goaf, and only sporadic particle detachment occurred. When the mining face advanced to 150 m (Figure 19c), vertical fractures began to develop in the roof of the goaf. These fractures were primarily concentrated along the edges and in the central region but did not propagate into the limestone layer. As the mining face advanced to 200–250 m (Figures 19d,e), the immediate roof of the goaf collapsed, forming a caving zone. The loss of support in the overlying rock mass led to its deformation and failure. Vertical fractures developed at the edges of the goaf, whereas numerous irregular fractures formed in the central region. Due to the high strength of the limestone, fracture distribution within it remained sparse, whereas the weaker overlying mudstone layer experienced extensive scattered fractures. When the mining depth reached 250 m, fractures extended to the ground surface. When the mining face advanced to 300 m (Figure 19f), the roof of the new goaf did not collapse. However, vertical fractures in the overlying rock layers continued to extend upward. This resulted in the development of scattered fractures in the slope body and the formation of tension fractures on the ground surface. When the mining face advanced to 350–500 m (Figures 19g–j), fractures continued to propagate both toward the goaf and the slope surface. However, due to increased depth caused by the terrain undulations, the mining-induced fractures did not reach the slope surface. Nonetheless, the disrupted structural planes within the rock mass led to the formation of tension cracks at the slope surface. Therefore, the numerous fractures observed on the slope surface in the physical model tests can be attributed to mining-induced cracking, deformation, and displacement of the primary bedding planes and joints in the slope rock layers. This process ultimately triggered the formation of extensive ground surface cracks.

Figure 19. Evolution of cracks in the slope at various simulated mining distances. (a) 50 m, (b) 100 m, (c) 150 m, (d) 200 m, (e) 250 m, (f) 300 m, (g) 350 m, (h) 400 m, (i) 450 m, and (j) 500 m.
4.7 Deformation of transmission tower foundations
In two-dimensional discrete element numerical simulations, it is not practical to directly construct a detailed model of the transmission tower. Instead, two independent foundations representing the transmission tower were established on the slope surface to monitor the settlement values of each foundation. The tower inclination was then calculated basis of the difference in settlement between the two foundations and the horizontal distance separating them. In accordance with the Chinese standard “Operating Code for Overhead Transmission Lines” (DL/T 741–2019) and related maintenance guidelines, the maximum allowable values for tower inclination and cross-arm deviation are listed in Table 6.
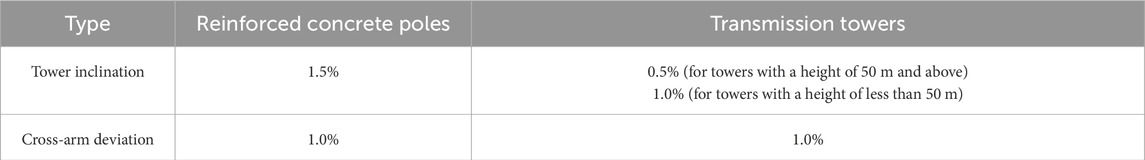
Table 6. Maximum allowable values for tower inclination and cross-arm deviation.
Figure 20a presents the settlement curve for the foundation of Tower 1. The settlement values exhibited periodic changes, and the settlement curve became steeper as the mining face advanced. The settlement curve often displays a step-like pattern. Since the foundation of Tower 1 is located at the edge of the goaf, it experienced rapid settlement deformation from the start of mining to a distance of 300 m. Thereafter, the overall pattern was characterized by dynamic stability and slow descent. This finding indicated that the initial mining stage had a significant effect on both foundations. As the mining face advanced, ground surface deformation gradually stabilized, and the influence of mining on the foundations diminished. The settlement trends of both foundations eventually reached a relatively stable state. The maximum settlement observed was approximately 0.134 m for foundation F1-1 and 0.164 m for foundation F1-2, yielding a vertical settlement difference of approximately 3 cm, which is consistent with the field forensic investigation reporting a vertical displacement difference of 3–5 cm between the cracks at Tower Foundation No. 1. Figure 20b shows the tower inclination values calculated from the difference in settlement between the foundations of Tower 1. A negative inclination value indicates movement toward foundation F1-2, which corresponds to the mining advancement direction. Within the initial 300 m of mining, each mining operation caused an increase in tower inclination. The inclination curve exhibited a step-like pattern, with a maximum value of 0.55%. The inclination curve subsequently gradually decreased. This observation indicated that subsequent mining activities had a reduced impact on Tower 1. Nevertheless, the foundation of the transmission tower continued to experience slow tilting and deformation. Given that the tower height is less than 50 m, the maximum inclination value remains within the allowable limit per relevant standards. However, the tower still requires reinforcement and ongoing monitoring to ensure structural stability.
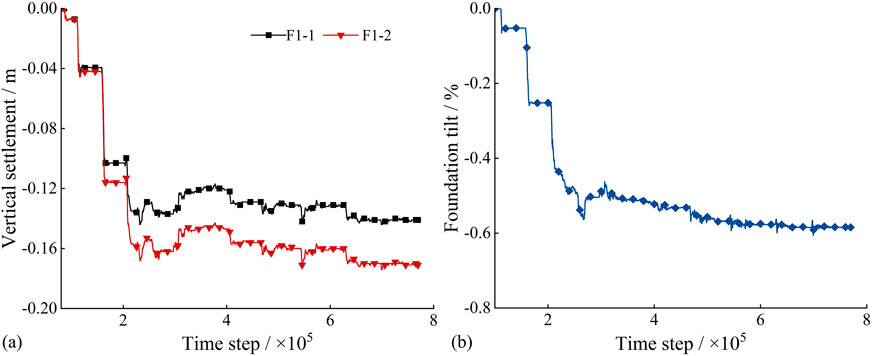
Figure 20. Settlement and inclination curves of the foundation for Tower 1: (a) Settlement; (b) Inclination.
Figure 21a depicts the settlement curves for the two foundations of Tower 2. The settlement values initially increased slowly and then exhibited periodic, step-like variations. The initial mining stage had a minimal impact on Tower 2. However, as the goaf advanced, its influence on Tower 2 increased significantly. As a result, the settlement curve became abruptly steeper. The settlement trends for the two foundations were generally consistent, whereas the settlement difference initially increased and then decreased as mining progressed. The maximum settlement recorded was approximately 3.08 m for foundation F2-1 and 3.05 m for foundation F2-2. Figure 21b shows the inclination values of Tower 2 calculated from the difference in settlement between its two foundations. A positive inclination value indicates tilting toward foundation F2-1, which aligns with the direction of the slope face. Before the time step of 470,000, the mining operations had a minimal impact on Tower 2, and each mining operation resulted in only a slight increase in tower inclination. As the mining face advanced from 350 m to 400 m, the inclination curve showed a step-like increase, and the maximum inclination value reached 2.2%. The inclination curve subsequently exhibited a step-like decrease. This observation indicated that as the goaf approached Tower 2, the tower experienced progressive slow deformation. When the goaf reached the ground surface near the tower, its proximity to the slope face resulted in significant inclination and deformation. As mining continued and the goaf advanced, the overall slope tended to compact toward the back. This process led to a decrease in the inclination and deformation of Tower 2. Given that the tower height is less than 50 m, the maximum inclination value exceeds the allowable limit; therefore, the tower may be at risk of collapse and failure.
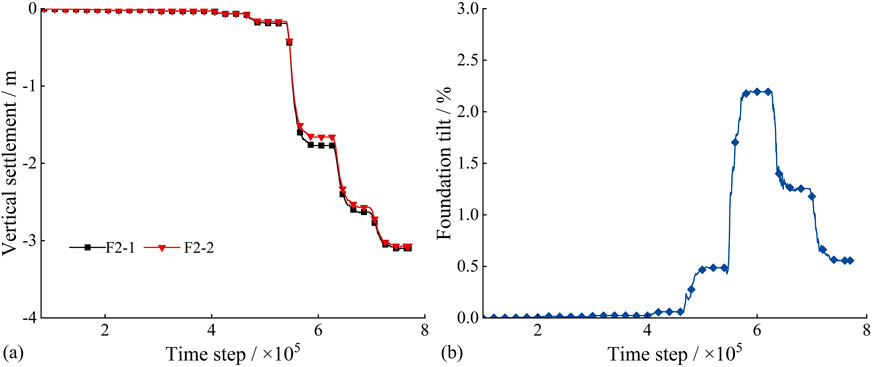
Figure 21. Settlement and tilt curves of the foundation for Tower 2: (a) Settlement; (b) Inclination.
Figure 22a presents the settlement curves for the two foundations of Tower 3. The settlement values remained relatively flat during the initial stage, then gradually increased during the middle stage, and finally exhibited a step-like increase. This finding indicated that the early mining stage had a minimal impact on Tower 3. However, as the goaf approached transmission Tower 3, the increased influence resulted in a sudden steepening of the settlement curve. The settlement trends for the two foundations were generally consistent, although foundation F3-1 exhibited slightly greater settlement than foundation F3-2. The maximum settlement was approximately 0.34 m for foundation F3-1 and 0.26 m for foundation F3-2. Figure 22b shows the inclination values of Tower 3 calculated from the difference in settlement between its two foundations. A positive inclination value indicates tilting toward foundation F3-1, which corresponds to the direction of the slope face. During the first 400 m of mining, the goaf had a minimal impact on Tower 3, and each mining operation caused only a slow and gradual increase in tower inclination. When mining face advanced to 450 m, the inclination curve showed a small step-like increase, and the inclination value reached 0.08%. At a mining distance of 450 m, the inclination curve exhibited a sudden upward trend. This observation indicated that as the goaf approached Tower 3, the tower experienced progressive slow deformation. Once the goaf reached the ground surface near the tower, it caused significant inclination and deformation, and the maximum inclination value reached 1.43%. Given that the tower height is less than 50 m, the maximum inclination value exceeds the allowable limit; therefore, the tower may be at risk of collapse and failure.
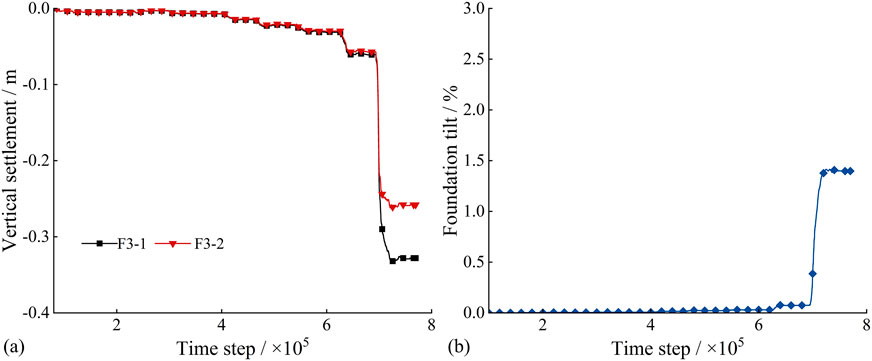
Figure 22. Settlement and inclination curves of the foundation for Tower 3: (a) Settlement; (b) Inclination.
5 Conclusion
This study conducted scaled physical model tests and two-dimensional discrete element simulations to investigate the deformation and failure of gently inclined fractured rock slopes in the Yunnan and Guizhou karst regions under mining-induced effects, as well as their impact on transmission towers within the study area. These findings provide a theoretical basis for risk assessment of transmission towers in mining-affected regions. The main conclusions are as follows:
1. The scaled physical simulations reveal a nonmonotonic increase in the fractal dimension of cracks, yet the crack evolution exhibits pronounced fractal self-similarity, offering critical insights for predicting surface deformation and assessing risks to transmission towers within the region.
2. Numerical simulations reveal three primary stages in the evolution of surface fissures induced by coal mining: overburden collapse, fracture propagation, and surface subsidence. A continuous mining span of 150 m constitutes the critical threshold for roof failure.
3. Deformation and failure of transmission towers are attributable to differential settlement of isolated footings and surface cracking, with towers situated on slopes being particularly vulnerable. In mining areas containing transmission towers, the coal extraction sequence must be carefully optimized, and strategic coal pillars should be retained to mitigate uneven surface subsidence, thereby ensuring the safety of transmission infrastructure within the region.
This study partially elucidates the subsidence mechanisms of gently dipping, stratified jointed rock slopes in southwestern China under coal mining activities and their influence on transmission tower deformation. However, owing to the two-dimensional simplifications inherent in the 2D DEM numerical model, our analysis is confined to identifying fracture, deformation, and subsidence patterns within the rock strata, as well as the tilting behavior of two independent tower foundations, exclusively under the assumed conditions. Consequently, a key limitation of this work lies in its inability to fully capture the complex, three-dimensional characteristics of actual surface subsidence and transmission tower foundation deformation. In future studies, more realistic three-dimensional numerical simulations should be employed to investigate the movement patterns of strata under coal mining-induced stresses and their corresponding impacts on the deformation characteristics and failure mechanisms of transmission towers within the region. Furthermore, when concrete risk warning indicators for transmission towers are established, a direct correlation should be formulated between critical tower tilt angles and field-measured fracture density thresholds, enabling more efficient and timely early warning of tower failure risk.
Data availability statement
The original contributions presented in the study are included in the article/supplementary material, further inquiries can be directed to the corresponding author.
Author contributions
YW: Conceptualization, Methodology, Writing – original draft. LZ: Methodology, Writing – original draft. YL: Writing – original draft. JW: Writing – review and editing. XN: Conceptualization, Writing – review and editing. DZ: Writing – review and editing. DL: Writing – review and editing.
Funding
The author(s) declare that financial support was received for the research and/or publication of this article. The work presented in this paper was supported by the Research on Monitoring and Evaluation Technology for Power Transmission and Distribution Lines in Mining Collapse Areas of China Southern Power Grid Co., Ltd. (No. GZKJXM20222498).
Conflict of interest
Authors YW, LZ, YL, and XN were employed by Bijie Power Supply Bureau of Guizhou Power Grid Co., Ltd., CSG. Author JW was employed by Electrical Science Institute of Guizhou Power Grid Co., Ltd., CSG. Authors DZ and DL were employed by Powerchina Guizhou Electric Power Engineering Co., Ltd.
The authors declare that this study received funding from China Southern Power Grid Co., Ltd. The funder had the following involvement in the study: study design, data collection, and the decision to submit the manuscript for publication.
Generative AI statement
The author(s) declare that no Generative AI was used in the creation of this manuscript.
Any alternative text (alt text) provided alongside figures in this article has been generated by Frontiers with the support of artificial intelligence and reasonable efforts have been made to ensure accuracy, including review by the authors wherever possible. If you identify any issues, please contact us.
Publisher’s note
All claims expressed in this article are solely those of the authors and do not necessarily represent those of their affiliated organizations, or those of the publisher, the editors and the reviewers. Any product that may be evaluated in this article, or claim that may be made by its manufacturer, is not guaranteed or endorsed by the publisher.
References
Bahaaddini, M., Hagan, P. C., Mitra, R., and Hebblewhite, B. K. (2015). Parametric study of smooth joint parameters on the shear behaviour of rock joints. Rock Mech. Rock Eng. 48, 923–940. doi:10.1007/s00603-014-0641-6
Buckingham, E. (1914). On physically similar systems; illustrations of the use of dimensional equations. Phys. Rev. 4, 345–376. doi:10.1103/physrev.4.345
Chun, L., Xu, Q., Bin, S., Fan, G. Y., and Univ, N. (2018). Digital image recognition method of rock particle and pore system and its application. J. Geotech. Eng. 40, 925–931. doi:10.11779/CJGE201805018
Dai, Z. B., Lu, X. L., and Cheng, Y. F. (2009). Study on foundations of overhead transmission lines in coal mine goafs. J. Wuhan Univ. (Engineering Edition). 42 (S1), 312–316.
Deo, O., and Neithalath, N. (2010). Compressive behavior of pervious concretes and a quantification of the influence of random pore structure features. Mater. Sci. Eng. A 528, 402–412. doi:10.1016/j.msea.2010.09.024
Ding, L. P. (2014). Study on formation mechanism of collapse-slide composite geological disasters induced by goaf collapse—A case study of dexing coal mine collapse-slide mass in dafang county, Guizhou province. Chengdu: Chengdu Univ. Technol.
Fu, Z., Tian, L., and Liu, J. (2022). Seismic response and collapse analysis of a transmission tower-line system considering uncertainty factors. J. Constr. Steel Res. 189, 107094. doi:10.1016/j.jcsr.2021.107094
Gou, Q. S., Jia, H. B., Huang, L., Li, H. B., and Zhang, Z. F. (2019). Study on safety of transmission towers based on surface movement prediction in top-coal caving mining. J. Coal Saf. 50, 226–231. doi:10.13347/j.cnki.mkaq.2019.08.053
Guo, W. B., and Zheng, B. (2011). Top-coal caving mining under high-voltage transmission towers and its safety study. J. Min & Saf. Eng. 28, 267–272.
He, W. L., and Kang, J. R. (1992). Study on law of surface movement and deformation in mountainous areas. J. China Coal Soc. 17, 1–15.
Kratzsch, I. H. (1986). Mining subsidence engineering. Environ. Geol. Water S. 8, 133–136. doi:10.1007/bf02509900
Lan, Z. Y. (2015). Physical simulation test study on deformation and failure mechanism of mining-induced landslides. Chengdu: Chengdu Univ. Technol.
Li, J. S. (2020). Study on multi-layer mining effect on deformation of mining-induced slopes in faer coal mine, Guizhou province. Chengdu: Chengdu Univ. Technol.
Li, B., Jian, M. J., Zhang, D. Q., and Zhang, G. C. (2012). Finite element analysis of foundation settlement of 220kV transmission tower with independent foundation. AMM 201–202, 602–607. doi:10.4028/www.scientific.net/amm.201-202.602
Liu, G. Y., Xu, W. J., Govender, N., and Wilke, D. N. (2021). Simulation of rock fracture process based on GPU-accelerated discrete element method. Powder Technol. 377, 640–656. doi:10.1016/j.powtec.2020.09.009
Lu, Z., Xu, S., Wang, S., Meng, X., and Hou, F. (2024). Research on risk assessment technology for transmission lines in mining affected areas. AIP Adv. 14, 105309. doi:10.1063/5.0231965
Ma, Y. T. (2017). Physical simulation study on genetic mechanism of mining-induced landslides under rainfall conditions—A case study of madaling landslide in Guizhou province. Chengdu: Chengdu Univ. Technol.
Qian, M. G., Miao, X. X., and He, F. L. (1994). Analysis of key blocks in stope “Masonry Beam” structure. J. China Coal Soc. (6), 557–563.
Qian, M. G., Xu, J. L., and Miao, X. X. (2001). “Key stratum theory of rock strata control and its application,” in Proceedings of the 5th national congress and academic seminar of China coal industry in the 21st century (Beijing, China).
Sepehri, M., Apel, D. B., and Hall, R. A. (2017). Prediction of mining-induced surface subsidence and ground movements at a Canadian diamond mine using an elastoplastic finite element model. Int. J. Rock Mech. Min. Sci. 100, 73–82. doi:10.1016/j.ijrmms.2017.10.006
Shi, W. B. (2016). Study on mechanism of slope deformation and failure induced by underground mining of gentle dip coal seams in mountainous areas. Chengdu: Chengdu Univ. Technol.
Sun, K. H. (2017). Analysis of mining influence on safety of transmission towers and design of reinforcement and reconstruction. Coal Min. 22, 64–67. doi:10.13532/j.cnki.cn11-3677/td.2017.05.016
Wang, J. L. (2022). Prediction of influence range of dangerous rock mass collapse in Zhaizi group, nayong county. Groundw. 44, 178–181. doi:10.19807/j.cnki.DXS.2022-01-056
Wang, X. M., Xiao, Y. J., Shi, W. B., Ren, J. J., Liang, F., Lu, J. Q., et al. (2022). Forensic analysis and numerical simulation of a catastrophic landslide of dissolved and fractured rock slope subject to underground mining. Landslides 19, 1045–1067. doi:10.1007/s10346-021-01842-y
Xiong, S. Z. (2022). Study on deformation and failure mechanism of high and steep slopes under underground mining conditions. Guizhou Univ.: Guiyang.
Yan, Y., and Wang, S. (2023). Simulation investigation of mechanical and failure characteristics of jointed rock with different shapes of joint asperities under compression loading. Comp. Part. Mech. 10, 45–59. doi:10.1007/s40571-022-00477-7
Yi, S. H., Zhang, Y., and Wang, X. (2022). Physical simulation test of mining-induced deformation of buildings based on 3D printing technology. Coal Eng. 54, 153–158. doi:10.11799/ce202203028
Yu, X. X. (2020). Study on deformation and failure mechanism of gentle reverse-dipping mining-induced slopes in karst mountainous areas. Guizhou univ.: Guiyang.
Yuan, G., Yang, B., Huang, Z., and Tan, X. (2018). Experimental study on the stability of the transmission tower with hybrid slab foundation. Eng. Struct. 162, 151–165. doi:10.1016/j.engstruct.2018.01.066
Zhang, D. B. (2013). Model test study on interaction mechanism between high and steep slopes and underground mining by caving method. Wuhan: China Univ. Geosci.
Zhang, S. B. (2023). Study on slope deformation evolution law and disaster-causing mechanism under multiple coal seams repeat mining. Guiyang: Guizhou Univ.
Zhang, S. B., Shi, W. B., Wang, Y., and Peng, X. W. (2024). Study on deformation and failure process of ultra-high and steep gentle dip reverse slopes under underground mining. J. Eng. Geol. 32, 1669–1682. doi:10.13544/j.cnki.jeg.2021-0542
Zhang, H. J., Yang, F. L., Zhang, X., and Zhang, X. L. (2018). Bearing capacity evaluation of transmission tower with composite protective plate foundation based on field measured settlement data. Build. Struct. 48 (13), 90–95. doi:10.19701/j.jzjg.2018.13.018
Zhang, Z. F., Jia, H. B., Gou, Q. S., and Li, H. B. (2019). Particle flow simulation study on deformation and failure of anti-dipping layered rock slopes. Sci. Technol. Eng. 19 (13), 56–64.
Zhang, H. Y., Li, X. M., and Sun, L. H. (2022). Study on law of surface subsidence in steeply inclined coal seam mining. Coal Eng. 54, 108–112.
Keywords: fractured rock slopes, mining-induced subsidence, transmission tower stability, DEM modeling, failure mechanism
Citation: Wu Y, Zhou L, Li Y, Wu J, Nie X, Zhao D and Liu D (2025) Failure of a gently inclined fractured rock slope induced by coal seam mining and its impact on transmission towers. Front. Earth Sci. 13:1703495. doi: 10.3389/feart.2025.1703495
Received: 11 September 2025; Accepted: 24 October 2025;
Published: 26 November 2025.
Edited by:
Binbin Yang, Xuchang University, ChinaReviewed by:
Lei Shi, China University of Mining and Technology, Beijing, ChinaZaiyong Wang, Taiyuan University of Technology, China
Copyright © 2025 Wu, Zhou, Li, Wu, Nie, Zhao and Liu. This is an open-access article distributed under the terms of the Creative Commons Attribution License (CC BY). The use, distribution or reproduction in other forums is permitted, provided the original author(s) and the copyright owner(s) are credited and that the original publication in this journal is cited, in accordance with accepted academic practice. No use, distribution or reproduction is permitted which does not comply with these terms.
*Correspondence: Xianglun Nie, MzA1MTg4Nzk5MEBxcS5jb20=