 Zhu Chen1
 Qiang Yuan
- 1China Energy Group Shendong Coal Group Liuta Coal Mine, Ordos, Inner Mongolia, China
- 2State Key Laboratory of Coal Mine Disaster Dynamics and Control, Chongqing University, Chongqing, China
- 3College of Safety Science and Engineering, Liaoning Technical University, Huludao, Liaoning, China
To investigate the tensile damage mechanism of rock mass under the coupled effects of cyclic loading and water-bearing conditions in deep engineering, this study conducts Brazilian splitting cyclic loading-unloading tests on dry and water-saturated siltstone specimens. The stress-strain characteristics, energy evolution patterns, and damage properties of rock mass under various stress path conditions are systematically analyzed. Results indicate that the plastic deformation of rock mass accumulates continuously with increasing peak stress and number of cycles, while the hysteresis loops shift toward higher strain levels. Saturated specimens exhibit a more pronounced hysteresis loop migration during initial cycles, confirming the significant influence of moisture on rock mass deformation behavior. In terms of energy evolution, both moisture content and stress path jointly govern the energy evolution mode and damage progression of rock mass. Under low to medium stress paths, energy evolution demonstrates a typical nonlinear growth pattern, with elastic energy consistently dominating. Under high stress paths, initial plastic deformation leads to a unique phenomenon where the energy curve initially decreases before rising. Moisture exerts a dual effect on energy dissipation: in the initial stage, it promotes rapid accumulation of dissipated energy through lubrication, whereas near the failure stage, the weakening effect causes instability and failure of rock mass at a lower energy threshold. The evolution stages of dissipated energy closely correspond to the characteristics of the stress-strain curves and can more sensitively reflect the internal damage evolution process of rock mass. Damage evolution analysis further reveals that saturated specimens exhibit an abrupt inflection point in damage and overlapping curve characteristics at specific stress thresholds, with their damage growth rates significantly exceeding those of dry specimens across all stress paths. The damage variable based on energy dissipation shows a strong correlation with the dissipated energy evolution stages, serving as an effective indicator for predicting rock mass damage evolution and failure.
1 Introduction
Deep reservoir rocks exist in complex stress environments and experience varying degrees of damage and failure under cyclic loading induced by roadway excavation, coal seam mining, and other engineering activities (Fu-kun et al., 2025; Bing-xiang et al., 2020). Since the tensile strength of rock is considerably lower than its compressive strength (Jia-xin et al., 2024), the failure of reservoir rock mass typically initiates in tensile stress zones or tensile-shear stress zones (Qing-Han, 2023). Investigating the energy evolution and tensile damage characteristics of siltstone under cyclic loading-unloading conditions holds significant theoretical value for understanding coal-rock deformation mechanisms and controlling the stability of deep mine roadways (Xiao et al., 2025).
Energy accumulation and dissipation accompany rock deformation (Gui-lin et al., 2019), serving as the primary driving force for damage effects and potentially leading to instability and failure of the rock (Liang et al., 2025). Research by He-ping et al. (2005) indicated that stress-strain intensity cannot adequately explain rock failure, whereas an energy perspective provides a more appropriate explanation for this phenomenon. The energy evolution process is primarily dominated by elastic energy, manifesting as continuous energy accumulation and release (Zi-hui et al., 2020). Numerous scholars have studied the energy evolution process during cyclic loading and unloading experiments (Xiao et al., 2024). For instance, Zhang et al. (2024) studied energy evolution under graded and constant-amplitude cyclic loading, revealing distinct stage-specific evolution patterns of dissipated energy per unit volume under different stress paths. MIAO Sheng-jun et al. (2021) conducted triaxial cyclic loading and unloading experiments on granite, finding that the corresponding energy consumption ratio exhibits a unique spoon-shaped evolutionary characteristic as the number of cycles increases. Wen et al. (2019) performed cyclic loading and unloading experiments on red bed rock, with analysis revealing that the area of the hysteresis loop curve is positively correlated with the loading and unloading time, and an increase in cumulative dissipation energy leads to an increase in the total absorbed energy. Si-qing (2000) analyzed the intrinsic mechanisms of rock deformation systems based on the observation that energy released during dynamic rock failure far exceeds induced energy. Yangsheng et al. (2003) proposed an energy analysis method for uniaxial compression processes by integrating failure modes and energy consumption characteristics. Kai et al. (2024) conducted uniaxial cyclic compression experiments on coal-rock composite specimens under two cyclic loading and unloading paths and established an energy-damage constitutive model for the composite specimens under cyclic loading. Yu et al. (2022) analyzed the energy evolution characteristics of surrounding rock after roadway excavation and developed a theoretical calculation model for energy input, accumulation, dissipation, and release during the deformation and failure process of coal-rock mass units. Some researchers have noted the significant influence of moisture on the energy evolution of coal-rock specimens. Studies by Tian-bin et al. (2015) showed that as water content increases, the energy storage capacity and strain energy release capacity of rock decrease. In contrast, Chang-bao et al. (2016), Yong-jiang et al. (2024) argued that higher moisture content elevates total energy and dissipated energy while diminishing elastic energy. Xiao-Ping and Jian-Zhi (2021), Xiao-Ping et al. (2021), Zhang and Xiao-Ping (2020) employed an integrated acousto-optic-mechanical monitoring system to investigate granite behavior, revealing the mechanistic relationship between process zone nucleation and microcrack clustering. Their work identified an “inverted U-shaped” evolution pattern in the acoustic emission event rate of fractured granite and established its quantitative correlation with stress drops.
In summary, current research on rock energy evolution under cyclic loading has primarily focused on uniaxial or triaxial compression tests, paying insufficient attention to tensile failure mechanisms which are more prevalent in practical engineering. Existing studies mainly consider mechanical factors, often failing to adequately account for the complex environmental conditions inherent to deep rock masses. There is a notable lack of investigation into the coupling effects of multiple conditions, such as the stress variations from construction-induced cyclic loading, dynamic water-bearing environments, and unloading disturbances. Furthermore, the influence of water content on the energy evolution behavior of rock masses remains contentious. Some studies argue that increased water content weakens the rock’s capacity for energy storage and release, while others suggest that water saturation promotes the growth of total and dissipated energy, thereby reducing the proportion of elastic energy. These controversies further underscore the complexity of water-rock interaction mechanisms. To elucidate the mechanical response of rock masses under the combined influence of water and cyclic loading, this study employs Brazilian splitting cyclic loading-unloading tests on both dry and water-saturated siltstone specimens. It aims to investigate the effects of different cyclic stress paths and saturation conditions on the energy evolution patterns and tensile damage characteristics of rock, analyze the energy distribution laws and failure mechanisms during the unloading of rocks in a water-bearing environment, and ultimately provide theoretical guidance for controlling the stability of surrounding rock in deep mine roadways.
2 Experimental design
2.1 Specimen preparation
The experimental specimens were sourced from the immediate roof siltstone of the #17 coal seam in the 93172 fully mechanized top-coal caving face at Junde Coal Mine, Longmei Hegang Mining Co., Ltd., Heilongjiang Province. Following the national standard: Methods for determining the physical and mechanical properties of coal and rock—Part 10: Methods for determining the tensile strength of coal and rock GB/T 23561.10-2010, the specimens were processed into standard dimensions of 50 × 25 mm, Figure 1 shows the part of the standard specimens after processing.
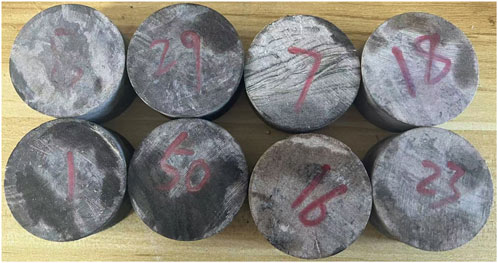
Figure 1. Part of the standard specimens after processing.
In accordance with the national standard: Methods for determining the physical and mechanical properties of coal and rock—Part 5: Method for determing the water absorbability of coal and rock,GB/T 23561.5-2009, the dry rock specimens were prepared using the high-temperature dehydration method. The specimens were placed in a drying oven at 108 °C for 24 h until their mass variation was less than 0.005 g. For water-saturated specimens, the vacuum saturation method was adopted: specimens were first placed in a vacuum chamber, where air was evacuated for 20–30 min. Water was then slowly introduced into the chamber until the level reached 1–2 cm above the specimens. A vacuum pump continued operating for over 12 h until no bubbles emerged from the specimens and the vacuum pressure stabilized below 0.001 MPa. Finally, the specimens were immersed in a water-filled container for 24 h to complete saturation.
2.2 Experimental equipment
The experiment was conducted using a UTM5105X electronic universal material experimental machine, Figure 2 demonstrates the experiments equipmentis of cyclic loading-unloading in brazilian splitting tests, which has a maximum load capacity of 100 kN, a precision class of 0.5, a displacement control rate range of 0.001–500 mm/min, and a deformation measurement accuracy of ±0.5%. Strain values during the experiment were collected in real-time via a BE120-5AA resistive strain gauge connected to a DH3818Y strain meter and interfaced with a computer.
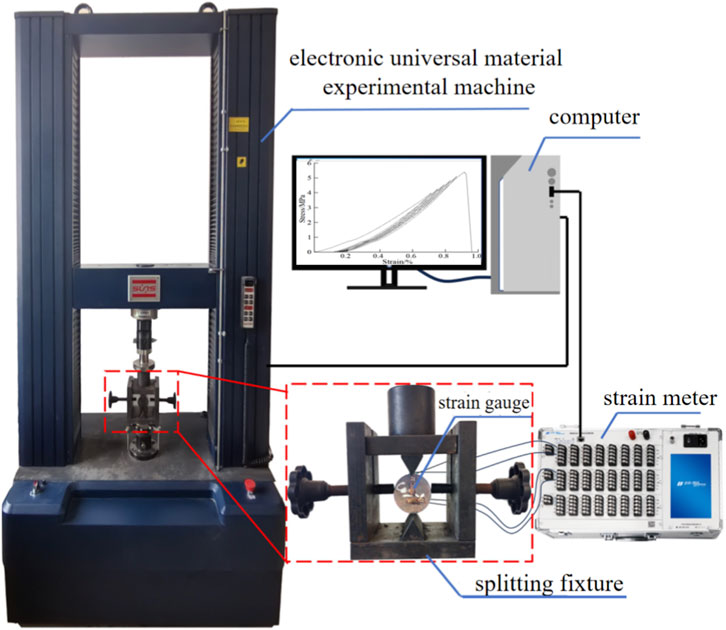
Figure 2. Experiments equipment.
2.3 Experimental method
Five Brazilian splitting experiments were conducted on both dry and water-saturated specimens. The load during experiment was converted to tensile stress through Equation 1, enabling the calculation of the tensile strength σt and compaction stress σ1 for dry and saturated specimens. σ1 defined as the stress value at the end of the pore compaction stage in the stress-strain curve. The calculated results are presented in Table 1:
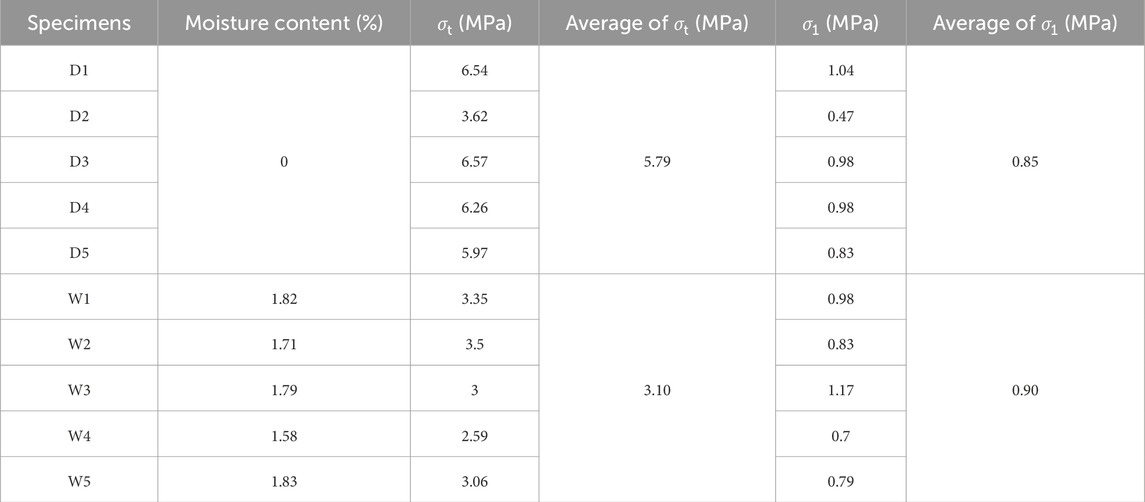
Table 1. Tensile strength of dry and water-saturated specimens.
Where σt is the tensile stress, When the failure load is attained, this value corresponds to the tensile strength of the rock specimen MPa; P is the applied load N; D is the diameter of the specimen mm; h is the height of the specimen mm.
According to the test results in Table 1, the coefficients of variation for both tensile strength (σt) and compaction stress (σ1) of the 5 sets of dry and saturated specimens are at relatively low levels, indicating good reproducibility of specimen performance. It is worth noting that the tensile strength and compaction stress values of dry specimen D2 deviate more significantly from those of other specimens, which may be attributed to random factors. To enhance the accuracy of subsequent cyclic loading-unloading tests, a dual-sample analysis was adopted for each test group. For example, under a given cyclic loading condition: dry specimens are labeled as Dx-1 and Dx-2, while saturated specimens are labeled as Wx-1 and Wx-2.
Three cyclic stress paths were designed based on stress magnitudes corresponding to distinct deformation stages in the stress-strain curve. Cyclic loading-unloading experiments were performed on both dry and water-saturated specimens under each path. The initial peak stresses for Path 1, 2, and 3 were set to 5% of the tensile strength σt, the compaction stress σ1, and 70% of σt, respectively. The experiment machine executed stress loading/unloading at a rate of 0.03 MPa/s. After each loading-unloading cycle, the peak stress was incrementally increased by 5% of σt until specimen failure occurred. The stress cyclic paths are illustrated in Figure 3.
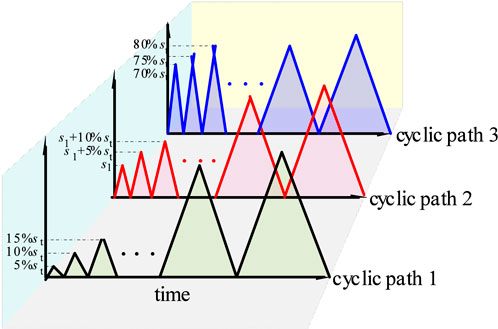
Figure 3. Schematic diagram of the stress path of cyclic loading and unloading.
3 Stress-strain characteristics under different cyclic stress paths
To investigate the stress-strain characteristics of the immediate roof siltstone under different cyclic loading conditions, this study conducted 6 sets of experiments comprising 3 dry specimens and 3 saturated specimens. Cyclic loading-unloading tests were performed under different peak load levels for each group. Based on the experimental results, the corresponding stress-strain curves were plotted. Specifically, Figure 4 presents the stress-strain curves of dry specimens under various cyclic loading conditions, while Figure 5 displays the corresponding curves for saturated specimens.
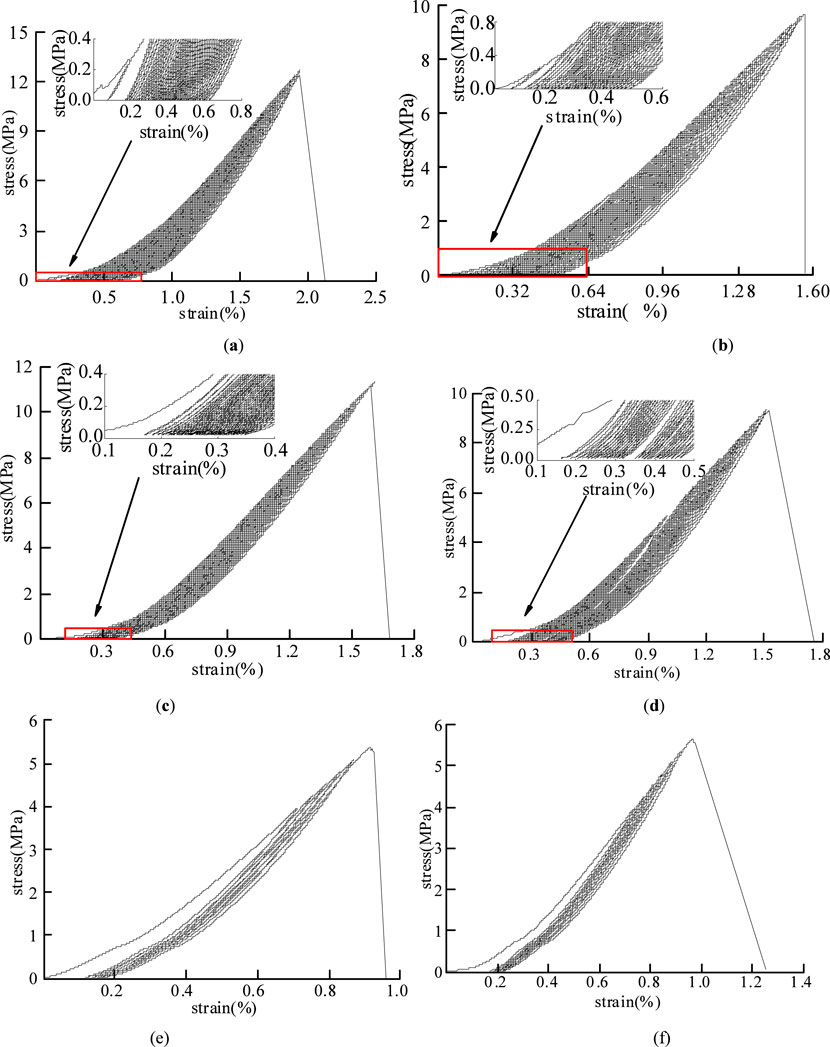
Figure 4. Total stress-strain of dried specimens under different cyclic paths:(a)D1-1,cyclic path 1; (b)D1-2,cyclic path 1; (c)D2-1,cyclic path 2; (d)D2-2,cyclic path 2; (e)D3-1,cyclic path 3; (f)D3-2,cyclic path 3
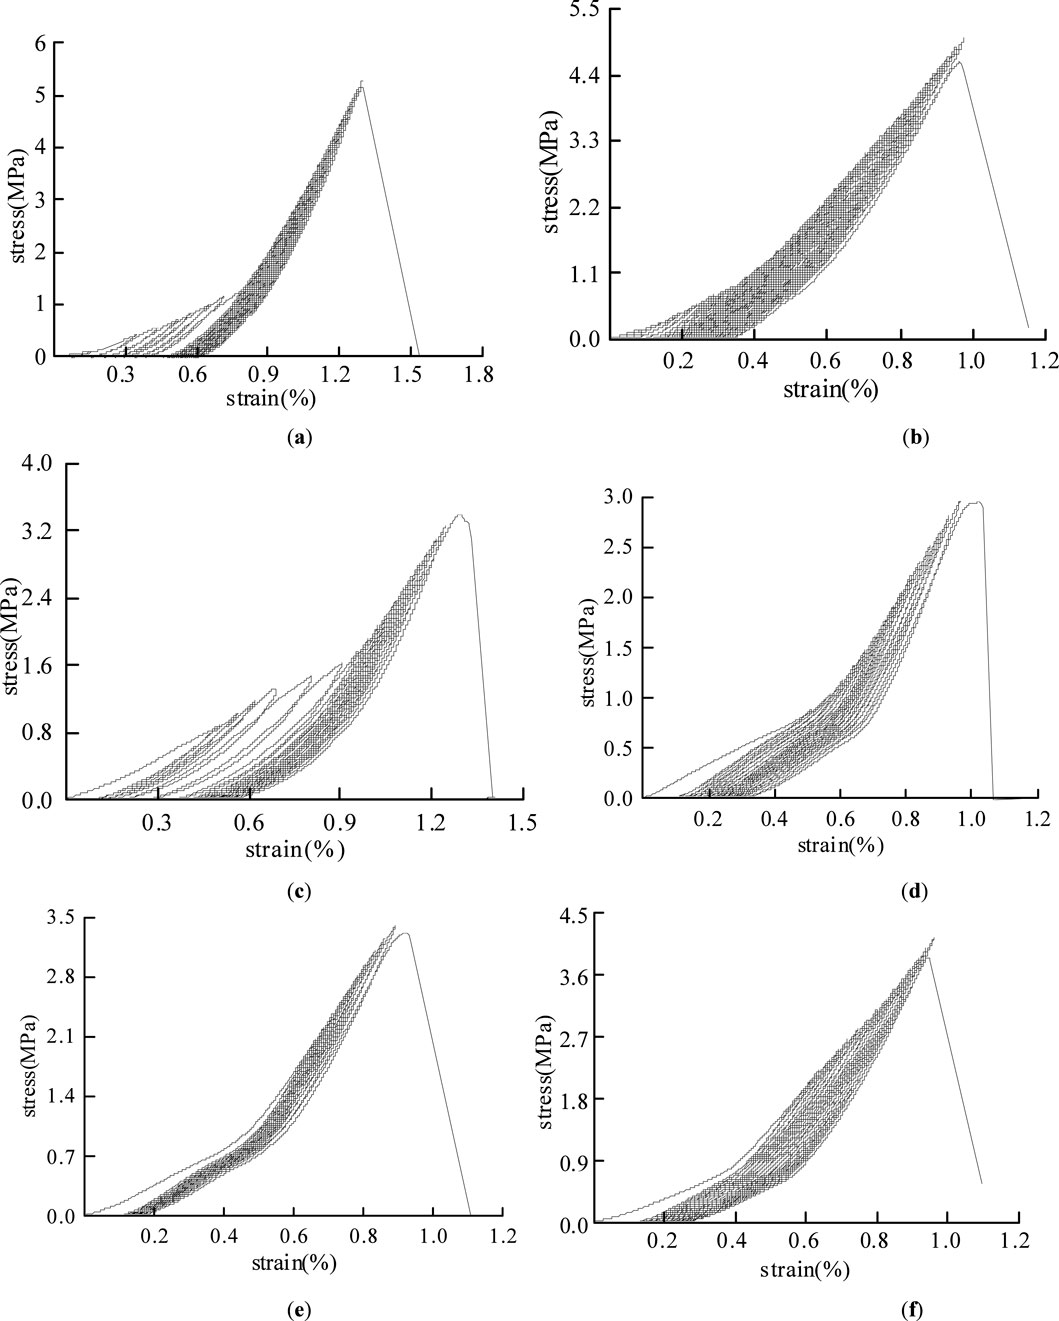
Figure 5. Total stress-strain of water-saturated samples under different circulation paths: (a)W1-1,cyclic path 1; (b)W1-2,cyclic path 1; (c)W2-1,cyclic path 2; (d)W2-2,cyclic path 2; (e)W3-1,cyclic path 3; (f)W3-2,cyclic path 3
From Figures 4, 5, it is evident that under all three cyclic stress paths, the plastic deformation of the specimens accumulates with increasing peak stress and cycle number, while the hysteresis loops formed during loading-unloading exhibit a continuous migration toward higher strain directions (He-chuan et al., 2023). In cyclic path 1, the hysteresis loops generated during the first two loading-unloading cycles showed significant migration magnitudes of 0.065% and 0.066%, respectively. Subsequent cycles, however, yielded a maximum migration of only 0.029%. In cyclic paths 2 and 3, substantial hysteresis loop migrations occurred only during the first cycle 0.149% and 0.155%, respectively, with subsequent cycles producing maximum migrations of 0.021% and 0.020%. This migration behavior arises from the rapid compressive deformation caused by the closure of internal pores and fractures under loading (Xing-zhou et al., 2024). For cyclic path 1, the initial peak stress was relatively low 0.29 MPa, only 5% of the tensile strength, resulting in limited compaction of pore-fracture structures during a single cycle. Consequently, significant hysteresis loop migrations persisted through the first two cycles. In contrast, cyclic paths 2 and 3, with higher initial peak stresses 0.85 MPa and 4.05 MPa, respectively, induced extensive pore-fracture closure after the first loading-unloading cycle.
Figure 5 demonstrates that under cyclic paths 1 and 2, water-saturated specimens exhibited larger hysteresis loop migrations in the initial cycles compared to dry specimens. This is attributed to water molecules infiltrating the rock matrix, lubricating particle contacts, and reducing frictional resistance, thereby enhancing plastic deformation capacity before full compaction (Hong et al., 2017). As cyclic loading progressed, the compressible pore space diminished, gradually reducing migration magnitudes until stabilization.
4 Energy evolution characteristics under different cyclic paths
4.1 Evolution characteristics of volumetric energy per unit volume and elastic energy per unit volume
Under laboratory conditions, the energy evolution of a loaded rock mass system primarily comprises four processes: energy input, energy accumulation, energy dissipation, and energy release. During the loading process, and disregarding damping consumption and heat exchange, the energy input originates mainly from the work performed by the testing machine on the specimen. A portion of this input energy is stored within the rock specimen as elastic strain energy, which is reversible and can be released upon unloading. The remainder is dissipated through irreversible mechanisms, such as energy expended in plastic deformation and damage, as expressed in Equation 2:
In the equation, U represents the total input energy density;Ue denotes the releasable elastic energy density; and Up signifies the dissipated energy density.
When the accumulated elastic strain energy reaches a certain limit, exceeding the bearing capacity of the specimen, it induces instability and failure, accompanied by energy release to the surroundings. This released energy primarily manifests as kinetic energy, heat, and various forms of radiation. If the influence of the testing machine is neglected, this portion of energy originates mainly from the releasable elastic strain energy. Both the releasable elastic energy and dissipated energy can be obtained through cyclic loading-unloading tests. Referring to Figures 4, 5, a specific cycle is extracted for analysis, and the graphical integration method is applied, as illustrated in Figure 6. Based on Figure 6, the input energy density U, elastic energy density Ue, and dissipated energy density Up for each cycle are calculated using the graphical integration method, as shown in Equation 3 (Lei et al., 2019).
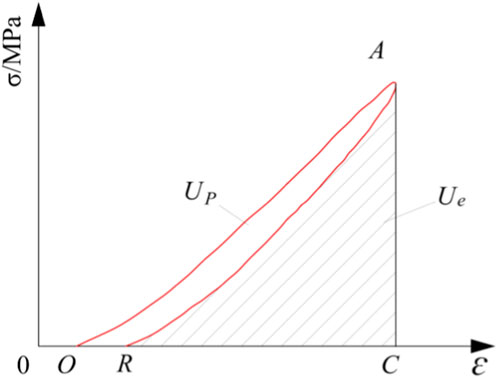
Figure 6. Energy calculation analysis model.
This study conducted cyclic loading-unloading tests on six sets of specimens under different load levels. The test results were used to plot the evolution curves of energy input, energy accumulation, and energy dissipation. Among them, Figure 6 shows the energy evolution curves of dry specimens under various cyclic loading-unloading conditions, Figure 7 presents those of saturated specimens under different cyclic loading-unloading conditions, and Table 2 provides the fitting equations for the energy evolution during the loading process.
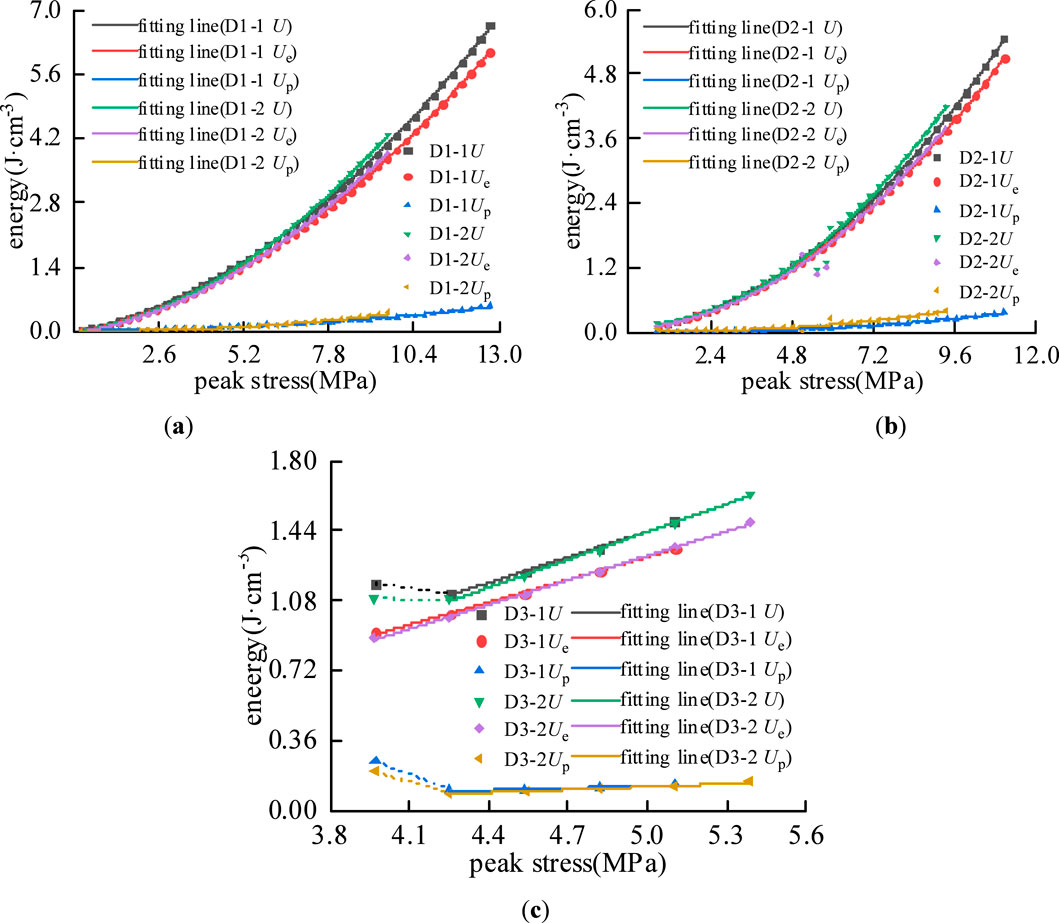
Figure 7. Energy evolution of dried specimens under different cyclic paths:(a) cyclic path 1; (b) cyclic path 2; (c) cyclic path 3
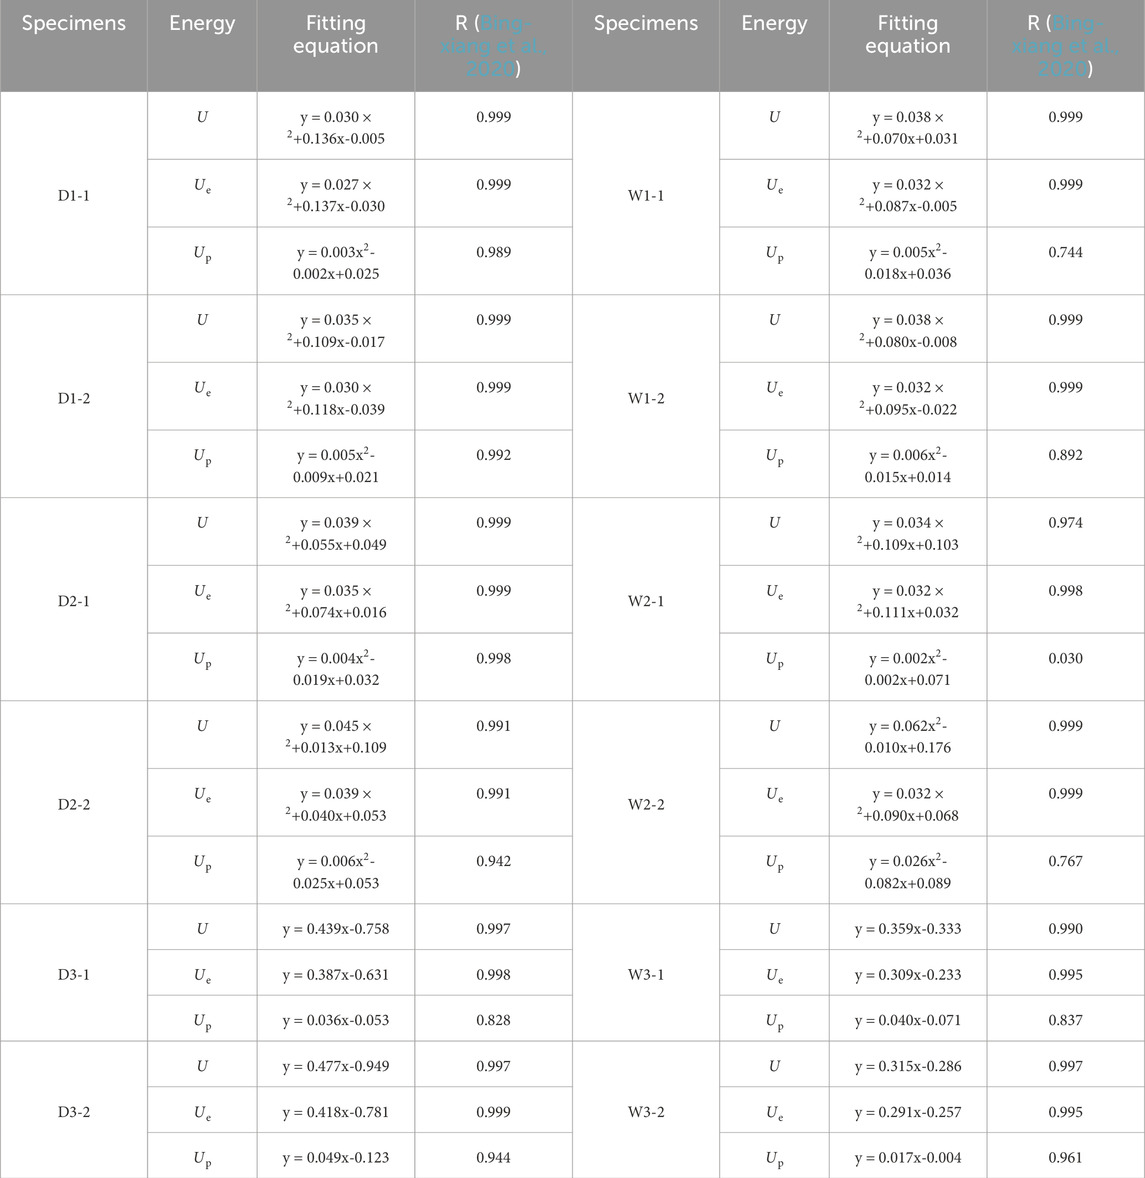
Table 2. Fitting equations for energy evolution under different cyclic paths.
As shown in Figures 7, 8, under cyclic loading stress paths 1 and 2, the input energy U, releasable elastic energy Ue, and dissipated energy Up of both dry and saturated specimens exhibit a nonlinear increasing trend with the rise in axial stress levels, which is quite similar to the stress-strain relationship curves. In the initial loading stage, the growth rates of input energy density, elastic energy density, and dissipated energy density are relatively small, with the curves being relatively gentle, corresponding to the compaction stage of pores and fractures in the specimen. At this point, the elastic energy density is very close to the input energy density, indicating that most of the input energy is stored within the specimen as elastic energy, with only a small portion being dissipated. Subsequently, the specimen enters the elastic deformation stage, where the elastic energy density, input energy density, and dissipated energy density continue to increase gradually, showing an approximately linear growth trend. Throughout the compression process, the proportion of elastic energy density to input energy density inside the specimen remains relatively high, indicating that a large amount of elastic energy is stored in the specimen with less energy dissipated. According to Table 2, the growth trends of energy densities can all be expressed by quadratic functions, with significant fitting effects. The correlation coefficients R2 for the fitting equations of elastic energy density and input energy density are all greater than 0.97. The correlation coefficients for the fitting equations of dissipated energy density are relatively lower, with R2 > 0.94 for dry specimens, while the R2 values for saturated specimens vary considerably, indicating significantly reduced fitting accuracy. Reason analysis: affected by the water effect, the water absorption enhances the plastic deformation capacity of the rock during the initial loading stage, leading to rapid accumulation of dissipated energy Up. As the load increases, the compaction effect suppresses the development of specimen deformation, causing dissipated energy Up to drop sharply before rising again.
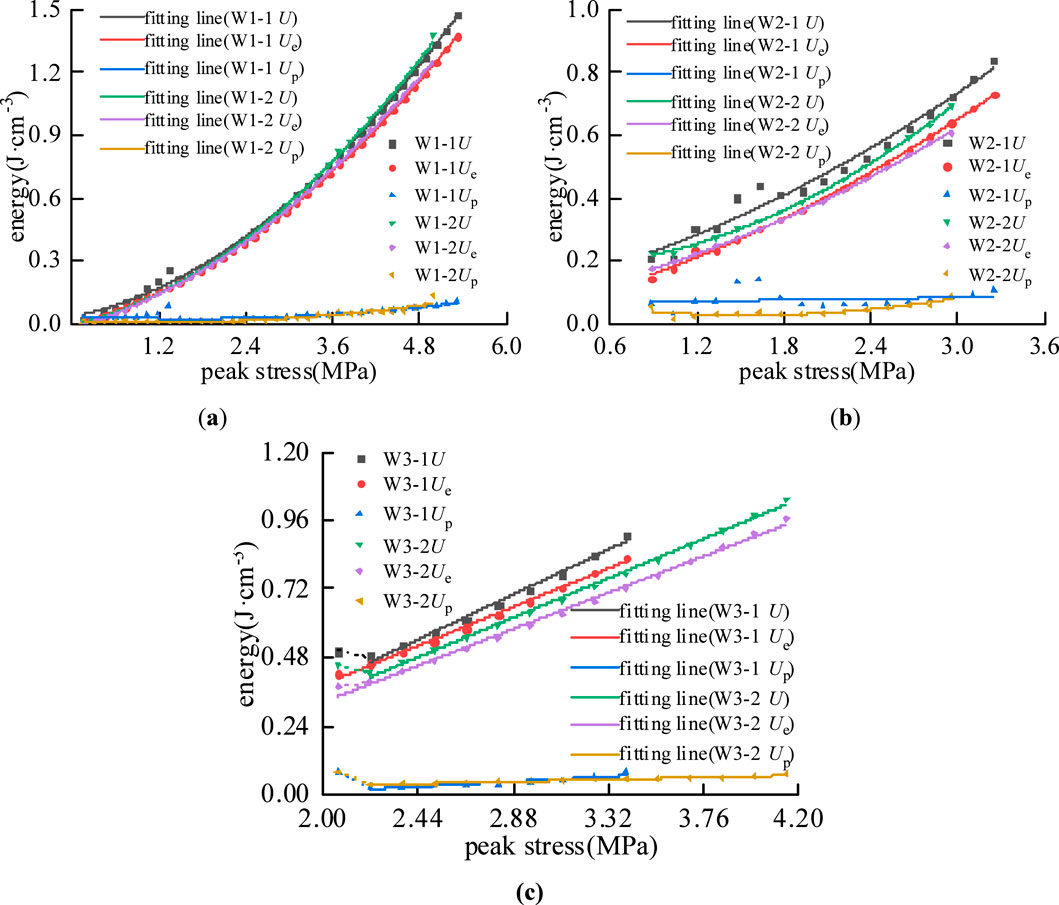
Figure 8. Energy evolution of saturated specimens under different cyclic paths:(a) cyclic path 1; (b) cyclic path 2; (c) cyclic path 3
Under cyclic loading stress path 3, both the input energy U and the releasable elastic energy Ue of dry and saturated specimens exhibited an initial decrease before transitioning to a linear growth phase. This behavior can be attributed to the high magnitude of the cyclic load, where the first cycle generated the most significant hysteresis loop migration, resulting in substantial plastic deformation in the rock mass and rapid accumulation of dissipated energy Up, consequently causing a decline in the releasable elastic energy Ue. Specifically, the releasable elastic energy Ue decreased by 4.49% for specimen D3-1, 3.55% for W3-1, and 5.44% for W3-2, while it remained nearly stagnant for D3-2 with only a 0.10% increase. Correlation analysis of the data after the first cycle showed that the input energy U had a correlation coefficient R2 > 0.997, and the mean correlation coefficient for dissipated energy Up was R2 > 0.886. The releasable elastic energy Ue maintained a consistent linear proportionality with U, with R2 > 0.995, reflecting the dominant role of elastic behavior under high-stress conditions.
4.2 Evolution characteristics of dissipation energy per unit volume
The failure of rock mass is directly attributed to excessive plastic deformation and the abrupt release of accumulated dissipated energy. The evolutionary characteristics of dissipated energy per unit volume in rock mass can be interpreted in stages by referring to existing research findings, such as those by Hua-feng et al. (2021), and the inflection points observed in energy evolution curves. Figures 9–11 respectively present the energy evolution curves of dry and saturated rock specimens under different cyclic loading stress paths. The division of dissipated energy evolution stages shows a strong correspondence with the characteristic stages of the stress-strain curves.
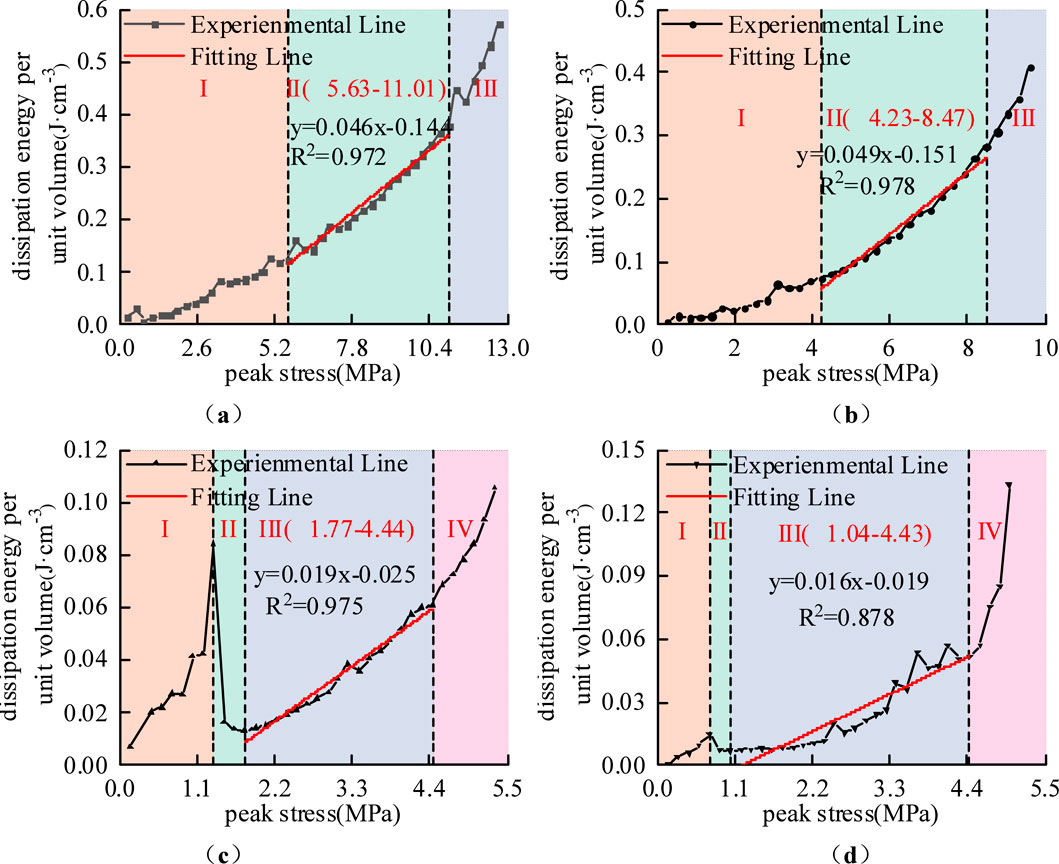
Figure 9. Characteristic division of dissipated energy stages under cyclic path 1:(a)D1-1; (b)D1-2; (c)W1-1; (d)W1-2.
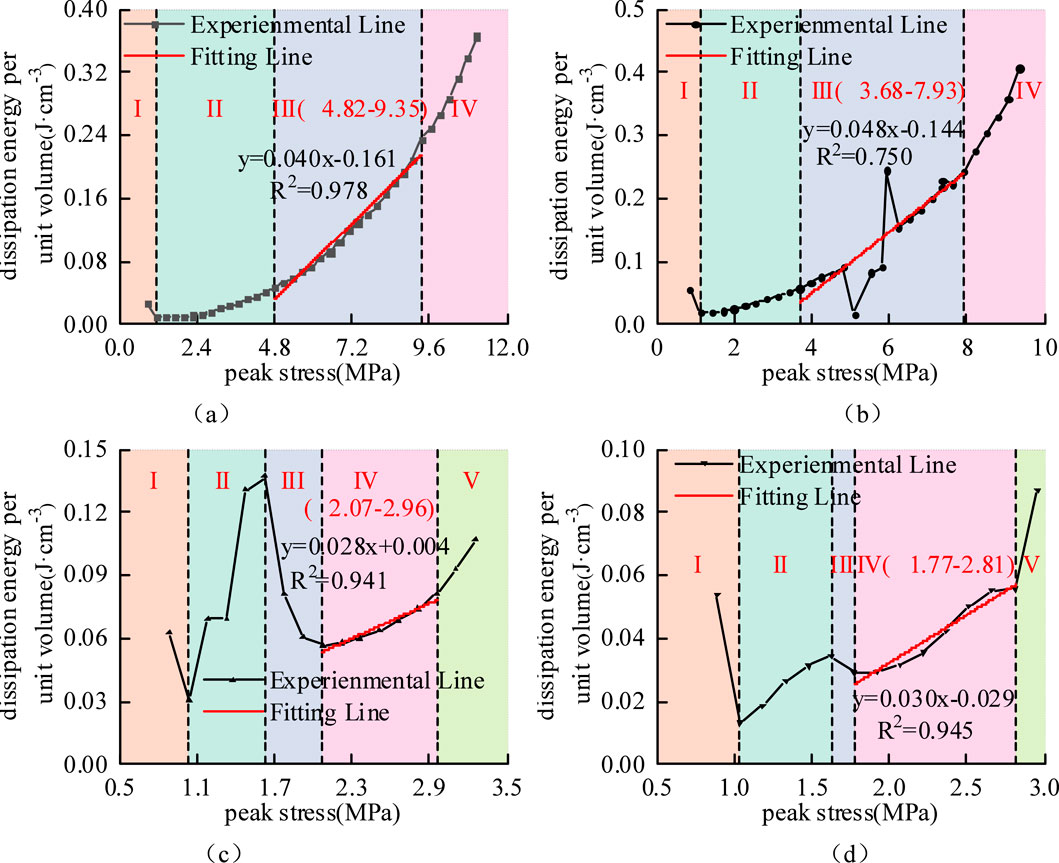
Figure 10. Characteristic division of dissipated energy stages under cyclic path 2:(a)D2-1; (b)D2-2; (c)W2-1; (d)W2-2.
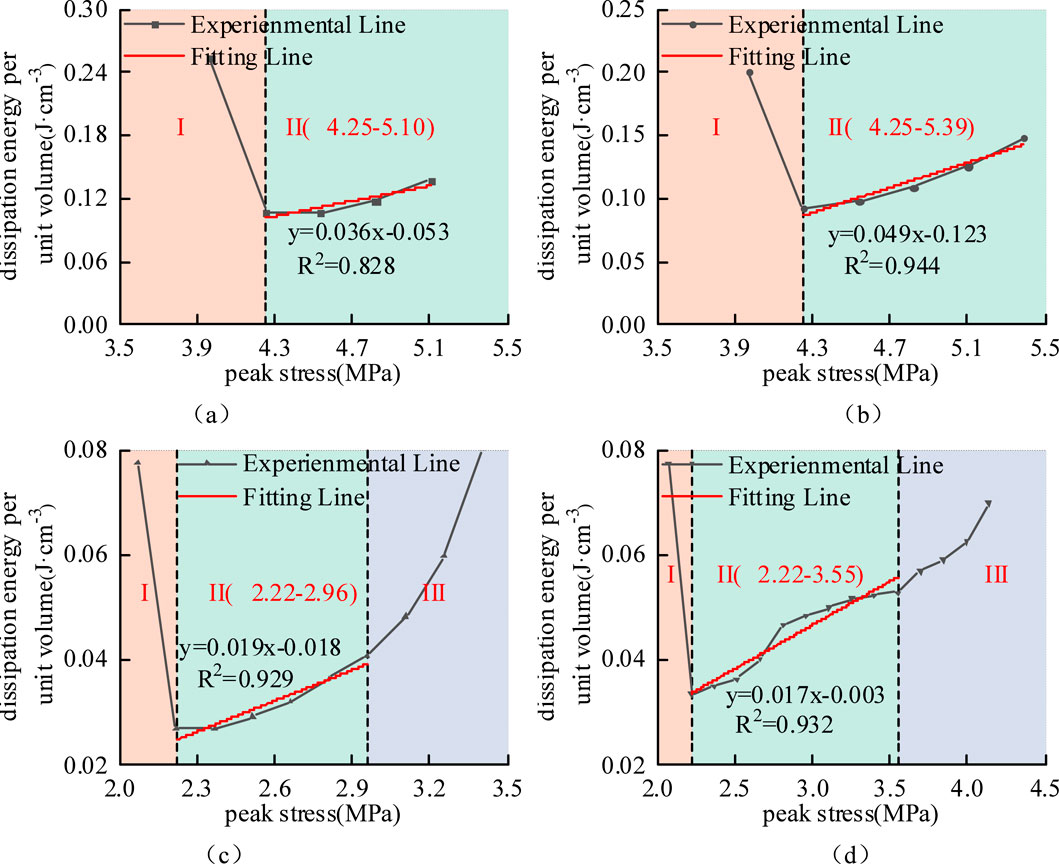
Figure 11. Characteristic division of dissipated energy stages under cyclic path 3:(a)D3-1; (b)D3-2; (c)W3-1; (d)W3-2.
(1) Evolution Characteristics of Dissipated Energy per Unit Volume in Rock Mass under Cyclic Loading Stress Path 1
As shown in Figure 9, the evolution curve of dissipated energy per unit volume for dry specimens under cyclic path 1 can be divided into three stages. Stage I corresponds to the pore compaction phase, where the dissipated energy Up remains relatively low under applied peak stresses. As the load stress increases, the closure of microcracks within the rock mass leads to a gradual increase in Up. In Stage II, identified as the linear growth stage, the dissipated energy Up exhibits a steady linear increase with an average growth rate of 4.99%. This behavior occurs as most pores and fractures stabilize under repeated cyclic loading and unloading. Stage III represents the rapid growth period, where further development of fractures occurs—characterized by their gradual elongation and widening at an accelerating rate. As the load stress approaches the tensile strength of the material, crack propagation and coalescence trigger a sharp increase in Up, ultimately resulting in specimen failure.
The evolution curve of dissipated energy per unit volume for saturated specimens under cyclic path 1 can be divided into four distinct stages. Stage I represents the pore compaction phase. In this stage, specimens W1-1 and W1-2 exhibited dissipation energy growth rates that were 19.8% and 28.0% higher than those of dry specimens D1-1 and D1-2, demonstrating rapid accumulation of dissipated energy. This behavior can be explained by the lubricating effect of pore water within the saturated specimens, which significantly reduces frictional resistance among internal pores and fractures. When subjected to identical cyclic loading conditions, the saturated specimens experienced more substantial plastic deformation compared to their dry counterparts. The additional energy required to overcome lubricated inter-particle sliding and structural rearrangement resulted in a 2.27-fold increase in cumulative dissipated energy per unit volume. Stage II is characterized by a rapid decline in dissipation energy. Following pore compaction, the internal structure of the specimens becomes increasingly dense, thereby enhancing their overall resistance to deformation. This structural change leads to a progressive reduction in energy dissipation through plastic deformation during each loading cycle, causing a sharp decrease in dissipation energy until a temporary equilibrium is established within the newly compacted microstructure. This transitional phase marks the shift from water-lubricated, large-deformation energy dissipation to a stable frictional dissipation mechanism governed by the consolidated rock framework. Stage III and Stage IV represent the linear growth and rapid growth phases, respectively. These stages show evolutionary trends generally consistent with those observed in dry specimens. However, the saturated specimens maintained lower levels of dissipated energy per unit volume throughout these stages. This reduction indicates that water saturation weakens the internal structure of the rock mass, leading to instability and failure at lower energy thresholds. The presence of moisture fundamentally alters both the path and efficiency of energy dissipation, directing a greater proportion of input energy toward catastrophic failure of the rock mass.
5 Evolution Characteristics of Dissipated Energy per unit volume under cyclic loading stress path 2
As shown in Figure 10, both dry and saturated specimens under cyclic path 2 exhibit relatively high initial values of dissipated energy per unit volume Up, followed by a decreasing trend during the first two loading-unloading cycles, constituting Stage I - initial decline phase (Shuai et al., 2016). This phenomenon occurs because the high peak value of the initial load stress induces substantial plastic deformation in the rock mass during the first cycle. The resulting significant plastic deformation leads to rapid compaction of the rock mass and enhances its resistance to deformation, consequently causing a rapid decrease in Up, similar to Stage II observed in saturated specimens under cyclic path 1. Subsequently, the evolutionary characteristics of Up in dry specimens align with those observed in dry specimens under cyclic path 1, while the evolutionary pattern of Up in saturated specimens corresponds to that of saturated specimens under cyclic path 1.
6 Evolution Characteristics of Dissipated Energy per unit volume under cyclic loading stress path 3
As shown in Figure 11, the initial stage of the dissipated energy evolution curves for both dry and saturated specimens under cyclic path 3 resembles Stage I observed in cyclic path 2. The key distinction lies in the higher initial dissipated energy per unit volume Up under path 3, along with a more pronounced decrease in Up during the first two loading-unloading cycles. This indicates that the higher peak initial load stress induces more substantial plastic deformation in the rock mass. Subsequently, the evolution of Up in dry specimens demonstrates only a linear growth stage before specimen failure occurs. In contrast, saturated specimens exhibit both Stage II linear growth and Stage III rapid growth in their Up evolution. The primary mechanism underlying this difference can be attributed to the effect of pore water during cyclic loading. As compaction progresses and pore space diminishes, water molecules trapped within the fracture network generate significant tensile or shear forces under stress concentration, thereby accelerating structural tearing and crack propagation (Bo-bo et al., 2021). In comparison, dry specimens, lacking the lubricating and weakening effects of moisture, experience crack propagation primarily driven by mechanical loading, which explains the absence of an accelerated energy surge stage.
7 Damage characteristics across cyclic paths
Rock damage dissipation is an irreversible process that directly influences rock failure, with the magnitude of irrecoverable dissipated energy reflecting the extent of damage in the specimen. To further investigate the energy distribution evolution of unloaded rock specimens under different cyclic loading stress amplitudes and quantify the failure progression under various cyclic paths, a damage variable D is defined as follows (Ying et al., 2019):
Where Upi is the dissipation energy per unit volume J/cm3 during the ith cycle, Upt is the cumulative dissipation energy across all cycles J/cm3, n is the total cycle count. The calculated damage evolution curves for dry and saturated specimens are shown in Figures 11, 12.
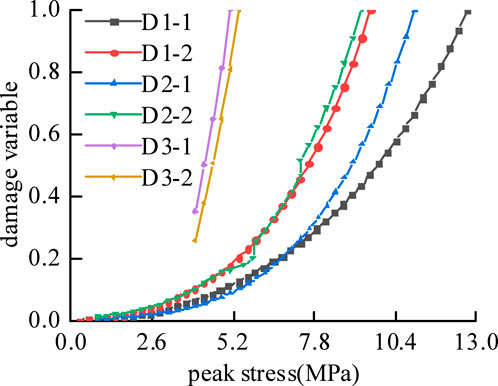
Figure 12. Evolution of damage variables of dried specimens under each cyclic path.
For dry specimens Figure 12, damage variables under cyclic paths 1 and 2 exhibit quadratic growth trends. During initial cycles pore compaction stage, damage increases slowly due to gradual crack closure. However, rapid crack propagation in later cycles accelerates damage accumulation. In contrast, cyclic path 3 displays a linear damage trajectory, with an initial average damage variable of 0.306—over 100 times higher than paths 1 0.002 and 2 0.010. This discrepancy stems from Path 3’s elevated initial peak stress 70% tensile strength, which instantly overloads the microstructure, bypassing early-stage compaction effects.
As shown in Figure 13, saturated specimens W1-1 and W1-2 exhibit abrupt transitions in their damage evolution curves when peak stresses reach 1.33 MPa and 0.74 MPa, respectively. These inflection points correspond to the dissipation energy collapses observed in Figures 8c,d; Section 4.2 during the transition from the pore compaction stage I to the rapid decline stage II. As failure approaches—when peak stresses attain 4.44 MPa W1-1 and 4.43 MPa W1-2—damage variables surge abruptly, aligning with the rapid growth stage IV in Figures 8c,d. This demonstrates that the abrupt transitions between stages in the dissipation energy evolution curves correspond to the inflection points of the damage variable, which can partially reflect the internal damage progression within the specimen.
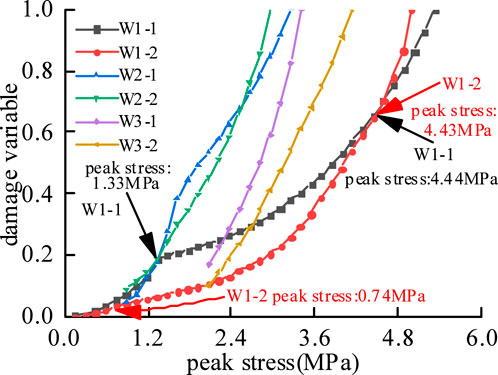
Figure 13. Evolution of damage variables of saturated specimens under each cyclic path.
As tensile stress increased from the initial peak stress to 1.33 MPa, the damage curves of saturated specimens W1-1, W2-1, and W2-2 exhibited significant overlapping segments, while no overlap was observed in the initial-cycle damage curves of dry specimens under cyclic paths 1 and 2 Figure 12. This indicates that water saturation reduces frictional resistance between fractures, resulting in similar plastic deformation capacities across saturated specimens, which generated comparable damage variable values under equivalent peak stress conditions.
Linear fitting of the damage variables during the final five pre-failure cycles all fits with precision >0.98 revealed average growth rates of 0.244/MPa, 0.276/MPa, and 0.556/MPa for dry specimens under cyclic paths 1, 2, and 3, respectively, compared to 0.523/MPa, 0.576/MPa, and 0.689/MPa for saturated specimens. Both dry and saturated specimens followed the damage growth rate hierarchy of cyclic path 3 > path 2 > path 1. This demonstrates that higher initial peak stresses in cyclic loading-unloading result in greater damage variable growth rates during later cycles, with saturated specimens exhibiting significantly higher damage growth rates than dry specimens across all cyclic paths. The water-induced pore pressure severely compromises the specimen’s internal microstructure, leading to intensified damage progression.
8 Discussion
This study investigated the energy evolution and damage mechanisms of siltstone under tensile stress conditions through Brazilian splitting cyclic loading-unloading tests. The experimental results confirm the energy-driven failure principle and elucidate the failure progression of both dry and saturated specimens under various cyclic loading stress paths.
Under different cyclic loading stress paths, increasing the peak initial load stress resulted in an enlargement of the initial hysteresis loop with reduced migration amplitude in the stress-strain relationship of siltstone, indicating a simplified energy distribution mechanism under high tensile stress paths. For saturated specimens, the tensile strength decreased significantly under cyclic loading conditions, while both the strain rate and total deformation substantially exceeded those observed in dry specimens. These findings are consistent with the conclusions reported by Wu et al. (2024) in their study on deformation characteristics of dry and saturated argillaceous siltstone under cyclic loading, demonstrating the transferability and universality of the coupled effects of moisture and cyclic loading-unloading on rock mass behavior.
Under different cyclic loading stress paths, distinct differences are observed in the evolutionary stages of dissipated energy per unit volume between dry and saturated rock specimens. The stages of dissipated energy evolution not only correspond closely to the characteristics of the stress-strain curves but also reveal more comprehensive information regarding the internal damage evolution of the rock mass. Taking the saturated specimens under cyclic path 1 as an example, the Stage II rapid decline phase evident in the dissipated energy evolution curve clearly demonstrates the gradual weakening of the water lubrication effect during the compaction process and the subsequent transition to the formation stage of a densified skeleton. This study demonstrates that both the moisture condition of the rock mass and the cyclic loading stress collectively determine the evolution pattern and stage division of dissipated energy. Conversely, the evolutionary characteristics of different stages of dissipated energy reflect the intrinsic principles of rock mass behavior from damage accumulation to final failure. Compared to traditional stress-strain responses, the evolution of dissipated energy is more sensitive to changes in the internal structure of the rock mass, enabling earlier and more comprehensive revelation of damage development states. Integrating the actual in situ conditions of rock masses and the characteristics of engineering disturbances, conducting damage analysis based on the evolution of dissipated energy per unit volume can more accurately represent the failure process of rock masses under complex conditions. This approach thereby provides a more scientific and reliable basis for stability assessment and disaster prevention in rock engineering.
In terms of damage evolution, dry specimens under high initial stress conditions exhibit linear damage progression and higher initial damage variables in their damage evolution curves, which corresponds well with the deformation patterns shown in their stress-strain responses. This observation aligns with findings reported by Xu et al. (Ying et al., 2019) in their investigation of energy evolution and damage characteristics in mudstone under cyclic loading-unloading conditions. For saturated specimens, the appearance of an abrupt inflection point and curve overlapping segment in the damage curves reveals unique energy evolution characteristics during tensile failure. The abrupt inflection point marks the transition where dissipated energy shifts from rapid accumulation to rapid decline, indicating the evolution of the internal deformation mechanism from a water-lubrication-dominated structural adjustment phase to a compacted skeleton formation stage. The curve overlapping segment suggests that when reaching specific stress thresholds, the frictional resistance within the saturated rock mass becomes homogenized, resulting in convergent behavior in damage evolution paths. These characteristic features can serve as effective precursors for engineering early-warning systems, providing more reliable criteria for predicting rock mass failure in complex water-bearing environments compared to using single stress or strain indicators alone.
In practical deep engineering applications, rock masses exist under true triaxial stress states and are subject to long-term water-rock chemical interactions. While the Brazilian splitting tests in this study reveal energy evolution and damage mechanisms under tensile stress conditions, differences remain compared to the actual stress states encountered in underground engineering. Subsequent research will involve conducting cyclic loading-unloading tests under true triaxial stress conditions to investigate the influence of the intermediate principal stress on energy evolution. Further studies will also examine the long-term effects of pore fluids with different chemical properties on energy distribution. Additionally, by integrating the energy dissipation-based damage variable with real-time monitoring techniques such as acoustic emission and micro-CT, we aim to establish a failure early-warning system that correlates macroscopic and microscopic behaviors.
9 Conclusion
Based on the analysis of stress-strain characteristics under different cyclic loading stress paths, this study draws the following conclusions:
1. Under various cyclic loading stress paths, the plastic deformation of the rock mass continuously accumulates with increasing peak stress and number of cycles, while the hysteresis loops migrate toward higher strain levels. The magnitude of this migration is controlled by the initial stress level, with higher initial stresses resulting in reduced migration. Water saturation reduces the tensile strength of the rock mass, leading to enlarged initial hysteresis loops and diminished migration amplitude.
2. The energy evolution characteristics of rock mass during cyclic loading-unloading are co-controlled by moisture content and stress path. Under low to medium stress paths, energy evolution exhibits typical nonlinear growth, with elastic energy consistently maintaining dominance. Under high stress paths, initial plastic deformation causes the energy curve to initially decrease before rising, showing a linear growth pattern in energy evolution. Moisture content alters the energy distribution mechanism of rock mass, demonstrating stronger energy dissipation characteristics in the initial stage, along with significantly reduced fitting accuracy of the growth curves.
3. Both moisture content in the rock mass and the applied cyclic loading stress exert decisive influences on the evolution pattern and stage division of dissipated energy. Moisture plays a dual role in the energy dissipation mechanism of rock mass: during the initial stage, it promotes rapid accumulation of dissipated energy through lubrication effects, while near the failure stage, it leads to instability and failure of the rock mass at a lower energy threshold due to its weakening effect. The evolution stages of dissipated energy closely correspond to the characteristics of the stress-strain curves, with the initial stress level significantly affecting both the starting point and progression of energy evolution.
4. Regarding damage evolution, both dry and saturated specimens follow the same order of damage growth rates across different stress paths: Path 3 > Path 2 > Path 1. The presence of moisture induces an abrupt inflection point and curve overlapping characteristics in the damage evolution at specific stress thresholds, while significantly enhancing the damage growth rate. Furthermore, characteristic inflection points in the damage variable curves correspond well to stage transitions in dissipated energy, confirming that the energy dissipation-based damage variable can serve as an effective indicator for predicting damage evolution and failure of rocks under water-rock interaction conditions.
Data availability statement
The original contributions presented in the study are included in the article/supplementary material, further inquiries can be directed to the corresponding author.
Author contributions
ZC: Investigation, Writing – original draft. QY: Conceptualization, Supervision, Writing – review and editing. XZ: Investigation, Software, Writing – review and editing. XL: Formal Analysis, Investigation, Writing – review and editing. XB: Investigation, Visualization, Writing – review and editing. YC: Writing – original draft.
Funding
The authors declare that financial support was received for the research and/or publication of this article. This work was funded by the Key Science and Technology Project of China Energy, grant number GJNY-21-26 & HT2025-2; and was funded in part by the National Natural Science Foundation of China, grant number 51804052; the Open Science Foundation Project Funded by State Key Laboratory of Coal Mine Disaster Dynamics and Control, grant number 2011DA105287-MS202210.
Conflict of interest
The authors declare that the research was conducted in the absence of any commercial or financial relationships that could be construed as a potential conflict of interest.
Generative AI statement
The authors declare that no Generative AI was used in the creation of this manuscript.
Any alternative text (alt text) provided alongside figures in this article has been generated by Frontiers with the support of artificial intelligence and reasonable efforts have been made to ensure accuracy, including review by the authors wherever possible. If you identify any issues, please contact us.
Publisher’s note
All claims expressed in this article are solely those of the authors and do not necessarily represent those of their affiliated organizations, or those of the publisher, the editors and the reviewers. Any product that may be evaluated in this article, or claim that may be made by its manufacturer, is not guaranteed or endorsed by the publisher.
References
Bing-xiang, H., Nong, Z., Hong-wen, J., Jia-guang, K., Bo, M., and Nan, L. (2020). Large deformation theory of rheology and structural instability of the surrounding rock in deep mining roadway. J. China Coal Soc. 45 (3), 911–926. doi:10.13225/j.cnki.jccs.SJ19.1451
Bo-bo, Li, Zhong-hui, W., Chong-hong, R., Yao, Z., Jiang, X., and Jian-hua, L. (2021). Mechanical properties and damage constitutive model of coal under the coupled hydro-mechanical effect. Rock Soil Mech. 42 (2), 315–323+332. doi:10.16285/j.rsm.2020.5848
Chang-bao, J., Min-ke, D., Guang-zhi, Y., Gui-ping, W., and Huan, Y. (2016). Loading-unloading experiments of coal containing gas under the condition of different moisture contents. J. China Coal Soc. 41 (9), 2230–2237. doi:10.13225/j.cnki.jccs.2015.1568
Fu-kun, X., Rong-huan, M., Lei, S., Zhi-yuan, H., Iuliia, F., and Long-fei, Q. (2025). Study on damage characteristics of rock under multi-level characteristic stress cyclic loading and unloading. J. Min. Saf. Eng. 42 (02), 430–439. doi:10.13545/j.cnki.jmse.2024.0267
Gui-lin, W., Liang, Z., Ming, X., Zai-yong, L., and Long-bao, R. (2019). Energy damage evolution mechanism of non-across jointed rock mass under uniaxial compression. Chin. J. Geotechnical Eng. 41 (4), 639–647.
He-chuan, Y., Erdi, A., Jie, Z., Yu, C., Ming-wei, L., Yun-jie, P., et al. (2023). Experimental study on deformation and failure characteristics of saturated sandstone under graded cyclic loading and unloading. Chin. J. Rock Mech. Eng. 42 (S2), 3943–3955. doi:10.13722/j.cnki.jrme.2022.0904
He-ping, X., Rui-dong, P., Yang, J., and Hong-wei, Z. (2005). On energy analysis of rock failure. Chin. J. Rock Mech. Eng. 24 (15), 2603–2608.
Hong, W., Tian-hong, Y., Hong-lei, L., Yong-chuan, Z., Wen-xue, D., and Xian-gang, H. (2017). Mechanical properties and energy evolution of dry and saturated sandstones under cyclic loading. Rock Soil Mech. 38 (6), 1600–1608. doi:10.16285/j.rsm.2017.06.008
Hua-feng, D., Jing-cheng, F., Jian-lin, L., Guan-ye, L., Yu, Q., and Xiao-liang, X. (2021). Damage evolution of dynamic characteristics of sandstone under the sequential action of water-rock interaction and cyclic loading and unloading. Rock Soil Mech. 42 (2), 343–351. doi:10.16285/j.rsm.2020.0869
Jia-xin, D., Min, T., Xiang-yang, Z., and Qing-chong, Z. (2024). Experimental study on progressive failure characteristics and energy evolution of coal samples under dynamic compression-tension loading. Chin. J. Rock Mech. Eng. 43 (10), 2520–2539. doi:10.13722/j.cnki.jrme.2024.0005
Kai, W., Xiao-huan, Z., Feng, D., Jia-zhi, S., Yang, J., and Cheng-tao, F. (2024). Macro-mesoscopic perspective damage characteristics and energy-damage constitutive model of coal-rock composite structures subjected to cyclic loading. J. China Coal Soc. 49 (2), 767–784. doi:10.13225/j.cnki.jccs.ST23.1733
Lei, Y., Fu-qiang, G., Xiao-qing, W., and Jian-zhong, L. (2019). Energy evolution law and failure mechanism of coal-rock combined specimen. J. China Coal Soc. 44 (12), 3894–3902. doi:10.13225/j.cnki.jccs.2019.0011
Liang, Z., Gui-lin, W., Jian-xi, R., Fan, S., Run-qiu, W., and Bo-long, L. (2025). Damage failure energy evolution mechanism of jointed sandstone treaded with dry-wet cycling action under triaxial compression. Earth Science-Journal China Univ. Geosciences 50 (1), 269–285.
Qing-Han, F. (2023). Development of rock direct tensile centring device and study on the micro fracture mechanism of rock stretching [D]. Qingdao: Shandong University.
Si-qing, Q. (2000). Primary discussion on formation mechanism of dissipative structure in instability process of rock mass. Chin. J. Rock Mech. Eng. 19 (3), 265–269.
Sheng-jun, M., Ze-jing, L., Xing-guang, Z., and Zheng-jun, H. (2021). Energy dissipation and damage characteristics of Beishan granite under cyclic loading and unloading. Chin. J. Rock Mech. Eng. 40 (5), 928–938. doi:10.13722/j.cnki.jrme.2020.0953
Shuai, Y., Wen-long, D., Yuan-hui, S., Yu-ming, S., and Ru-yue, W. (2016). Experimental study on pore/fissure morphology evolution of gas-bearing tight sandstone under different confining pressure conditions. Geophys. Prospect. Petroleum 55 (3), 326–332.
Tian-bin, L., Zi-quan, C., Guo-qing, C., Chun-chi, M., Ou-ling, T., and Min-jie, W. (2015). An experimental study of energy mechanism of sandstone with different moisture contents. Rock Soil Mech. 36 (S2), 229–236. doi:10.16285/j.rsm.2015.S2.030
Wen, T., Hui-ming, T., Yan-kun, W., Ma, J., and Fan, Z. (2019). Mechanical characteristics and energy evolution laws for red bed rock of badong formation under different stress paths. Adv. Civ. Eng. 2019, 8529329. doi:10.1155/2019/8529329
Wu, P., Chen, J., Fu, X., and Huang, J. (2024). Deformation characteristics and energy evolution of dry and saturated argillaceous siltstone under cyclic loading. Rock Soil Mech. 45 (S1), 195–207. doi:10.16285/j.rsm.2023.1141
Xiao, N., Fillipo, B., and Xiao-ping, Z. (2024). Three-dimensional stochastic reconstruction of porous media: a systematic review. J. Build. Eng. 91, 109642. doi:10.1016/j.jobe.2024.109642
Xiao, N., Peng, Yu, and Xiao-Ping, Z. (2025). A novel generative adversarial networks based multi-scale reconstruction method for porous rocks. Comput. & Struct. 313, 107745. doi:10.1016/j.compstruc.2025.107745
Xiao-Ping, Z., and Jian-Zhi, Z. (2021). Damage progression and acoustic emission in brittle failure of granite and sandstone. Int. J. Rock Mech. & Min. Sci. 143, 104789. doi:10.1016/j.ijrmms.2021.104789
Xiao-Ping, Z., Jian-Zhi, Z., Sheng-Qi, Y., and Berto, F. (2021). Compression-induced crack initiation and growth in flawed rocks: a review. Fatigue & Fract. Eng. Mater. & Struct. 44 (7), 1681–1707. doi:10.1111/ffe.13477
Xing-zhou, C., Ya-ni, B., Li-li, C., Bin, M., Wen-rui, W., and Sheng, G. (2024). Experimental study on mechanical properties of excavated unloading rock mass under high osmotic pressure and cyclic loading and unloading environments. Chin. J. Geotechnical Eng. 46 (4), 737–745.
Yangsheng, Z., Zengchao, F., and Wan, Z. (2003). Least energy priciple of dynamical failure of rock mass. Chin. J. Rock Mech. Eng. 22 (11), 1781–1783.
Ying, X., Cheng-jie, L., Qiang-qiang, Z., Xian, N., and Qian-qian, W. (2019). Analysis of energy evolution and damage characteristics of mudstone under cyclic loading and unloading. Chin. J. Rock Mech. Eng. 38 (10), 2084–2091. doi:10.13722/j.cnki.jrme.2019.0153
Yong-jiang, Y., Jia-ming, L., Yun-tao, Y., Zhi-yuan, S., and Shang-qing, Z. (2024). Mechanical properties and damage constitutive model of coal with different water content based on energy principle. Coal Sci. Technol. 52 (6), 67–80.
Yu, W., Yang, H., Hai, P., Ling-ling, S., Yan, Z., and Hao-zhe, G. (2022). Energy evolution model and rock burst risk assessment for deformation and failure of coal-rock mass. J. Min. & Saf. Eng. 39 (06), 1177–1186. doi:10.13545/j.cnki.jmse.2021.0621
Zhang, J.-Z., and Xiao-Ping, Z. (2020). AE event rate characteristics of flawed granite: from damage stress to ultimate failure. Geophys. J. Int. 222 (1), 795–814. doi:10.1093/gji/ggaa207
Zhang, Z., Yuan, X., Chen, Y., Tang, D., Ma, K., and Chen, Y. (2024). Energy evolution characteristics of sandstone under different stress cyclic paths. China Saf. Sci. J. 34 (2), 144–152. doi:10.16265/j.cnki.issn1003-3033.2024.02.0797
Keywords: energy evolution, siltstone, brazilian splitting, damage variable, moisture condition
Citation: Chen Z, Yuan Q, Zhang X, Liu X, Bai X and Chen Y (2025) Experimental study on moisture-dependent energy stage evolution and damage mechanisms of siltstone under cyclic loading-unloading in brazilian splitting tests. Front. Earth Sci. 13:1704719. doi: 10.3389/feart.2025.1704719
Received: 13 September 2025; Accepted: 11 November 2025;
Published: 04 December 2025.
Edited by:
Domenico De Tommasi, Politecnico di Bari, ItalyReviewed by:
Nan Xiao, Changsha University of Science and Technology, ChinaLunshi Zhou, Stanford University, United States
Copyright © 2025 Chen, Yuan, Zhang, Liu, Bai and Chen. This is an open-access article distributed under the terms of the Creative Commons Attribution License (CC BY). The use, distribution or reproduction in other forums is permitted, provided the original author(s) and the copyright owner(s) are credited and that the original publication in this journal is cited, in accordance with accepted academic practice. No use, distribution or reproduction is permitted which does not comply with these terms.
*Correspondence: Qiang Yuan, cWlhbmd5dWFuQGNxdS5lZHUuY24=