Abstract
To uncover the evolution pattern of the thermal state of high-speed railway subgrade in island permafrost region and to provide a basis for rational subgrade structure design, this study focuses on the island permafrost in the test section of the Riyuexia Station along the newly constructed Harbin-Yichun High-Speed Railway (HYHSR). Field ground temperature monitoring was conducted to gather data on the island permafrost’s temperature. Utilizing a fully coupled theory of permafrost water and heat that accounts for unsaturated soil seepage and heat conduction, a numerical calculation model for island permafrost subgrade was developed. This model systematically analyzes the impacts of varying excavation and replacement depths, subgrade widths, and heights on the temperature field of island permafrost. The findings indicate that: the region along the railway exhibits a significant warming and humidification trend, with the annual average temperature and precipitation growth rates in Tieli being 0.034 °C/year and 0.67 mm/year, respectively, and those in Yichun being 0.038 °C/year and 1.93 mm/year. The natural ground temperature of island permafrost is approximately −0.3 °C, classifying it as high-temperature and extremely unstable permafrost. A greater excavation and replacement depth accelerates the degradation rate of permafrost. An increase in subgrade width expands the lateral degradation range, while an increase in subgrade height delays the decline of the permafrost table. By the 30th year, the island permafrost beneath the subgrade filling areas under all working conditions has completely degraded, with the lateral degradation width of the island permafrost increasing with depth. Through model validation and comparison across multiple scenarios, the influence mechanism of subgrade structural parameters on the thermal stability of permafrost has been elucidated. The research outcomes offer theoretical foundations and technical support for subgrade design and disease prevention and control in high-speed railway construction within island permafrost region.
1 Introduction
Frozen soil is a special type of soil characterized by temperatures below 0 °C and the presence of ice. Its properties are closely related to temperature. Based on the duration of its frozen state, frozen soil is classified into two categories: seasonal frozen soil and permafrost. Permafrost that remains frozen for two or more consecutive years. In China, the distribution area of permafrost accounts for approximately 21.5% of the country’s land area, primarily found in the mid-to-low latitude Qinghai-Tibet Plateau and the high-latitude regions of Northeast China, such as the Greater and Lesser Khingan Mountains (Yuanming et al., 2009; Chen et al., 2006; Tai et al., 2017). The Qinghai-Tibet Plateau is dominated by continuous permafrost, while the Northeast Greater and Lesser Khingan Mountains regions mainly feature island permafrost. Infrastructure constructed in permafrost region faces severe thaw settlement hazards due to rising ground temperatures and the downward movement of the permafrost table. Consequently, during the construction period of the Qinghai-Tibet Railway, a set of engineering technologies for permafrost subgrades was adopted, centered on the design philosophy of “active cooling, chilling the foundation, and protecting permafrost”. These technologies primarily included active cooling measures such as air-cooled subgrade (with rock layers), crushed rock revetments, and thermosyphons. Based on the operation and maintenance of transportation projects on the Qinghai-Tibet Plateau, numerous scholars have systematically analyzed these active cooling measures in the Qinghai-Tibet Railway and Highway, demonstrating that active cooling measures can maintain the thermal stability of the permafrost foundation beneath subgrade structures (Ma et al., 2002; Lai et al., 2003; Niu et al., 2008; Zhang et al., 2005; Wu et al., 2010; Li et al., 2008).
The Intergovernmental Panel on Climate Change (IPCC) Sixth Assessment Report indicates that global warming is projected to reach or exceed 1.5 °C within the next 20 years (by 2040) (Zhuo-Ni et al., 2022). As global temperatures gradually rise, permafrost degradation intensifies. The permafrost on the Qinghai-Tibet Plateau has been warming over the past decades, with the active layer thickening gradually. The permafrost table beneath the Qinghai-Tibet Railway subgrade has descended, particularly significantly in high-temperature permafrost (mean annual ground temperature > −0.6 °C) (Ma et al., 2013). This has led to diseases such as thaw settlement, cracking, and uneven settlement of the subgrade. Analyses of the relationship between permafrost changes and engineering serviceability have indicated that the permafrost engineering of the Qinghai-Tibet Railway can only adapt to a climate warming of 1 °C. For future warming of 1.5 °C, preemptive planning for reinforcement measures is necessary (Wu et al., 2021). Against the backdrop of accelerating climate change, the thermal state of island permafrost in high-temperature and highly unstable zones (−0.5 °C–0 °C) undergoes significant changes. Coupled with the shallow lower limit and thin layer of permafrost, its impact on engineering stability cannot be ignored.
Air-cooled subgrade (with rock layers/crushed rock) primarily utilize natural convection to cool the permafrost foundation, i.e., exploiting cold air convection for cooling in the cold season and blocking hot air in the warm season (Wang et al., 2020; Cheng et al., 2010; Liu et al., 2017; Niu et al., 2015). Thermosyphons remove heat from the permafrost by utilizing the temperature difference between the ambient air and the working fluid inside the device to drive phase change of the working fluid (Wu et al., 2018; Zhang, 2018). The aforementioned measures all rely on the natural environment for cooling and can only function during the cold season. Thermosyphons, currently one of the most effective measures for permafrost protection, are widely used in infrastructure projects on the Qinghai-Tibet Plateau and in Northeast China. Their working principle mainly involves the phase change of the working fluid (generally liquid ammonia) inside the thermosyphon. During the cold season when the outside air temperature is lower than the permafrost temperature, the evaporator section of the thermosyphon absorbs heat, causing the working fluid to change from liquid to gas, while the condenser section releases heat, causing the working fluid to change from gas to liquid. This cycle continuously extracts heat from the permafrost. Thermosyphons cease operation during the warm season. Zhu (2021), based on a thermosyphon subgrade test section on the Zhangling-Xilinji Highway in Heilongjiang Province, analyzed the changes in the temperature field of the thermosyphon subgrade and summarized the differences in the effectiveness of thermosyphons used in different regions. Li et al. (2006), relying on a field test site on the Yalin Railway Line, analyzed the variation process of the foundation temperature field through monitored ground temperature data of a thermosyphon subgrade and derived the effective influence radius of the thermosyphons. Sheng et al. (2006), Tian et al. (2013) conducted three-dimensional numerical calculations of the temperature field of the thermosyphon subgrade on the Qinghai-Tibet Railway, analyzing the impact of different service years and layout spacings of thermosyphons on the cooling effect of permafrost. Jiang et al. (2017) studied the temperature field changes of subgrade with vertically inserted, obliquely inserted, and L-shaped thermosyphons, comparing and analyzing the cooling effects of different installation configurations. Wang et al. (2021a) analyzed the impact of subgrade filling on the temperature field of the underlying permafrost. The thermal effect of subgrade filling causes the freezing front beneath the subgrade center to sag and distort. Filling in July maximally hinders heat output from the soil to the atmosphere, resulting in the maximum sagging distortion of the freezing front within the subgrade coverage range and the slowest recovery of the permafrost temperature field.
Regarding the roadbed in the high-latitude sporadic permafrost regions of Northeast China, Zhai (2024) conducted an experimental study on the deformation mechanism of highway subgrades in these areas. The stress generated by dynamic loads affects the hydrothermal state of the subgrade soil by altering its physical properties, thereby influencing the settlement deformation of the subgrade. Conversely, changes in the hydrothermal state of the subgrade soil further affect its settlement deformation. Zhao et al. (2023), through an investigation of highway distress in the sporadic permafrost regions of Northeast China, found that the construction of new highways can disrupt the original swamp wetland ecosystem, thereby affecting the thermal regime within the subgrade structure and the underlying permafrost. Furthermore, the abundant surface water in the road area environment leads to an increase in the moisture content of the subgrade soil, elevating the risk of subgrade and pavement distress. Water accumulation at the toe of the subgrade or surface runoff can easily cause softening of the subgrade toe or erosion of the slope. Fan (2019) found that within 5 years after roadbed construction, the natural ground and the roadbed’s temperature field reached a mutual equilibrium stage. After this period, the impact of external temperature rise on the soil temperature field began to manifest. The construction of the roadbed disrupted the uniformity of the original ground temperature field, causing the continuous permafrost in the foundation to gradually become sporadic permafrost.
In summary, current research on the thermal state evolution of subgrade and protective measures in permafrost region mainly focuses on the Qinghai-Tibet Highway and Railway. Relatively fewer studies have been conducted in the high-latitude island permafrost region of Northeast China, and there is a lack of research specifically on the long-term evolution patterns of the temperature field of high-speed railway subgrade in island permafrost region. The newly constructed HYHSR is the world’s first high-speed railway traversing a permafrost region. Data accumulation on ground temperatures in these high-latitude, high-temperature, highly unstable island permafrost region, and research on the impact of subgrade construction on island permafrost, are nearly lacking. To reveal the thermal state of high-speed railway subgrade in island permafrost region and to investigate the influence of subgrade construction on the evolution patterns of island permafrost, this paper utilizes measured ground temperature data from the natural site of the test section on the new HYHSR. It aims to reveal the thermal state of high-temperature island permafrost, establish a permafrost subgrade model based on hydrothermal coupling, and analyze the influence patterns of different subgrade heights, widths, and foundation excavation/replacement depths on the temperature field of island permafrost. The research findings are intended to provide technical reference for the structural design and construction of high-speed railway subgrade in island permafrost region.
2 Permafrost environment and distribution characteristics
2.1 Test site environment
The newly constructed HYHSR is situated in the northern central part of Heilongjiang Province. The line originates from Harbin in the south and terminates in Yichun City in the north. Running nearly north-south, the HYHSR spans approximately 300 km. The Tieli-Yichun section of the line traverses a 46 km stretch of island permafrost. The comprehensive test section for sporadic permafrost is approximately 300 m in length. The line runs nearly north-south, and the impact of the south and north slope effect on the subgrade temperature field is not considered. The site is situated within the Lesser Khingan Mountains forestry region, characterized by a high groundwater level and a distinct distribution of island permafrost. By analyzing the meteorological monitoring data from the Tieli and Yichun weather stations, the variation patterns of temperature and precipitation in the region in recent years can be understood. Figures 1, 2 show the trends of temperature and precipitation over time at the Tieli and Yichun weather stations from 1960 to 2023, respectively. The figures indicate that over the past 60 years, the temperature in the region has gradually increased, and the precipitation has progressively risen. The average annual temperature and precipitation change rates at the Tieli weather station are 0.034 °C/year and 0.67 mm/year, while those at the Yichun weather station are 0.038 °C/year and 1.93 mm/year, respectively. The experimental section area exhibits a significant warming and humidification trend in the environmental climate. The warming and humidification of the climate in the high-latitude regions of Northeast China are also accelerating the northward shift of the southern boundary of the sporadic permafrost zone and the reduction in permafrost thickness. Compared to the 1970s, the southern boundary of permafrost in Northeast China, as determined by the average temperature from 1991 to 2000, has shifted northward by approximately 100–150 km in the western and central sections, with the permafrost area reduced by about 10% (Cui, 2012).
FIGURE 1

Temperature and precipitation changes in Tieli from 1960 to 2023. (a) Variation trend of annual average temperature with time, (b) Variation trend of annual average precipitation with time.
FIGURE 2

Temperature and precipitation changes in Yichun from 1960 to 2023. (a) Variation trend of annual average temperature with time, (b) Variation trend of annual average precipitation with time.
2.2 Freeze-thaw index analysis
Figure 3 depicts the time-history curve of freeze-thaw index variations at the Tieli Meteorological Station. As shown in the figure, from 1958 to 2023, the melting index, freezing index, and the cumulative freeze-thaw index all exhibited a pronounced upward trend. This reflects the impact of global warming, where the annual net cold input of temperature gradually diminishes while heat increases, adversely affecting the thermal stability of permafrost. Over time, the annual freezing index has been gradually rising, potentially linked to global climate change. The temperature increase caused by global warming may shorten the freezing duration of permafrost, thereby elevating the freezing index. Such changes have far-reaching implications for permafrost. Firstly, the stability of permafrost may be compromised. Permafrost refers to soil that remains frozen for consecutive years, and its stability is crucial for the safety and stability of railway permafrost engineering. A decrease in the freezing index directly indicates insufficient accumulated cold temperatures during the cold season, weakening the permafrost’s resistance to thermal disturbances in the warm season. This leads to an increase in permafrost temperature and a thickening of the active layer. A reduction in the absolute value of the freezing index signifies a weakened thermal barrier necessary for maintaining permafrost. The cumulative freeze-thaw index rose continuously from 356 °C·d in 1958 °C to 1,126 °C·d in 2023, with a particularly notable increase over the past 60 years. This indicates a strengthening of the annual average surface net heat absorption. The growth in the cumulative melting index suggests a positive shift in the annual surface heat balance, resulting in greater heat absorption than dissipation in permafrost. Consequently, the future trend of thermal degradation in permafrost is evident. The design of permafrost engineering should focus on the effect of temperature rise.
FIGURE 3

Time history curve of freezing thawing index change of Tieli meteorological station.
2.3 Variation law of ground temperature
High-precision temperature sensors (accuracy ±0.05 °C) were installed in boreholes in the natural ground of the test section, spaced at 0.5 m intervals. Monitoring occurred from January 2022 to December 2024. Figure 4 depicts the ground temperature variation in the natural site of the test section subgrade. Analysis was conducted on sections with significant ground temperature changes within a shallow 6 m range of the foundation. The graph demonstrates that, during the monitoring period, the ground temperature of island permafrost exhibited a pronounced warming trend. As time increased, the depth and scope of both cold and heat penetrating into the foundation gradually expanded, with the scope of heat being notably larger than that of cold. The heat absorbed by the foundation surpassed the input of cold, which is the primary cause of thermal degradation in island permafrost. In the first half of 2022, there was an unstable permafrost zone with temperatures below −0.5 °C within a 2–4 m range of the foundation. Due to continuous external heat intrusion, all permafrost below −0.5 °C in this area degraded. Over time, the −0.2 °C permafrost isotherm gradually shifted from an initial depth of 1.5 m to approximately a depth of 5 m, while the deep permafrost −0.2 °C isotherm began to rise in June 2024 and eventually approached connectivity. The area of permafrost between −0.5 °C and −0.2 °C gradually decreased, while the area between −0.2 °C and 0 °C gradually increased, and the 0 °C thaw depth line expanded year by year. The primary reason lies in the fact that the line of the test section passes through Lesser Khingan Mountains forest area. Before the construction, surface vegetation was cleared, leading to the exposure of peat soil on the surface. The peat soil layer is black high-organic humus soil, which increases the area for heat absorption and cold transmission. Since the local melting index exceeds the freezing index, the observed thermal degradation of the island permafrost showed an accelerated and irreversible trend in the short term. Surface vegetation significantly affects the thermal stability of the island permafrost.
FIGURE 4

Temperature variation in the natural ground at the test subgrade.
3 Establishment and validation of a hydro-thermal coupling model for permafrost
3.1 Hydro-thermal coupling theory
Water migration in permafrost is closely related to heat flow and temperature changes within it. Variations in water content at various points in frozen soil alter its thermophysical properties, while temperature changes can modify the physical and chemical properties of water in the soil, leading to changes in its fundamental parameters. During the water freezing process in permafrost, the instantaneous appearance of pore ice and the release of latent heat of phase change cause drastic changes in the basic physical parameters of water. Assuming that at any given instant, the thermal conductivity, diffusivity, and hydraulic conductivity in all directions are constant values, which are functions of unfrozen water content and volumetric ice content, independent of spatial location, and considering the isotropy of the soil (Bai et al., 2015; Xu and Xiaokang, 2023; Liu, 2024), the governing equations for the temperature field and moisture field in a permafrost subgrade can be derived.
3.1.1 Temperature field equation
In the process of heat transfer in frozen soil, the heat conduction equation (Bai et al., 2015) using latent heat of phase change as the heat source is:
In the formula: ρ is the soil density,kg/m3; θ is the volumetric moisture content, C(θ) is the soil heat capacity, J/(kg·°C); λ(θ) is the soil thermal conductivity, W/(m·°C); T is the soil temperature, °C; ∇ is the differential operator; L is the latent heat generated by the phase transition of water, L = 335 × 103 J/kg; ρI is the density of ice,kg/m3;θI is the volume fraction of void ice.
3.1.2 Water fractional field equation
The transport relationship of water in unsaturated soil is expressed using the Richards equation (Lu and Likos, 2012):
In the formula: is the volume content of unfrozen water; The density of water; is the hydraulic conductivity in the direction of gravity,m/s, is the diffusion rate of unfrozen water; is the permeability of unsaturated soil,m/s; is the specific water capacity, 1/m; is the impedance factor; is the soil saturation.
3.1.3 Supplementary equation
The hydro-thermal coupling equation contains unknown variables such as soil temperature , void ice content , and unfrozen water volume content . Therefore, a connection equation needs to be introduced to solve and establish the relationship between the three unknown variables. Based on experimental data, Xuezu et al. (2001) proposed an empirical relationship for the unfrozen water content in frozen soil:
In the equation, is the freezing temperature of the soil (°C); is the initial water content of the soil (%); is the unfrozen water content at a negative temperature T (%); and B is a constant related to soil type and salt content, which can be determined based on the unfrozen water test of a specific soil. When experimental data are unavailable, empirical values for B can be selected as follows: 0.61 for sandy soil, 0.47 for silt, and 0.56 for clay (Bai et al., 2015).
This paper draws on the approach of Li et al. (2024), Xu and Xiaokang (2023), which utilizes the ratio of pore ice volume to unfrozen water volume in frozen soil to solve the thermohydraulic coupled equation system. Herein, the concept of the “ice-water ratio” is introduced by rewriting Equation 6:
In the formula, the ice-water ratio is a single value function of temperature.
To sum up, simultaneous Equations 1–7 can solve the coupled transport of water and heat in frozen soil. The reliability of this method has been demonstrated by Bowen Tai et al. (2017) in the simulation of permafrost roadbeds along the Gonghe–Yushu Expressway, validating the model’s applicability in numerically solving the temperature and moisture fields in unsaturated permafrost or seasonally frozen roadbeds”.
3.2 Numerical model establishment
The model mesh utilized triangular elements. Prior to calculations for all working conditions, Case 1 was selected to conduct a mesh sensitivity analysis. The mesh setup has following three sizes: (1) maximum and minimum element of 1.5 m and 0.2 m; (2) maximum and minimum element of 0.9 m and 0.01 m; (3) maximum and minimum element of 0.5 m and 0.005 m. The calculation times for simulating 30 years are 7 min, 16 min and 45 min, respectively. However, the temperature and moisture analysis results from the three mesh configurations showed a negligible variation. The time step was automatically set by the model, with smaller steps during the initial calculation phase and larger steps in subsequent stages. All working conditions in this study employed a triangular mesh with a maximum element size of 0.9 m, and the model mesh is illustrated in Figure 5.
FIGURE 5
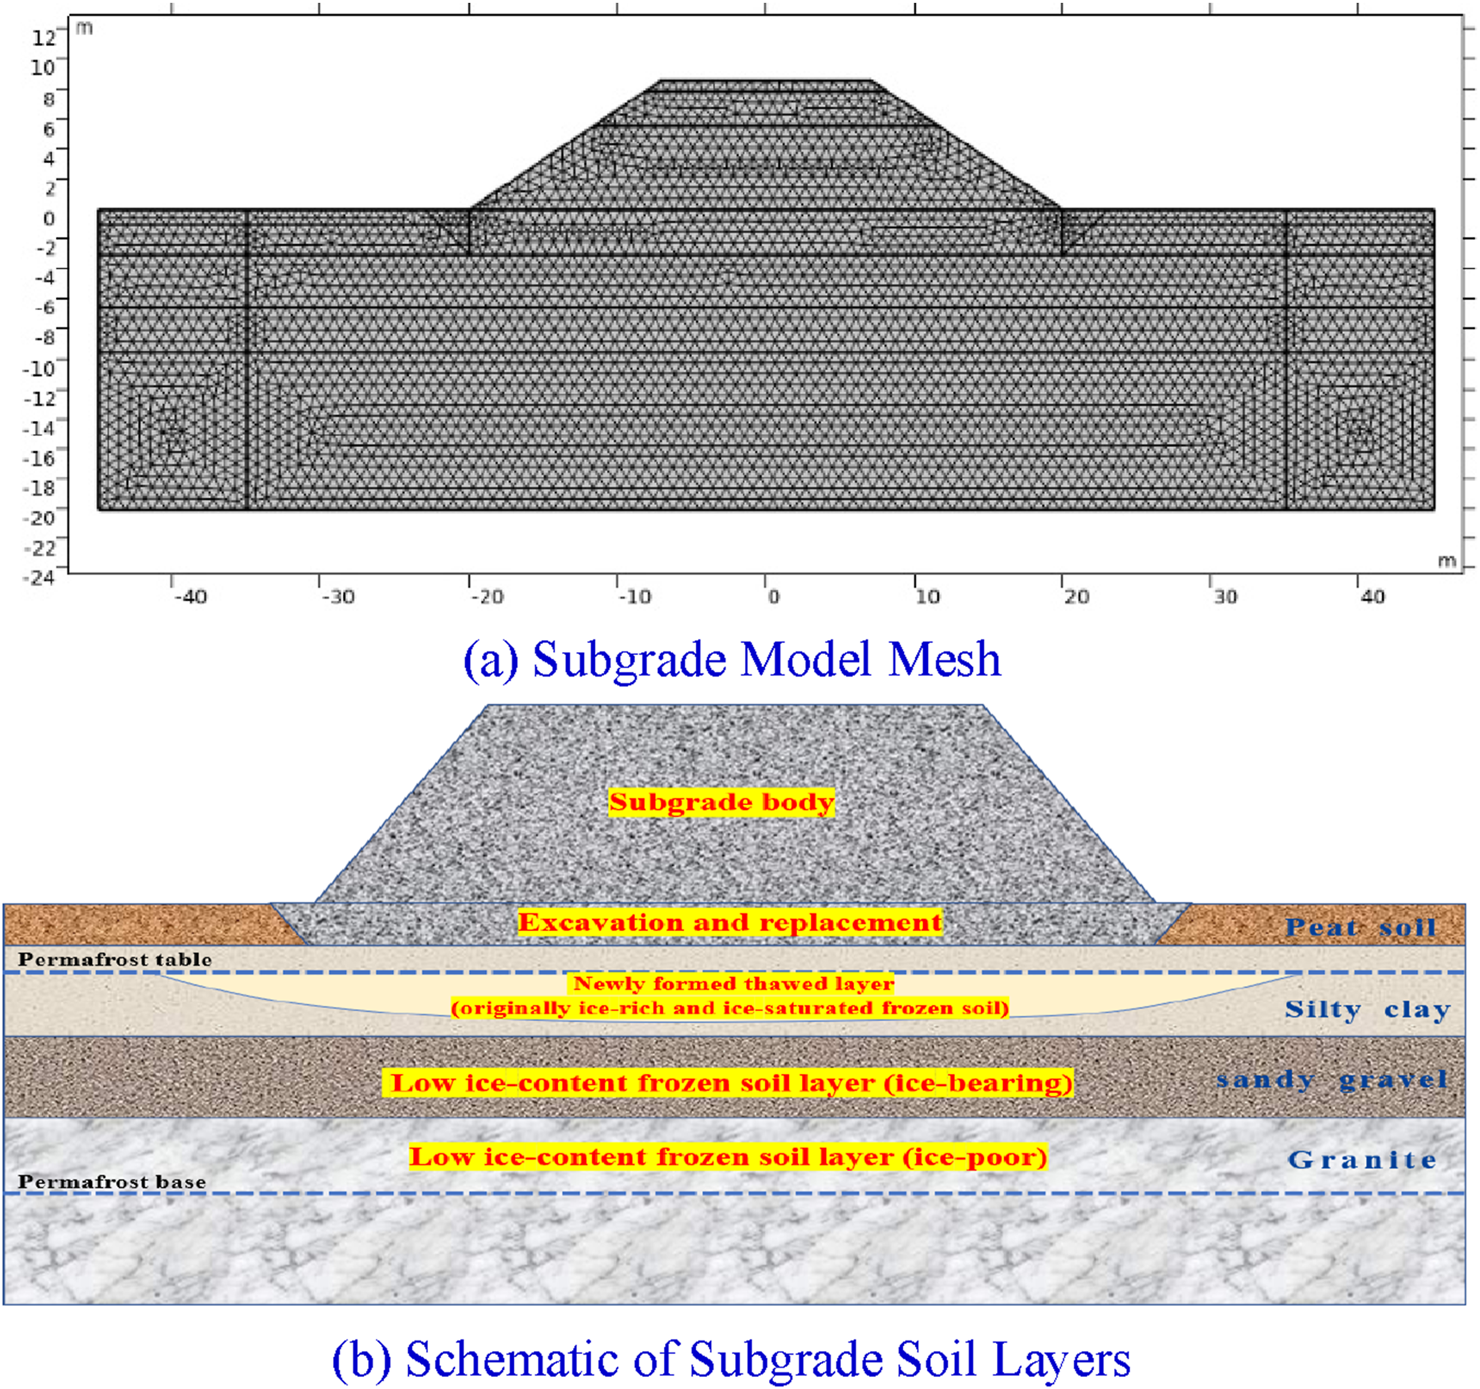
Permafrost subgrade model and soil layer information. (a) Subgrade model mesh, (b) Schematic of subgrade soil layers.
According to the design of the subgrade engineering in the test section, finite element numerical software was used for secondary development and the subgrade model was established. The foundation is 90 m wide, 20 m deep, with a surface layer thickness of 0.7 m and a bottom layer thickness of 2.3 m. The foundation soil layers from top to bottom are peat soil, silty clay, fine round gravel soil, and granite. Table 1 shows 9 calculation conditions for subgrade design. Condition 1 is the actual subgrade structure of the test section of Riyuexia Station. Based on this, the effects of different subgrade heights, widths, and excavation depths on the temperature field of permafrost are calculated separately. The control variable method is used for specific analysis and calculation. Condition 1, Condition 2, and Condition 3 only involve changes in excavation depth, while other factors remain unchanged. Study the impact of changes in excavation and replacement depth. Condition 4, Condition 5, and Condition 6 only have changes in subgrade width, while other factors remain unchanged. Study the impact of subgrade width changes. Condition 7, Condition 8, and Condition 9 only have changes in subgrade height, while other factors remain unchanged. Study the impact of subgrade height changes.
TABLE 1
| Working condition number | Subgrade height/m | Subgrade top width/m | Excavation and replacement depth/m |
|---|---|---|---|
| 1 | 8.6 | 14.2 | 3 |
| 2 | 8.6 | 14.2 | 2 |
| 3 | 8.6 | 14.2 | 1 |
| 4 | 8.6 | 18.2 | 3 |
| 5 | 8.6 | 11.2 | 3 |
| 6 | 8.6 | 9.2 | 3 |
| 7 | 10 | 14.2 | 3 |
| 8 | 7 | 14.2 | 3 |
| 9 | 5 | 14.2 | 3 |
Calculation conditions of permafrost subgrade for high-speed railway.
The main calculation parameters of the subgrade model are shown in Table 2. Through dynamic testing of the thermal conductivity and specific heat capacity of permafrost at different depths drilled from the test section under variable temperature conditions ranging from −20 °C to 20 °C, it was found that the thermal conductivity in the negative temperature state is greater than that in the positive temperature state. When the sample temperature is in the negative temperature range and below −10 °C, the thermal conductivity remains essentially stable, reaching its maximum value during this stage, and the heat transfer efficiency is the highest. When the sample temperature falls within the positive temperature range, the thermal conductivity remains nearly constant, and it reaches its minimum value in this state. The thermal conductivity of peat soil at different moisture contents generally ranges from 0.47 to 1.46 W·m-1·K−1, that of silty clay ranges from 1.03 to 2.46 W·m-1·K−1, that of sandy gravel ranges from 0.78 to 2.77 W·m-1·K−1, and that of granite ranges from 0.99 to 1.85 W·m-1·K−1. To improve the stability and convergence of the computational model, the average values of the dynamic test results in the negative and positive temperature ranges of the soil samples were taken as the final thermal parameter inputs for simulation calculations. The same method was used to select data results for the frozen and thawed states of the soil samples. The specific testing procedures and results can be referred to in literature (Liu, 2024). Among them, the peat soil is primarily the seasonal active layer, the silty clay is ice-rich permafrost, the sandy gravel is ice-bearing permafrost, and the granite is ice-poor permafrost. The characteristics and naming conventions for the ice content in permafrost are referenced from literature (GB 50324, 2014).
TABLE 2
| Soil layer | ρ/(kg·m-3) | C f/(J·kg-1·K−1) | C uf/(J·kg-1·K−1) | λ f/(W·m-1·K−1) | λ uf/(W·m-1·K−1) |
|---|---|---|---|---|---|
| graded crushed stone | 2 150 | 707 | 862 | 1.70 | 1.30 |
| Group A/B fill materials | 1 850 | 1 356 | 1 402 | 1.37 | 1.16 |
| Peat soil | 850 | 2 091 | 3 144 | 1.38 | 0.55 |
| Silty clay | 1 900 | 2 229 | 2 822 | 1.58 | 1.13 |
| Fine round gravel soil | 2 070 | 1 505 | 1 940 | 1.86 | 1.48 |
| granite | 2 100 | 1 509 | 1 675 | 1.65 | 1.45 |
Main parameters of subgrade model.
C f is the specific heat capacity of frozen soil, and Cuf is the specific heat capacity of thawed soil;λf is the thermal conductivity of frozen soil, and λuf is the thermal conductivity of thawed soil.
Due to the nearly north-south direction of the experimental section, the temperature boundary conditions of the model temperature field are based on the surface temperature measured on site from 2022 to 2023. The fitting Formula 8 for the ground temperature boundary is
The left and right boundaries of the model foundation adopt adiabatic boundaries, and the bottom adopts dirichlet boundaries with a constant temperature of −0.3 °C. The initial temperature of excavation, replacement, and subgrade filling is 5 °C, and the foundation temperature is assigned based on the measured ground temperature on site. The top, bottom, left, and right boundaries of the model moisture field are zero flux boundaries, and the remaining soil layers are assigned values based on the measured moisture content of the on-site drilling.
3.3 Model calculation and validation
To verify the accuracy and feasibility of the model, the natural foundation of the test section was selected for 50 years of temperature field simulation calculation. The temperature field of the natural foundation in the 50th year was extracted and compared with the field measured ground temperature data. The comparison between the calculated and measured natural ground temperature values in January and October of the 50th year is shown in Figure 6. As shown in the figure, the natural foundation temperature calculated by the model is basically consistent with the measured ground temperature, and the trend is consistent with the depth change. The ground temperature calculation within 2 m below the surface differs greatly from the measured value, mainly due to the influence of the weather and on-site environmental conditions at the time of collection. Therefore, the established simulation model is reasonable and feasible.
FIGURE 6
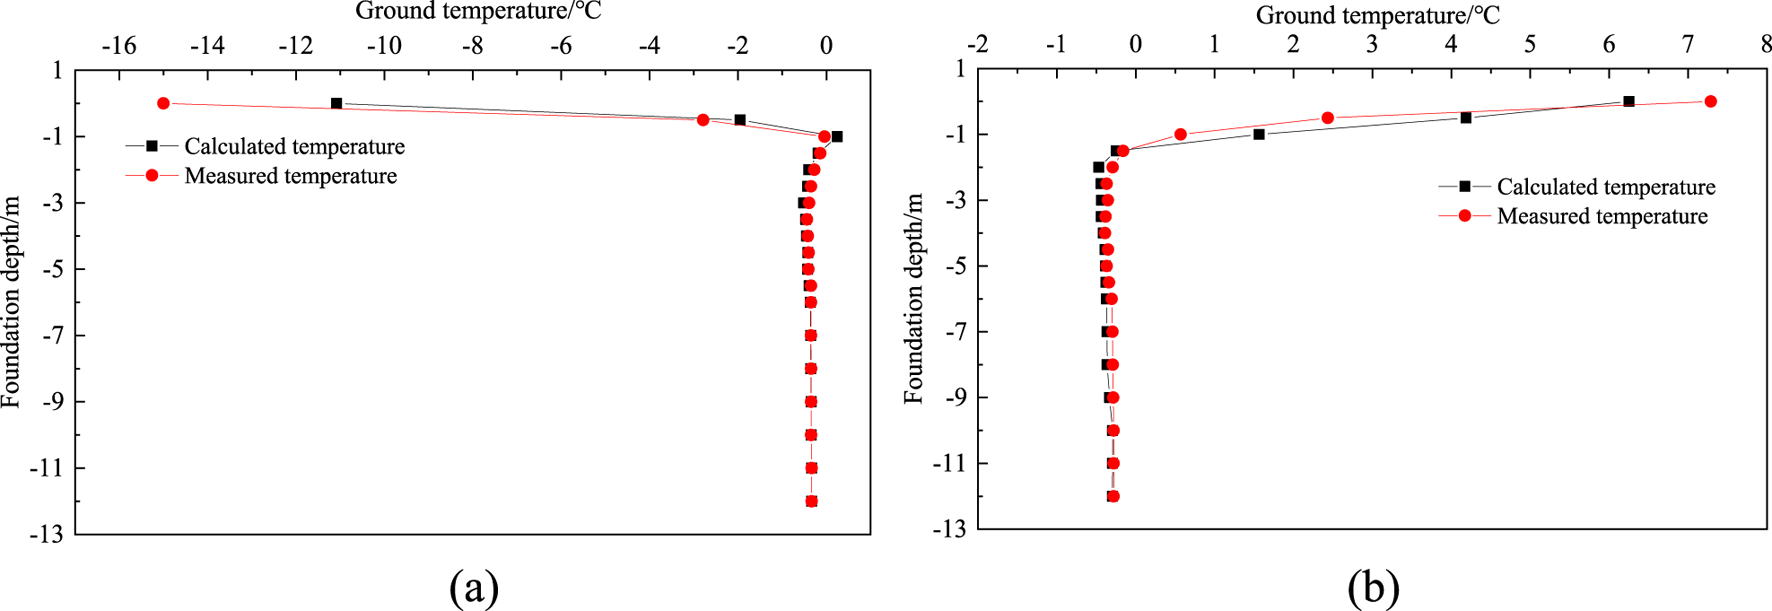
Comparison of natural foundation ground temperature calculation and measured values in January and October of the 50th year. (a) January, (b) October.
4 Analysis of the impact of excavation depth on permafrost
The main reason for the degradation and deformation of the underlying permafrost in the subgrade is the melting caused by the increase in soil temperature. The degree of degradation of the permafrost table can be used as a reference indicator for the melting and settlement deformation of the subgrade. Figure 7 shows the variation of permafrost table for subgrades with different excavation and replacement depths. By comparing the permafrost table in the 2nd, 5th, 6th, 7th, 10th, and 30th October of different excavation and filling depths, it can be seen that the degradation of island permafrost mainly occurs in the area below the subgrade structure. However, the natural soil in the lower part of the surface on both sides of the subgrade still maintains its original heat exchange state under the protection of the peat soil layer. Therefore, the table of shallow permafrost on the natural surface is basically maintained at a depth of about 2 m below the surface, which is consistent with the distribution characteristics of island shaped permafrost.
FIGURE 7

Ground temperature curves at different depths in the center of the subgrade. (a) The foundation is excavated and replaced with a depth of 3 m, (b) the foundation is excavated and replaced with a depth of 2 m, (c) the foundation is excavated and replaced with a depth of 1 m.
In October of the second year, the maximum burial depth of the permafrost table in the center of the 3 m excavated and replaced subgrade is about 5 m below the ground surface. As time increases, the permafrost layer below the subgrade undergoes extensive degradation, and permafrost table is significantly reduced. By October of the fifth year, the maximum depth of permafrost at the center of the subgrade was about 9.8 m below the surface. After October of the sixth year, the island shaped permafrost layer below the subgrade had completely degraded and gradually degraded towards both sides of the foundation. The degree of degradation of the permafrost table in the lower part of the subgrade is different for the other two excavation depths. When the filling depth is 2 m and 1 m respectively, the complete melting time of the underlying island shaped permafrost in the subgrade and excavation area is in the 6th and 7th year, respectively. In October of the 5th year, the burial depth of permafrost table in the subgrade of the two excavation depths is about 8.2 m and 7.2 m, respectively. With the same subgrade height, the degradation rate of permafrost below the subgrade increases with the increase of excavation depth.
Figure 8 shows the ground temperature curve at the center of the subgrade at different excavation and replacement depths. As shown in the figure, the variation law of the center ground temperature of the subgrade with different excavation depths is basically the same. In mid to late October, the center ground temperature of the subgrade shows a rapid increase from top to bottom, followed by a rapid decrease, and finally tends to a flat trend. The temperature at the test section began to decrease in October, and the shallow temperature of the subgrade began to decline under the influence of temperature. Therefore, the highest temperature inflection point appeared at the bottom layer of the subgrade. The depth of excavation and filling has a significant impact on the degradation of permafrost over many years. Taking the soil layer at a depth of 2 m below the original natural surface at the center of the subgrade as an example, in October of the second year, the temperature at this location of the 3 m subgrade after excavation and replacement was 1.2 °C, the temperature at this location of the 2 m subgrade after excavation and replacement was 0.7 °C, and the temperature at this location of the 1 m subgrade after excavation and replacement was 0.5 °C.It can be seen that as the excavation depth increases, the shallow soil temperature of the foundation becomes higher, and the degradation rate of permafrost becomes faster. In October of the 30th year, comparing the temperature of the soil layer at that location, it was found that the temperature of the subgrade excavated at depths of 3 m, 2 m, and 1 m remained stable at around 2.4 °C.With the increase of time, the subgrade and the permafrost layer of the foundation gradually reach heat exchange equilibrium, and the impact of excavation depth on the permafrost layer gradually decreases.
FIGURE 8

Ground temperature curves at the center of subgrade with different excavation and replacement depths. (a) The foundation is excavated and replaced with a depth of 3 m, (b) The foundation is excavated and replaced with a depth of 2 m, (c) The foundation is excavated and replaced with a depth of 1 m.
5 Analysis of the impact of subgrade width on permafrost
To investigate the influence of subgrade width on the degree of permafrost degradation, the distribution of ground temperature contour lines in October of the 30th year was selected for subgrade with widths of 18.2 m, 11.2 m, and 9.2 m. Figure 9 shows the temperature contour lines of different width subgrade in the 30th year. As shown in the figure, in October of the 30th year, the permafrost below the subgrade has completely degraded, and the 1 °C isotherm is located below the toe of slopes on both sides of the subgrade, basically distributed vertically along the toe of slopes on both sides, and changes with the position of the subgrade toe. The 1 °C isotherm of a 18.2 m wide subgrade is about 22 m from the center of the subgrade, the 1 °C isotherm of a 11.2 m wide subgrade is about 18 m from the center of the subgrade, and the 1 °C isotherm of a 9.2 m wide subgrade is about 16 m from the center of the subgrade. As the width of the subgrade top increases, the 1 °C isotherm moves further outward. The 2 °C isotherm is located within a range of 10 m below the surface of the earth, with a “concave funnel” distribution in the middle of the isotherm, which means that the middle of the area is a high-temperature melting disk. The inflection point of the 2 °C isotherm is significantly affected by the width of the subgrade. The 2 °C isotherm of the 18.2 m wide subgrade first rapidly decreases at a distance of 14 m from the center of the subgrade, and then flattens to the lowest position. The inflection point of the 2 °C isotherm of the 11.2 m wide subgrade is 10 m from the center of the subgrade, and the inflection point of the 2 °C isotherm of the 9.2 m wide subgrade is 8 m from the center of the subgrade. The larger the subgrade width, the larger the melting disk area, but the burial depth of the bottom of the melting disk is not much different. The 3 °C isotherm is not much different from the 2 °C isotherm at the toe of the subgrade filling at the toe of the slope is relatively thin and is significantly affected by changes in external temperature. The 3 °C isotherm is distributed in a convex shape at the center of the subgrade. The main reason is that the filling in the center range of the subgrade is relatively thick, and the impact of external temperature changes on this area is small. The temperature difference is not significant, and the temperature gradient is small, mainly due to the slow exchange of heat between the filling material and the foundation, resulting in a slow temperature transfer process. The increase in subgrade width will expand the degradation of permafrost within the lateral range of the subgrade, and the difference in vertical temperature impact on permafrost subgrades is relatively small.
FIGURE 9
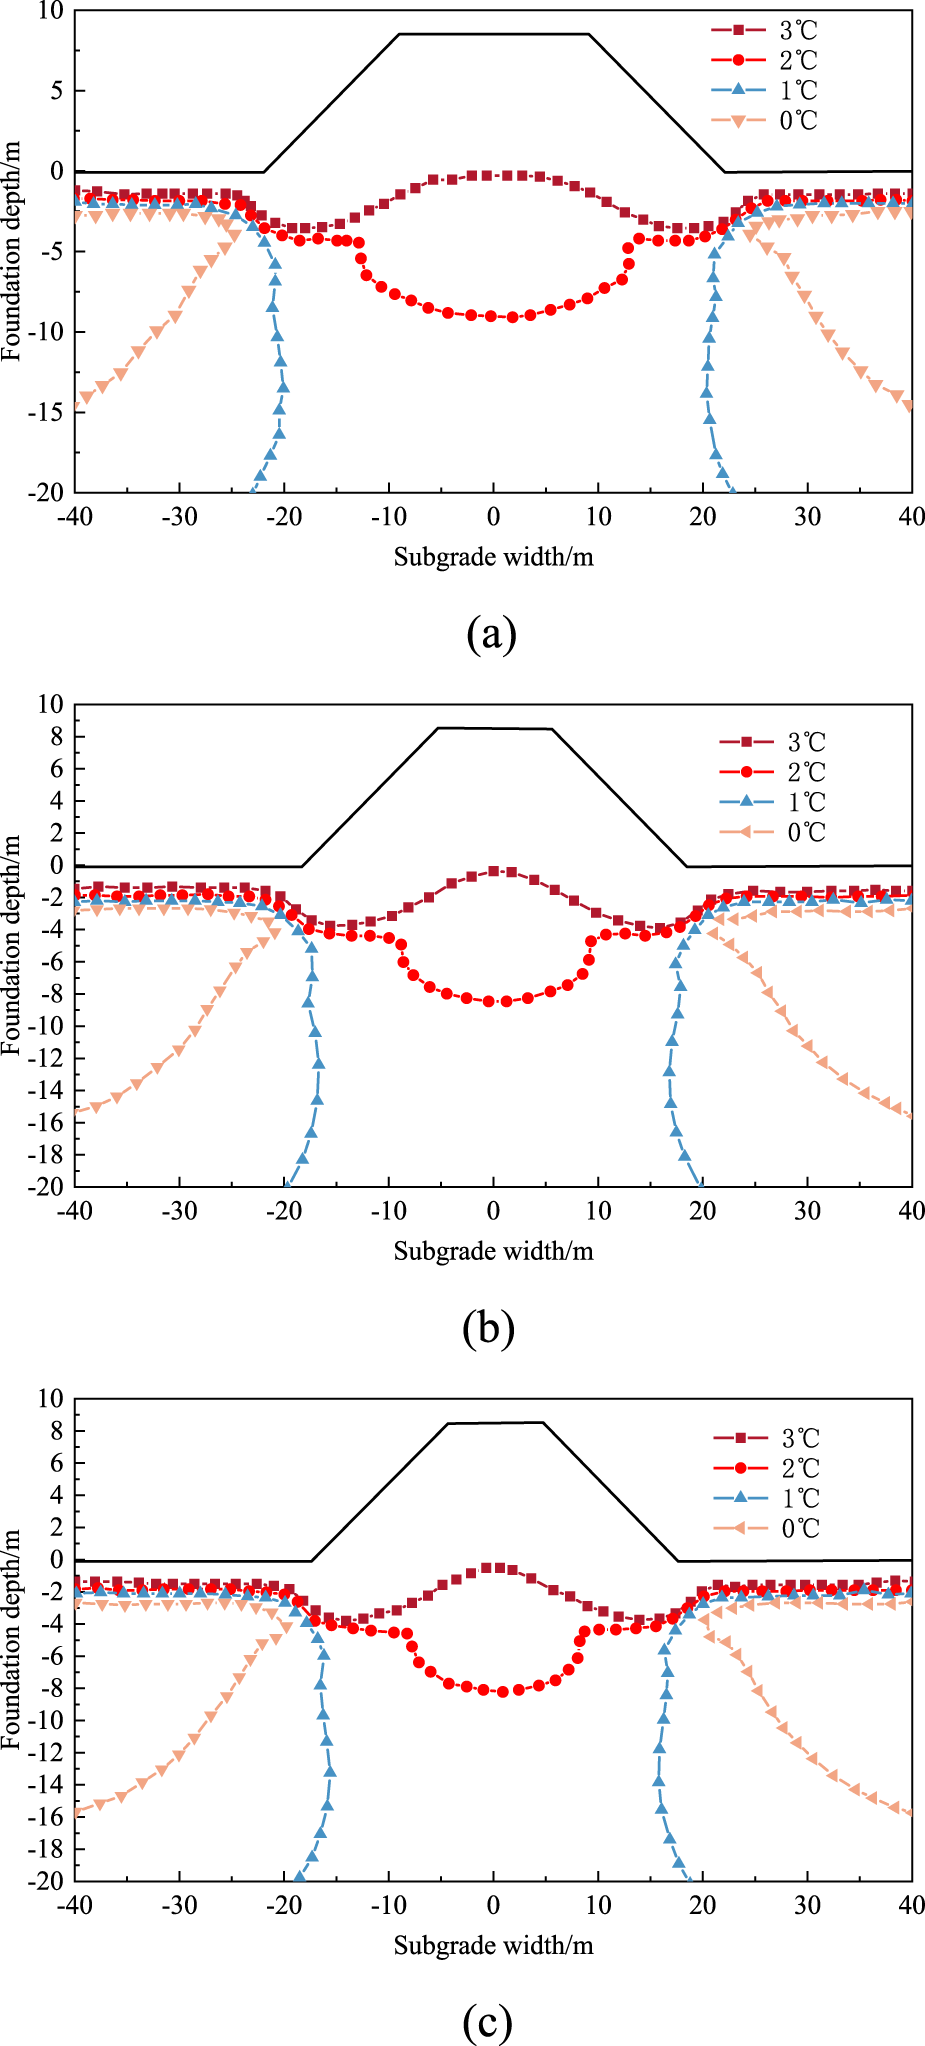
Temperature contour lines of different width road bases in the 30th year. (a) 18.2 m wide subgrade, (b) 11.2 m wide subgrade, (c) 9.2 m wide subgrade.
Figure 10 shows the center ground temperature curves of subgrade with different widths. The ground temperature curves for October of the 2nd, 5th, 6th, 10th, 20th, and 30th years at different depths in the center of three different widths of subgrade were extracted from the figure. As shown in the figure, with the increase of time, the temperature change of the bottom layer of the subgrade above the surface is relatively small. From the second to the fifth year, the temperature of the bottom layer of the subgrade shows a weak decreasing trend, mainly due to the melting of permafrost caused by the thermal diffusion of the filling material after subgrade filling, resulting in a weak temperature decrease in the bottom layer o the subgrade. In October of the sixth year, the temperature of the bottom layer of the subgrade gradually increased, mainly due to the basic melting of the permafrost under the subgrade. The heat transfer to the melted soil was relatively small, resulting in a slight increase in temperature. After the deep permafrost in the foundation melts, the ground temperature gradually increases. The variation of ground temperature over time at different depths in the center of subgrade with different widths is relatively small. Before the degradation of the permafrost layer beneath the subgrade, the annual temperature rise rate of the foundation is relatively small. When the permafrost layer is completely degraded, the temperature rise of the subgrade thaw increases.
FIGURE 10

Ground temperature curves at the center of subgrades with different widths. (a) 18.2 m wide subgrade, (b) 11.2 m wide subgrade, (c) 9.2 m wide subgrade.
6 Analysis of the impact of subgrade height on permafrost
Figure 11 shows the variation of permafrost table under different heights of subgrade. The permafrost table variation curves for the 2nd, 5th, 6th, 7th, 10th, and 30th months of 10m, 7 m, and 5 m high subgrade were selected. As shown in the figure, with the increase of time, the permafrost table of the 10 m high subgrade deteriorates rapidly. In October of the second year, the permafrost table at the center of the subgrade has been lowered to 5.4m, and the permafrost table at the toe of slope on both sides of the subgrade has changed slightly, showing an overall pattern of high on both sides and low in the middle. Over time, the permafrost table beneath the subgrade has extensively degraded. By October of the fifth year, the permafrost table had degraded to 9.8 m below the surface. By October of the sixth year, the permafrost in the middle of the foundation had completely degraded. Compared with other subgrade heights, it can be seen that the permafrost table in the lower part of each subgrade has degraded to varying degrees, and the degradation pattern remains consistent. When the subgrade heights are 7 m and 5 m respectively, the time for the permafrost beneath the subgrade to completely melt is around the 6th year. However, in the 5th year, the depth of permafrost table is 10m and 10.4 m respectively, indicating that as the subgrade height decreases, the degradation rate of permafrost beneath the subgrade increases. Increasing the height of the subgrade can to some extent delay the degradation trend of permafrost at the center of the subgrade.
FIGURE 11

Changes in the Permafrost table on Subgrade. (a) 10 m high subgrade, (b) 7 m high subgrade, (c) 5 m high subgrade.
Figure 12 shows the center ground temperature curves of 10 m, 7m, and 5 m high subgrades, and extracts the distribution of center ground temperature with depth for different heights of subgrades in October of the 2nd, 5th, 10th, 20th, and 30th years. As shown in the figure, the temperature inside the subgrade shows a trend of first increasing and then decreasing with depth, and the temperature difference between different years is relatively small. From the original surface to the depths of the foundation, as time increases, the ground temperature shows a gradual upward trend. After the 6th year, the permafrost below the center of the subgrade melts completely, and the temperature of the melted soil within the foundation gradually increases.
FIGURE 12

Ground temperature curves at different heights of subgrade centers. (a) 10 m high subgrade, (b) 7 m high subgrade, (c) 5 m high subgrade.
The temperature at the center of the subgrade is highest in the middle of the bottom layer of the subgrade. The main reason is that in mid October, the local temperature is already in a cooling process, and the surface temperature of the subgrade is slightly lower. As the depth increases, the temperature of the shallow soil layer of the subgrade gradually increases to the peak. The thickness of the soil layer above the peak temperature is the depth of influence from the high temperature period in summer to the temperature drop period in mid October. The soil temperature below the peak temperature to the natural surface range shows a continuous decreasing trend with increasing depth, and the temperature difference between different years is relatively small. The main reason is that the soil in the middle of this range is less affected by seasonal fluctuations in external temperature and has maintained a relatively stable thermal state. The soil mass from the original surface to the base of the subgrade shows a continuous degradation trend in the permafrost layer from the bottom of the excavation and replacement area to the lower limit of permafrost within 5 years before the completion of construction. After the 6th year, the permafrost below the subgrade has basically melted, and the temperature of the melted soil gradually increases with time. In the 30th year, the overall temperature of the soil below the original surface is around 2 °C.The rate of soil melting in the foundation from the 10th to the 20th year is significantly higher than that from the 20th to the 30th year.
In addition, the peak temperature of a 10 m high subgrade occurs 7 m above the center surface of the subgrade, a 7 m high subgrade occurs 4.8 m above the center surface of the subgrade, and a 5 m high subgrade occurs 2.9 m above the center surface of the subgrade. The smaller the height of the subgrade, the closer the peak temperature is to the surface. Meanwhile, the height of the subgrade will cause significant disturbance to the surface temperature at the center of the subgrade. Taking the original ground temperature at the center of the subgrade as an example, the temperature of a 10 m high subgrade is 3.4 °C, a 7 m high subgrade is 4.4 °C, and a 5 m high subgrade is 6.6 °C.As the height of the subgrade gradually decreases and the temperature gradually increases, a large positive temperature difference is formed between this area and the underlying permafrost, which leads to more heat transfer to the permafrost layer of the foundation. This also indicates that the higher the height of the subgrade, the lower the burial depth of the permafrost layer.
7 Discussion
The excavated and replaced crushed stone material has better thermal conductivity than the natural soil. A greater excavation depth means a thicker “thermal channel” with superior thermal conductivity is formed directly beneath the subgrade. Under the combined effects of climate warming and operational heat input, this “thermal channel” more effectively conducts heat from the upper layers to the deeper parts of the foundation, reducing thermal resistance and thereby accelerating the heat absorption and melting process of the underlying permafrost. Consequently, the permafrost degradation rate is fastest under the 3 m replacement depth. However, in the long term (by the 30th year), after the foundation and the subgrade gradually reach a new thermal equilibrium state, the ground temperature differences under different excavation depths decrease. This indicates that the initial impact of the excavation depth is gradually dominated by the overall thermal state of the system over time.
The presence of the subgrade structure alters the surface energy exchange conditions. A wider subgrade top surface covers a larger area of natural ground, which hinders the foundation from dissipating heat to the atmosphere in winter and allows it to absorb more solar radiant heat in summer. This “blanket effect” leads to greater heat accumulation under the subgrade compared to the natural ground on both sides. Therefore, an increase in subgrade width equivalently expands the lateral extent of this thermal disturbance, causing the 1 °C isotherm to move outward and the area of the high-temperature melting disk beneath the subgrade center to enlarge accordingly. It is noteworthy that the difference in the vertical temperature impact of the subgrade width on the foundation is relatively small, indicating that the width primarily affects the lateral expansion of the thermal disturbance, with limited influence on the depth of downward heat transfer.
The subgrade fill itself possesses a certain thermal resistance. A higher subgrade means a thicker “thermal barrier” layer is added between the heat source (the subgrade top surface) and the heat sink (the underlying permafrost). This thickened layered structure prolongs the path and time for heat to transfer from the road surface to the permafrost layer, creating an effect similar to “insulation” but actually acting as “heat blockage” (slowing heat ingress). Therefore, within the same period, the permafrost under a higher subgrade receives less heat than under a lower subgrade, resulting in a slower degradation rate. Furthermore, the observation of higher temperatures at the original ground surface center of lower subgrades further confirms the weaker thermal “protection” of low subgrades. This creates a larger temperature gradient between that area and the underlying permafrost, driving a more intense downward heat flow.
The influence of railway subgrade construction on the thermal regime of permafrost in the Qinghai-Tibet Plateau permafrost region differs from that in the high-latitude island permafrost areas of Northeast China. Due to the continuous distribution, greater thickness, and substantial stored cold energy of the plateau permafrost, the permafrost table can recover and rise into the subgrade body after a short-term degradation phase following construction (Wang et al., 2021). In contrast, the island permafrost, characterized by irregular, fragmented distribution and relatively limited cold reserves, experiences irreversible thermal degradation under engineering-induced thermal disturbances. Future work should focus on enhancing field monitoring of the thermal impacts of railway subgrade construction on permafrost. Long-term monitoring data will help elucidate the evolution patterns of permafrost thermal stability, thereby providing critical support for future railway construction in permafrost regions.
8 Conclusion
Based on the test section of the HYHSR, the characteristics of permafrost temperature in the test site were revealed, the calculation model of subgrade temperature field based on the hydro-thermal coupling theory was established and verified, the island permafrost subgrade conditions with different subgrade heights, subgrade widths, and excavation and replacement depths were designed, and the variation laws of subgrade temperature field under different conditions were calculated and analyzed. The main conclusions are as follows:
1. In the past 60 years, the average annual temperature and precipitation in the Tieli area have shown an increasing trend, with growth rates of 0.034 °C/year and 0.66 mm/year, respectively, and those in Yichun being 0.038 °C/year and 1.93 mm/year. The freezing index is lower than the thawing index, and the cumulative value of the freezing thawing index has been increasing year by year, threatening the thermal stability of the permafrost beneath the high-speed railway subgrade.
2. The temperature of the island permafrost is about −0.3 °C, which belongs to high-temperature and extremely unstable permafrost. The high-temperature and extremely unstable island permafrost is significantly degraded by engineering thermal disturbance. Shallow silty clay is mostly high ice content permafrost, while deep round gravel soil and granite are mostly low ice content permafrost.
3. The permafrost hydro-thermal coupling model was validated using field-measured ground temperature data, and the calculated results showed good agreement with the on-site measurements. The excavation and replacement depth primarily influences the heat flow rate by forming “thermal channels” of varying thicknesses. A greater depth results in faster downward heat conduction through the subgrade structure, leading to accelerated permafrost degradation. In October of the 5th year, the permafrost table depths under the subgrade with excavation and replacement depths of 3 m, 2 m, and 1 m were 9.8 m, 8.2 m, and 7.2 m, respectively.
4. Subgrade structural parameters significantly influence the degradation pattern of island permafrost by altering the heat transfer path and thermal resistance of the foundation. The subgrade width primarily affects the lateral extent of thermal disturbance. A greater width enhances the “blanket effect,” resulting in a wider lateral degradation range of the permafrost. In October of the 5th year, the horizontal distances from the subgrade centerline to the lowest point of the 1 °C isotherm for subgrade widths of 18.2 m, 11.2 m, and 9.2 m were 22.9 m, 19.6 m, and 18.5 m, respectively.
5. The subgrade height mainly retards the downward heat transfer through its “thermal barrier” effect. A greater height increases the thermal resistance, thereby more effectively delaying the descent of the permafrost table. 1n October of the 5th year, the permafrost table depths under the subgrade with heights of 10 m, 7 m, and 5 m were 9.8 m, 10.0 m, and 10.4 m, respectively.
Statements
Data availability statement
The original contributions presented in the study are included in the article/supplementary material, further inquiries can be directed to the corresponding author.
Author contributions
XL: Writing – original draft, Writing – review and editing.
Funding
The author(s) declare that financial support was received for the research and/or publication of this article. This research was supported by the Scientific Research Project of China Academy of Railway Sciences Corporation Limited (No.2024YJ249), the Science and technology research and development plan of China National Railway Corporation Limited (No. N2020G056) and the NSFC-Railway Joint Fund for Basic Research (No. U2268216).
Conflict of interest
Author XL was employed by China Academy of Railway Sciences Corporation Limited.
The authors declare that this study received funding from China Academy of Railway Sciences Corporation Limited. The funder had the following involvement in the study: decision to publish.
Generative AI statement
The author(s) declare that no Generative AI was used in the creation of this manuscript.
Any alternative text (alt text) provided alongside figures in this article has been generated by Frontiers with the support of artificial intelligence and reasonable efforts have been made to ensure accuracy, including review by the authors wherever possible. If you identify any issues, please contact us.
Publisher’s note
All claims expressed in this article are solely those of the authors and do not necessarily represent those of their affiliated organizations, or those of the publisher, the editors and the reviewers. Any product that may be evaluated in this article, or claim that may be made by its manufacturer, is not guaranteed or endorsed by the publisher.
References
1
Bai Q. Xu L. Tian Y. Fang J. (2015). Equations and numerical simulation for coupled water and heat transfer in frozen soil. Chin. J. Geotechnical Eng.37 (S2), 131–136.
2
Bowen T. Liu J. Wang T. Tian Y. Fang J. (2017). Thermal characteristics and declining permafrost table beneath three cooling embankments in warm permafrost regions. Appl. Therm. Eng.123, 435–447. 10.1016/j.applthermaleng.2017.05.031
3
Chen X. Liu J. Liu H. (2006). Frost action of soil and foundation engineering. Beijing: Science Press, 18–19.
4
Cheng G. Lai Y. Sun Z. (2010). The thermal semi-conductor effect of crushed rocks. Permafr. and Periglac. Process.18. 10.1002/ppp.575
5
Cui Y. (2012). Study on the subgrade treatment measures forinsular permafrost. Xi’an: Chang'an University.
6
Fan Y. (2019). Evolution law and control method of subgrade thaw-settling along mohe-beijicun highway. Harbin: Harbin Institute of Technology.
7
GB 50324 (2014). Code for engineering geological investigation of frozen ground. Beijing: China Planning Press.
8
Jiang L. Cheng W. Yu S. U. Li H. (2017). Ground temperature difference between L-shaped and directly inserted hot rods. Highway62 (11), 273–278.
9
Lai Y. Zhong L. Zhang S. Mi L. (2003). Cooling effect of riprap roadbed on Qinghai Tibet railway under climate warming conditions. Chin. Sci. Bull. (03), 292–297.
10
Li J. Liu J. Li Q. Wang W. (2006). Analysis on the effect of thermosyphon test in permafrost area of yalin line. Railw. Eng. (03), 73–75.
11
Li X. Li X. Liu J. (2024). A dynamic soil freezing characteristic curve model for frozen soil. J. Rock Mech. Geotechnical Eng.16 (8), 3339–3352. 10.1016/j.jrmge.2023.09.008
12
Li Y. Wu Z. Wang Y.-S. Sun J. (2008). Test study on the application effect of the thermal pipes on the roadbed in the permafrost Region along Qinghai-Tibet railway. China Railw. Sci. (06), 6–11.
13
Liu M. Niu F. Lin Z. Luo J. (2017). Long-term cooling effect and deformation characteristics of a U-shaped crushed rock embankment in warm permafrost regions. Rock Soil Mech.38 (11), 3304–3310. 10.16285/j.rsm.2017.11.028
14
Liu X. (2024). Research on time-dependent mechanisms and thermal regulation techniques of island permafrost performance in high-speed railway subgrade [D]. China Acad. Railw. Sci.. 10.27369/d.cnki.gtdky.2024.000006
15
Lu N. Likos W. J. (2004). Unsaturated soil mechanics. Hoboken, NJ: Wiley.
16
Ma W. Cheng G. Wu Q. (2002). Preliminary study on technology of cooling foundation in permafrost regions. J. Glaciol. Geocryol.5, 579–587. 10.7522/j.issn.1000-0240.2002.0102
17
Ma W. Mu Y. lIguoyu Wu Q. Liu Y. Sun Z. (2013). Responses of embankment thermal regime to engineering activities and climate change along the Qinghai-Tibet railway. Sci. Sin. Terrae43, 478–489.
18
Niu F. Liu M. Cheng G. D. Lin Z. Luo J. Yin G. (2015). Long-term thermal regimes of the Qinghai-Tibet railway embankments in Plateau permafrost regions. Sci. China Earth Sci.45 (08), 1220–1228.
19
Niu F. Liu X. Wei M. Qingbai W. Jian X. (2008). Monitoring study on the boundary thermal conditions of duct-ventilated embankment in permafrost regions. Cold Regions Sci. and Technol.53 (3), 305–316. 10.1016/j.coldregions.2007.07.004
20
Sheng Y. Wen Z. Ma W. Wu J. (2006). Three dimensional nonlinear analysis of temperature field of thermosyphon subgrade in permafrost region of Qinghai Tibet railway. J. China Railw. Soc. (01), 125–130.
21
Tai B. Lu J. Fang J. Liu H. Tian Y. (2017). Analysis on distribution characteristics of ground temperature and cooling effect of special-structured subgrade of the expressway in warm permafrost region. Chin. J. Rock Mech. Eng.36 (S1), 3696–3704. 10.13722/j.cnki.jrme.2016.1570
22
Tian Y. Liu J. Shen Y. (2013). 3D finite element analysis of cooling effect of Qinghai-Tibet railway embankment with thermosyphons in permafrost regions. Chin. J. Geotechnical Eng.35 (S2), 113–119.
23
Wang Q. Fang J. ang CHAO (2020). Analysis of cooling effect of block-stone expressway embankment in warm temperature permafrost region. Rock Soil Mech.41 (01), 305–314.
24
Wang Y. Guo H. Yangsheng Y. Wang Z. Wang P. Zhang Q. (2021). Numerical analysis of frozen soil temperature field in a ShortPeriod of subgrade filling in permafrost region. China railway. Soc. Sci.42 (04), 9–18.
25
Wang Z. Yuan J. Pang B. Huang l. (2022). The interpretation and highlights of IPCC AR6 WGIII report climate change 2022: mitigation of climate change. Clim. Change Res., 1–6.
26
Wu J. Xin Y. Xu W. Sun T. (2018). Research of thermosyphon applied in patchy permafrost sections along the genhe-labudalin highway. J. Glaciol. Geocryol.40 (05), 943–950.
27
Wu Q. Zhang Z. Liu Y. (2010). Long-term thermal effect of asphalt pavement on permafrost under an embankment. Cold Regions Sci. &Technology60 (3), 221–229. 10.1016/j.coldregions.2009.10.007
28
Wu Q. Zhang Z. Liu Ge (2021). Relationships between climate warming and engineering stability of permafrost on Qinghai-Tibet Plateau. J. Eng. Geol.29 (2), 342–352. 10.13544/j.cnki.jeg.2020-084
29
Xu L. I. Xiaokang L. I. (2023). A soil freezing-thawing model based on thermodynamics. Cold Regions Sci. Technol.211, 103867. 10.1016/j.coldregions.2023.103867
30
Xuezu X. U. Wang J. Zhang L. (2001). Permafrost physics. Beijing: Science Press, 75–98.
31
Yuanming L. A. I. Zhang M. Shuangyang Li et al (2009). Theory and application of engineering in cold regions. Beijing: Science Press.
32
Zhai J. (2024). Experimental study on the deformation mechanismof road subgrade in the island permafrost region of northeast China. Harbin: Northeast Forestry University.
33
Zhang M. Lai Y. Liu Z. Gao Z. (2005). Nonlinear analysis for the cooling effect of Qinghai-Tibetan railway embankment with different structures in permafrost regions. Cold Regions Sci. and Technol.42 (3), 237–249. 10.1016/j.coldregions.2005.02.003
34
Zhang X. (2018). Deformation monitoring and theoretical analysis of heat pipe subgrade of Qinghai-Tibet highway in permafrost region. (master’s thesis). Beijing, China: Beijing Jiaotong University.
35
Zhao Y. Xu X. Zhang H. Wang Y. Qian H. Li G. (2023). Research on frost damage characteristies of highways in patchy permafrostregion of lnner MongoliaJournal of Inner Mongolia. Univ. Technol. Sci. Ed.42 (06), 542–548. 10.13785/j.cnki.nmggydxxbzrkxb.2023.06.006
36
Zhu L. (2021). Thermal and mechanical behavior of highway thermosyphon subgrade in high latitude the patchy permafrost regions of northeast China. Harbin: Harbin Institute of Technology.
Summary
Keywords
island permafrost, high-speed railway subgrade, subgrade structure, temperature field, permafrost table
Citation
Liu X (2025) Study on the temperature field change law of high speed railway subgrade in island permafrost region. Front. Earth Sci. 13:1705217. doi: 10.3389/feart.2025.1705217
Received
26 September 2025
Accepted
13 October 2025
Published
24 October 2025
Volume
13 - 2025
Edited by
Chong Xu, Ministry of Emergency Management, China
Reviewed by
Ju Xin, Chinese Academy of Sciences (CAS), China
Chenxuan Tang, Sun Yat-sen University, China
Updates
Copyright
© 2025 Liu.
This is an open-access article distributed under the terms of the Creative Commons Attribution License (CC BY). The use, distribution or reproduction in other forums is permitted, provided the original author(s) and the copyright owner(s) are credited and that the original publication in this journal is cited, in accordance with accepted academic practice. No use, distribution or reproduction is permitted which does not comply with these terms.
*Correspondence: Xiaohe Liu, tkylxh@163.com
Disclaimer
All claims expressed in this article are solely those of the authors and do not necessarily represent those of their affiliated organizations, or those of the publisher, the editors and the reviewers. Any product that may be evaluated in this article or claim that may be made by its manufacturer is not guaranteed or endorsed by the publisher.