 Yaning Gao1,2
 Shuai Yin
 Zhihao Jiang
- 1 School of Earth Science and Engineering, Xi’an Shiyou University, Xi’an, China
- 2 Shanxi Key Laboratory of Petroleum Accumulation Geology, School of Earth Science and Engineering, Xi’an Shiyou University, Xi’an, Shanxi, China
The Upper Paleozoic He-8 Member in the southwestern Ordos Basin hosts enormous potential for natural-gas exploration and development, yet the reservoir is highly heterogeneous and still only sparsely drilled. Reservoir quality is the primary control on large-scale accumulation of natural gas. Taking the He-8 Member of the eastern Yanchuan area, Yan’an Gas Field, southwestern Ordos Basin as an example, this study integrates abundant core, grain-size, thin-section, SEM, petrophysical and mercury-injection data to systematically characterize the reservoir and identify the factors that govern its petrophysical properties. The He-8 Member was deposited in a braided-river delta setting. Reservoir lithologies are mainly quartz sandstone, lithic quartz sandstone, high-plasticity lithic sandstone and calcareous-cemented sandstone. Pore types include residual intergranular pores, dissolution pores (feldspar and lithic), intercrystalline pores and micro-fractures; among these, intragranular dissolution pores within volcanic lithics are the most abundant. Net-confined porosity ranges from 0.5% to 15.0% (mean 6.7%), and net-confined permeability from 0.001 × 10⁻³μm2 to 5.577 × 10⁻³μm2 (mean 0.053 × 10⁻³μm2), classifying the interval as an ultra-low-porosity, tight reservoir. Mercury-injection curves and parameters allow the He-8 Member to be subdivided into four reservoir classes, with Type II and Type III curves dominating. Reservoir quality is demonstrably controlled by lithology, diagenetic facies and the diagenetic history. Coarse and medium sandstones exhibit the best properties, followed by fine sandstones; siltstones are poorest. Among diagenetic facies, lithic quartz sandstone displays the highest porosity and permeability, followed by quartz sandstone, lithic sandstone and, lastly, calcareous-cemented sandstone. A diagenetic-stage scheme tailored to each lithology has been established and the diagenetic evolution reconstructed. Rapid early burial subjected the He-8 Member to intense compaction already during the early-diagenetic A1 substage, laying the petrophysical foundation for subsequent tightness. Secondary pores were generated principally by dissolution in the middle-diagenetic A2 substage—the key interval for reservoir-space creation. Entry into the middle-diagenetic B substage saw widespread authigenic precipitation that occluded remaining intergranular and dissolution pores, further tightening the sandstone. These findings provide practical guidance for the exploration and development of natural gas both in the study area and in analogous settings elsewhere.
1 Introduction
Tight sandstone reservoirs, as critical hosts for unconventional oil and gas resources, have development potential that is heavily constrained by their physical properties (Baas et al., 2012; Ding et al., 2016; Lai et al., 2018). However, such reservoirs typically exhibit complex characteristics including low porosity, low permeability, and strong heterogeneity. The formation and evolution of their physical properties are controlled by the coupling of multiple geological processes such as sedimentation, diagenesis, and fluid activity (Hardy et al., 1973; Farrell et al., 2014; Chen et al., 2020; Yang et al., 2025). Systematically investigating the main controlling factors of tight sandstone reservoir properties is essential not only for elucidating the mechanisms behind high-quality reservoir development but also for guiding the prediction of hydrocarbon-rich zones (Cheng et al., 2016; Eltom et al., 2016; Jazi and Wells, 2020). From characterizing microscopic pore structures to understanding macroscopic geological features, clarifying the factors influencing physical properties represents a core scientific challenge in effective reservoir evaluation and exploration breakthroughs (Cundall and Hart, 1985; Cook et al., 2015; Li D. Q. et al., 2018; Wu et al., 2024; Yuan et al., 2024; Zhu et al., 2025). It is also an inevitable pathway toward precision and efficiency in unconventional oil and gas development.
The Ordos Basin, the second-largest sedimentary basin in onshore China, harbors abundant oil and gas resources. The Upper Paleozoic in the Yan’an Gas Field, located in the southeastern part of the basin, shows promising potential for natural gas exploration, with natural gas primarily concentrated in the Middle Permian He-8 Member and the Lower Permian Shanxi Formation. Previous studies have conducted relevant research on the tight gas sandstone reservoirs in the Upper Paleozoic of the Yan’an Gas Field. For example, Mi et al. (2022) suggested that the heterogeneity of pore structures in the He-8 Member tight sandstone is primarily controlled by sedimentary microfacies, with diagenesis being the main factor complicating the microscopic pore structure of the reservoir. Li et al. (2024) investigated the reservoir characteristics of the He-8 Member and proposed that the lower limits for effective physical properties are a porosity of 2.3% and a permeability of 0.035 × 10⁻³ μm2, noting that intense compaction has the most significant impact on reservoir properties. Du et al. (2025) analyzed the controlling factors of high-quality reservoirs in the He-8 Member and concluded that coarser detrital particles, better sorting, and higher content of rigid grains facilitate the preservation of original intergranular pores, subsequently constructing a reservoir development model. Guo et al. (2025) found that pure quartz sandstone and quartz-rich low-plastic lithic sandstone exhibit the best physical properties in the Upper Paleozoic reservoirs, noting that the reservoirs entered the densification window during the Early Cretaceous and that properties below the lower limit are unfavorable for hydrocarbon charging. Wang et al. (2025) systematically studied the sedimentary characteristics of sand bodies in the He-8 Member and established a sand body architecture distribution model using Fisher’s discriminant formula.
The aforementioned studies indicate that reservoir petrophysical properties are the dominant factor controlling the large-scale accumulation of natural gas in the Upper Paleozoic of the Ordos Basin. This study selects the Yanchuan East Block as the research area, located on the eastern margin of the Ordos Basin. This marginal area is characterized by complex and variable sedimentary patterns, poor reservoir properties, and strong heterogeneity, making natural gas exploration in the Upper Paleozoic particularly challenging (Du et al., 2025; Wang et al., 2025). The sand bodies in this area are relatively distant from the hydrocarbon-generating centers of the sags, resulting in weak hydrocarbon expulsion intensity from the source rocks and significant difficulties in hydrocarbon migration. The conditions for natural gas accumulation are unique, and systematic research in this regard remains insufficient. Therefore, conducting a systematic study on the reservoir characteristics and the controlling factors of petrophysical properties of the main gas-bearing layer, the He-8 Member, in the Yanchuan East area is of great significance for achieving new breakthroughs in natural gas exploration in the marginal regions of the basin.
Taking the He-8 Member in the Yanchuan East Block of the Yan’an Gas Field, southeastern Ordos Basin, as a case study, this work integrates abundant core, grain-size, thin-section, SEM, petrophysical and high-pressure mercury-injection data to systematically characterize the reservoir and quantify the factors that control its quality. The resulting insights provide practical guidance for the exploration and development of natural gas both in this area and in analogous settings elsewhere.
2 Geological background
The Ordos Basin, covering an area of approximately 250,000 km2, is situated in the western part of the North China Plate (Mi et al., 2022) (Figure 1). Structurally, it is a large cratonic basin characterized by weak tectonic deformation, polycyclic evolution, and diverse sedimentary environments. The internal structure of the basin is relatively simple, with gently dipping strata generally inclined at less than 1°. Strata ranging from the Archean to the Cenozoic are widely developed throughout the basin (Du et al., 2025).
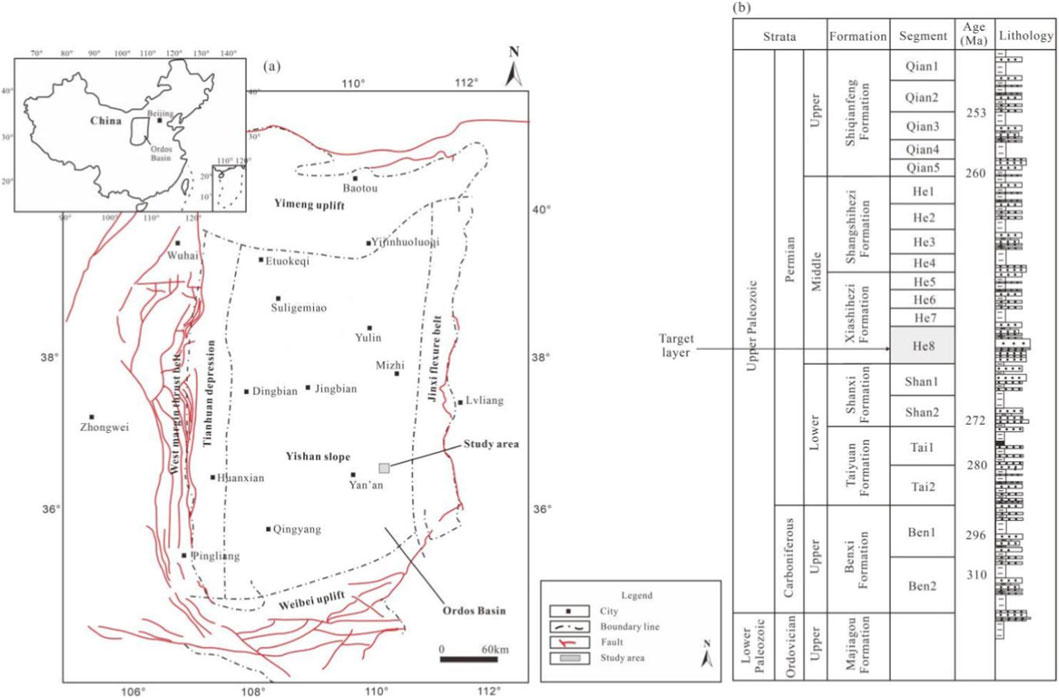
Figure 1. Location of the study area in the southeastern Ordos Basin (a) and composite stratigraphic column (b).
The target interval of this study is the He-8 Member of the Lower Permian Xiashihezi Formation in the Upper Paleozoic. The Xiashihezi Formation was continuously deposited above the Shanxi Formation and represents the most extensive deltaic sedimentary sequence developed across the basin (Li et al., 2024). Based on sedimentary characteristics, it is subdivided into He-8, He-7, He-6, and He-5 members (Guo et al., 2025). The lithology primarily consists of grayish-green and grayish-white pebbly coarse sandstone, medium sandstone, and variegated mudstone. Quartz sandstone, lithic quartz sandstone, and lithic sandstone are the main sandstone types, with a thickness ranging from 130 to 160 m.
The He-8 Member is the main gas-bearing zone in the region. Its upper part is composed of gray mudstone, grayish-white to light gray sandy mudstone, and sandstone interbedded in varying thicknesses, while the base consists of thick brownish-gray gas-bearing medium to coarse-grained sandstone (Wang et al., 2025). The thickness of the member ranges from 50 to 70 m.
3 Methods
Core observation and sampling were conducted on the He-8 Member from 28 wells in the study area and adjacent regions. Figure 2 shows the core observation and sampling wells in the study area, totaling 13 wells, with the remaining wells (Y445, Y294, Y275, Y2065, Y120, Y121, Y294, Y528, Y743, Y327, Y2064, Y2065, Y168, Y271 and Y215) located in nearby blocks adjacent to the study area. The core observations focused on lithology and sedimentary structures, while the collected samples were used for grain size analysis, thin section examination, scanning electron microscopy (SEM), petrophysical property measurements, and mercury injection capillary pressure (MICP) experiments. The locations of the sampling wells cover various structural settings, including both high and low structural positions, ensuring the representativeness of the samples (Figure 2). A stratified random sampling method was adopted: 1) selecting wells that cover the geological gradients across the entire study area; 2) systematically collecting samples according to the actual proportions of each lithofacies; and 3) ensuring vertical sampling density throughout the entire He-8 Member section in each well. This sampling strategy effectively captures reservoir heterogeneity, and this comprehensive dataset provides a reliable foundation for the research conclusions.
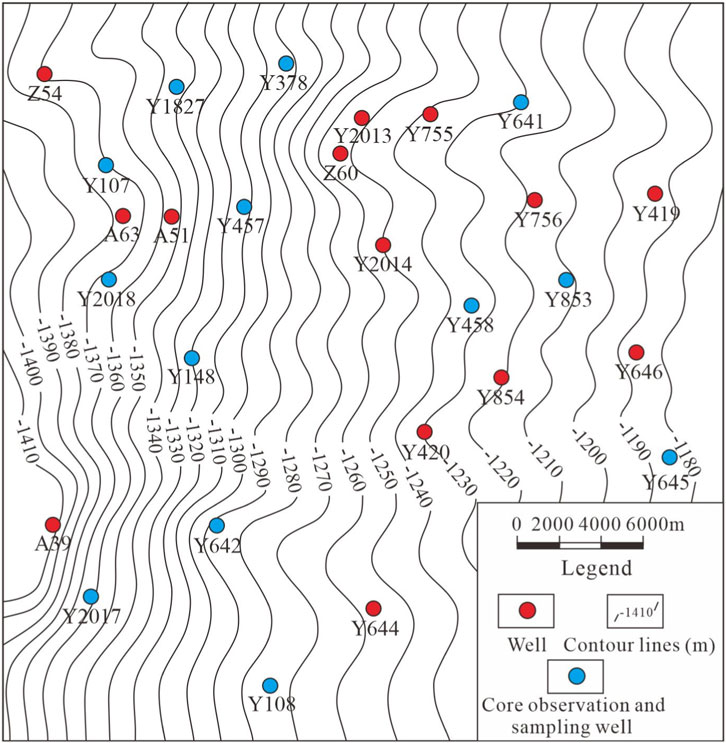
Figure 2. Structural map of the top surface of the He-8 Member in the study area and plan map of sampling and core observation well locations.
Laser particle size analysis was performed on ten sets of samples using a laser particle size analyzer. The testing procedure consists of two main stages: sample preparation and instrumental measurement. First, the samples were pretreated through drying and dispersion to ensure effective separation of individual particles. Measurements were then carried out using either sieving or laser diffraction methods. Finally, particle size distribution data were generated with dedicated software (Parsons et al., 2001; Pattison et al., 2007).
Rock thin section identification was carried out using an Axio Imager 2 transmitted-reflected polarizing microscope, with a total of 145 samples tested. The working principle is as follows: polarized light generated by the polarizer interacts with the anisotropic sample, where it is decomposed and altered, resulting in a phase difference. This light then passes through an analyzer oriented orthogonally to the polarizer, causing interference. The resulting interference image exhibits contrast in brightness and color, thereby revealing the microstructure and optical properties of the sample (Yin et al., 2024).
Scanning electron microscopy (SEM) was performed using an FEI QUANTA FEG 650 instrument on a total of 135 samples. The system utilizes a high-brightness, fine-focused electron probe generated by a thermal field emission gun (FEG). Under the control of scanning coils, the electron beam rasterizes the sample surface. By detecting various signals emitted from the sample—such as secondary electrons and backscattered electrons—the technique provides ultra-high-resolution morphological information, compositional data, and enables quantitative elemental analysis (Pritchard and Gladstone, 2009; Zou et al., 2012). Its unique multi-vacuum mode design significantly expands the range of applicable samples, allowing high-quality in situ analysis of materials ranging from metals to insulators and even hydrated biological specimens.
The petrophysical property measurements were conducted using a PorePDP-200 instrument on a total of 892 samples. Leveraging the small molecular size of helium, which enables it to penetrate tiny rock pores, the porosity is calculated by monitoring the pressure changes as helium enters the pore system. Permeability is a property of porous media that quantifies its capacity to allow fluids to pass through. Measuring the permeability of a porous rock sample or formation involves determining the ability of fluids to flow through that specific material.
Mercury injection capillary pressure (MICP) experiments were conducted using an AutoPore IV 9505 fully automated mercury porosimeter on a total of 15 samples. The theoretical basis of the mercury intrusion method is the capillary bundle model, which conceptualizes porous media as a series of capillary tubes with varying diameters. Since mercury is a non-wetting phase relative to the rock surface, while air or mercury vapor inside the pores acts as the wetting phase, the mercury injection process represents the displacement of the wetting phase by the non-wetting phase. When the injection pressure exceeds the capillary pressure corresponding to a specific pore throat, mercury begins to intrude into the pores. At this point, the injection pressure equals the capillary pressure, and the corresponding capillary radius reflects the pore throat radius. Simultaneously, the volume of mercury intruded represents the pore volume controlled by that throat. By continuously adjusting the injection pressure, pore size distribution curves and capillary pressure curves can be obtained.
4 Results
4.1 Sedimentary characteristics of the He-8 member
4.1.1 Lithological characteristics
Lithology serves as an intuitive and important indicator for identifying sedimentary facies (Jamison, 1983; Jamison, 2016; Osinowo et al., 2023). The color of rocks often reflects the paleogeographic setting, redox conditions, and hydrodynamic environment during the deposition process. In the core samples of the He-8 Member within the study area, sandstones are primarily gray, off-white, light gray, and gray-green, while mudstones are predominantly dark gray and gray-black. The relatively dark overall color of the He-8 Member cores indicates a relatively confined subaqueous reducing environment (Figure 3). Core data reveal that the sandstones of the He-8 Member mainly consist of light grayish-white pebbly coarse sandstone, gray fine sandstone, off-white pebbly medium sandstone, light gray medium sandstone, light green-gray fine sandstone, and light green-gray pebbly medium sandstone (Figures 3A–2D). Mineral composition analysis shows that quartz accounts for approximately 80%–85%, feldspar for about 10%–15%, and dark minerals along with other components make up around 5%. Basal conglomerates are well-developed, with quartz as the main component and minor amounts of mud clasts. The gravel size ranges from 3 to 20 mm, and the gravels exhibit a high degree of roundness (Figure 3B). These elliptical gravels in the He-8 Member of the study area are products of a high-energy fluvial environment (braided river delta) and are commonly found in settings such as channel bars, point bars, or subaqueous distributary channels. They indicate strong hydrodynamic conditions conducive to the formation of favorable reservoirs. During the depositional period of the He-8 Member in the Ordos Basin, the area was characterized by multi-source sediment supply, and these gravels also serve as indicators of sediment provenance directions and paleo-water flow pathways.
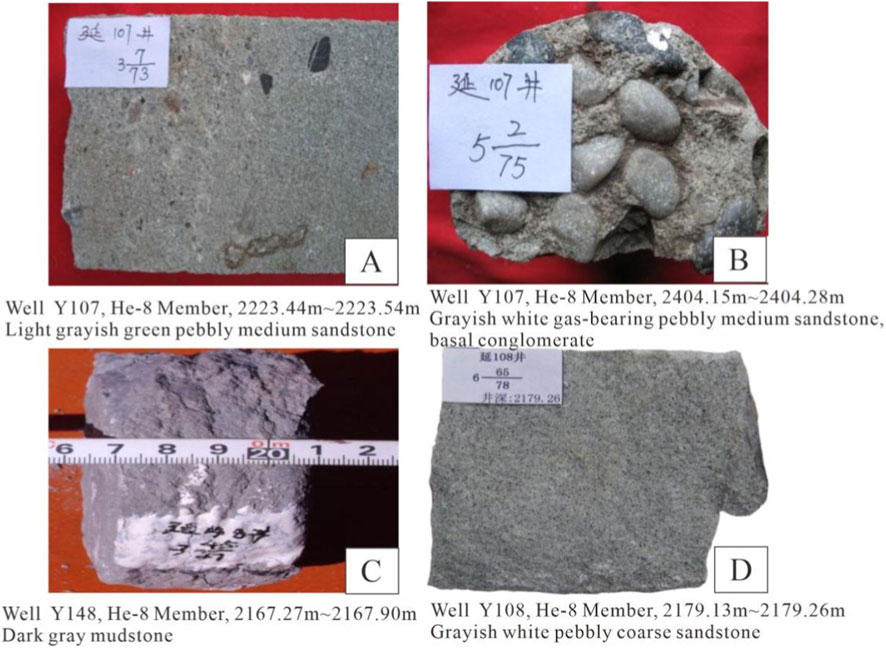
Figure 3. Typical lithological characteristics of the He-8 Member in the study area. (A) Well Y07, 2223.44m∼223.54m; (B) Well Y107, 2404.15m∼404.28m; (C) Well Y148, 2167.27m∼2167.90m; (D) Well Y108, 2179.13m∼2179.26m.
4.1.2 Sedimentary structural indicators
Primary sedimentary structures are highly useful indicators for identifying depositional systems, as they reflect the nature of the sedimentary medium, hydrodynamic conditions of the fluid, and the mode of sediment transport and deposition (Heidari et al., 2013; Li L. et al., 2018; Xiao et al., 2019). Core observations reveal that the He-8 Member in the study area exhibits a rich diversity of sedimentary structures, among which massive bedding is extremely well-developed. Also observed are cross-bedding, ripple bedding, small-scale tabular cross-bedding, parallel bedding, normal grading, basal conglomerate structures, and horizontal bedding developed in mudstones (Figure 4). Structures such as massive bedding, cross-bedding, and parallel bedding indicate relatively high-energy hydrodynamic conditions and are typically developed in the underwater distributary channel microfacies of the delta front subfacies (Zou et al., 2009; Jesús et al., 2013). In contrast, horizontal bedding and ripple bedding suggest quiet or low-energy hydrodynamic conditions, commonly found in the interdistributary bay microfacies of the delta front subfacies (Figure 4). Overall, the sediments of the He-8 Member are predominantly composed of medium and coarse sandstones, indicating generally strong hydrodynamic conditions during the depositional period.
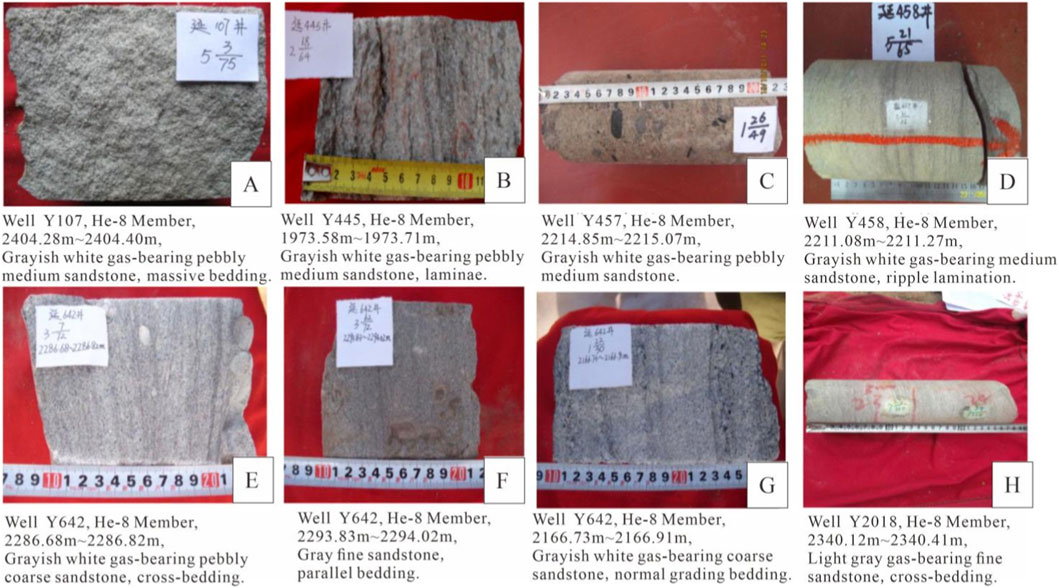
Figure 4. Typical sedimentary structural characteristics of the He-8 Member strata in the study area. (A) Well Y107, 2404.28m∼2404.40m; (B) Well Y445, 1973.58m∼1973.71m; (C) Well Y457, 2214.85m∼2215.07m; (D) Well Y458, 2211.08m∼2211.27m; (E) Well Y642m, 2286.68m∼2286.82m; (F) Well Y642, 2293.83m∼2294.02m; (G) Well Y642, 2166.73m∼2166.91m; (H) Well Y2018, 2340.12m∼2340.41m.
4.1.3 Grain size indicators
The grain size distribution of sediments is controlled by hydrodynamic conditions during deposition and serves as a direct indicator of the original sedimentary environment (Mayall et al., 2013; Zou et al., 2014). It provides immediate insights into the hydrodynamic forces at the time of deposition, offering critical evidence for the analysis of sedimentary environments. Grain size probability cumulative curves effectively distinguish particle transport mechanisms, flow energy levels, and the presence of backflow characteristics, among other features (Routa and Monahty, 2024; Zhai et al., 2024).
The transport of sandstone particles can be categorized into three types: rolling, saltation, and suspension (Zhang et al., 2006; Zavala and Arcuri, 2016; Yadav et al., 2023). These are represented on the curve as distinct segments, forming three populations. The slope of each segment reflects the sorting efficiency of the corresponding population: a steeper slope indicates better sorting, while a gentler slope suggests poorer sorting.
The probability cumulative grain size curves of off-white coarse sandstone and off-white to light gray medium sandstone samples from the He-8 Member are predominantly characterized by a three-segment pattern typical of underwater distributary channels (Figure 5a). This three-segment pattern is dominated by the rolling population, which generally accounts for 50%–80% (averaging ∼60%). The saltation population constitutes 16%–47% (averaging ∼37%), while the suspension population is minimal (<5%). The overall sorting is moderate, with steep slope segments and abrupt changes at intercept points, indicating strong hydrodynamic conditions in the depositional environment. The three-segment curve consists of rolling and saltation populations, with the saltation population comprising two subsets of differing slopes. The suspension population primarily consists of very fine sand and coarse silt, with minimal fine silt and clay content, further reflecting high-energy hydrodynamic conditions (Stow and Johansson, 2000; Stevenson and Peakall, 2010; Wu, 2017).
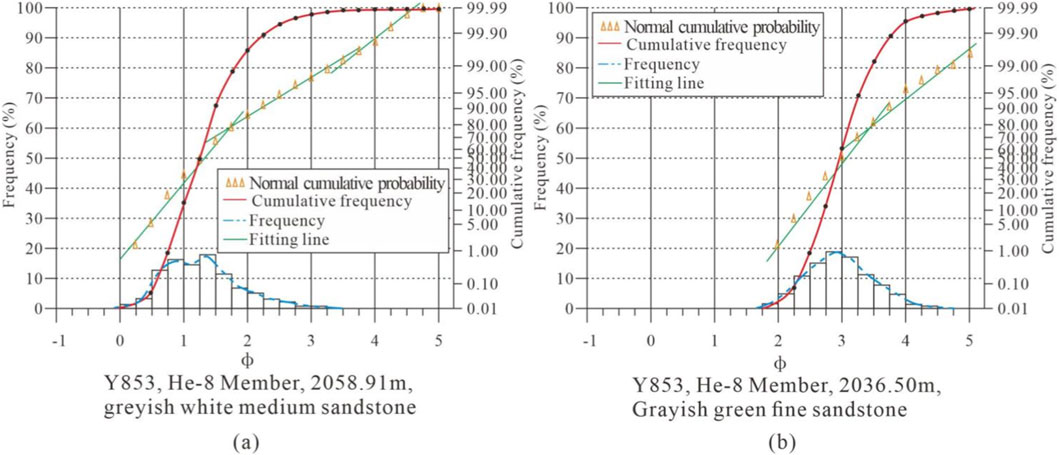
Figure 5. Typical grain-size characteristics of the He-8 Member in the study area. (a) Well Y853, 2058.91m; (b) Well Y853, 2036.50m.
In contrast, the probability cumulative grain size curves of off-white to light gray fine sandstone samples from the He-8 Member mainly exhibit a two-segment pattern typical of underwater distributary channels (Figure 5b). The saltation population dominates, accounting for 80%–95% (averaging ∼90%), while the suspension population remains minor (<10%). The overall sorting is moderate, with abrupt changes at intercept points, suggesting relatively strong hydrodynamic conditions during deposition. The two-segment curve consists of saltation and suspension populations. The suspension population is primarily composed of very fine sand and coarse silt, with trace amounts of fine silt and clay, consistent with a high-energy hydrodynamic environment.
4.2 Sedimentary facies characteristics of the He-8 member
During the sedimentary evolution of the He-8 Member, only the braided river delta front subfacies developed in the study area. This subfacies represents the underwater portion of the braided river delta system in the eastern part of the basin during the He-8 period. It is primarily characterized by the development of underwater distributary channel microfacies and interdistributary bay microfacies.
4.2.1 Underwater distributary channel subfacies
The underwater distributary channel microfacies is predominantly characterized by light grayish-white pebbly coarse sandstone, gray fine sandstone, off-white pebbly medium sandstone, light gray medium sandstone, light green-gray fine sandstone, and light green-gray pebbly medium sandstone. The mineral composition consists of approximately 80%–85% quartz, 10%–15% feldspar, and about 5% dark minerals and other components. Basal conglomerates are well-developed, primarily composed of quartz with minor mud clasts. The gravel size ranges from 3 to 20 mm, and the gravels exhibit a high degree of roundness. These characteristics indicate a high compositional maturity of the He-8 Member sandstones, suggesting prolonged transport under high-energy hydrodynamic conditions. Massive bedding is extensively developed, accompanied by cross-bedding, ripple lamination, small-scale tabular cross-bedding, parallel bedding, normal grading, basal conglomerate structures, and horizontal bedding within mudstones (Figure 6).
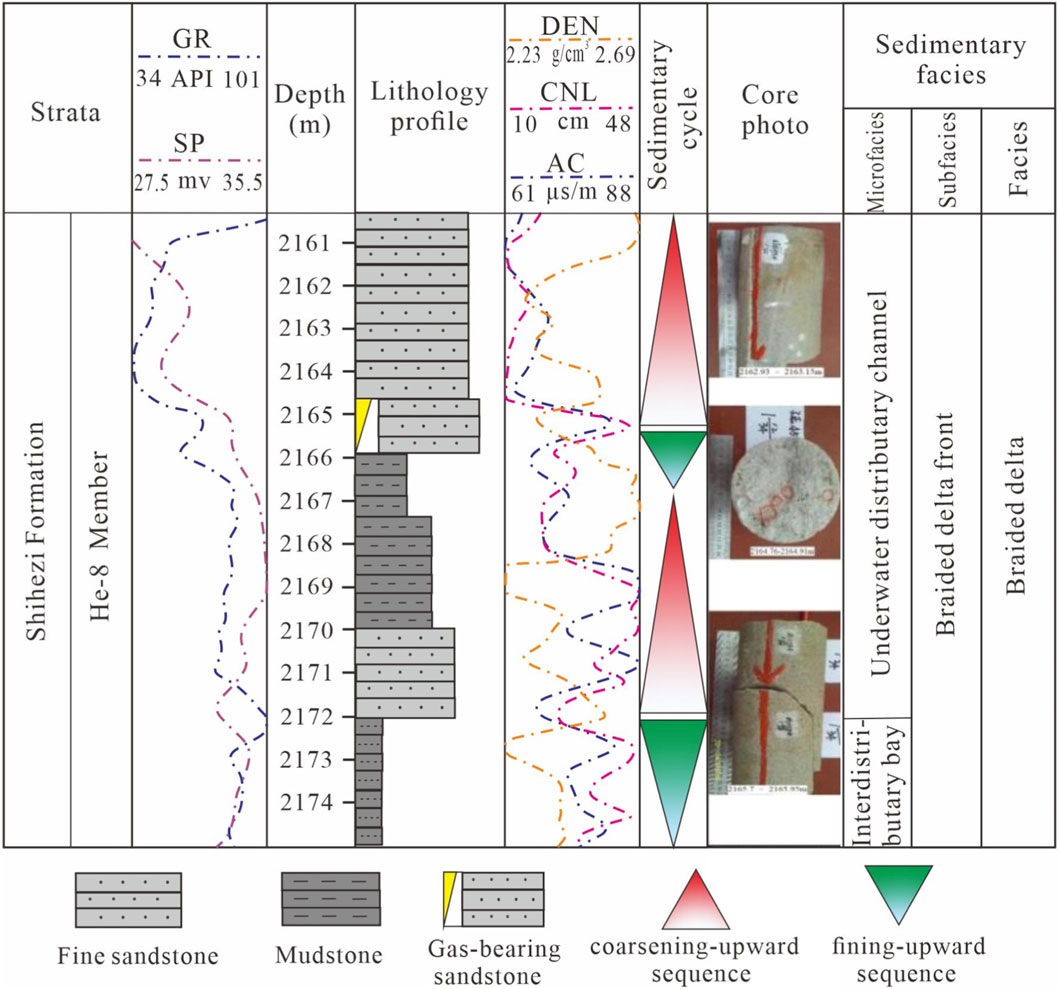
Figure 6. Core-facies analysis results of the He-8 Member in Well Y458 of the study area.
4.2.2 Interdistributary-bay subfacies
The interdistributary bay microfacies is distributed laterally adjacent to underwater distributary channels and is primarily composed of mudstone and silty mudstone (Mulder et al., 1997; Meiburg and Kneller, 2010; Li et al., 2022). Horizontal bedding is well-developed in the mudstones, with common pyrite authigenic cementation and relatively abundant organic matter (Figure 6).
Controlled by the reactivation of the Helan Aulacogen and regional basement subsidence of the basin, the Late Paleozoic infilling evolution of the Ordos Basin underwent four stages: coexisting rift bay and epicontinental sea, unified epicontinental sea, near-shore lacustrine basin with abundant lithic fragments, and inland lacustrine basin (Mi et al., 2022; Wang et al., 2025).
During the early Middle Permian, the tectonic framework of the basin was characterized by uplift in the north and tilting in the south, while the paleoclimate shifted to arid and semi-arid conditions (Li et al., 2024; Guo et al., 2025). As a result, fluvial systems transitioned from meandering rivers during the Shanxi Formation deposition to braided rivers. Due to the increasingly arid climate, coal formation ceased in the Late Paleozoic (Mi et al., 2022; Guo et al., 2025; Wang et al., 2025). Influenced by these paleotectonic and paleoclimatic conditions, the He-8 Member of the basin deposited a thick suite of relatively coarse-grained lithic sedimentary rocks. This was mainly manifested by significantly increased sediment supply from northern provenances, expansion of delta scale compared to the Shanxi Formation, and extensive development of sand bodies. The study area is located within the braided river delta front subfacies, where underwater distributary channels and interdistributary bays are interwoven. The intervals dominated by underwater distributary channels represent the most favorable facies zones for reservoir development (Figure 7).
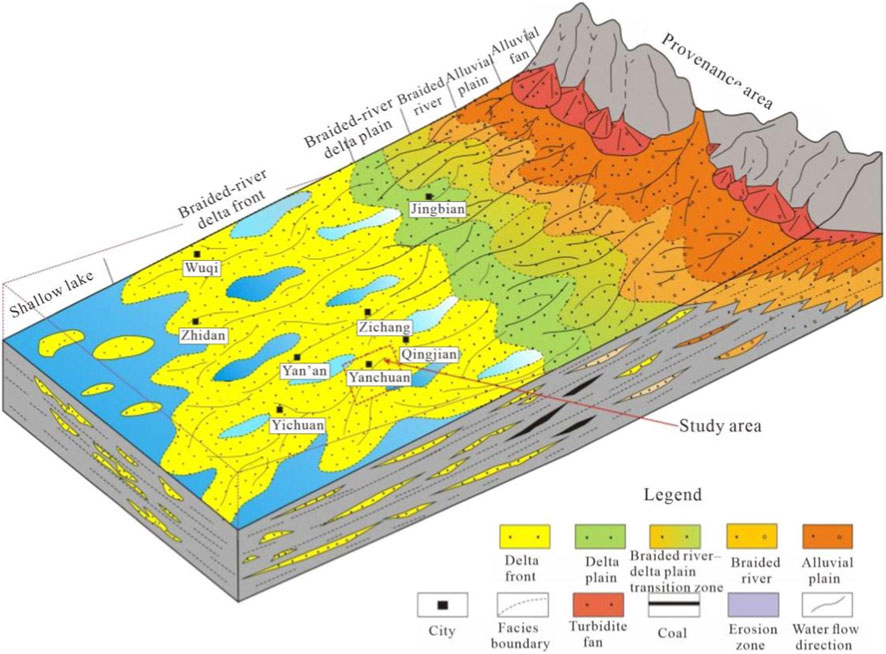
Figure 7. Sedimentary model of the He-8 Member in the Ordos Basin.
4.3 Reservoir characteristics
4.3.1 Petrological characteristics
4.3.1.1 Characteristics of lithic fragments
The lithology of the He-8 Member reservoir in the study area is predominantly composed of fine sandstone, medium sandstone, coarse sandstone, and pebbly coarse sandstone. The hydrocarbon-bearing potential primarily depends on the petrophysical properties, with coarse-grained and well-sorted sandstones exhibiting better hydrocarbon potential. Studies indicate that pebbly coarse sandstone and coarse sandstone, characterized by their coarse-grained texture and relatively better sorting, preserve more primary intergranular pores after deposition, resulting in superior hydrocarbon-bearing potential compared to fine sandstone.
Statistical analysis of thin section data indicates that the He-8 Member is predominantly composed of lithic sandstone (66.2%), followed by lithic quartz sandstone (26.6%). Influenced by the composition of source rocks in the northern provenance area, the content of lithic fragments is significantly increased. Petrographic analysis (Figure 8) shows that in the main Upper Paleozoic reservoir intervals of the He-8 Member in the Yanchuan East Block, the lithic fragments consist primarily of quartzose materials (including quartz and chert), with subordinate lithic fragments. Specifically, quartz content ranges from 35.8% to 90.0%, with an average of 54.66%; chert content varies between 0% and 10.46%, averaging 1.43%; while lithic fragment content is notably higher, ranging from 4.4% to 62.4%, with an average of 32.2%. The lithic fragments are dominated by metamorphic and igneous rock fragments (Figure 9).
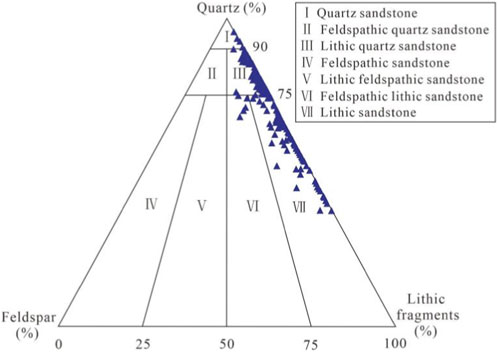
Figure 8. Ternary diagram of lithic-fragment composition for the He-8 Member in the study area.
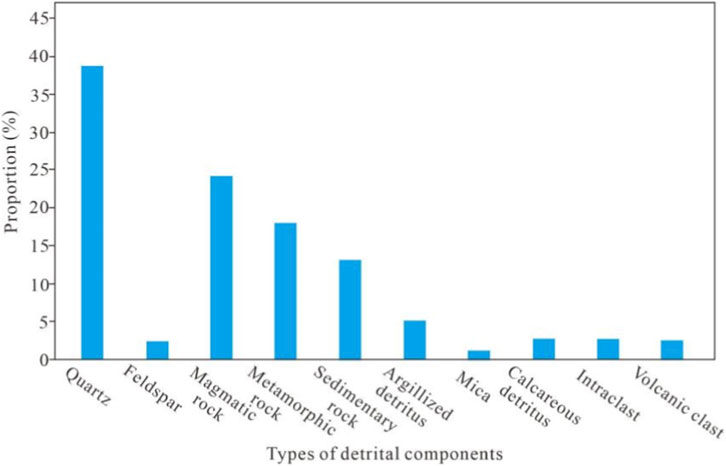
Figure 9. Average content diagram of lithic-fragment composition in the He-8 Member of the study area.
4.3.1.2 Characteristics of interstitial material components
The main interstitial materials in the reservoir intervals of the He-8 Member are clay minerals (kaolinite, chlorite, hydromica) (Figures 10A–D), silica cement (Figure 10D), and carbonate cements (Figure 10E). Among these, kaolinite and hydromica are relatively abundant, followed by chlorite and tuffaceous material, while siliceous cement and ferrocalcite are less common. The average content of clay mineral cement is 3.1%. Hydromica content ranges from 0% to 7%, with an average of 3.67%; kaolinite content varies between 0% and 6%, averaging 2.15%; tuffaceous material content ranges from 0% to 12%, averaging 4.07%; and chlorite content spans from 0% to 13%, with an average of 3.04%.
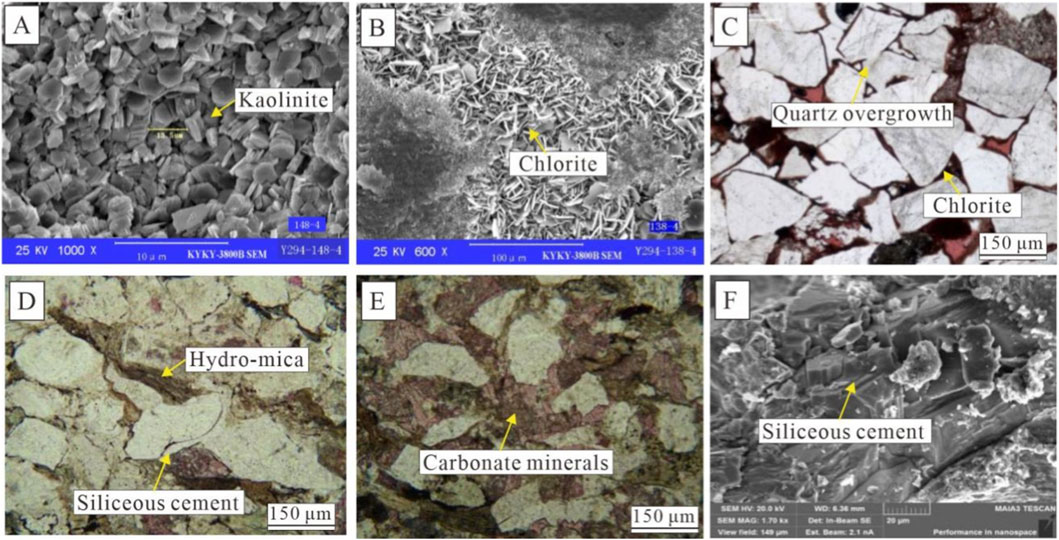
Figure 10. Microscopic thin-section and SEM characteristics of interstitial materials in lithic sandstone of the He-8 Member in the study area (A) Well Y294, 2432.26 m–2441.50 m, kaolinite cement; (B) Well Y294, 2432.26 m–2441.50 m, chlorite cement; (C) Well Y275, 2286.35 m, tightly compacted grains with chlorite clay coats; (D) Well Y2065, 2246.34 m–2246.46 m, minor late-stage calcite filling intragranular dissolution pores and quartz overgrowths visible; (E) Well Y2065, 2242.95 m–2242.19 m, early calcite forming poikilitic cement; (F) Well Y457, 2208.5 m, quartz-grain secondary overgrowth.
In the He-8 Member, most of the kaolinite and chlorite, along with tuffaceous material, are associated with the alteration of tuffaceous components. Kaolinite often retains the morphology of lithic fragments and is primarily a alteration product of alkali feldspar and volcanic lithic fragments. Some kaolinite occurring in matrix form results from the alteration of volcanic ash.
Silica cementation is widely present in the main gas-bearing intervals of the He-8 Member in the study area (Figure 10F), with content ranging from 0% to 6% and averaging 1.38%. It occurs in various forms and modes, including pore-filling and overgrowth structures. Due to the low solubility of silica cement, later dissolution processes rarely generate secondary pores, significantly impacting reservoir petrophysical properties. Carbonate cements include ferrocalcite, ankerite, and siderite. Ferrocalcite content ranges from 0% to 11%, with an average of 3.09%; ankerite content varies between 0% and 3%, averaging 1.17%; and siderite has an average content of 4.3% (Figure 11).
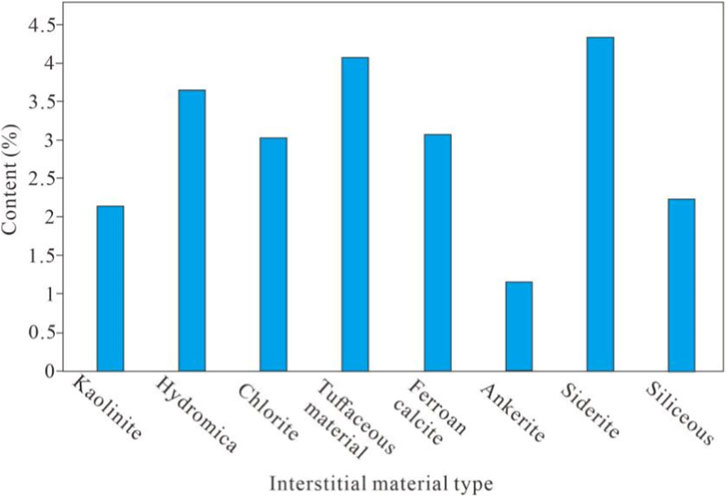
Figure 11. Histogram of the average content of interstitial constituents in the He-8 Member, study area.
4.3.2 Characteristics of pore development
The petrophysical properties of the reservoir are closely related to its pore-throat structure and pore types (Das and Maiti., 2024; Norsahminan et al., 2024). The pore-throat structure determines the permeability of the reservoir, while the pore types are strongly associated with porosity. According to cast thin section analysis, the pore types in the He-8 Member in this area can be classified into four categories: residual intergranular pores, dissolution pores (feldspar dissolution pores and lithic fragment dissolution pores), intercrystalline pores, and micro-fractures (Figure 12).
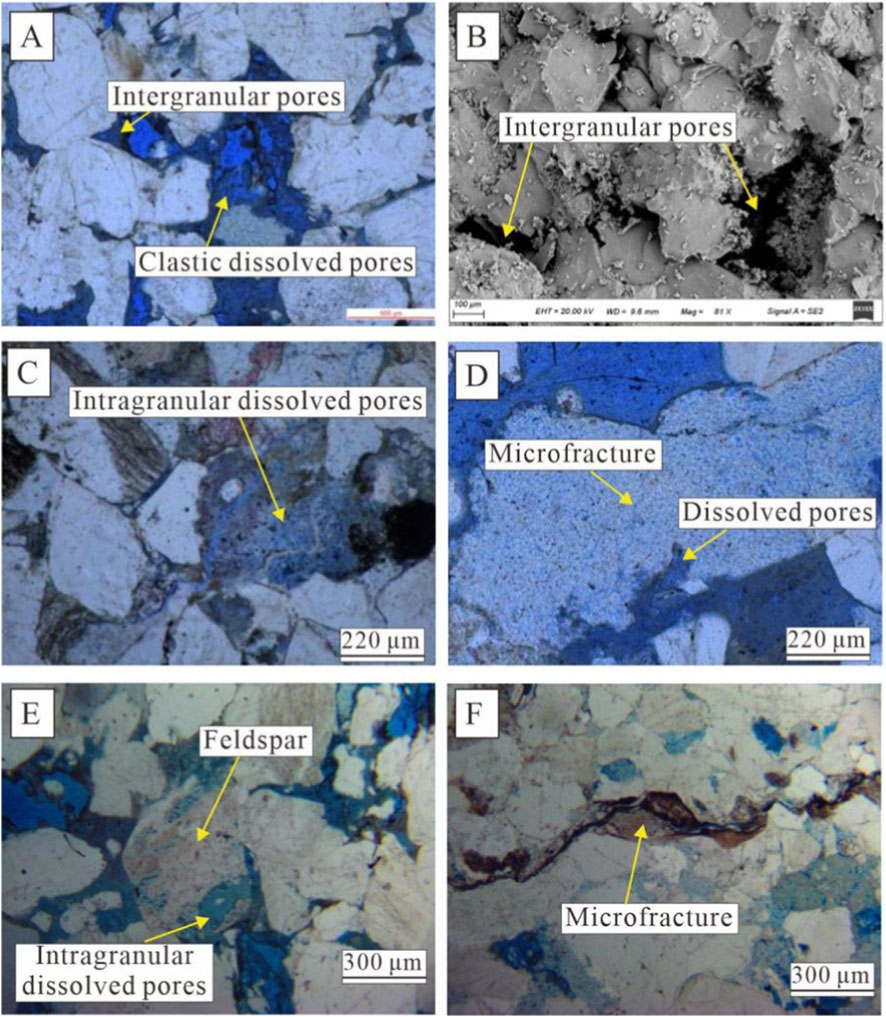
Figure 12. Microscopic characteristics of pore types in the He-8 Member reservoir, study area (A) Well Y120, 2560.72–2560.81 m, pebbly coarse-grained lithic sandstone: residual intergranular pores and dissolved pores within volcanic lithics; (B) Well Y378, 2735.72–2735.84 m: quartz overgrowths and residual intergranular pores; (C) Well Y121, 2627.39–2627.48 m, coarse-to medium-grained lithic sandstone: micro-fractures and intragranular dissolution pores in volcanic rock fragments; (D) Well Y120, 2560.72–2560.81 m, pebbly tuffaceous coarse-grained lithic sandstone: intercrystalline pores within kaolinite; (E) Well Y120, 2561.32–2561.42 m: intragranular dissolution pores in feldspar and residual intergranular pores; (F) Well Y121, 2620.73–2620.81 m: micro-fractures and intragranular dissolution pores in volcanic lithics.
Among these, intragranular dissolution pores within volcanic lithic fragments are the most developed, representing the most important type of reservoir space in the He-8 Member. The surface dissolution porosity ranges from approximately 0.5%–4.8%, with an average of 4.3%. Residual intergranular pores are the second most common, with surface porosity ranging from about 0.3% to 1.8% and an average of 1.3%. Additionally, minor amounts of micro-fractures and intercrystalline pores are observed. The average surface porosity of micro-fractures is about 0.1%, while that of intercrystalline pores is approximately 0.3% (Figure 13).
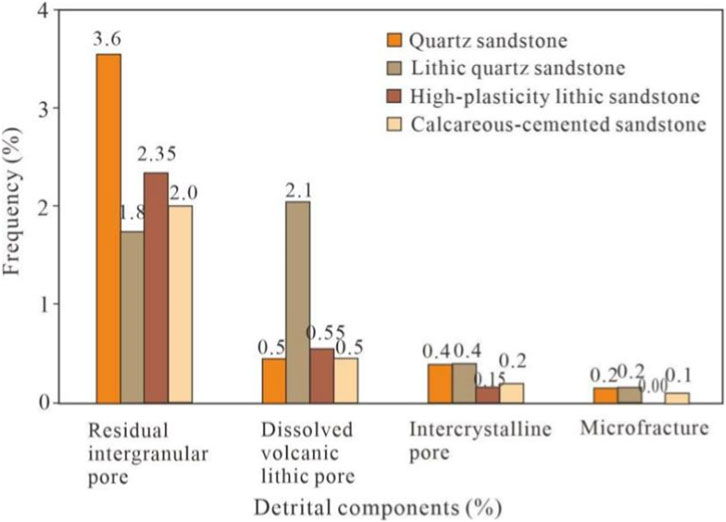
Figure 13. Statistical results of pore-type assemblages in the He-8 Member, study area.
4.3.3 Characteristics of reservoir petrophysical properties
4.3.3.1 Characteristics of confined porosity and permeability
Statistical analysis of core petrophysical properties from the He-8 Member in the study area indicates that the sandstone reservoirs exhibit confining-pressure porosity values ranging from 0.5% to 15.0%, with a mean of 6.7% and a median of 6.6%. The distribution of confining-pressure porosity is as follows: less than 2% accounts for approximately 6.9%, 2%–4% for 20.5%, 4%–6% for 34.2%, 6%–8% for 24.9%, 8%–10% for 10.2%, 10%–12% for 1.9%, and greater than 12% for 4.2% (Figure 14a).
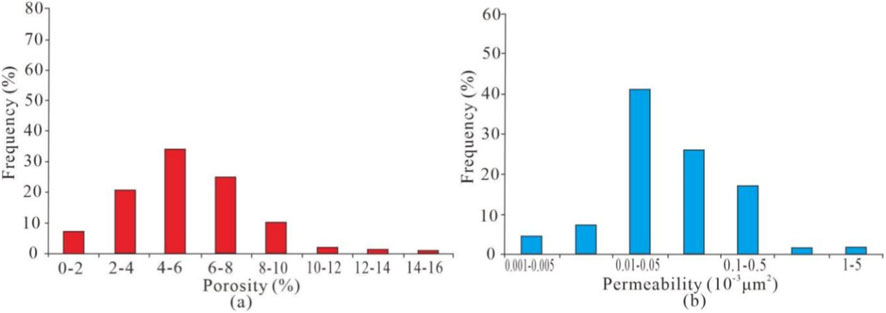
Figure 14. Histogram of confined porosity and permeability distributions for the He-8 Member, study area. (a) Porosity; (b) Permeability.
The confining-pressure permeability of the sandstone reservoirs ranges from 0.001 × 10⁻³μm2 to 5.577 × 10⁻³μm2, with a mean of 0.053 × 10⁻³μm2 and a median of 0.044 × 10⁻³μm2. The permeability distribution is as follows: 0.001–0.005 × 10⁻³μm2 accounts for about 4.5%, 0.005–0.01 × 10⁻³μm2 for 7.5%, 0.01–0.05 × 10⁻³μm2 for 41.2%, 0.05–0.1 × 10⁻³μm2 for 26.0%, 0.1–0.5 × 10⁻³μm2 for 17.2%, 0.5–1.0 × 10⁻³μm2 for 1.8%, and greater than 1.0 × 10⁻³μm2 for 1.8% (Figure 14b).
The results demonstrate that the He-8 Member represents an ultra-low porosity, tight reservoir.
4.3.3.2 Characteristics of pore-throat structure
Parameters commonly used in characterizing pore structures via high-pressure mercury injection include those evaluating pore-throat size (Laubach, 1997; Kane and Pontén, 2012). A statistical analysis was performed on mercury injection parameters from 15 sandstone samples of the He-8 Member in the study area (Table 1). The displacement pressure of the He-8 Member sandstone ranges from 0.33 to 3.58 MPa, with an average of 1.33 MPa. The median pressure shows a wide distribution, varying between 4.88 and 77.53 MPa, averaging 24.44 MPa. The median throat radius ranges from 0.01 to 0.15 μm, averaging 0.08 μm. The relatively high displacement and median pressures indicate an overall small pore-throat radius, while the broad range of median pressures reflects significant variability in throat sizes (Maystrenko et al., 2018; Yin et al., 2020).

Table 1. Statistical results of high-pressure mercury injection parameters for He-8 Member sandstone in the study area.
The throat sorting coefficient ranges from 0.01 to 2.75, averaging 1.69, indicating moderately poor sorting. The variation coefficient ranges from 0.08 to 1.04, with an average of 0.23, suggesting relatively good pore-throat sorting. The maximum mercury injection saturation varies between 30.89% and 93.91%, averaging 73.63%, which indicates moderate pore-throat connectivity. In summary, the He-8 Member sandstone exhibits small to very small pore-throat radii, relatively good sorting, moderate connectivity, and relatively low displacement pressure.
With reference to the classification criteria for pore structure types of lithic fragment reservoirs outlined in the Oil and Gas Reservoir Evaluation Method (SY/T 6285–2011), the characteristics of high-pressure mercury injection parameters were analyzed. Integrating petrophysical properties and based on the features of capillary pressure curves, the pore structures of the He-8 Member sandstone in the study area were classified into four types (Figure 15).
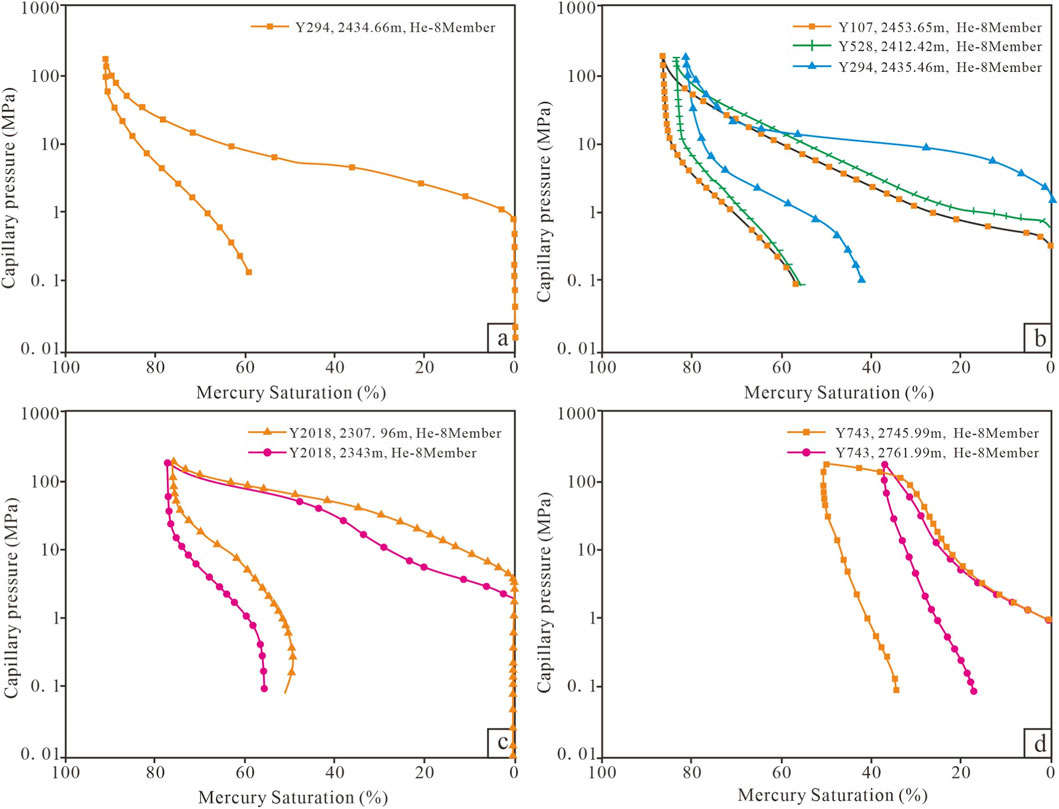
Figure 15. Typical high-pressure mercury-injection curves of sandstone samples from the He-8 Member, study area. Notes: (a) Type I reservoir; (b) Type II reservoir; (c) Type III reservoir; (d) Type IV reservoir.
4.3.3.2.1 Type I: Low displacement pressure – fine throat type
This type of curve generally exhibits a displacement pressure ranging from 0.01 to 1.74 MPa, with an average of 0.52 MPa. The median pressure varies between 0.33 and 21.21 MPa, averaging 3.08 MPa, while the average throat radius ranges from 0.09 to 11.26 μm, with a mean of 1.73 μm. The skewness coefficient spans from −0.22 to 2.49, averaging 0.94 and indicating coarse skewness. The variation coefficient falls between 0.14 and 0.33, with an average of 0.18. The maximum mercury injection saturation ranges from 83.65% to 99.04%, averaging 92.22%. The capillary pressure curve tends to shift toward the lower left of the diagram and often features a broad horizontal plateau (Figure 15a).
Reservoirs represented by this curve type typically belong to the relatively fine-throat category, though pore size sorting varies significantly. These reservoirs exhibit high porosity, ranging from 2.10% to 9.00% with an average of 6.33%, and generally high permeability, varying between 0.057 × 10⁻³ μm2 and 4.723 × 10⁻³ μm2, with a geometric mean of 0.836 × 10⁻³ μm2. Such curves are commonly observed in quartz sandstones with composite porosity dominated by residual intergranular pores, where dissolution is intense. Residual intergranular pores are more abundant than intergranular dissolution pores or minor lithic/matrix dissolution pores, resulting in a coexistence of large and small pores. The throats are coarse, and connectivity is excellent, classifying these as high-quality reservoirs. Statistical results show that this curve type is relatively rare in the He-8 Member, accounting for approximately 17.86%.
4.3.3.2.2 Type II: (medium displacement pressure – fine throat type)
This type of curve exhibits a displacement pressure ranging from 0.01 to 6.32 MPa, with an average of 0.60 MPa. The median pressure varies between 0.27 and 36.15 MPa, averaging 4.66 MPa, while the average throat radius ranges from 0.02 to 6.66 μm, with a mean of 1.29 μm. The skewness coefficient spans from −0.28 to 2.11, predominantly indicating coarse skewness. The variation coefficient falls between 0.11 and 1.04, averaging 0.30. The maximum mercury injection saturation ranges from 72.90% to 95.80%, with an average of 83.29%. The capillary pressure curve shifts slightly toward the lower left of the diagram and may or may not exhibit a broad horizontal plateau (Figure 15b).
Reservoirs represented by this curve type are primarily characterized by fine throats, though pore sorting remains highly variable. These reservoirs exhibit relatively high porosity, ranging from 1.82% to 11.57% with an average of 6.27%, but permeability is significantly reduced, varying between 0.016 × 10⁻³ μm2 and 4.143 × 10⁻³ μm2, with a geometric mean of 0.688 × 10⁻³ μm2. Such curves are commonly observed in quartz sandstones, lithic quartz sandstones, or lithic sandstones with pore systems dominated by combinations of intergranular dissolution pores–lithic dissolution pores or intergranular dissolution pores–intercrystalline pores. Dissolution is intense, with well-developed intergranular dissolution pores, lithic dissolution pores, and matrix dissolution pores, along with authigenic kaolinite intercrystalline pores of precipitation origin. Connectivity is moderate, classifying these as relatively good reservoirs. Statistical results indicate that this curve type is relatively common in the He-8 Member, accounting for approximately 35.71%.
4.3.3.2.3 Type III: (Medium displacement pressure – fine micropore throat type)
This type of curve exhibits a displacement pressure ranging from 0.02 to 1.82 MPa, with an average of 0.70 MPa. The median pressure varies between 3.26 and 88.72 MPa, averaging 43.96 MPa, while the average throat radius ranges from 0.14 to 0.62 μm, with a mean of 0.34 μm. The skewness coefficient spans from 0.90 to 2.69, indicating fine to coarse skewness. The variation coefficient falls between 0.12 and 0.51, averaging 0.27. The maximum mercury injection saturation ranges from 63.40% to 91.26%, with an average of 78.22%. The capillary pressure curve shows a steep slope without a distinct plateau (Figure 15c).
Sandstones corresponding to this curve type exhibit porosity values ranging from 0.80% to 1.63%, with an average of 1.07%, and permeability values between 0.012 × 10⁻³ μm2 and 1.681 × 10⁻³ μm2, with a geometric mean of 0.257 × 10⁻³ μm2. Such curves are commonly observed in lithic quartz sandstones or lithic sandstones with pore systems dominated by intercrystalline pores or intragranular dissolution pores. The pores are generally small, moderately sorted, and exhibit moderate connectivity. Statistical results indicate that this curve type is frequently encountered in the He-8 Member, accounting for approximately 32.14%.
4.3.3.2.4 Type IV: (High displacement pressure–fine micropore throat type)
This type of curve exhibits a displacement pressure ranging from 0.13 to 7.61 MPa, with an average of 1.53 MPa. The median pressure exceeds 50 MPa, and the average throat radius mostly falls between 0.02 and 0.20 μm, averaging 0.13 μm. The skewness coefficient ranges from −2.08 to 2.23, predominantly fine-skewed, while the variation coefficient spans from 0.08 to 0.80, with an average of 0.32. The capillary pressure curve displays a steep, upward-convex shape (Figure 15d). Sandstones corresponding to this curve type exhibit low porosity, varying from 1.79% to 5.30% with an average of 3.19%, and very low permeability, ranging from 0.003 to 0.131 × 10⁻³ μm2 and a geometric mean of only 0.024 × 10⁻³ μm2. Such sandstone reservoirs typically lack macroscopically visible pores, with porosity dominated by micropores or intercrystalline pores between altered kaolinite. The pore throats are small, and pore connectivity is poor, classifying them as non-effective reservoirs. Statistical results indicate that this curve type is relatively rare in the He-8 Member, accounting for approximately 14.29%.
In summary, the He-8 Member is predominantly characterized by Type II and Type III capillary pressure curves.
5 Discussion
5.1 Influence of lithology on reservoir petrophysical properties
The influence of lithology on the petrophysical properties of the He-8 Member reservoir is significant. Previous studies have conducted some research on the impact of lithology on these properties in the He-8 Member. For instance, Ma et al. (2023) pointed out that lithologies rich in feldspar and debris in a closed system are prone to incomplete dissolution and intense cementation, which are the main causes of reservoir densification. Guo et al. (2023) systematically studied the reservoir characteristics and controlling factors of high-quality reservoirs in the He-8 Member of the Daning-Jixian area, finding that high-quality reservoirs primarily develop in quartz sandstones and medium-to coarse-grained sandstones, as these lithologies exhibit strong compaction resistance and are conducive to property improvement through dissolution. Zhao et al. (2024) found that in reservoirs dominated by quartz lithic sandstones, the content and types of clay minerals (such as illite-smectite mixed layers, illite, and kaolinite) control the strong water sensitivity and other sensitivities of the reservoir, with poorer petropphysical properties correlating to stronger sensitivity.
The reservoir sandstones of the He-8 Member underwater distributary channel in the study area primarily include light green-gray pebbly medium sandstone, light green-gray fine sandstone, light gray-white gas-bearing pebbly coarse sandstone, and gray-green argillaceous siltstone, among other petrological types. Statistical results indicate that grain size significantly influences reservoir petrophysical properties. For pebbly coarse sandstone or coarse sandstone, porosity ranges from 0.89% to 13.52%, with an average of 5.58% (Figure 16aA), while permeability varies between 0.01 × 10⁻³ μm2 and 1.70 × 10⁻³ μm2, averaging 0.06 × 10⁻³ μm2 (Figure 16b). Porosity values are predominantly distributed in the 4%–7% range, and permeability values are mainly concentrated between 0.02 × 10⁻³ μm2 and 0.32 × 10⁻³ μm2.

Figure 16. Statistical relationship between petrophysical properties and grain size of reservoir sandstones in the He-8 Member, study area.
The porosity of medium sandstone reservoirs ranges from 0.32% to 21.4%, with an average of 6.13% (Figure 16c), while permeability varies between 0.009 × 10⁻³ μm2 and 45.9 × 10⁻³ μm2, averaging 0.13 × 10⁻³ μm2 (Figure 16d). Porosity values are predominantly distributed in the 2%–8% range, and permeability values are mainly concentrated between 0.04 × 10⁻³ μm2 and 0.64 × 10⁻³ μm2.
For coarse sandstone reservoirs, porosity ranges from 0.9% to 14.7%, with an average of 7.4% (Figure 16e), and permeability varies between 0.005 × 10⁻³ μm2 and 1.02 × 10⁻³ μm2, averaging 0.03 × 10⁻³ μm2 (Figure 16f). Porosity values are primarily distributed in the 5%–10% range, while permeability values are mainly concentrated between 0.01 × 10⁻³ μm2 and 0.08 × 10⁻³ μm2.
Fine sandstone reservoirs exhibit porosity values ranging from 0.58% to 14.3%, with an average of 4.76% (Figure 16g), and permeability values between 0.004 × 10⁻³ μm2 and 3.40 × 10⁻³ μm2, averaging 0.05 × 10⁻³ μm2 (Figure 16h). Porosity is predominantly distributed in the 1%–7% range, and permeability values are mainly concentrated between 0.005 × 10⁻³ μm2 and 0.32 × 10⁻³ μm2.
Siltstone reservoirs show porosity values ranging from 1.00% to 5.90%, with an average of 3.08% (Figure 16I), and permeability values between 0.0048 × 10⁻³ μm2 and 1.02 × 10⁻³ μm2, averaging 0.03 × 10⁻³ μm2 (Figure 16J). Porosity is primarily distributed in the 1%–4% range, while permeability values are mainly concentrated between 0.01 × 10⁻³ μm2 and 0.08 × 10⁻³ μm2.
Analysis results indicate that coarse and medium sandstone samples exhibit relatively better petrophysical properties, followed by coarse and fine sandstone reservoirs, while siltstone reservoirs show the poorest petrophysical properties (Figure 16).
Based on petrological characteristics and thin-section identification results, the reservoir sandstones of the He-8 Member can be classified into four main types: quartz sandstone, lithic quartz sandstone, high-plasticity lithic sandstone, and calcareous cemented sandstone (Figure 17). Statistical analysis indicates that the quartz sandstone facies accounts for 7.8% of the reservoirs, the lithic quartz sandstone facies for 24.8%, the high-plasticity lithic sandstone facies for 61.7%, and the calcareous cemented sandstone facies for 5.8%.
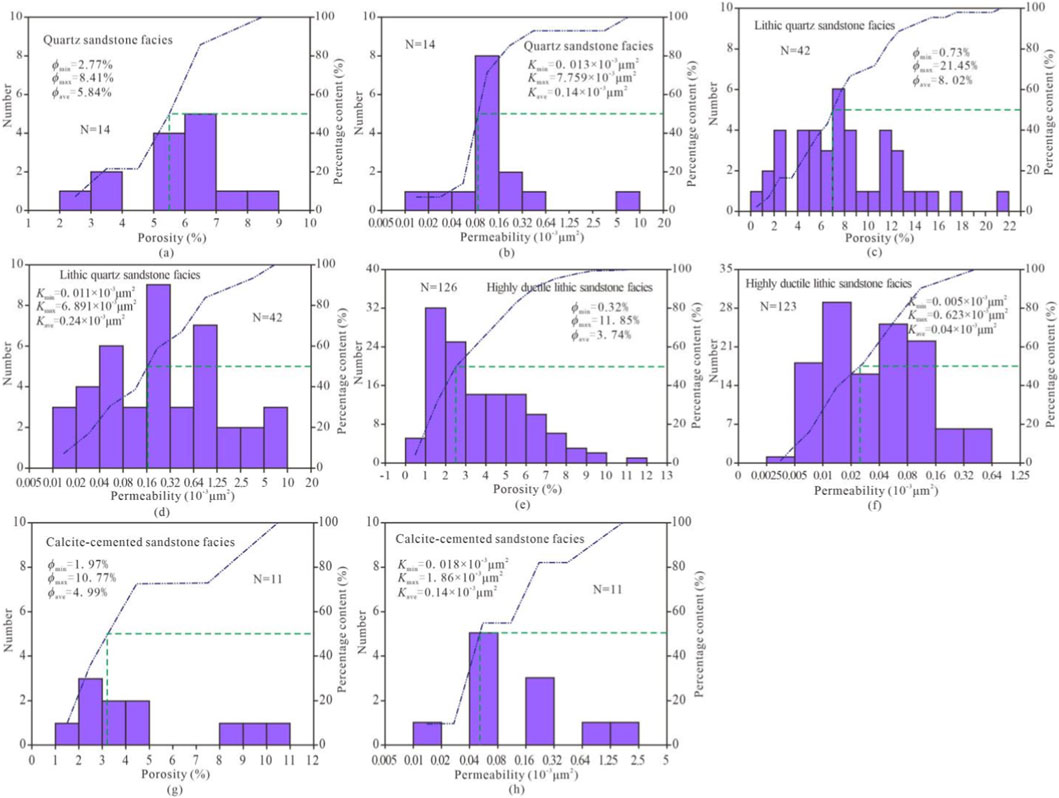
Figure 17. Statistical relationship between sandstone lithofacies and petrophysical properties of the He-8 Member reservoir in the study area. (a) Quartz sandtone facies, porosity; (b) Quartz sandtone facies, permeability; (c) Lithic quartz sandstone facies, porosity; (d) Lithic quartz sandstone facies, permeability; (e) Highly ductile lithic sandstone facies, porosity; (f) Highly ductile lithic sandstone facies, permeability; (g) Calcite-cemented sandstone faces, porosity; (h) Calcite-cemented sandstone faces permeability.
The porosity of the quartz sandstone facies reservoir ranges from 2.77% to 8.41%, with an average of 5.84% (Figure 17a), while its permeability varies between 0.033 × 10⁻³ μm2 and 7.76 × 10⁻³ μm2, averaging 0.14 × 10⁻³ μm2 (Figure 17b). Porosity values are primarily distributed in the 5%–7% range, and permeability values are concentrated between 0.08 × 10⁻³ μm2 and 0.16 × 10⁻³ μm2.
The lithic quartz sandstone facies reservoir exhibits porosity values ranging from 0.73% to 21.45%, with an average of 8.02% (Figure 17c), and permeability values between 0.011 × 10⁻³ μm2 and 6.891 × 10⁻³ μm2, averaging 0.24 × 10⁻³ μm2 (Figure 17d). Porosity is mainly distributed in the 4%–9% range, while permeability is predominantly between 0.04 × 10⁻³ μm2 and 1.25 × 10⁻³ μm2.
For the high-plasticity lithic sandstone facies reservoir, porosity ranges from 0.32% to 11.85%, with an average of 3.74% (Figure 17e), and permeability varies from 0.005 × 10⁻³ μm2 to 0.623 × 10⁻³ μm2, averaging 0.04 × 10⁻³ μm2 (Figure 17f). Porosity values are concentrated in the 1%–6% range, and permeability values are mainly distributed between 0.002 × 10⁻³ μm2 and 0.16 × 10⁻³ μm2.
The calcareous cemented sandstone facies reservoir shows porosity values between 1.97% and 10.77%, averaging 4.99% (Figure 17g), and permeability values ranging from 0.018 × 10⁻³ μm2 to 1.86 × 10⁻³ μm2, with an average of 0.14 × 10⁻³ μm2 (Figure 17h). Porosity is primarily distributed in the 1%–5% range, and permeability values are concentrated between 0.04 × 10⁻³ μm2 and 0.08 × 10⁻³ μm2.
Statistical results of petrophysical properties indicate that the lithic quartz sandstone facies reservoir exhibits the best petrophysical properties, followed by the quartz sandstone facies reservoir, then the lithic sandstone facies reservoir, while the calcareous cemented facies reservoir shows the poorest petrophysical properties (Figure 17).
Overall, the differences in petrophysical properties among the four lithologies are primarily attributed to variations in sedimentary hydrodynamic conditions, diagenetic modifications, and rock composition characteristics.
Sedimentary hydrodynamics establish the foundation for primary porosity. For instance, pebbly coarse sandstone and coarse sandstone predominantly develop in high-energy environments such as the bottom of subaqueous distributary channels. The strong hydrodynamic conditions promote better grain sorting and higher development of primary intergranular pores. Statistical results show that the average porosity of coarse sandstones (5.58%–7.4%) is significantly higher than that of fine sandstone (4.76%) and siltstone (3.08%). Although medium sandstone exhibits relatively high average porosity (6.13%), its permeability varies widely (0.009–45.9 × 10⁻³ μm2), reflecting strong heterogeneity in its sedimentary microfacies.
Regarding diagenetic modifications, the lithic quartz sandstone facies demonstrates the best petrophysical properties (average porosity: 8.02%), benefiting from high quartz content that enhances compaction resistance, while lower plastic lithic content minimizes intense compaction. In contrast, the high-plasticity lithic sandstone facies shows the poorest petrophysical properties (average porosity: 3.74%) due to its abundance of plastic components such as mica and argillaceous materials, which are prone to plastic deformation and pore-filling during diagenesis. Although calcareous cementation reduces porosity in the calcareous cemented sandstone facies (average: 4.99%), partial dissolution of calcite creates secondary pores, resulting in higher permeability (0.14 × 10⁻³ μm2) compared to lithic sandstone.
In terms of rock composition controls, the quartz sandstone facies (average porosity: 5.84%) exhibits reduced pore space due to early siliceous cementation, despite its high quartz content. In contrast, the lithic quartz sandstone facies achieves an optimal balance between rigid grain support and moderate dissolution, preserving both primary intergranular pores and secondary dissolution pores. Siltstone, subjected to intense compaction and clay mineral filling, exhibits the poorest petrophysical properties.
The coupling of these geological processes ultimately leads to systematic differences in petrophysical properties among the four lithologies, with rock composition playing a decisive role in controlling reservoir quality by influencing diagenetic pathways.
5.2 Influence of diagenetic facies on reservoir petrophysical properties
The petrophysical property of the He-8 Member are significantly influenced by diagenesis facies. For example, Xu et al. (2012) conducted a systematic study on the diagenetic facies of the He-8 Member in the southern Sulige Gas Field, classifying them into four types: relatively high-permeability coarse-grained weak compaction-dissolution facies, low-porosity and low-permeability medium-to-coarse-grained dissolution-cementation facies, low-porosity and low-permeability medium-to-fine-grained cementation facies, and ultra-low-porosity and low-permeability fine-grained argillaceous dense compaction facies. Sheng et al. (2015) pointed out that in the southern Sulige Gas Field, the average contribution rate of intercrystalline pores from cements to the reservoir space of the He-8 Member is 36.31%. Ma et al. (2023) discovered the diagenetic retention phenomenon in feldspar-rich sandstones of the He-8 Member, indicating that they also possess certain natural gas exploration potential. The above research provides an important foundation for understanding diagenetic facies.
Previous restoration of the burial history in the eastern Ordos Basin indicates that the Shihezi Formation underwent an initial phase of rapid deep burial followed by a later phase of slow uplift (Figure 18). During the Middle Permian Shihezi Period, the entire Ordos Basin evolved into an inland lacustrine basin. Influenced by the closure of the Xingmeng Trough and the significant uplift of the Yimeng Uplift, the basin experienced intense differential north-south subsidence and uplift, which accentuated the tectonic framework of a northern uplift and southern depression. The strong sediment supply from the northern part of the basin, coupled with rapid subsidence in the south, led to the rapid deposition of the Shihezi Formation. Burial history reconstruction reveals that the Shihezi Formation underwent rapid subsidence within 20–40 Ma after its deposition, reaching a maximum burial depth of approximately 3,000 m and paleo-temperatures of 120 °C–150 °C during the Early Cretaceous (Wang, 2016; Du et al., 2025). From the latest Jurassic to the Early Cretaceous, influenced by the Indosinian Movement, the Shihezi Formation experienced slow and minor uplift (Figure 18). This thermal regime not only promoted the large-scale release of organic acids but also provided favorable conditions for the development of subsequent dissolution processes, facilitating the formation of weakly compacted-dissolved facies sandstones.
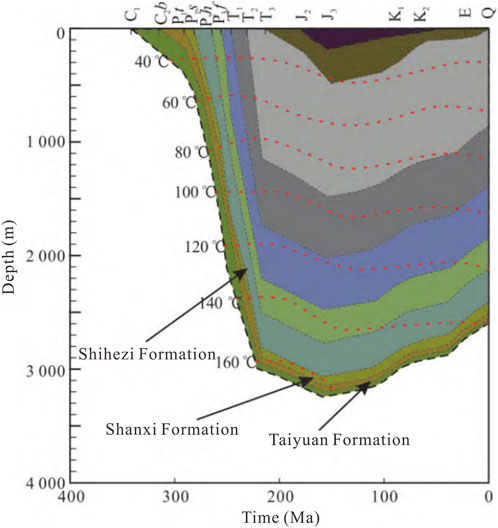
Figure 18. Burial-thermal history curve of the Upper Paleozoic strata in Well Y207 (Wang, 2016; Du et al., 2025).
The sandstone reservoirs of the He-8 Member in the study area have undergone significant diagenetic alteration, with three primary diagenetic processes being mechanical compaction, dissolution, and cementation. However, the quartz sandstone facies, lithic quartz sandstone facies, high-plasticity lithic sandstone facies, and calcareous cemented sandstone facies experienced notably different degrees and types of diagenetic modification. Their diagenetic evolutionary pathways vary considerably, resulting in distinct impacts on reservoir petrophysical properties (Figures 19, 20).

Figure 19. Lithofacies types and microscopic characteristics of reservoir sandstones in the He-8 Member, study area. (A) Well Y327, 2514.33m∼2514.43m; (B) Well Y327, 2504.24m∼2504.34m; (C) Well Y2065, 2245.09m∼2245.30m; (D) Well Y2064, 2437.00m∼2437.12m; (E) Well Y2064m, 2440.94m∼2441.04m; (F) Well Y2065, 2243.83m∼2244.04m; (G) Well Y2065, 2242.95m∼2242.19m; (H) Well Y1827, 2285.07m∼2285.24m.
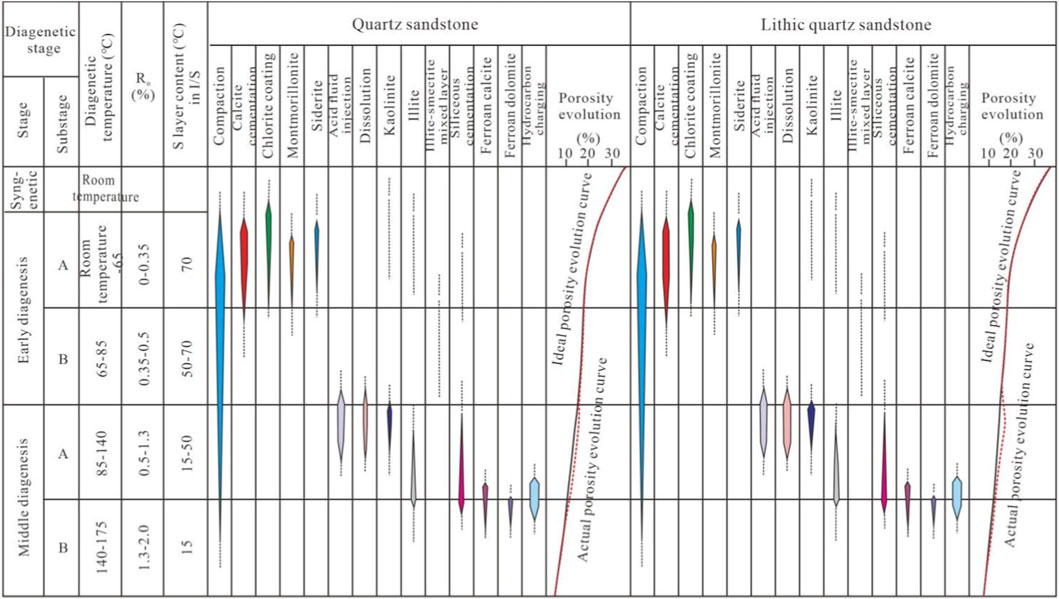
Figure 20. Diagenetic-stage classification for quartz-sandstone and lithic-quartz-sandstone facies of the He-8 Member, study area.
5.2.1 Quartz sandstone facies
The quartz sandstone in the study area is characterized by high quartz content (average 90.6%) and low lithic fragment content (average 8.0%). The lithic fragments are primarily composed of metamorphic quartz fragments with minor volcanic rock fragments and very limited feldspar grains (average 1.4%). Compaction in the quartz sandstone is mainly manifested through grain rearrangement, leading to tight contacts between rigid particles and even pressure dissolution. Quartz grains predominantly exhibit point-line contacts, with local concave-convex and sutured contacts, indicating relatively intense compaction (Figures 19A,B). Under the compression of rigid grains, volcanic rock fragments show plastic deformation. Compaction and pressure dissolution significantly reduce primary porosity in the reservoir, which is a key factor contributing to the deterioration of petrophysical properties. During the early diagenetic stage A (burial depth less than 800 m), minor calcite cement (1%–8%, average 3.3%) is observed filling intergranular pores, along with thin chlorite clay coatings enveloping lithic fragments (0.5%–3%, average 1.3%).
By early diagenetic stage B (burial depth between 800 m and 1,200 m), thermal evolution of source rocks released organic acids into the pore fluids. These acidic fluids caused selective dissolution of volcanic lithic fragments and feldspar grains, which effectively improved the petrophysical properties to some extent (Figure 20). The dissolution process formed a pore system in the study area dominated by intergranular pores, along with a combination of intergranular and dissolution pores. Concurrently, minor amounts of cements such as kaolinite (0%–5%, average 2.7%), illite (0%–2.5%, average 1.2%), and authigenic quartz (0.5%–2.3%, average 1.5%) precipitated and filled intergranular pores.
During middle diagenetic stage A (burial depth between 1,200 m and 2,400 m), as dissolution continued, the acidic fluids gradually transitioned to weakly alkaline–alkaline conditions. In this alkaline diagenetic environment, quartz overgrowth became extensively developed (2%–5.5%, average 3.5%), and clay mineral transformations began to occur, such as the illitization of kaolinite and chlorite (Figure 20). During this period, the temperature and timing of dissolution were strongly supported by fluid inclusion evidence. For example, Guo (2018), in the study of the He-8 Member, demonstrated that the homogenization temperatures of fluid inclusions in quartz overgrowths are primarily distributed between 110 °C and 140 °C. This range generally corresponds to the middle diagenetic stage A period established in our study, providing independent thermodynamic evidence for the timing of dissolution.
By middle diagenetic stage B (burial depth between 2,400 m and 3,000 m), increasing burial depth raised the formation temperature to approximately 160 °C. In the alkaline diagenetic environment, mechanical compaction further progressed, leading to additional densification of the sandstone and a reduction in intergranular porosity. Simultaneously, ferrocalcite (0%–2.5%, average 1.5%) and ankerite (0%–1.5%, average 0.5%) precipitated and filled intergranular pores. The origin of late-stage carbonate cements is further supported by stable isotopic evidence. For instance, research by Song (2021) on the He-8 Member revealed that the δ13C values of late-stage ferrocalcite and ankerite are notably negative (ranging from −8‰ to −4‰ V-PDB), and their δ18O values are also more negative (ranging from −16‰ to −13‰ V-PDB). These findings are entirely consistent with our observation that late-stage carbonate cements precipitated at higher temperatures (approximately 160 °C), reflecting the involvement of products derived from organic matter thermal evolution. With sufficient silica sources, quartz overgrowth continued to develop. During this stage, clay minerals were primarily represented by late-stage chlorite filling intergranular pores and illite, which mainly originated from authigenic cementation from pore fluids and the transformation of other clay minerals. By this point, the fundamental characteristics of the quartz sandstone facies reservoir were largely established (Figure 20).
Overall, this lithofacies reservoir is dominated by rigid quartz grains, and mechanical compaction is the primary factor leading to the deterioration of petrophysical properties. Improvement in petrophysical properties is mainly attributed to the dissolution of minor volcanic lithic fragments. Cementation plays a secondary role in the reduction of petrophysical properties. It should be emphasized that organic acid dissolution during the middle diagenetic stage and late-stage alkaline cementation have extremely significant impacts on reservoir physical properties in the He-8 Member (Song, 2021).
5.2.2 Lithic quartz sandstone facies
The lithic quartz sandstone in the study area has a quartz content ranging from 73.5% to 87.4% (average 80.2%) and a lithic fragment content between 11.1% and 24.3% (average 17.7%). Similar to the quartz sandstone facies reservoir, the lithic quartz sandstone facies also experienced intense mechanical compaction. Due to its relatively higher volcanic lithic fragment content, plastic deformation of these fragments is more pronounced (Figures 19C,D). Under the compression of rigid grains, volcanic lithic fragments exhibit strong plastic deformation, even forming pseudomatrix that fills intergranular pores (Figures 19C,D). During the early diagenetic stage, minor calcite cement (1%–7%, average 3.3%) is observed filling intergranular pores, along with thin chlorite clay coatings enveloping lithic fragments (0.5%–3.2%, average 1.5%).
By early diagenetic stage B, thermal evolution of source rocks released organic acids into the pore fluids. These acidic fluids caused selective dissolution of volcanic lithic fragments and feldspar grains. The higher volcanic lithic fragment content in the lithic quartz sandstone facies reservoir results in greater dissolution porosity compared to the quartz sandstone facies. The dissolution process formed a pore system in the study area dominated by intragranular dissolution pores, along with a combination of intragranular and intergranular dissolution pores (Figure 20). Concurrently, minor amounts of cements such as kaolinite (0%–7%, average 3.7%), illite (0%–2.8%, average 1.5%), and authigenic quartz (0.5%–2.0%, average 1.2%) precipitated and filled intergranular pores (Figure 18). This intense dissolution is consistent with the geochemical findings of Song (2021). In the study of the He-8 Member, Song (2021) observed that the lithic quartz sandstone facies, due to its abundance of volcanic rock fragments, exhibits significantly higher dissolution porosity than the quartz sandstone facies, which aligns with the dissolution pore characteristics we observed.
During middle diagenetic stage A, as dissolution continued, the acidic fluids gradually transitioned to weakly alkaline–alkaline conditions. In this alkaline diagenetic environment, quartz overgrowth began to develop (1%–6%, average 2.5%). However, the growth of quartz overgrowths was significantly inhibited by the deformation of volcanic lithic fragments. Clay mineral activity became more prominent, including the illitization of kaolinite and chlorite, which began to develop during this stage (Figure 20).
By middle diagenetic stage B, increasing burial depth raised the formation temperature to approximately 160 °C. In the alkaline diagenetic environment, mechanical compaction further progressed, leading to additional densification of the sandstone and a reduction in intergranular porosity. Simultaneously, late-stage ferrocalcite (0%–2.5%, average 1.5%) and ankerite (0%–1.5%, average 0.5%) precipitated and filled intergranular pores. Quartz overgrowth continued to develop. During this stage, clay minerals were primarily represented by late-stage chlorite filling intergranular pores and illite, which mainly originated from authigenic cementation from pore fluids and the transformation of other clay minerals. By this point, the fundamental characteristics of the lithic quartz sandstone facies reservoir were largely established (Figure 20).
5.2.3 High-plasticity lithic sandstone facies
The high-plasticity lithic sandstone facies reservoir in the study area exhibits a quartz content ranging from 32.9% to 74.4% (average 57.6%), and a lithic fragment content between 25.6% and 63.8% (average 41.5%), with very rare feldspar grains occasionally observed (Figures 19E,F). During the early diagenetic stage, this sandstone developed a certain amount of calcite cement (0%–8%, average 2.1%) and chlorite cement (1%–7%, average 2.7%). Compared to other lithofacies reservoirs, it shows slightly lower early calcite cementation but relatively higher chlorite cementation.
Effective mechanical compaction occurred in the late phase of early diagenetic stage A. Under the load of overlying strata, unconsolidated sediments were progressively compacted, expelling pore water and sharply reducing porosity. At this stage, intergranular pores dominated, and with increasing compaction, plastic volcanic lithic fragments began to deform.
By early diagenetic stage B, thermal evolution of source rocks released organic acids into the pore fluids. These acidic fluids caused selective dissolution of volcanic lithic fragments and feldspar grains. The dissolution process formed a pore system in the study area dominated by intragranular dissolution pores, along with a combination of intragranular and intergranular dissolution pores (Figure 21). Concurrently, minor amounts of cements such as kaolinite (0%–5%, average 2.7%), illite (0%–2.8%, average 1.5%), and authigenic quartz (0.5%–2.0%, average 1.2%) precipitated and filled intergranular pores.
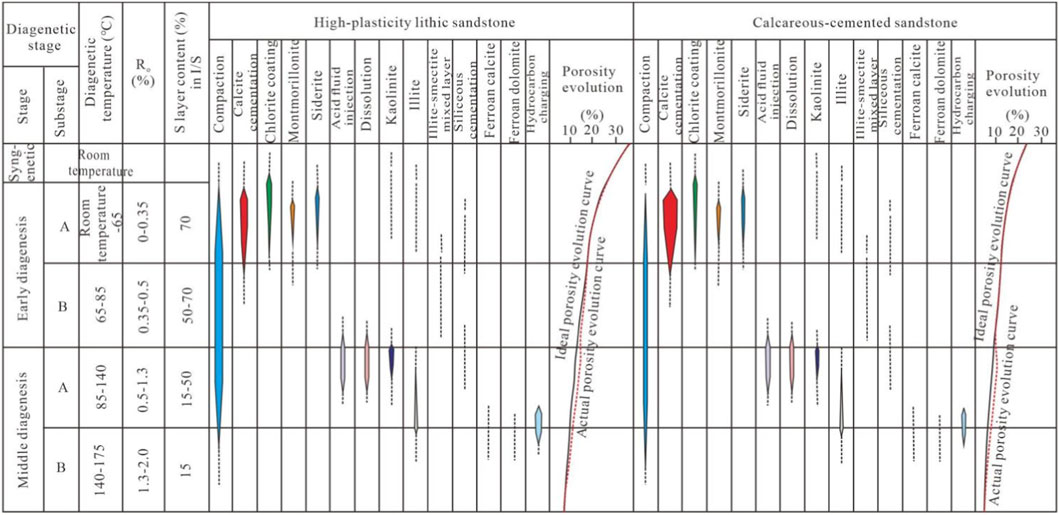
Figure 21. Diagenetic-stage classification for high-plasticity lithic-sandstone and calcareous-cemented-sandstone facies of the He-8 Member, study area.
During middle diagenetic stage A, as dissolution continued, the acidic fluids gradually transitioned to weakly alkaline–alkaline conditions. Mechanical compaction at this stage caused intense deformation of plastic lithic fragments, further reducing intergranular porosity (Figure 21). With extensive development of plastic deformation of lithic fragments, minor quartz overgrowths and authigenic clay mineral cements formed.
By middle diagenetic stage B, increasing burial depth intensified mechanical compaction, leading to further densification of the sandstone and additional reduction of intergranular and early dissolution pores. The reservoir had already entered a relatively dense state by the early middle diagenetic stage. During this period, quartz overgrowths and authigenic clay mineral cementation were suppressed due to the plastic deformation of volcanic lithic fragments (Figure 21).
5.2.4 Calcareous cemented sandstone facies
This lithofacies is primarily composed of intensely calcite-cemented lithic sandstone and lithic quartz sandstone. Before undergoing significant compaction during the early diagenetic stage, the lithic fragment sandstone was strongly cemented by calcite, which mainly occurs as fine nodular or intergranular crystalline fillings occupying pore spaces (Figures 19G,H). The calcite cement content typically ranges from 10% to 30%, substantially reducing the original porosity of the sandstone reservoir. On the other hand, extensive early calcite cementation also inhibited the formation of other early diagenetic cements such as chlorite and montmorillonite.
By the early diagenetic stage B to the initial middle diagenetic stage A, acidic pore fluids triggered selective dissolution of volcanic lithic fragments and feldspar grains, forming intragranular dissolution pores (Figure 21). Simultaneously, these acidic fluids partially dissolved early carbonate cements, generating intergranular dissolution pores. Stable isotopic evidence from Song (2021) shows that the early calcite cements in the He-8 Member have δ13C values ranging from −2‰ to +2‰ V-PDB and δ18O values from −12‰ to −9‰ V-PDB, indicating formation in a marine-sourced fluid environment. This aligns with our observation that early carbonate cements were extensively developed prior to compaction. This resulted in a pore system comprising a small amount of residual intergranular pores, intragranular dissolution pores, and intergranular dissolution pores (Figure 21).
During the middle diagenetic stage B, mechanical compaction continued, leading to further densification of the sandstone.
5.3 Influence of diagenetic evolution on reservoir petrophysical properties
5.3.1 Compaction
Compaction continuously occurs during the burial process of reservoir sandstones (Gross et al., 1995; Farrokhrouz et al., 2014; Han et al., 2015). As the burial depth increases, the overlying sedimentary load causes unconsolidated sediments to undergo progressive compaction, expelling pore water and reducing porosity. Microscopic observations reveal that the four lithofacies types of reservoir sandstones each exhibit distinct characteristic features.
1. Quartz sandstone: In the study area, quartz sandstone is characterized by high quartz content (average 90.6%) and low lithic fragment content (average 8.0%). The lithic fragments primarily consist of metamorphic quartz fragments with minor volcanic rock fragments and very limited feldspar grains. Compaction in quartz sandstone is mainly manifested through grain rearrangement under pressure, leading to tight contacts between rigid particles and even pressure dissolution. Quartz grains predominantly exhibit point-line contacts, with local concave-convex and sutured contacts, indicating relatively intense compaction. Under the compression of rigid grains, volcanic rock fragments show plastic deformation. Compaction and pressure dissolution significantly reduce primary porosity in the reservoir, which is a key factor contributing to the deterioration of petrophysical properties (Figures 22A,B).
2. Lithic quartz sandstone: In the study area, the quartz content of lithic quartz sandstone ranges from 73.5% to 87.4%, with an average of 80.2%. The lithic fragment content varies between 11.1% and 24.4%, averaging 17.7%. Lithic fragments are primarily composed of metamorphic quartz fragments with minor volcanic rock fragments, the latter generally accounting for less than 13%. Under mechanical compaction, rigid quartz and metamorphic chert grains exhibit point-line to concave-convex contacts, while volcanic rock fragments undergo significant plastic deformation. Mica fragments show bending and other deformational features (Figures 22C,D).
3. High-plasticity lithic sandstone: In the study area, the quartz content of high-plasticity lithic sandstone ranges from 32.9% to 74.4%, with an average of 57.6%. The lithic fragment content varies between 25.6% and 63.8%, averaging 41.5%. Due to mechanical compaction, volcanic rock fragments undergo intense plastic deformation, exhibiting extensive compression and forming pseudomatrix (Figures 22E,F).
4. Calcareous cemented sandstone: This type is primarily observed in high-plasticity lithic sandstone, with calcareous cement content typically ranging from 10% to 20%, averaging about 12.3%. The calcareous cement occurs as a basal cement, formed before the lithic fragment sandstone grains underwent significant compaction (Figures 22G,H). High calcareous cement content results in densification of the lithic sandstone, effectively enhancing its resistance to mechanical compaction.

Figure 22. Microscopic structure photomicrographs of the He-8 Member in the study area (A) Well Y2065, 2234.72–2234.95 m: Quartz sandstone facies reservoir, showing tightly packed rigid grains; (B) Well Y327, Sample: 2514.33 m: Quartz sandstone, exhibiting point-line to concave-convex grain contacts; (C) Well Y168, 2412.45 m: Lithic quartz sandstone, with intensely deformed lithic fragments; (D) Well Y271, 2324.88 m: Lithic quartz sandstone, showing compressed and deformed lithic fragments; (E) Well Y2064, 2317.83 m: High-plasticity lithic sandstone facies, with strongly plastically deformed volcanic fragments; (F) Well Y2064, 2329.83 m: High-plasticity lithic sandstone facies, exhibiting intensely deformed volcanic fragments; (G) Well Y2065, 2244.42–2244.56 m: Calcareous cemented sandstone, with early-stage strong calcareous cementation; (H) Well Y215, 2346.53 m: Calcareous cemented sandstone, featuring early calcite exhibiting basal cementation.
Moreover, it should be noted that the content of ductile grains is also a major factor influencing reservoir characteristics. Higher ductile grain content leads to increased compaction rates, reduced residual intergranular porosity, and lower permeability and porosity. When the volcanic lithic fragment content is less than approximately 15%, selective dissolution occurs, which positively contributes to petrophysical properties. In contrast, when the ductile component content exceeds about 15%, reservoir petrophysical properties show a significant declining trend (Figure 23).
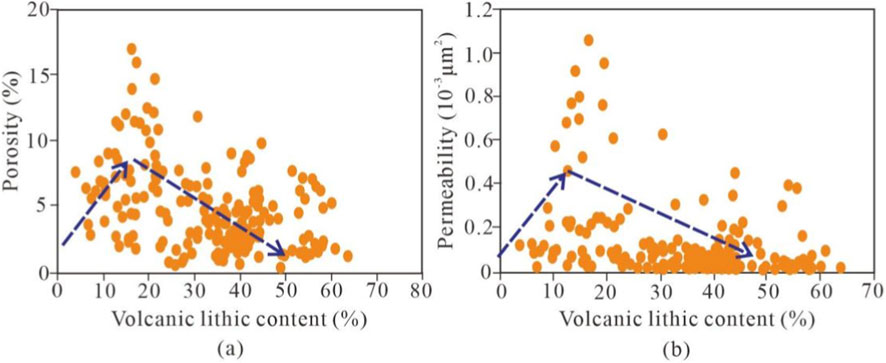
Figure 23. Relationship between ductile-grain content and reservoir petrophysical properties in the He-8 Member, study area. (a) Porosity and volcanic lithic content; (b) Permeability and volcanic lithic content.
5.3.2 Cementation
Cementation is well-developed in the study area and represents one of the key factors responsible for the destruction of primary porosity. The main types of cementation observed include carbonate cementation, clay mineral cementation, and siliceous cementation.
5.3.2.1 Carbonate cementation
Carbonate cements in the He-8 Member reservoir sandstones in the study area primarily consist of calcite, dolomite, and minor siderite. According to statistical data, the carbonate cement content in calcareous cemented sandstone facies reservoirs typically ranges from 10% to 20%, with an average of 12.3%. In high-plasticity lithic sandstone facies reservoirs, the content ranges from 0% to 8%, averaging 0.93%. For lithic quartz sandstone facies reservoirs, the content varies between 0% and 7%, with an average of 2.39%, while in quartz sandstone facies reservoirs, it generally falls between 0% and 8%, averaging 1.75%. Statistical results indicate that carbonate cementation is more developed in lithic sandstone and lithic quartz sandstone facies.
Analysis of measured petrophysical properties from reservoir sandstone samples reveals a negative correlation between carbonate cement content and reservoir petrophysical quality: higher cement content corresponds to poorer reservoir properties. Sandstones with carbonate cement content exceeding 15% typically exhibit porosity less than 4% and permeability below 0.01 × 10⁻³ μm2, transitioning into tight or non-reservoir rocks (Figure 24).
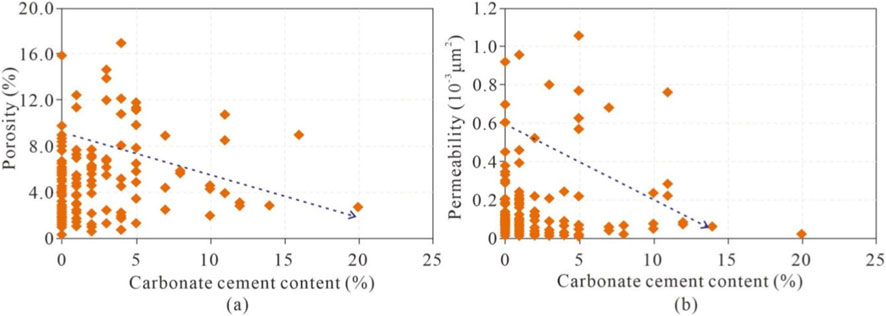
Figure 24. (a) Porosity and carbonate cement content; (b) Permeability and carbonate cement content.
5.3.2.2 Clay mineral cementation
Authigenic chlorite in the He-8 Member reservoir of this area predominantly occurs as grain coatings or pore linings in sandstones. These chlorite films or coatings partially inhibit quartz cementation. Kaolinite typically exhibits pseudo-hexagonal crystal plates, with aggregates appearing in book-like or vermicular forms, filling pores, replacing other minerals, or occurring as inclusions within other authigenic minerals (Talling et al., 2013; Talling, 2014; Yin and Wu, 2020). Illite occurs as irregular flakes, curved sheets, or fibrous filaments coating grain surfaces or filling pores and fractures; illite bridging can be observed in residual intergranular pores.
Among the authigenic clay mineral cements, chlorite coatings primarily formed during the early diagenetic stage, enveloping lithic fragments before significant compaction occurred. Their development effectively resists mechanical compaction and suppresses silica cementation, thereby playing a constructive role in preserving intergranular porosity. Cast thin section observations indicate that the chlorite coating content in the He-8 Member reservoir ranges between 1% and 7%, contributing positively to the petrophysical properties (Figure 25).
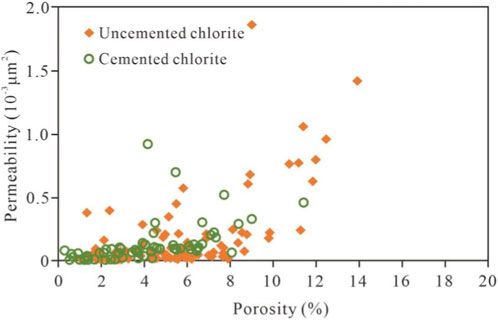
Figure 25. Relationship between chlorite cementation and petrophysical properties in He-8 Member reservoir sandstones.
5.3.2.3 Siliceous cementation
Silica cementation in the study area primarily occurs in the form of secondary overgrowths and euhedral crystals filling pores. While quartz overgrowths and pore-filling cements reduce primary porosity and degrade sandstone petrophysical properties, the overall silica cement content in the He-8 Member is relatively low. Statistical results indicate that silica cementation is more abundant in quartz sandstone and lithic quartz sandstone facies reservoirs, with average contents of approximately 3.06% and 1.51%, respectively.
On one hand, quartz sandstone and lithic quartz sandstone facies reservoirs possess abundant silica sources, such as the dissolution of volcanic rock fragments and pressure dissolution of quartz grains (Figure 26). On the other hand, in high-plasticity volcanic lithic sandstone facies, effective compaction-induced plastic deformation significantly inhibits the development of quartz overgrowths (Figure 27).
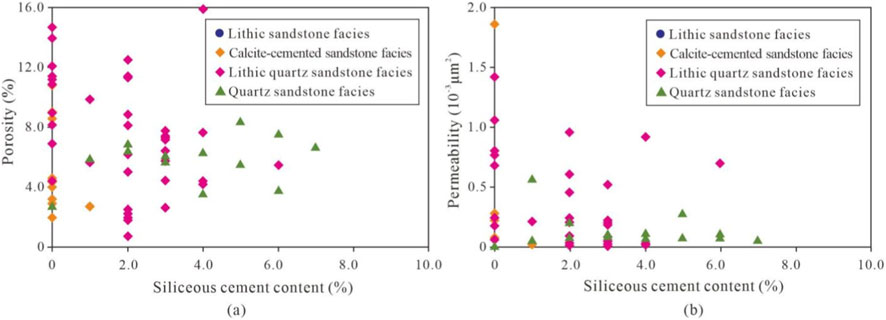
Figure 26. Relationship between siliceous cement content and porosity/permeability in the He-8 Member reservoir, study area. (a) Porosity and sliceous cement content; (b) Permeability and sliceous cement content.
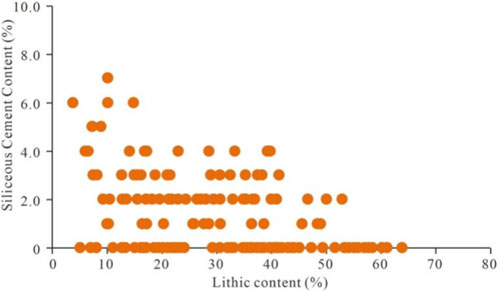
Figure 27. Relationship between siliceous-cement content and lithic-fragment content in the He-8 Member reservoir, study area.
5.3.3 Dissolution
Dissolution refers to a physicochemical process occurring during the diagenesis of lithic fragments, triggered by changes in the diagenetic environment, and typically manifests as corrosion and dissolution (Zhou et al., 2006; Shanmugam, 2013; Xie and Heller, 2013). During the early diagenetic stage, meteoric water leaching promotes dissolution. As burial depth increases, higher temperature and pressure conditions cause organic acids associated with thermal maturation of organic matter to integrate into pore fluids. Observations from thin sections, cast thin sections, and scanning electron microscopy (SEM) indicate that dissolution is widely developed in the study area, with relatively intense corrosion effects. Carbonate cements are the first to undergo dissolution, followed by unstable components such as feldspar and lithic fragments. Dissolution is a primary mechanism for generating secondary porosity, with lithic fragments, cements, and matrix components being most susceptible to dissolution and subsequent formation of secondary pores. Selective dissolution also contributes significantly to the heterogeneous distribution of porosity.
Statistical results indicate that intragranular dissolution pores within lithic fragments represent the dominant pore type in the He-8 Member reservoir. These pores primarily formed through selective dissolution of volcanic rock fragments, accounting for approximately 10%–47% of total porosity, with an average of about 22.9% (Figure 28a). The surface dissolution porosity rate of lithic fragments ranges from 0.45% to 2.05%, with an average of approximately 0.88%, significantly enhancing the reservoir petrophysical properties (Figure 28b).
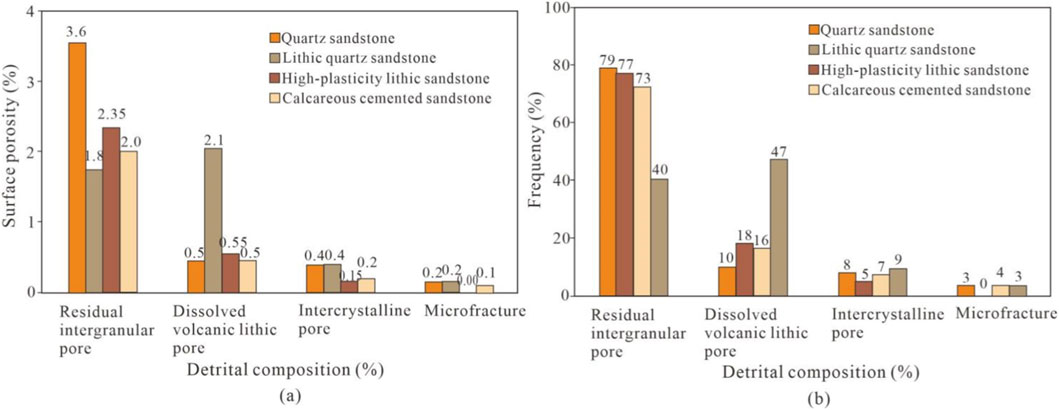
Figure 28. Statistical distribution of (a) surface porosity and (b) pore types for different lithofacies in the He-8 Member reservoir, study area.
6 Conclusion
1. The He-8 Member in the Yanchuan East area was deposited in a braided-river delta setting. Reservoir lithologies are mainly quartz sandstone, lithic quartz sandstone, high-plasticity lithic sandstone and calcareous-cemented sandstone.
2. Pore types include residual intergranular pores, dissolution pores (feldspar and lithic), intercrystalline pores and micro-fractures; among these, intragranular dissolution pores within volcanic lithics are the most abundant. Net-confined porosity ranges from 0.5% to 15.0% (mean 6.7%), and net-confined permeability from 0.001 × 10⁻³μm2 to 5.577 × 10⁻³μm2 (mean 0.053 × 10⁻³μm2), classifying the interval as an ultra-low-porosity, tight reservoir.
3. Mercury-injection curves and parameters allow the He-8 Member to be subdivided into four reservoir classes, with Type II and Type III curves dominating.
4. Reservoir quality is demonstrably controlled by lithology, diagenetic facies and the diagenetic history. Coarse and medium sandstones exhibit the best properties, followed by fine sandstones; siltstones are poorest. Among diagenetic facies, lithic quartz sandstone displays the highest porosity and permeability, followed by quartz sandstone, lithic sandstone and, lastly, calcareous-cemented sandstone.
5. A diagenetic-stage scheme tailored to each lithology has been established and the diagenetic evolution reconstructed. Rapid early burial subjected the He-8 Member to intense compaction already during the early-diagenetic A1 substage, laying the petrophysical foundation for subsequent tightness. Secondary pores were generated principally by dissolution in the middle-diagenetic A2 substage—the key interval for reservoir-space creation. Entry into the middle-diagenetic B substage saw widespread authigenic precipitation that occluded remaining intergranular and dissolution pores, further tightening the sandstone.
Data availability statement
The original contributions presented in the study are included in the article/supplementary material, further inquiries can be directed to the corresponding author.
Author contributions
YG: Conceptualization, Investigation, Methodology, Writing – original draft, Writing – review and editing. SY: Methodology, Writing – original draft, Writing – review and editing. HG: Formal Analysis, Investigation, Writing – original draft. ZJ: Formal Analysis, Investigation, Writing – original draft.
Funding
The authors declare that financial support was received for the research and/or publication of this article. This research is financially supported by the National Natural Science Foundation of China (Grant No. 42102128).
Conflict of interest
The authors declare that the research was conducted in the absence of any commercial or financial relationships that could be construed as a potential conflict of interest.
Generative AI statement
The authors declare that no Generative AI was used in the creation of this manuscript.
Any alternative text (alt text) provided alongside figures in this article has been generated by Frontiers with the support of artificial intelligence and reasonable efforts have been made to ensure accuracy, including review by the authors wherever possible. If you identify any issues, please contact us.
Publisher’s note
All claims expressed in this article are solely those of the authors and do not necessarily represent those of their affiliated organizations, or those of the publisher, the editors and the reviewers. Any product that may be evaluated in this article, or claim that may be made by its manufacturer, is not guaranteed or endorsed by the publisher.
References
Baas, J. H., Best, J. L., and Peakall, J. (2012). “2011. Depositional processes, bedform development and hybrid bed formation in rapidly decelerated cohesive (mud-sand) sediment flows,” 58, 1953–1987.
Cao, B. D. (2012). “Controlling factors of gas accumulation in the yuxi gas field in western Shanxi fold belt in Ordos Basin,” in Changan University (in Chinese with English abstract).
Chen, Y., Wang, Y., Guo, M., Wu, H., Li, J., Wu, W., et al. (2020). Differential enrichment mechanism of organic matters in the marine-continental transitional shale in northeastern Ordos Basin, China: control of sedimentary environments. J. Nat. Gas Sci. Eng. 83, 103625. doi:10.1016/j.jngse.2020.103625
Cheng, J. H., Li, R. X., Qin, X., Li, D., and Zhao, B. (2016). Impact of diagenetic facies on mechanical properties of sandstone rock in low-permeability reservoirs: a case study of the Upper Paleozoic has reservoir in east Ordos Basin. Acta Pet. Sin. 37 (10), 1256–1262. doi:10.7623/syxb201610005
Cook, J. E., Goodwin, L. B., Boutt, D. F., and Tobin, H. J. (2015). The effect of systematic diagenetic changes on the mechanical behavior of a quartz-cemented sandstone. Geophysics 80 (2), D145–D160. doi:10.1190/geo2014-0026.1
Cundall, P. A., and Hart, R. D. (1985). Development of generalized 2-D and 3-D distinct element programs for modeling jointed rock. Miscellaneous Paper SL. Itasca Consult. Group, U. S. Army Corps Eng.
Ding, X. Q., Yang, P., Han, M. M., Chen, Y., Zhang, S. Y., Zhang, S. N., et al. (2016). Characteristics of gas accumulation in a less efficient tight-gas reservoir, He 8 interval, Sulige gas field, Ordos Basin, China. Russ. Geol. Geophys. 57, 1064–1077. doi:10.1016/j.rgg.2016.06.006
Du, G., Liu, J., Guo, R., Li, Y., Yin, H., Huang, X., et al. (2025). The development characteristics and influencing factors of high-quality reservoirs in the 8th member of Shihezi Formation in the eastern Ordos Basin. Nat. Gas. Geosci. 36 (2), 271–283. doi:10.11764/j.issn.1672-1926.2024.08.007
Eltom, H. A., Abdullatif, O. M., Babalola, L. O., Bashari, M. A., Yassin, M., Osman, M. S., et al. (2016). Integration of facies architecture, ooid granulometry and morphology for prediction of reservoir quality, Lower Triassic Khuff Formation, Saudi Arabia. Pet. Geosci. 23 (2), 177–189. doi:10.1144/petgeo2015-071
Farrell, N. J. C., Healy, D., and Taylor, C. W. (2014). Anisotropy of permeability in faulted porous sandstones. J. Struct. Geol. 63, 50–67. doi:10.1016/j.jsg.2014.02.008
Farrokhrouz, M., Aset, M. R., and Kharrat, R. (2014). Empirical estimation of uniaxial compressive strength of shale formations. Geophysics 79 (4), D227–D233. doi:10.1190/geo2013-0315.1
Gross, M. R., Fischer, M. P., Engelder, T., and Greenfield, R. J. (1995). Factors controlling joint spacing in interbedded sedimentary rocks: integrating numerical models with field observations from the Monterey formation, USA. Geol. Soc. Spec. Publ. 92, 215–233. doi:10.1144/gsl.error!.1995.092.01.12
Guo, Y. (2018). “Study on characteristics of fluid inclusions and hydrocarbon accumulation periods in the upper Paleozoic He 8 member,” in Eastern ordos Basin. Master's Thesis: Southwest Petroleum University, 10–20.
Guo, Q., Er, C., Zhao, J., Teng, Y., Tan, S., and Shen, C. (2023). Reservoir characteristics and high-quality reservoir control factors of He 8 member in Daning-Jixian area of ordos Basin. Special Oil and Gas Reservoirs 30 (3), 19–28.
Guo, L., Guo, S., Ding, C., and Ma, Z. (2025). Relationship between sandstone reservoir tightening and gas accumulation of Shan-2 Member in Shanxi Formation of Yan'an gas field in Ordos Basin. Petroleum Geol. and Oilfield Dev. Daqing 44 (3), 22–31. doi:10.19597/J.ISSN.1000-3754.202402010
Han, T., Clennell, M. B., Josh, M., and Pervukhina, M. (2015). Determination of effective grain geometry for electrical modeling of sedimentary rocks. Geophysics 80 (4), D319–D327. doi:10.1190/geo2014-0504.1
Hardy, M. P., Hudson, J. A., and Fairhurst, C. (1973). The failure of rock beams: part I - theoretical studies. Int. J. Rock Mech. Min. Sci. Geomech. Abstr. 10, 53–67. doi:10.1016/0148-9062(73)90059-4
Heidari, Z., Verdin, C. T., and Pereeg, W. E. (2013). Improved estimation of mineral and fluid volumetric concentrations in thinly bedded carbonate formations. Geophysics 78 (4), 261–269. doi:10.1190/geo2012-0438.1
Jamison, W. L. (1983). Microcracks in rocks:a review. Tectonophysics 100, 449–480. doi:10.1016/0040-1951(83)90198-1
Jamison, W. R. (2016). Fracture system evolution within the Cardium sandstone, central Alberta Foothills folds. AAPG Bull. 100 (7), 1099–1134. doi:10.1306/03011515082
Jazi, S. D., and Wells, M. G. (2020). Dynamics of settling-driven convection beneath a sediment-laden buoyant overflow: implications for the length-scale of deposition in lakes and the coastal ocean. Sedimentology 67 (1), 699–720. doi:10.1111/sed.12660
Jesús, O., Jeannette, W., and Michael, H. G. (2013). Recognition criteria for distinguishing between hemipelagic and pelagic mudrocks in the characterization of deep-water reservoir heterogeneity. AAPG Bull. 97 (10), 1785–1803. doi:10.1306/04221312086
Kane, I. A., and Pontén, A. S. M. (2012). Submarine transitional flow deposits in the Paleogene Gulf of Mexico. Geology 40 (12), 1119–1122. doi:10.1130/g33410.1
Lai, J., Wang, G. W., Wang, Z. Y., Chen, J., Pang, X. J., Wang, S. C., et al. (2018). A review on pore structure characterization in tight sandstones. Earth-Science Rev. 177, 436–457. doi:10.1016/j.earscirev.2017.12.003
Laubach, S. E. (1997). A method to detect natural fracture strike in sandstones. AAPG Bull. 81 (4), 604–623.
Li, D. Q., Wei, J. X., Di, B. R., Ding, P. B., Huang, S. Q., and Shuai, D. (2018a). Experimental study and theoretical interpretation of saturation effect on ultrasonic velocity in tight sandstones under different pressure conditions. Geophys. J. Int. 212 (3), 2226–2237. doi:10.1093/gji/ggx536
Li, L., Huang, B., Li, Y., Hu, R., and Li, X. (2018b). Multi-scale modeling of shale laminas and fracture networks in the Yanchang formation, Southern Ordos Basin, China. Eng. Geol. 243, 231–240. doi:10.1016/j.enggeo.2018.07.010
Li, J., Li, H., Yang, C., Wu, Y. J., Gao, Z., and Jiang, S. L. (2022). Geological characteristics and controlling factors of deep shale gas enrichment of the Wufeng-Longmaxi Formation in the southern sichuan Basin, China. Lithosphere 2022, 4737801. doi:10.2113/2022/4737801
Li, C., Wei, H., Wu, J., Li, T., Du, J., Guo, Y., et al. (2024). Study on reservoir characteristics of He8 tight gas reservoir in Yanchang east area of Yan'an Gasfield. Unconv. Oil and Gas 11 (4), 49–61. doi:10.19901/j.fcgyq.2024.04.06
Ma, X. Q., Zou, Q. Y., Yu, S., and Zu, Y. (2023). Diagenetic detention phenomenon and effects of feldspar-rich sandstone in closed system of H8 Member, linxing gas field in Ordos Basin. China Offshore Oil Gas 35 (2), 44–52.
Mayall, M., Kane, I. A., and McCaffrey, W. D. (2013). Internal architecture, bedforms and geometry of turbidite channels. A conference held at the Geological Society, London, June 20-21st 2011. Mar. Petroleum Geol. 41, 1–6. doi:10.1016/j.marpetgeo.2012.10.004
Maystrenko, Y. P., Gernigon, L., Olesen, O., Ottesen, D., and Rise, L. (2018). 3-D thermal effect of late Cenozoic erosion and deposition within the Lofoten–Vesterålen segment of the Mid-Norwegian continental margin. Geophys. J. Int. 213 (2), 885–918. doi:10.1093/gji/ggy013
Meiburg, E., and Kneller, B. (2010). Turbidity currents and their deposits. Annu. Rev. Fluid Mech. 42, 135–156. doi:10.1146/annurev-fluid-121108-145618
Mi, W., Xie, X., Cao, H., Ma, Q., Du, Y., Zhang, Q., et al. (2022). Characteristics and main controlling factors of tight sandstone reservoirs of Permian Shan 2 to He 8 members in southeastern Ordos Basin. Lithol. Rev. 34 (6), 101–117. doi:10.12108/yxyqc.20220609
Mulder, T., Savoye, B., and Syvitski, J. P. M. (1997). Numerical modelling of a mid-sized gravity flow: the 1979 Nice turbidity current (dynamics, processes, sediment budget and seafloor impact). Sedimentology 44 (2), 305–326. doi:10.1111/j.1365-3091.1997.tb01526.x
Norsahminan, D., Islam, M., Thota, S., and Shalaby, M. (2024). 3D reservoir characterization of the Mangahewa Formation, Mangahewa Field, Taranaki Basin, New Zealand. Energy Geosci. 5 (2), 100266. doi:10.1016/j.engeos.2023.100266
Osinowo, O., Abdulmumin, Y., and Faweya, T. (2023). Analysis of high-resolution airborne-magnetic data for hydrocarbon generation and preservation potential evaluation of Yola sub-basins, northern Benue Trough, northeastern Nigeria. Energy Geosci. 4 (1), 33–41. doi:10.1016/j.engeos.2022.08.002
Parsons, J. D., Bush, J. W. M., and Syvitski, J. P. M. (2001). Hyperpycnal plume formation from riverine outflows with small sediment concentrations. Sedimentology 48 (2), 465–478. doi:10.1046/j.1365-3091.2001.00384.x
Pattison, S. A. J., Bruce, A. R., and Hoffman, T. A. (2007). Evidence of across-helf transport of fine -grained sediments: Turbidite-filled shelf channels in the Campanian Aberdeen Member, Book Cliffs, Utah, USA. Sedimentology 54 (5), 1033–1064.
Pritchard, D., and Gladstone, C. (2009). Reversing buoyancy in turbidity currents: developing a hypothesis for flow transformation and for deposit facies and architecture. Mar. and Petroleum Geol. 26 (10), 1997–2010. doi:10.1016/j.marpetgeo.2009.02.010
Routa, A., and Monahty, P. (2024). An improved reverse time migration for subsurface imaging over complex geological structures: a numerical study. Energy Geosci. 5 (2), 100239. doi:10.1016/j.engeos.2023.100239
Shanmugam, G. (2013). New perspectives on deep-water sandstones: implications. Petroleum Explor. Dev. 40 (3), 316–324. doi:10.1016/s1876-3804(13)60038-5
Sheng, J., Sun, W., Jie, T., Zhang, R., Zhao, T., and Liu, Y. (2015). Diagenesis of He-8 Reservoir and its quantitative analysis of porosity evolution model in Southeast sulige gas field. Geol. Sci. Technol. Inf. 34 (1), 20–27.
Song, K. (2021). Burial, diagenetic and porosity evolution process and fluid activity characteristics of He-8 Member of the Upper Paleozoic in southwestern Ordos Basin. Master's Thesis: Northwest University, 20–40.
Stevenson, C. J., and Peakall, J. (2010). Effects of topography on lofting gravity flows:implications for the deposition of deep-water massive sands. Mar. Petroleum Geol. 27 (7), 1366–1378. doi:10.1016/j.marpetgeo.2010.03.010
Stow, D. A. V., and Johansson, M. (2000). Deep-water massive sands:nature, origin and hydrocarbon implications. Mar. Petroleum Geol. 17 (2), 145–174. doi:10.1016/s0264-8172(99)00051-3
Talling, P. J. (2014). On the triggers, resulting flow types and frequencies of subaqueous sediment density flows in different settings. Mar. Geol. 352, 155–182. doi:10.1016/j.margeo.2014.02.006
Talling, P. J., Paull, C. K., and Piper, D. J. W. (2013). How are subaqueous sediment density flows triggered, what is their internal structure and how does it evolve? Direct observations from monitoring of active flows. Earth-Science Rev. 125, 244–287. doi:10.1016/j.earscirev.2013.07.005
Wang, X. Z. (2016). Natural gas exploration in Southern ordos Basin. Beijing: Geological Publishing House, 1–20.
Wang, Y., Zhang, C., Hu, J., Du, J., Hou, L., and Chen, H. (2025). Sedimentary characteristics and constitutive pattern of the deltaic sand body in Shanxi Formation—The 8th Member of Lower shihezi Formation in southeastern Ordos Basin. Geol. Rev. 46 (2), 1–20. doi:10.16509/j.georeview.2025.02.002
Wu, Y. C. (2017). Characteristics and distribution of Carboniferous - permian gas reservoirs in the southern Shanxi fold flex belt. Shandong Univ. Sci. Technol. (In Chinese with English Abstract).
Wu, X., Wang, F., Zhang, X., Han, B., Liu, Q., and Zhang, Y. (2024). Extraction of fractures in shale CT images using improved U-Net. Energy Geoscience 5 (2), 100185. doi:10.1016/j.engeos.2023.100185
Xiao, Z., Ding, W., Liu, J., Tian, M., Yin, S., Zhou, X., et al. (2019). A fracture identification method for low-permeability sandstone based on R/S analysis and the finite difference method: a case study from the Chang 6 reservoir in Huaqing oilfield, ordos Basin. Journal of Petroleum Science and Engineering 174, 1169–1178. doi:10.1016/j.petrol.2018.12.017
Xie, X., and Heller, P. L. (2013). U–Pb detrital zircon geochronology and its implications: the early Late Triassic Yanchang Formation, south Ordos Basin, China. Journal of Asian Earth Sciences 64, 86–98. doi:10.1016/j.jseaes.2012.11.045
Xu, L., Yu, X., Yang, Y., Li, S., Tian, Q., and Zhou, Y. (2012). Diagenesis and diagenetic facies of tight sandstone reservoirs in the 8th member of the Shihezi Formation, southern Sulige Gas Field. Natural Gas Industry 32 (7), 15–20.
Yadav, K., Sircar, A., and Bist, N. (2023). Carbon mitigation using CarbFix, CO2 plume and carbon trading technologies. Energy Geoscience 4 (1), 117–130. doi:10.1016/j.engeos.2022.09.004
Yang, M., Pan, Y., Feng, H., Yan, Q., Lu, Y., Wang, W., et al. (2025). Fractal characteristics of pore structure of longmaxi shales with different burial depths in Southern Sichuan and its geological significance. Fractal Fract 9, 2–10. doi:10.3390/fractalfract9010002
Yin, S., and Wu, Z. (2020). Geomechanical simulation of low-order fracture of tight sandstone. Marine and Petroleum Geology 100 (34), 104359–10. doi:10.1016/j.marpetgeo.2020.104359
Yin, S., Dong, L., Yang, X., and Wang, R. (2020). Experimental investigation of the petrophysical properties, minerals, elements and pore structures in tight sandstones. Journal of Natural Gas Science and Engineering 76 (1), 103189–14. doi:10.1016/j.jngse.2020.103189
Yin, S., Radwan., A. E., Xiao, F., and Lai, P. (2024). Developmental characteristics of vertical natural fracture in low-permeability oil sandstones and its influence on hydraulic fracture propagation. Geomechanics and Geophysics for Geo-Energy and Geo-Resources 10, 165. doi:10.1007/s40948-024-00889-0
Yuan, Y., Hao, Y., and Zhang, R. (2024). Dynamic evaluation on sealing capacity of caprocks of the Meso-Neoproterozoic reservoirs in Ordos Basin, China. Energy Geoscience 5 (1), 100226. doi:10.1016/j.engeos.2023.100226
Zavala, C., and Arcuri, M. (2016). Intrabasinal and extrabasinal turbidites: origin and distinctive characteristics. Sedimentary Geology 337, 36–54. doi:10.1016/j.sedgeo.2016.03.008
Zhai, C., Zhang, Z., Volkman, J., Lu, H., and Chen, Y. (2024). Extractable and kerogen-bound hopanoids from typical Eocene oil shales in China. Energy Geoscience 5 (2), 100264. doi:10.1016/j.engeos.2023.100264
Zhang, Y. Q., Shi, W., and Liao, C. Z. (2006). Fault kinematic analysis and change in late Mesozoic tectonic stress regimes in the Peripheral zones of the ordos Basin, North China. Acta Geologica Sinica 80 (5), 639–647.
Zhao, H., Luo, T., Wei, H., and Li, Z. (2024). Reservoir characteristics and sensitivity analysis of upper Paleozoic He 8 member in Central Ordos Basin. Petroleum Geology and Engineering 38 (1), 34–39.
Zhou, W., Zhang, S. N., Li, L., and Su, F. Y. (2006). The character of Upper Paleozoic reservoir fractures and the evaluation of their distribution in Tabamiao. Journal of Mineral Petroleum 26 (4), 54–61.
Zhu, H. J., Ju, Y. W., Lu, Y. J., Yang, M., Feng, H., Qiao, P., et al. (2025). Natural evidence of organic nanostructure transformation of shale during bedding-parallel slip. GSA Bulletin 137 (5-6), 2719–2746. doi:10.1130/B37712.1
Zou, C. N., Tao, S. Z., Zhu, R. K., Yuan, X. J., Li, W., Zhang, G. Y., et al. (2009). Formation and distribution of “continuous” gas reservoirs nd their giant gas province: a case from the Upper riassic Xujiahe Formation giant gas province, Sichuan Basin. Petroleum Exploration and Development 36 (3), 307–319. doi:10.1016/s1876-3804(09)60128-2
Zou, C. N., Zhu, R. K., Liu, K. Y., Su, L., Bai, B., Zhang, X. X., et al. (2012). Tight gas sandstone reservoirs in China: characteristics and recognition criteria. Journal of Petroleum Science and Engineering 88-89, 82–91. doi:10.1016/j.petrol.2012.02.001
Keywords: ordos Basin, He-8 member, tight gas sandstone, lithology, diagenetic facies, diagenetic stage
Citation: Gao Y, Yin S, Guo H and Jiang Z (2025) Reservoir characteristics and petrophysical controlling factors of the tight sandstone of He-8 member in eastern Yanchuan area, Yan’an gas field. Front. Earth Sci. 13:1706513. doi: 10.3389/feart.2025.1706513
Received: 16 September 2025; Accepted: 17 November 2025;
Published: 03 December 2025.
Edited by:
Jianhua He, Chengdu University of Technology, ChinaReviewed by:
Hongjian Zhu, Yanshan University, ChinaShizhen Chen, Chengdu University of Technology, China
Copyright © 2025 Gao, Yin, Guo and Jiang. This is an open-access article distributed under the terms of the Creative Commons Attribution License (CC BY). The use, distribution or reproduction in other forums is permitted, provided the original author(s) and the copyright owner(s) are credited and that the original publication in this journal is cited, in accordance with accepted academic practice. No use, distribution or reproduction is permitted which does not comply with these terms.
*Correspondence: Shuai Yin, c3BlZWR5c3lzQDE2My5jb20=