 Guoping Peng
 Wei Lin
- Department of Civil Engineering, School of Architecture, Jiangxi Institute of Applied Science and Technology, Nanchang, Jiangxi, China
Introduction: During the excavation of deep underground engineering, stress redistribution in rock mass often leads to obvious stress-deformation failure characteristics. It is important to study the stress-strain characteristics of rock for the safety construction and protection of underground engineering.
Methods: Based on rock basic density test, rock and mineral microscopic test and triaxial compression test, brittle deformation failure mechanical characteristics of a deep mylonite under high in-situ stress state are obtained. A rock damage constitutive model is established and compared with triaxial test results. Finally, the physical significance of model parameter (a) and parameter (r) is analyzed.
Results: Mylonite exhibits obvious brittle mechanical characteristics under high stress state, and the established rock damage constitutive model can well describe this brittle deformation characteristic. The damage degree increases from 0 to 1 gradually, and the damage rate increases first and then decreases.
Discussion: The effects of parameters a and r on the constitutive model and damage degree are discussed. Parameter A mainly affects the peak strength of the model, the brittleness of the rock, and the extreme point strain that affects the degree of damage. Parameter r mainly affects the peak strength of the model, and the extreme point damage degree is affected. In addition, the concept of brittleness index is introduced and its engineering applications are explored.
1 Introduction
Deep-seated engineering endeavors, including deep mineral resource extraction (Du et al., 2024; Sharma and Gales, 2025; Lindi et al., 2024) and deep underground space construction (Ran et al., 2024; Ma et al., 2024), have been advancing rapidly in recent years. In these projects, rocks in deep formations are subjected to high geo-stress states, which exert a significant influence on their mechanical behaviors (Yang et al., 2025; Li et al., 2025; Zhou et al., 2023). Mylonite (Eliwa et al., 2021; Chen et al., 2020), a rock formed via intense tectonic movements and typical ductile-shear deformation, displays intricate mechanical responses when situated in deep high stress environments. Investigating the brittle mechanical behavior and establishing a damage constitutive model for deep mylonite under high geo-stress is of great importance for guaranteeing the safety and efficiency of deep engineering.
The mechanical behavior of deep rocks under high geo-stress has garnered extensive attention from researchers. Under conditions of high confining pressure and high axial stress, the transition between the brittle and ductile behaviors of rocks becomes more complex (Liu et al., 2023; Wang et al., 2023; Göğüş et al., 2024). Mylonite, with its special microstructure featuring foliation (Giese et al., 2017) and mineral alignment due to shear deformation (Yemdji et al., 2023), has mechanical properties that differ markedly from those of intact rocks. Previous studies on shallow mylonite have indicated that it possesses relatively low strength and obvious ductile deformation characteristics (Lutz and Axen, 2017; Cheng et al., 2023). However, in deep high-stress circumstances, the mechanical behavior of mylonite may shift towards brittleness. For instance, experiments on other shear-deformed rocks under high stress have shown that the tendency for brittle failure increases to a certain extent as the confining pressure rises (Chen et al., 2018).
In addition, the damage evolution of rocks under loading is a key factor that determines their mechanical behavior. Damage in rocks typically involves the initiation, propagation, and coalescence of microcracks (Li et al., 2025; Dang et al., 2025; Liu et al., 2021). For deep mylonite, the original microstructure such as grain size (Mishra et al., 2022), mineral composition distribution (Hanfi et al., 2025), and pre-existing microcracks (Sigue et al., 2023) along the foliation offers favorable conditions for damage development under high geo-stress. Gaining an understanding of the damage mechanism is essential for establishing an accurate constitutive model. Existing damage constitutive models for rocks can be roughly categorized into statistical damage models (Liu et al., 2021), fracture mechanics-based models (Mirzaei et al., 2025), and continuum damage mechanics models (Ju, 2019). Nevertheless, most of these models are established for intact rocks or rocks with simple damage mechanisms, and there is a lack of models specifically targeting deep mylonite with complex shear-deformed structures under high geo-stress.
So that, the application of constitutive models in engineering practice depends on their capability to accurately describe the stress-strain relationship and damage process of rocks. In deep engineering, the prediction of rock deformation and failure is crucial for supporting design and stability analysis. A suitable damage constitutive model for deep mylonite can assist engineers in better assessing the mechanical response of surrounding rocks, optimizing excavation schemes, and preventing geological hazards (Jin and Yuan, 2024). Although some studies have attempted to modify existing constitutive models for specific rock types under high stress (Chalajour and Hataf, 2024; Chen et al., 2023; Du et al., 2024; Feng et al., 2024), few have concentrated on deep mylonite, and the brittle mechanical behavior under high geo-stress has not been fully clarified.
In summary, this study intends to explore the brittle mechanical behavior of deep mylonite under high geo-stress through laboratory experiments, analyze the damage evolution process, and establish a damage constitutive model that can accurately depict its mechanical response. The research findings will enhance the understanding of deep rock mechanics and provide theoretical support for deep engineering practice.
2 Materials
2.1 Rock specimens and mineral identification
Mylonite is taken from a deep tunnel borehole SKTS07, the maximum principal stress is as high as 300 MPa, the minimum principal stress is as high as 25 MPa, core samples are taken at the depth of 101 m, 153 m, 234 m and 312 m, sealed and numbered, the sample numbers are respectively recorded as S7-7, S7-20, S7-38 and S7-48, the surrounding stress state is mylonite, according to the rock mechanics test standard, the rock samples are made into cylinders, the diameter is about 50 mm, The height is approximately 100 mm as shown in Figure 1. Before the experiment, the basic physical properties of cylindrical samples were tested, including sample density, rock and mineral identification, etc. After testing, the average density of S7-7, S7-20, S7-38 and S7-48 is 2.76 g/cm3, 2.87 g/cm3, 2.88 g/cm3 and 2.91 g/cm3 respectively. The rock and mineral identification results are shown in Figure 1.
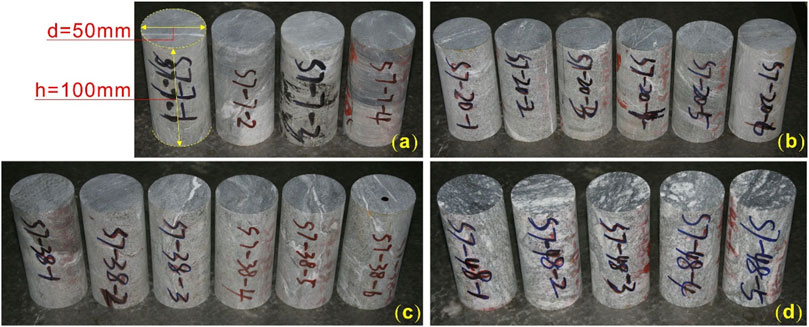
Figure 1. Rock standard samples. (a) Number S7-7; (b) Number S7-20; (c) Number S7-38; (d) Number S7-48.
It can be seen from Figure 2 that the rock is mainly composed of porphyry and matrix. The porphyry minerals are potash feldspar and plagioclase, and the matrix is muscovite, biotite, quartz and feldspar. Some of the biotite is altered into chlorite, and there is no quartz in the porphyry. All of them are refined and recrystallized. The edges of the feldspar porphyry are broken and refined into matrix, and some of them are altered into clay minerals. In addition, it contains a small amount of opaque minerals and calcite filled cracks. The rock contains hard quartz and dark porphyritic minerals, which make the mylonite stronger. From the mechanical point of view, it can be classified as hard rock. Therefore, mylonite may exhibit obvious brittle deformation characteristics under high stress state.
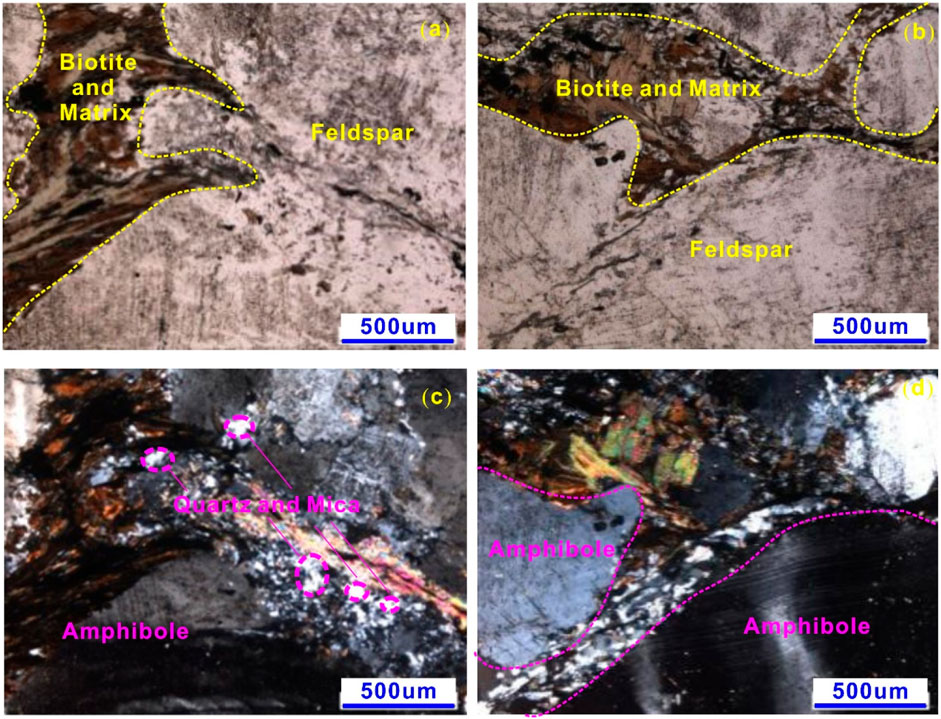
Figure 2. 500 um Microscopic identification of mineral composition of mylonite. (a) Sampling front; (b) sampling left side; (c) sampling back; (d) sampling right side.
2.2 Triaxial compression test of rock
The rock triaxial test mainly uses the INSTRON-1346 electrically controlled rock mechanics test system. According to the original in-situ stress range of the rock, the surrounding rock range applied by the rock triaxial test is controlled within 20 MPa. The test step is controlled by displacement, and the stress loading rate is 0.01 mm/s. Before the start of the test, a 2,000 kN vertical force sensor, two vertical 5 mm displacement sensors, and a 50 MPa confining pressure sensor were installed. During the test, the confining pressure and axial stresses are applied to the confining pressure level and the axial stress is increased until the rock sample fails. The stress-strain curves in the whole deformation and failure process of the rock samples are obtained. As shown in Figure 3.
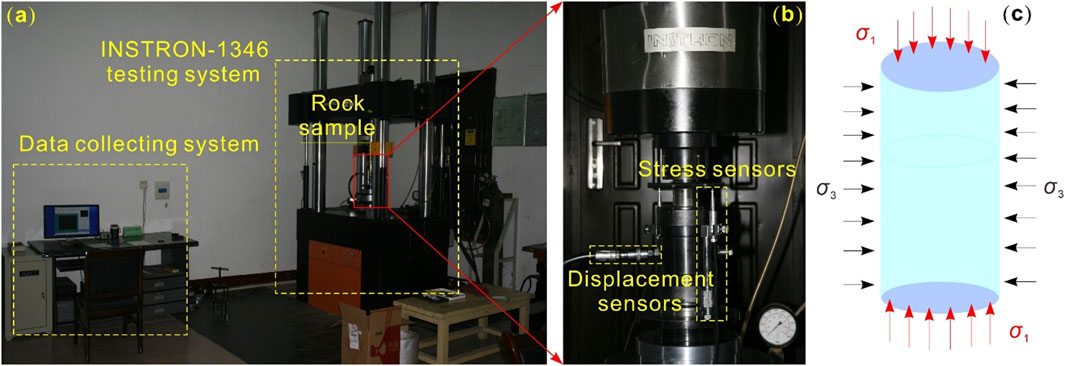
Figure 3. Triaxial compression test. (a) INSTRON-1346 pressure apparatus; (b) Specimen installation; (c) Schematic diagram of rock stress.
Figure 4 shows the stress-strain relationship and failure mode of rock under different confining pressures (5 MPa, 10 MPa, 15 MPa, 20 MPa), including four stress-strain curves, and the right side of each sub-figure is provided with the image of rock sample after failure. All curves show the characteristic that stress increases firstly, then decreases or tends to be flat with strain, which is typical stress-strain response of rock-like materials and reflects the process of rock from elastic deformation to plastic deformation to failure. It can be observed from the curves that the confining pressure has a significant effect on the peak strength. Generally speaking, the peak stress tends to increase with the increase of confining pressure. The photographs to the right of each stress-strain curve show the failure morphology of the rock specimen under the corresponding confining pressure. The yellow dotted line in the photo roughly outlines the failure surface or crack distribution of the rock, and it can be seen that there are differences in the failure mode of the rock under different confining pressures. For example, the rock under partial confining pressure presents obvious shear failure characteristics, and the failure surface is relatively clear; with the change of confining pressure, the number, distribution and failure surface morphology of cracks are also different. These failure modes correspond to the mechanical characteristics reflected by the stress-strain curve, and assist in analyzing the failure mechanism of rock under different confining pressures (such as shear failure, tensile failure or composite failure). In summary, the test results clearly show the influence of confining pressure on stress-strain relationship, peak strength and failure mode of rock: when confining pressure increases, the peak strength of rock usually increases, the rising section and peak characteristics of stress-strain curve are more obvious, and the failure mode also presents different crack distribution and failure mode due to the change of confining pressure, reflecting the important role of confining pressure in rock mechanical behavior.
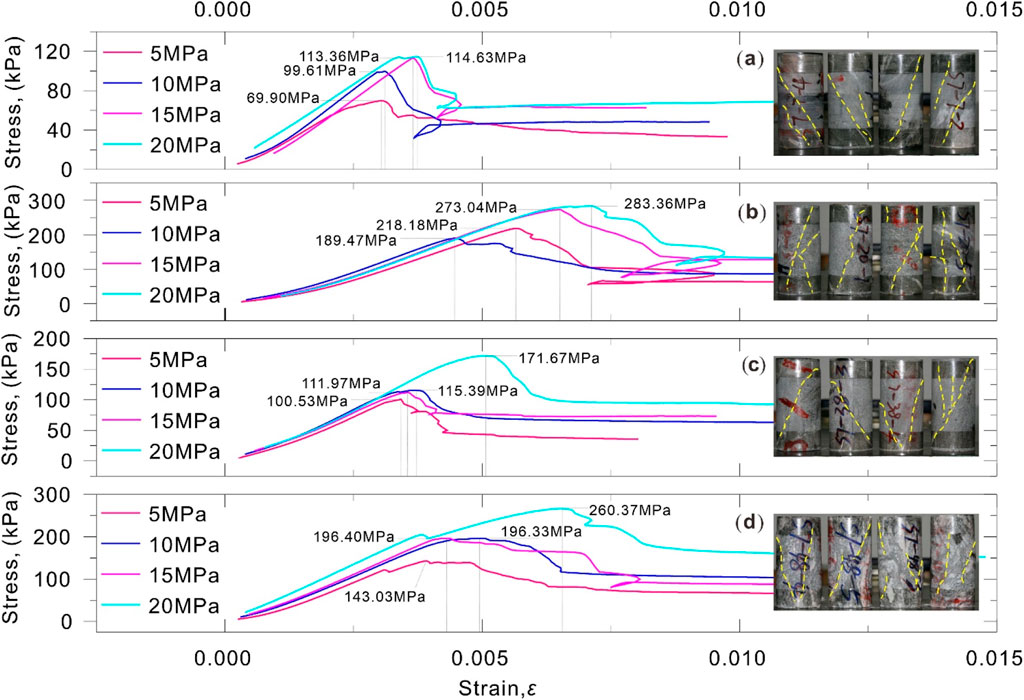
Figure 4. Stress-strain curves of rock. (a) S7-7; (b) S7-20; (c) S7-38; (d) S7-48.
It is worth noting that the brittle deformation of the stress-strain curve in Figure 4 has a sudden change. The reason for this phenomenon is that the load is unstable during the test, which is a test error and has little impact on the brittle mechanical behavior of the mylonite in this paper.
Correspondingly, Figure 5 shows the variation law of many mechanical parameters of rock samples S7-7, S7-20, S7-38 and S7-48 under different confining pressures. Figure 5a displays the relationship between elastic modulus and confining pressure. The elastic moduli of different samples vary with confining pressure. The elastic modulus E of S7-48 increases steadily with the confining pressure; the elastic modulus of S7-38 increases first and then decreases and then increases; the elastic modulus of S7-20 increases continuously; the elastic modulus of S7-7 increases first and then decreases. On the whole, elastic modulus of most samples tends to increase with confining pressure increasing, which indicates that confining pressure can enhance elastic deformation ability of rock. Figure 5b displays the relationship between Poisson’s ratio and confining pressure The Poisson’s ratio of each sample varies relatively smoothly with confining pressure. The Poisson ratio of S7-48 increased slightly, while the Poisson ratios of S7-38, S7-20 and S7-7 remained stable. Poisson’s ratio reflects the ratio of lateral deformation to longitudinal deformation of rock, which indicates that the ratio of lateral deformation to longitudinal deformation of rock is less affected by confining pressure, and the Poisson’s ratio of rock is relatively stable. Figure 5c displays the relationship between peak strength and confining pressure. The peak strength of all samples increases significantly with the increase of confining pressure, and the increase amplitude of different samples is different. S7-48 rose the fastest, S7-7 rose relatively slowly. The fitting curve is also plotted in the figure, which further illustrates that the peak intensity has a good linear positive correlation with confining pressure. This reflects the strengthening effect of confining pressure on compressive strength of rock. The greater the confining pressure, the higher the maximum compressive stress that rock can bear, and the harder it is to be crushed. Figure 5d displays the residual strength vs. confining pressure Residual strength is the strength that a rock can retain after failure. The residual strength of each sample increases with the confining pressure, and also shows a positive correlation with confining pressure, which is verified by
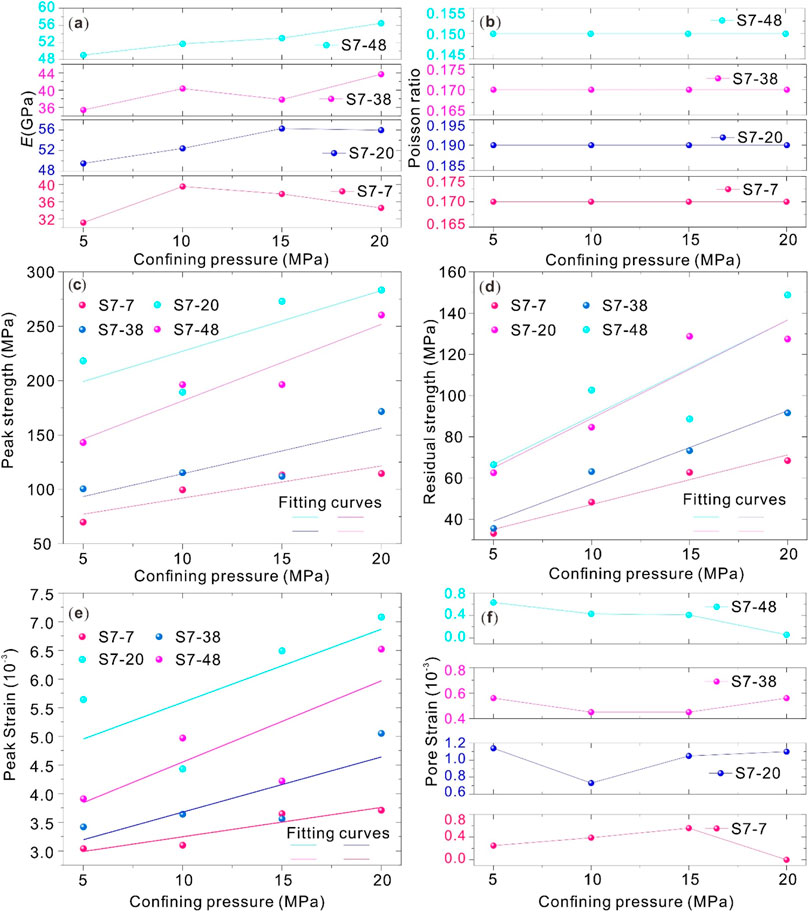
Figure 5. Analysis of test parameters. (a) Elastic modulus E (GPa); (b) Poisson ratio; (c) Peak strength; (d) Residual strength; (e) Peak strain; (f) Pore strain; the fitting curve. It shows that the confining pressure not only increases the peak strength of rock, but also enhances the residual bearing capacity of rock after failure. (e) Displays the peak strain versus confining pressure. The peak strain of all samples increases with confining pressure, and the increasing trend of different samples is different. S7-48 grew most significantly, while S7-7 grew relatively slowly. The fitting curve shows that the peak strain is roughly linearly and positively correlated with the confining pressure, indicating that when the confining pressure increases, the amount of deformation that can occur before the rock reaches the peak strength is greater, the ductility of the rock is improved, and the transition from brittleness to ductility is more obvious. (f) Displays the relationship between pore strain and confining pressure. The pore strain varies with confining pressure for different samples. The pore strain of S7-48 decreases; the pore strain of S7-38 decreases first and then increases; the pore strain of S7-20 decreases first and then increases and then keeps stable; the pore strain of S7-7 increases first and then decreases. The pore strain reflects the deformation of pores in rock, and the change of confining pressure will cause the compression or expansion of pores in rock.
In conclusion, confining pressure has significant influence on elastic modulus, peak strength, residual strength, peak strain and other mechanical parameters of rock, and most of the parameters increase with confining pressure; Poisson ratio is less affected by confining pressure and relatively stable; pore strain varies with confining pressure due to its own characteristics. These rules are of great significance for understanding the mechanical behavior of rock under confining pressure and for stability analysis of rock engineering such as underground chambers and tunnels.
3 Methodology
3.1 Constitutive model of rock based on damage evolution
From the stress-strain curve obtained from the triaxial compression test, it can be seen that the rock shows obvious brittle mechanical characteristics. Therefore, the established damage constitutive model must fully consider this characteristic. From the perspective of damage theory, rock deformation and failure is a continuous damage process. Microscopically, rock damage is considered the development process of microcavities and microcracks in the rock (Qiu et al., 2020). When rock is loaded, stress is borne by two parts: elastic bearing part and damage bearing part. Quantifying the contributions of the two parts by geometric length yields (Equation 1), as shown in Figure 6:
where σi is the total stress, S is the total length, σi′ is the stress in the elastic region, S1 is the area of the elastic region, σi″ is the stress in the damaged region, S2 is the area of the damaged region.
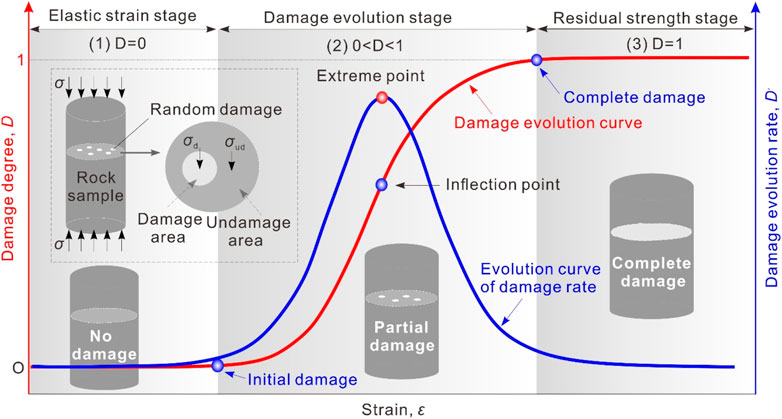
Figure 6. Schematic diagram of rock damage evolution.
If the damage variable D describes the proportion of damaged areas (D = S2/S, then the proportion of undamaged areas is 1−D = S1/S), dividing the two sides by l converts the length ratio into the damage ratio (Equation 2), resulting in:
For elastic region of rock, linear elastic constitutive relation is obeyed (extension of Hooke’s law, considering confining pressure σ3). Take the axial stress σ1′ (axial stress in elastic region) as an example: axial strain ε1 results from a combination of axial stress and transverse deformation caused by confining pressure. According to elastic mechanics, the relationship between axial stress and strain is (Equation 3):
If the pore strain εc is not considered, the axial strain needs to be deducted from the pore strain, and the correction (Equation 4) is:
The damaged area cannot transmit elastic stress completely, but it can transmit residual stress through crack surface friction and residual contact, which is defined as Equation 5:
where σir is the residual stress in the damaged region.
Substitute the stress of elastic region and residual stress of damaged region into the total stress decomposition formula in step 1 to obtain the total axial stress σ1 (Equation 6):
Damage impairs the effective transfer of confining pressure, so the confining pressure σ3 is corrected. Assuming that the residual value of confining pressure is σ3r, then the corrected confining pressure σ3′ satisfies (Equation 7):
Substituting the damage correction formula for confining pressure into the total axial stress formula, eliminating σ3′, and assuming σ3r = 0 (in the extreme case, confining pressure cannot transmit residual value at all after damage), it can be simplified as Equations 8, 9:
3.2 Damage evolution model of rock
Based on the analysis of damage mechanics, the deformation and failure characteristics of rocks under load are essentially the result of the accumulation of damage to rocks. Therefore, the focus of establishing a rock damage constitutive model is to determine the damage evolution model of the rock. A large number of studies have shown that the cumulative damage of rocks obeys a certain S-shaped curve distribution law (Zhang et al., 2021; Liu et al., 2018; Liu et al., 2024). As shown in Figure 6. Various functions can describe the laws of S-shaped curves, such as the logistic function, Gompertz function, Usher function, Weibull function, and MMF function.
The specific derivation process of the rock damage evolution equation based on the logistic function is detailed in reference (Liu et al., 2023), and its differential expression (Equation 10) is provided:
where k represents the total number of microelements; n represents the number of lossy microelements, and 0 ≤ n ≤ k; r is the inherent growth rate of the lossy element, that is, the growth rate in an unrestricted environment; ε is the axial strain.
According to Rabotnov’s definition of damage variable, the differential expression of damage variable D can be obtained as follows (Equation 11):
By organizing Equation 12, it can be concluded that:
The expression for the damage evolution equation based on the logistic function can be obtained by integrating Equation 13 as follows:
Where a = ln(k/n0-1) reflects the initial damage degree of rock, and n0 is the number of lossy microelements at the initial moment. For further analysis, the damage evolution rate equation can be obtained by taking the first derivative of Equation 14 as follows:
4 Model validation
4.1 Model fitting results
The reasonableness of the model has been verified by comparing the rock constitutive model based on the damage evolution process with the triaxial test results of this study, and the specific comparison results are shown in Figure 7.
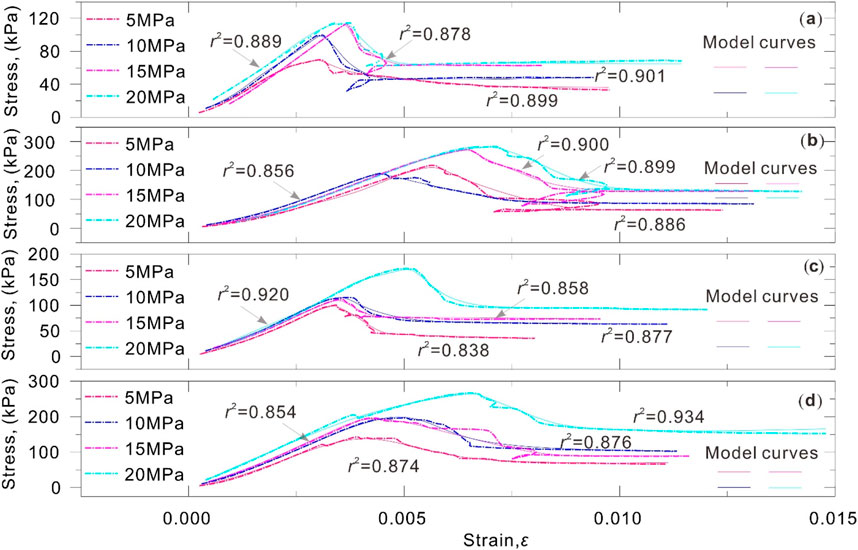
Figure 7. Test curves and damage constitutive model curves. (a) S7-7; (b) S7-20; (c) S7-38; (d) S7-48.
It can be seen from Figure 7 that the fitting degree of the model curve and the triaxial test data is above 0.8, and the fitting effect is highly fitted, which shows that it is reasonable to use the rock constitutive model based on damage evolution to characterize the brittle mechanical behavior of mylonite. In addition, the model can clearly reveal the elastic deformation, strain hardening and brittle deformation of mylonite. Therefore, in a sense, it is feasible to use the constitutive model of rock damage to predict the strength characteristics of a deep mylonite.
4.2 Rock damage evolution results
Under different normal confining pressures, mylonite exhibits different brittle mechanical behaviors. Correspondingly, the damage of rocks also exhibits different evolutionary behaviors. The damage evolution curves of the four groups of rocks are fitted to the corresponding model, and the specific results are shown in Figure 8.
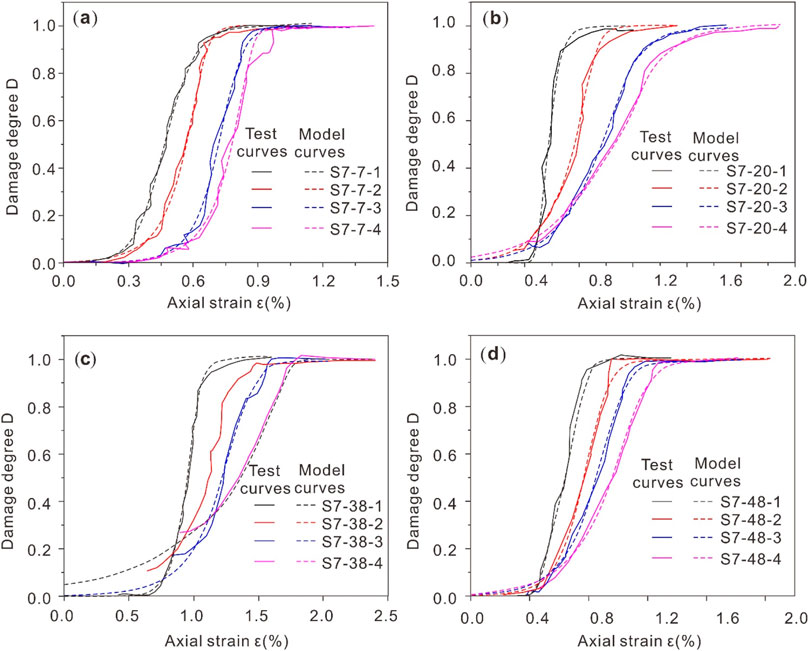
Figure 8. Evolution results of rock damage variables. (a) S7-7; (b) S7-20; (c) S7-38; (d) S7-48.
Figure 8 shows that with the continuous and gradual evolution of rock deformation, the damage degree of rock gradually increases from 0 to 1, and the overall “S” evolution curve is presented. In addition, the damage evolution of rocks is also clearly related to confining compression. As the confining ground continues to increase, the “S” curve also undergoes gradual evolution, and the curve continues to advance to the trailing edge. This indicates that confining pressure can promote the damage evolution process of rocks.
5 Discussion
5.1 The influence of parameters on the constitutive model
In Figure 9a, fixed r = 21, the axial stress changes with axial strain under different a value (a = 10, a = 15, a = 20, a = 25, a = 30) were studied. With the increase of a value, the peak value of the curve gradually increases, and the axial strain corresponding to the peak value also changes. The overall results show that with the increase of a, the axial stress that the material can withstand is greater, and the strain development also has a corresponding change trend. In Figure 9b, fixed a = 21, the axial stress changes with axial strain under different r values (r = 25.24, r = 22.24, r = 19.24, r = 16.24, r = 13.24) were studied. With the decrease of r value, the peak value of the curve decreases gradually, which indicates that when a is fixed, the smaller r value is, the lower the axial stress peak value that the material can bear. The mechanical response of the material changes with r.
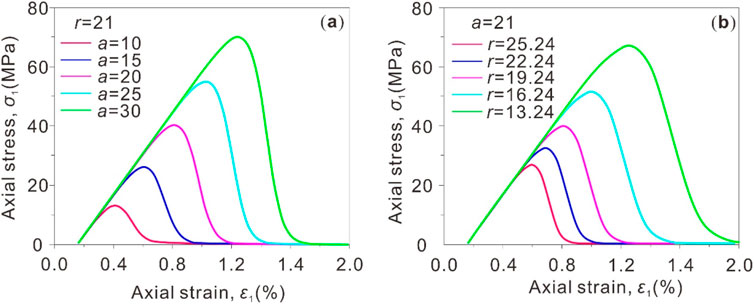
Figure 9. Effect of model parameters on constitutive relations. (a) the physical significance of parameter a; (b) the physical significance of the parameter r.
Overall, Figures 9a,b show the relationship between axial stress and axial strain under the control of different parameters (a and r), reflecting the effect of parameter changes on the mechanical behavior (stress-strain characteristics) of materials.
5.2 The effect of parameters on the damage degree
Figure 10 shows the relationship between damage degree, inflection point damage, maximum damage rate, and inflection point strain and axial strain or parameters under different parameters.
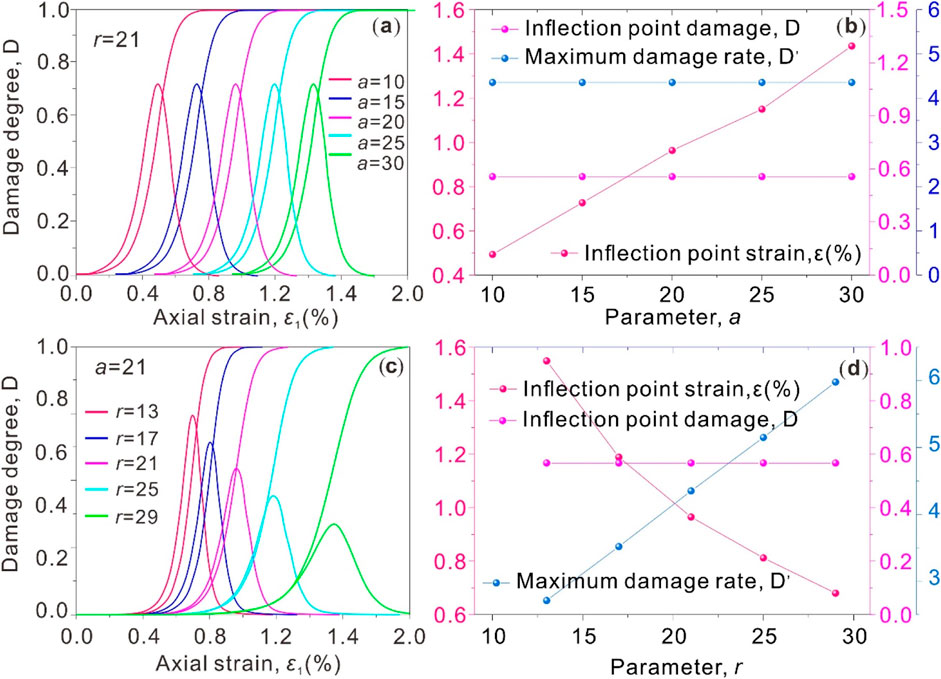
Figure 10. Effect of model parameters on damage evolution law. (a) the physical significance of parameter a; (b) The relationship between the damage index and parameter a; (c) the physical significance of the parameter r; (d) the relationship between the damage index and the parameter r.
Fixed r = 21 in Figure 10a, study the variation of damage degree with axial strain under different a value (a = 10, a = 15, a = 20, a = 25, a = 30). Different color curves represent different a value. With the increase of a, the axial strain corresponding to the peak value of damage degree moves backward, and the peak value also changes, reflecting the influence of a on the damage development process. In Figure 10b, with the increase of a, the inflection points damage and inflection point strain show an overall upward trend, while the maximum damage rate remains basically stable, reflecting the influence of parameter a on the key damage characteristics (inflection point, maximum damage rate, etc.). Fixed a = 21 in Figure 10c, study the variation of damage degree with axial strain under different r values (r = 13, r = 17, r = 21, r = 25, r = 29). Different color curves represent different r values. With the change of r, the development of damage degree (such as the time and size of peak value) presents different characteristics, reflecting the regulatory effect of r on damage process. In Figure 10d, with the increase of r, the inflection strain decreases, the maximum damage rate increases, and the inflection damage remains basically stable, showing the influence of parameter r on the key characteristics of damage.
On the whole, Figure 10 presents in detail the variation of damage-related indicators (damage degree, inflection point damage, maximum damage rate, inflection point strain, etc.) with axial strain or parameters through different sub-figures from the perspective of a and r parameters, which is helpful to analyze the influence mechanism of parameters on material damage behavior.
5.3 Application of brittleness index
Based on the comparison results of the triaxial compression test of mylonite and the constitutive model of rock damage, the concept of brittleness index can be proposed to be applied to the evaluation of mechanical properties of mylonite, which can be considered from the following three aspects.
1. Quantifying the regulation of confining pressure on brittleness. The brittleness index obtained through experimental fitting with the model, such as BI1 based on stress drop amplitude and BI2 based on damage evolution rate, can quantitatively describe the negative correlation between confining pressure and brittleness. When the confining pressure increases from 5 MPa to 30 MPa, BI1 decreases from 0.82 to 0.35, and the decline rate gradually slows down, which is highly consistent with the field phenomenon of “the failure mode of mylonite changes from brittle to ductility with the increase of burial depth” in deep engineering, which provides a quantitative basis for the optimization of deep tunnel support scheme.
2. Reveal the internal correlation between damage evolution and brittleness. The model fitting results show that there is a linear relationship between the brittleness index and the peak growth rate of the damage variable, which shows that the brittleness nature of mylonite is the external manifestation of rapid accumulation and penetration of damage. The revelation of this correlation mechanism promotes the brittleness evaluation from “phenomenon description” to “mechanism quantification,” which can provide a theoretical basis for predicting the brittleness deterioration trend of mylonite under long-term load.
3. Guiding the quality grading of engineering rock mass. Incorporating the brittleness index into the mylonite rock mass classification system can make up for the shortcomings of traditional classification (such as RMR and Q systems) in insufficient consideration of brittleness.
6 Conclusion
Based on rock basic density test, rock mineral microscopic test and triaxial compression test, brittle deformation failure mechanical characteristic curves of a deep mylonite under high in-situ stress state are obtained. A rock damage constitutive model is established and compared with triaxial test results. Finally, the physical significance of model parameter (a) and parameter (r) is analyzed. The following main conclusions are drawn:
1. Mylonite shows obvious brittle failure characteristics under three-dimensional high in-situ stress state. In the course of continuous loading, the stress of rock first increases to peak stress, then brittle deformation occurs, and finally remains at a residual strength.
2. The proposed constitutive model can describe the stress-strain deformation failure process of mylonite under high stress state. The model parameter a mainly affects the peak strength of rock, while the model parameter r affects both the peak strength and brittle properties of rock.
3. The damage evolution model can fit the damage evolution process of rock very well. Rock damage evolves from acceleration to deceleration, and damage degree changes from 0 to 1 gradually.
Data availability statement
The original contributions presented in the study are included in the article/supplementary material, further inquiries can be directed to the corresponding author.
Author contributions
GP: Conceptualization, Writing – original draft. WL: Formal Analysis, Writing – review and editing. MZ: Methodology, Writing – review and editing.
Funding
The author(s) declare that no financial support was received for the research and/or publication of this article.
Acknowledgments
AcknowledgementsThe authors would like to thank the reviewers of this paper for their constructive comments.
Conflict of interest
The authors declare that the research was conducted in the absence of any commercial or financial relationships that could be construed as a potential conflict of interest.
Generative AI statement
The author(s) declare that no Generative AI was used in the creation of this manuscript.
Any alternative text (alt text) provided alongside figures in this article has been generated by Frontiers with the support of artificial intelligence and reasonable efforts have been made to ensure accuracy, including review by the authors wherever possible. If you identify any issues, please contact us.
Publisher’s note
All claims expressed in this article are solely those of the authors and do not necessarily represent those of their affiliated organizations, or those of the publisher, the editors and the reviewers. Any product that may be evaluated in this article, or claim that may be made by its manufacturer, is not guaranteed or endorsed by the publisher.
References
Chalajour, S., and Hataf, N. (2024). Three-dimensional numerical investigation of tunnel behavior based on different constitutive models and associated parametric analysis in rock medium. Civ. Eng. Infrastructures J. 57 (1), 119–143. doi:10.22059/CEIJ.2023.351299.1888
A. Chen, Y. Ng, E. Zhang, and M. Tian (2020). Dictionary of geo-tourism (Singapore: Springer). doi:10.1007/978-981-13-2538-0_1649
Chen, D. X., Wang, L. G., and Sun, C. (2023). Triaxial creep damage characteristics of sandstone under high crustal stress and its constitutive model for engineering application. Eng. Geol. 21 (3), 262–273. doi:10.1002/dug2.12033
Cheng, Y., Yan, C., and Han, Z. (2023). “Strength and deformation characteristics of rocks,” in Foundations of rock mechanics in oil and gas engineering (Singapore: Springer). doi:10.1007/978-981-99-1417-3_4
Cheng, Y., Yan, C., and Han, Z. (2023). “Strength and deformation characteristics of rocks,” in Foundations of rock mechanics in oil and gas engineering (Singapore: Springer). doi:10.1007/978-981-99-1417-3-4
Dang, Y., Yang, Z., Yang, S., Liu, X., and Shang, J. (2025). Thermal damage in crystalline rocks: the role of heterogeneity. Geophys 11, 38. doi:10.1007/s40948-025-00955-1
Du, K., Xi, W., Huang, S., and Zhou, J. (2024). Deep-sea mineral resource mining: a historical review, developmental progress, and insights. Min. Metallurgy and Explor. 41, 173–192. doi:10.1007/s42461-023-00909-9
Du, K., Yi, Y., Luo, X., Liu, K., Li, P., and Wang, S. f. (2024). Novel damage constitutive models and new quantitative identification method for stress thresholds of rocks under uniaxial compression. J. Cent. South Univ. 31, 2658–2675. doi:10.1007/s11771-024-5725-1
Eliwa, A. A., Gawad, E. A., Mubark, A. E., and Abdelfattah, N. A. (2021). Intensive studies for modeling and thermodynamics of fusion digestion processes of Abu Rusheid Mylonite rocks. JOM 73, 3419–3429. doi:10.1007/s11837-021-04837-1
Feng, C., Wang, Z., Wang, J., Lu, Z., and Li, S. (2024). A thermo-mechanical damage constitutive model for deep rock considering brittleness-ductility transition characteristics. J. Cent. South Univ. 31, 2379–2392. doi:10.1007/s11771-024-5700-x
Giese, J., Schreurs, G., Berger, A., and Herwegh, M. (2017). Kinematics and significance of a poly-deformed crustal-scale shear zone in central to south-eastern Madagascar: the Itremo–Ikalamavony thrust. Int. J. Earth Sci. Geol. Rundsch 106, 2091–2108. doi:10.1007/s00531-016-1415-z
Göğüş, Ö. D., Avşar, E., Develi, K., and Çalık, A. (2024). The role of mineralogical and textural complexity in the damage evolution of brittle rocks. Sci. Rep. 14, 28641. doi:10.1038/s41598-024-79940-9
Hanfi, M. Y., Shahin, H. A. A., Masoud, M. S., Faraj, T. K., and Gawad, A. E. A. (2025). Assessment of environmental health risks from mylonite-derived gamma radiation: a petrographic and dosimetric study. J. Radioanal. Nucl. Chem. 334, 4907–4917. doi:10.1007/s10967-025-10198-9
Jin, S. Z., and Yuan, H. (2024). Determination of equivalent crack length for voids in metallic alloys based on continuum damage me-chanics modeling. Eng. Fract. Mech. 310, 110437. doi:10.1016/j.engfracmech.2024.110437
Li, C. Y., Z, G. M., Cheng, P., Xiangrui, M., Wensong, X., and Wenjie, L. (2025). Damage analysis and grading control technology of surrounding rock in high geo-stress roadway. Sci. Rep. 15, 1188. doi:10.1038/s41598-025-85647-2
Li, C., Yang, C., Ma, H., Zou, S., Yang, Z., Chen, R., et al. (2025). Fracture evolution and mechanical response of rocks under point load testing. Geotech. Geol. Eng. 43, 347. doi:10.1007/s10706-025-03310-z
Lindi, O. T., Aladejare, A. E., Ozoji, T. M., and Ranta, J. P. (2024). Uncertainty quantification in mineral resource estimation. Nat. Resour. 33, 2503–2526. doi:10.1007/s11053-024-10394-6
Liu, D. Q., He, M. C., and Cai, M. (2018). A damage model for modeling the complete stress-strain relations of brittle rocks under uniaxial compression. Int. J. Damage Mech. 27 (07), 1000–1019. doi:10.1177/1056789517720804
Liu, H., Zhao, J., and Zhu, W. (2021). Microcrack evolution and damage mechanism of granite under cyclic loading. Int. J. Rock Mech. Min. Sci. 142, 104780. doi:10.3390/en14196179
Liu, S., Li, P., Hu, K., and Zhao, L. (2023). Constitutive modeling of brittle–ductile transition in porous rocks: formulation, identification and simulation. Acta Mech. 234, 2103–2121. doi:10.1007/s00707-023-03489-3
Liu, D. Q., Guo, Y. P., Li, J. Y., Ling, K., Yang, Y. Y., and Zhang, S. D. (2023). Damage evolution and constitutive model of brittle rock under uniaxial compression based on acoustic emission. J. Chin. Univ. Min. Tech-nol 52 (04), 687–700. doi:10.1038/s41598-025-86437-6
Liu, W., Yin, S., Thanh, H. V., Soltanian, M. R., Yu, Q., Yang, S., et al. (2025). Advancements and development trend in statistical damage constitutive models for rock: a comprehensive review. Nat. Hazards 121, 3703–3744. doi:10.1007/s11069-024-06967-6
Lutz, B. M., and Axen, G. J. (2024). Mylonite, cataclasite, and gouge: reconstruction of mechanical heterogeneity along a low-angle normal fault: death valley, USA. J. Struct. Geol. 183, 105132. doi:10.1016/j.jsg.2024.105132
Ma, R., Cao, Q., Lu, S., Zhao, D., Zhang, Y., and Xu, H. (2024). Effect of burial depth of a new tunnel on the seismic response of an existing tunnel. Earth Q. Eng. Eng. Vib. 23, 863–882. doi:10.1007/s11803-024-2277-1
Mirzaei, A. M., Mirzaei, A. H., Sapora, A., and Cornetti, P. (2025). Strain based finite fracture mechanics for fatigue life prediction of additively manufactured samples. Int. J. Fract. 249, 44. doi:10.1007/s10704-025-00855-1
Mishra, P. K., Behera, B. M., and Mahapatro, S. N. (2022). Clast size analysis of pseudotachylite co-existing with mylonite: constraints on evolution of Mahanadi Shear Zone, Eastern Ghats Mobile Belt, India. J. Earth Syst. Sci. 131, 99. doi:10.1007/s12040-022-01856-7
Ran, Yh., Li, Hb., Xu, St, Yu, Z. c., and Yang, X. g. (2024). Construction simulation and scheme optimisation of complex underground cavities. Sci. Rep. 14, 20879. doi:10.1038/s41598-024-71515-y
Sharma, R., and Gales, P. (2025). “Deep-sea mining: resource potential and future prospects,” in Deep-Sea mining management, Policy and regulation. Editor R. Sharma (Cham: Springer). doi:10.1007/978-3-031-92737-9_1
Sigue, C., Suh, C. E., and Mbongue, J. L. N. (2023). Structural and microstructural evolution of Etam Shear Zone in the Central African fold belt, SW-Cameroon: implication of hydrothermal syn-tectonic quartz vein formation. Arab. J. Geosci. 16, 341. doi:10.1007/s12517-023-11438-6
Wang, J., He, M., Yuan, Z., Luo, B., and Ma, X. (2023). Ductile-brittle failure transition of rocks in process of drilling with high confining pressure: model and experiment. Geoenergy Sci. Eng. 223, 211505. doi:10.1016/j.geoen.2023.211505
Wu, L. Y., Wang, Z. F., Ma, D., Zhang, J. w., Wu, G., Wen, S., et al. (2022). A continuous damage statistical constitutive model for sandstone and mudstone based on triaxial compression tests. Rock Mech. Rock Eng. 55 (8), 4963–4978. doi:10.1007/s00603-022-02924-6
Yang, W., Wang, B., Yao, J., Ranjith, P. G., and Zhang, X. (2025). Experimental study on the physical and mechanical properties of carbonatite rocks under high confining pressure after thermal treatment. Deep Undergr. Sci. Eng. 4 (4), 105–118. doi:10.1002/dug2.12079
Yemdji, B. R. S., Kouémo, J. T., Fozing, E. M., Megnemo, L. A., Awoum, J. E., Tchuifong, A. B. K., et al. (2023). Kinematic evolution of the Nyakong-Manyi shear Zone (Adamawa, Cameroon): constraints from field observations and microstructures, and implication for metamorphic P-T-t estimation. J. Earth Sci. 34, 1465–1487. doi:10.1007/s12583-023-1816-4
Zhang, C., Yang, C. Q., and Bai, Y. (2021). Investigation of damage evolution and its model of rock-like brittle materials. Rock Soil Mech. 42 (09), 2344–2354. doi:10.16285/j.rsm.2021.0278
Zhou, Y., Yang, W., Zhao, L., You, Z., Tian, H., Zhang, L., et al. (2023). Research on reasonable reserved deformation and height-span ratio of a large deformation tunnel section in high geo-stress soft rock near a fault zone: a case study. Bull. Eng. Geol. Environ. 82, 378. doi:10.1007/s10064-023-03407-w
Keywords: mylonite, triaxial compression, brittle mechanical behavior, constitutive model, damage degree, brittleness index
Citation: Peng G, Lin W and Zhao M (2025) Brittle mechanical behavior and damage constitutive model of deep mylonite under the high geo-stress state. Front. Earth Sci. 13:1708288. doi: 10.3389/feart.2025.1708288
Received: 18 September 2025; Accepted: 24 October 2025;
Published: 13 November 2025.
Edited by:
Binbin Yang, Xuchang University, ChinaReviewed by:
X Lin, Sun Yat-sen University, ChinaQiang Yuan, Guangdong Zhonggong Architectural Design Institute Co., Ltd., China
Copyright © 2025 Peng, Lin and Zhao. This is an open-access article distributed under the terms of the Creative Commons Attribution License (CC BY). The use, distribution or reproduction in other forums is permitted, provided the original author(s) and the copyright owner(s) are credited and that the original publication in this journal is cited, in accordance with accepted academic practice. No use, distribution or reproduction is permitted which does not comply with these terms.
*Correspondence: Wei Lin, anh5a2p6eHk2NjZAMTYzLmNvbQ==