 Yubo Lan1,2
 HaoQiang Wu
- 1Exploration and Development Research Institute of Daqing Oilfield Co. Ltd., Daqing, China
- 2Heilong jiang Provincial Key Laboratory of Reservoir Physics & Fluid Mechanics in Porous Medium, Daqing, China
- 3China University of Geosciences, Wuhan, China
Both field practices and laboratory experiments in mature, high water-cut oilfields have confirmed that long-term water flooding dynamically alters rock wettability and micro-pore structure, causing shifts in relative permeability curves and reservoir properties. Conventional numerical simulations, by directly applying core-scale dynamic laws, neglect the scale effect from core to grid and inherent reservoir heterogeneity, leading to inaccurate predictions of remaining oil distribution. To address this, we propose an upscaling method for modeling the dynamic evolution of relative permeability. Based on volume averaging theory, the method first establishes a local empirical model from core data and then introduces a Gamma distribution to represent intra-grid heterogeneity. By performing a probability-weighted average, a concise, closed-form analytical model is derived for grid-scale parameter evolution. The model explicitly links the macroscopic dynamic response to log-permeability variance (σk2) and cumulative water injection. Applied to a typical block in the Daqing Oilfield, the new method provides a more accurate history match of water cut and pressure than conventional models. More importantly, it predicts a more dispersed remaining oil distribution, correcting the overestimation of oil in preferential channels. The primary contribution of this work is the derivation of a novel, closed-form analytical model for upscaling time-varying properties. This physically grounded and computationally efficient method provides a rigorous framework to bridge the critical gap between core-scale physics and grid-scale simulation, representing a significant methodological advance for accurately modeling mature reservoirs.
1 Introduction
Many of the world’s major oilfields have entered their mature development stage, where the primary challenge is to enhance oil recovery from reservoirs with an extra-high water cut (Ji et al., 2023). In this context, accurately characterizing the distribution of remaining oil becomes paramount for sustaining production and optimizing development strategies (Yu et al., 2024). Numerical reservoir simulation stands as an indispensable tool for this purpose, enabling the quantitative evaluation of residual oil saturation and guiding subsequent operational adjustments (Deng et al., 2025). The efficacy of these simulations is directly linked to their ability to capture the dynamic variation of residual oil under different displacement conditions, such as varying water drive velocities (Sun et al., 2023). Consequently, the predictive accuracy of simulation models, whether for conventional reservoirs or complex fractured-vuggy systems, is fundamentally contingent upon the precise representation of multiphase flow physics through its governing parameters (Hou et al., 2016). This challenge extends across various subsurface engineering disciplines, from modeling slurry diffusion in mining-induced fractures (Zheng et al., 2025) to understanding the geomechanical responses leading to rock bursts (Cao et al., 2025). Among these, relative permeability curves are traditionally assumed to be static, a simplification that is increasingly being challenged by field evidence.
This static assumption is proving to be a significant limitation, as a growing body of evidence indicates that long-term fluid injection can alter reservoir properties. This has spurred a paradigm shift towards integrated models that incorporate time-varying parameters, such as permeability, to achieve more reliable performance forecasting (Cui et al., 2025; Xu et al., 2015). For instance, recent simulation methods for polymer flooding have demonstrated the necessity of considering time-varying relative permeability to accurately model the process (Zhou et al., 2024). This phenomenon is not limited to water or polymer flooding; time-varying characteristics of relative permeability have also been observed during gas injection processes (Liao et al., 2024). Such dynamic behavior can be conceptualized through memory-based approaches, where the current state of fluid flow through the porous medium is dependent on its entire displacement history (Hashan et al., 2020). Implementing this concept, novel simulation methods for high water-cut stages have shown that basing models on time-varying relative permeability curves significantly improves accuracy (Ke et al., 2020). The foundational principle is that simulations should be built upon the time-variability of formation parameters (Shao-xian, 2012), as various physical properties evolve dynamically in response to long-term production and injection activities (Jiang et al., 2021).
However, a predominant weakness in current time-varying models is the direct application of core-scale experimental findings to meter-scale simulation grid blocks, a practice that overlooks fundamental issues of scale and heterogeneity. While advanced methods exist for characterizing fine-scale petrophysical layering from logging data (Liu, 2020; Zhan, 2024) and for modeling the complex physical responses of such heterogeneous, anisotropic porous media (Zhan, 2021). The transition from core-to field-scale models is a well-recognized challenge that requires robust upscaling procedures, as seen in fields like long-term CO2 storage assessment (Boison et al., 2025). While digital core analysis can improve reservoir characterization, its utility depends on how well this fine-scale information is integrated into field-scale models (Aslannezhad et al., 2025). Large-scale numerical models are essential, but their predictive power is compromised if the effective properties of grid blocks do not adequately represent the underlying sub-grid physics (AlKhatib et al., 2024). This discrepancy arises because complex multiphase flow phenomena are governed by micro- and nanoscale effects that are implicitly averaged out in conventional simulations (Cai et al., 2024). Even sophisticated large-scale simulation algorithms rely on these effective properties being physically representative (Shi et al., 2024). The necessity of proper upscaling is particularly evident in complex systems, such as fractured reservoirs, where coupling fine-scale physics with coarse-grid models is critical (Zhong and Leung, 2024). This persistent challenge of bridging core-scale experiments to reservoir-scale models remains a key area of research (Ahmadi et al., 2024), as information from advanced imaging and small-scale analysis must be translated through multi-scale simulation frameworks to be meaningful at the field level (Meng et al., 2024).
Furthermore, while numerous upscaling techniques exist, they are predominantly designed for static reservoir properties. Methods such as flow-based numerical upscaling or analytical averaging are effective at calculating a single, equivalent representation of permeability or relative permeability for a heterogeneous block under fixed conditions. However, they are fundamentally ill-equipped to address the central challenge of this study: the temporal evolution of these properties. The dynamic changes are driven by local flow history, which varies significantly at the sub-grid scale. A simple re-application of static upscaling methods at discrete time intervals is not only computationally prohibitive but also fails to capture the integrated effect of the continuous, non-uniform property evolution. What is required—and what existing methods lack—is a framework that directly upscales the dynamic evolution law itself, deriving an effective, history-dependent model for the coarse grid block. This critical methodological gap is precisely what our work aims to fill.
To bridge the critical gap between core-scale physics and grid-scale simulation, this paper introduces a novel upscaling-based methodology that culminates in a closed-form analytical model for grid-scale relative permeability evolution. Grounded in volume averaging theory, our approach explicitly accounts for sub-grid heterogeneity by modeling the grid block as a statistical ensemble of parallel stream tubes, whose permeability follows a Gamma probability distribution. By performing a probability-weighted average of the core-derived dynamic laws across this distribution, we derive an effective evolution model for the entire grid block. Finally, the proposed model is embedded into a numerical simulator and validated against field data from a typical high water-cut block in the Daqing Oilfield, demonstrating its superiority over conventional methods in history matching and remaining oil prediction. A comparative analysis against traditional static models and direct core-scale dynamic models is conducted to validate its superiority in history matching and its impact on remaining oil prediction. This work provides a more physically consistent framework for simulating mature reservoirs and offers a more robust theoretical foundation for optimizing development strategies in fields facing high water-cut challenges.
2 Materials and methods
This section delineates the theoretical and computational framework developed to simulate the dynamic evolution of reservoir properties while accounting for scale effects. The methodology is systematically presented in two principal sections. The first section establishes the rigorous theoretical foundation for this model. It details the derivation of an analytical solution that translates core-scale dynamic laws into effective grid-scale responses by incorporating sub-grid heterogeneity. The subsequent section describes the integration of this upscaled model into a numerical reservoir simulator, outlining the workflow for dynamically updating flow functions during simulation.
2.1 Upscaling methodology for time-varying reservoir properties
The conventional practice of directly applying core-scale (cm-scale) dynamic property correlations to grid-scale (m-scale) reservoir simulation is fundamentally flawed, as it neglects the profound impact of sub-grid heterogeneity. A simulation grid block represents a volumetric average of a complex rock volume containing a distribution of properties, wherein fluid flow preferentially follows high-permeability pathways. Consequently, the local cumulative water throughput can vary by orders of magnitude within a single grid block, leading to a highly non-uniform evolution of rock-fluid properties. To address this challenge, we have developed a rigorous upscaling methodology to derive the effective time-varying relative permeability curves at the grid-block scale. The theoretical framework, outlined in Figure 1, conceptualizes a heterogeneous grid block as a bundle of parallel, non-communicating stream tubes, each with a distinct permeability but subject to the same pressure drop.
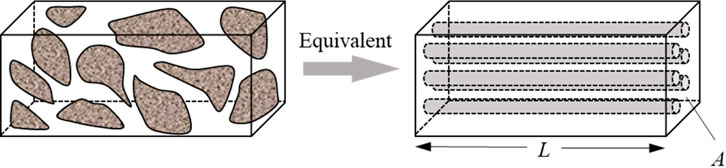
Figure 1. Simplified core model.
The key assumptions and definitions underpinning this framework are as follows:
Macroscopic Grid Block: The model considers a grid block of length L and total cross-sectional area A (Equation 1). Its total pore volume (Vp) is defined by the average porosity ϕ:
The grid-average cumulative pore volumes of injected water, PVgrid, is the primary independent variable driving the dynamic changes, calculated as the total volume of water injected (Winj) divided by the total pore volume (Equation 2):
Microscopic Stream tubes: The macroscopic grid block is treated as a collection of N parallel stream tubes, each of length L. The ith stream tube possesses a distinct cross-sectional area ai and permeability ki, while porosity ϕ is assumed to be uniform for simplicity. The sum of the stream tube areas equals the total grid block area (Equation 3):
Each streamtube has its own local pore volume, Vp,i, and experiences a local cumulative water throughput, PVi.
It is important to acknowledge that the assumption of non-communicating stream tubes is a first-order approximation. This conceptual model is most accurate for reservoirs where the sub-grid heterogeneity is strongly stratified, and vertical flow is minimal compared to horizontal flow. In reservoirs with more random, isotropic heterogeneity, cross-flow between layers of different permeability would occur, leading to some degree of pressure equalization and flow redistribution. This cross-flow would tend to homogenize the water throughput distribution slightly, meaning our model, by neglecting it, may represent a bounding case that slightly overestimates the impact of heterogeneity (i.e., the retardation effect). However, this simplification is crucial for preserving the analytical tractability of the upscaling problem, allowing for the derivation of a computationally efficient, closed-form solution. The good agreement between our model’s predictions and the field data (Section 4) suggests that this simplification provides a reasonable and effective approximation for the system under study.
Governing Local Law: The experimentally derived, core-scale dynamic laws are assumed to be valid at the microscopic scale of each individual stream tube.
The derivation begins by defining the dynamic behavior at the local (core) scale, which is assumed to be governed by an exponential decay model based on laboratory observations. The change in residual oil saturation and maximum water relative permeability as a function of local cumulative pore volumes of water injected (PV) is given by:
To account for sub-grid heterogeneity, the permeability distribution within a grid block is modeled using a Gamma probability distribution function (PDF), which is characterized by a shape parameter α and a scale parameter β:
While the log-normal distribution is also commonly used to describe permeability, the Gamma distribution was selected for two primary reasons. First, and most critically for our upscaling framework, the Gamma distribution’s mathematical form allows for the direct analytical integration of our exponential decay laws (Equations 4, 5), resulting in the concise, closed-form solutions for the effective properties (Equations 10, 12). Using a log-normal distribution would not permit such an elegant analytical solution and would necessitate computationally intensive numerical integration for every grid block at every time step, defeating a key advantage of our approach. Second, the two-parameter Gamma distribution (α, β) is highly flexible and can be uniquely parameterized by the mean (K) and variance (σ2) of the permeability, providing a robust and practical representation of the sub-grid statistical moments. For many permeability distributions encountered in practice, the Gamma and log-normal shapes are remarkably similar, especially when characterized by their mean and variance. Therefore, the Gamma distribution offers the best compromise between physical representativeness and the mathematical tractability required to derive an efficient, analytical upscaling model.
These distribution parameters can be directly related to the grid block’s average permeability K and the permeability variance σ2, which serves as a quantitative measure of heterogeneity (Equation 8):
Under the parallel flow assumption, the local cumulative throughput in a streamtube with permeability ki is proportional to the grid-average cumulative throughput PVgrid, weighted by its relative permeability: PVi≈(ki/K)PVgrid. By performing a probability-weighted average of the local responses across the entire permeability distribution, we can derive the effective grid-block scale properties. The effective residual oil saturation, Sor,eff is a pore-volume-weighted average, which mathematically translates to an expectation over the permeability PDF:
Substituting the exponential core-scale law and the Gamma PDF into this integral yields a closed-form analytical solution (The detailed derivation is provided in Appendix A):
Similarly, the effective maximum water relative permeability, krw,max,eff is a flow-weighted average, as higher permeability zones contribute more significantly to the total conductivity. The governing integral is:
This integral also yields a concise analytical solution:
These derived analytical models explicitly link the macroscopic dynamic response to the core-scale behavior and the sub-grid heterogeneity (σ2), providing a computationally efficient and physically robust method for upscaling time-varying properties.
2.2 Engineering workflow for model application
The analytical models derived in the previous section are translated into a practical workflow to generate the necessary inputs for dynamic reservoir simulation. This process ensures that the theoretically sound upscaling is consistently applied to the reservoir model. The workflow comprises the following three steps:
Parameter Acquisition and Characterization: The first step involves gathering the two sets of parameters required by the analytical models.
Core-Scale Dynamic Parameters: The parameters defining the local-scale evolution laws (Sor,ini,Sor,ult,λsor,krw,ini,krw,ult,λkrw) are obtained by fitting the exponential models (Equations 4, 5) to data from long-term core-flooding experiments.
Grid-Scale Heterogeneity Parameters: For each distinct rock type or region, a comprehensive reservoir characterization workflow is employed. This process integrates “hard” data from core plugs and advanced well logs (e.g., NMR, formation imaging) with “soft” data derived from 3D seismic attributes. These disparate data sources are then unified through geostatistical algorithms, such as sequential Gaussian simulation or kriging, to construct a high-resolution 3D geological model. From this detailed model, the essential parameters required by our upscaling framework—the average permeability (K) and the permeability variance (σ2)—are directly calculated for each region. This ensures that the sub-grid heterogeneity captured in our model is a direct reflection of the underlying geology as interpreted from all available state-of-the-art data.
Generation of Upscaled Dynamic Lookup Tables: With all parameters defined, the analytical upscaling models (Equations 10, 12) are employed in a pre-processing step. For each rock type, the models are evaluated over a predefined range of grid-average cumulative pore volumes injected (PVgrid), such as from 0 to 1000 PV. This calculation produces a set of lookup tables that map the macroscopic stimulus (PVgrid) to the macroscopic response—the effective endpoints Sor,eff and krw,max,eff. These tables encapsulate the unique dynamic behavior of each rock type, conditioned by its specific level of heterogeneity.
Integration into Simulation Input: The final step involves formatting these generated lookup tables into a format readable by the reservoir simulator. These tables serve as the primary input for the time-varying property module. Instead of a single static relative permeability curve, the simulator is now equipped with a set of dynamic rules that dictate how the curves should evolve based on the local flow history of each grid block.
2.3 Numerical simulation framework with upscaled dynamic properties
The upscaling methodology was integrated into an in-house, fully implicit, three-phase black-oil reservoir simulator to enable the dynamic evolution of reservoir properties. The implementation architecture, depicted in Figure 2, embeds a time-varying property module directly into the simulator’s main computational loop, allowing for the consistent update of fluid flow parameters at each time step.
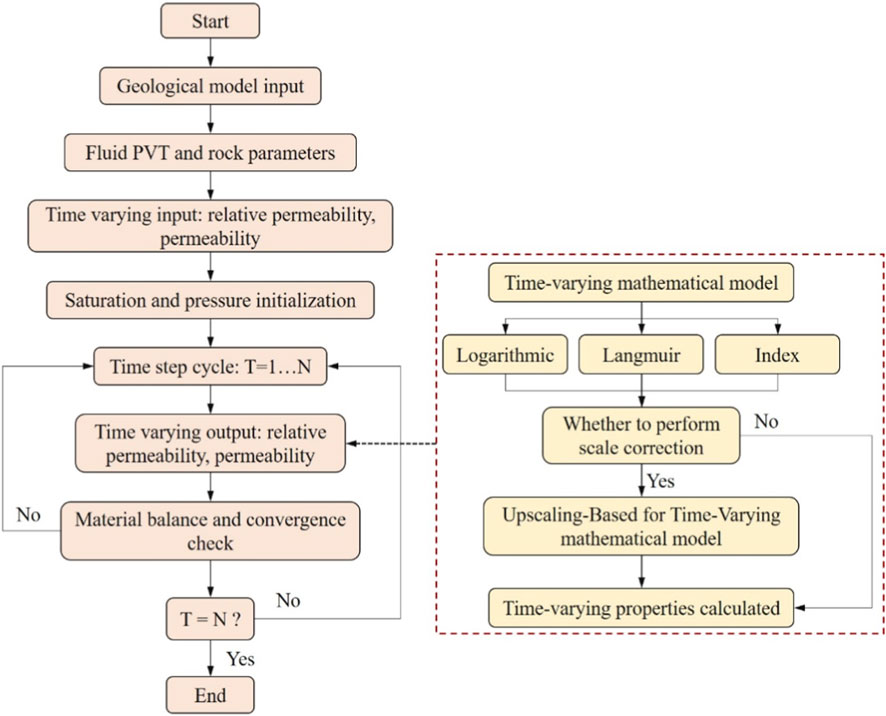
Figure 2. Numerical simulation framework with upscaled dynamic properties.
The simulation workflow begins with the initialization of static properties and the input of time-varying model parameters. These parameters include the initial and ultimate values for the evolving properties (e.g., Sor,ini, Sor,ult), their characteristic decay constants (e.g., λsor), and the heterogeneity parameter (σ2) for each grid block or rock type. The simulation then proceeds through a time-stepping loop. At the beginning of each new time step, the time-varying property module is invoked.
Within this module, a specific sequence of operations is executed for every active grid block. First, a triggering variable, the cumulative pore volumes of water flushed through the block (PVgrid), is updated based on the flux calculations from the previously converged time step. Specifically, for each grid block i, the value at the new time step,
where Vp,i is the pore volume of grid block i,
This updated PVgrid value, along with the pre-defined grid block properties (K, σ2) and the core-scale law parameters, are used as inputs for the analytical upscaling models (Equations 7, 9). The models are executed to compute the new, upscaled effective endpoints, Sor,eff and krw,max,eff, for the current time step.
These dynamically calculated endpoints are then used to reconstruct the full relative permeability curves for the grid block. The updated relative permeability functions and their derivatives with respect to saturation and pressure are subsequently passed to the core solver. The solver uses this information to assemble the Jacobian matrix for the system of discretized governing equations. The fully implicit formulation ensures that the strong coupling between pressure, saturation, and the history-dependent rock properties is handled robustly within the Newton-Raphson iterative scheme to solve for the state variables at the end of the time step. This integrated framework ensures that the simulation captures the feedback between fluid flow and property evolution in a physically consistent manner, honoring the critical scale effects dictated by reservoir heterogeneity.
Regarding numerical performance, the dynamic updating of relative permeability curves introduces additional non-linearity into the system, which can potentially affect Newton-Raphson convergence. To ensure robustness, the derivatives of the effective endpoints (Sor,eff and krw,max,eff) with respect to the primary variables (pressure and saturation, via the PVgrid variable) were analytically derived and included in the Jacobian matrix assembly. This ensures that the strong coupling between flow and property evolution is handled implicitly, which is critical for stability. In our case study, we observed that for the majority of the simulation period, the convergence behavior was comparable to the static case, requiring a similar number of Newton iterations per time step. However, during periods of rapid operational changes (e.g., a sharp increase in injection rates), which caused an accelerated evolution of PVgrid, the simulator’s adaptive time-stepping algorithm occasionally reduced the time step size to maintain convergence. This behavior is expected and demonstrates that the fully implicit formulation is robustly handling the heightened non-linearity. Overall, the computational overhead introduced by the dynamic property module was minimal, adding less than 5% to the total simulation runtime.
3 Experiments and case study
This section details the experimental foundation for the dynamic property models and describes the geological and engineering setup of the field case used for model validation.
3.1 Experimental basis for dynamic property models
The core-scale dynamic laws, which form the basis of our simulation inputs, were derived from an extensive series of unsteady-state core flooding experiments conducted on core samples from the Daqing Oilfield. These experiments were designed to quantify the impact of varying interstitial flow velocities on both absolute and relative permeability.
The experiments revealed a distinct relationship between the interstitial flow velocity (v) and the rate of change in absolute permeability (Dvn). As shown in Figure 3, for cores with initial permeability below 300 mD, permeability initially decreased before stabilizing, whereas for cores above 300 mD, permeability first increased and then plateaued. This complex behavior was found to be well-described by a Langmuir-type isotherm (Equation 14):
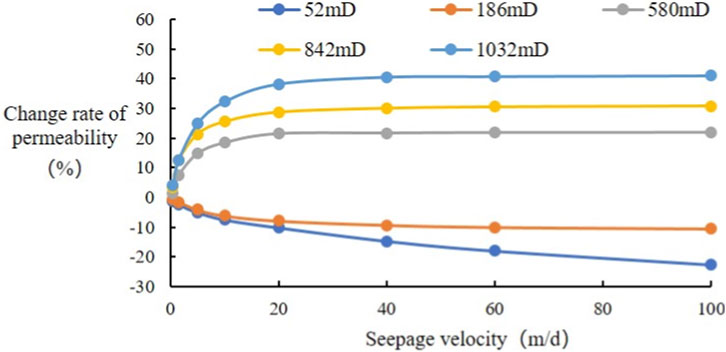
Figure 3. The relationship between permeability and flow velocity obtained from different core tests.
Crucially, regression analysis showed that the Langmuir coefficients, a and b, are not constants but exhibit a strong linear correlation with the initial rock permeability, k. By establishing these linear relationships and substituting them back into the Langmuir equation, a generalized mathematical model was developed. This model can predict the rate of permeability change for any given rock type based on its initial permeability k and the instantaneous flow velocity v (Equation 15):
The same experiments demonstrated that relative permeability endpoints are also sensitive to flow velocity (Figure 4).

Figure 4. The relationship between residual oil saturation, maximum water phase permeability and cumulative flux.
The change in residual oil saturation (ΔSor) was found to follow a logarithmic relationship with velocity, while the change in the endpoint water relative permeability (ΔKw(Sor)) conformed to a Langmuir model. Similar to the absolute permeability case, the coefficients of these models were linearly correlated with the initial absolute permeability, k. This allowed for the formulation of two generalized models to describe the dynamic behavior of relative permeability endpoints. The model for the change in residual oil saturation is given by Equation 16:
The model for the change in endpoint water relative permeability is Equation 17:
These experimentally-derived models provide the fundamental core-scale physics that are subsequently integrated into the upscaling framework and numerical simulation.
3.2 Reservoir model and problem setup
To validate the proposed methodology, a case study was conducted on a typical high water-cut sector block from the Daqing Oilfield. The sector model, shown in Figure 5, is characterized by significant heterogeneity, with permeability ranging from near zero to over 360 mD. The model is discretized into a 113 × 80 × 5 grid system, with each grid block measuring 50 m × 50 m × 4 m. The primary development pattern consists of multiple five-spot injection-production well groups (Table 1).
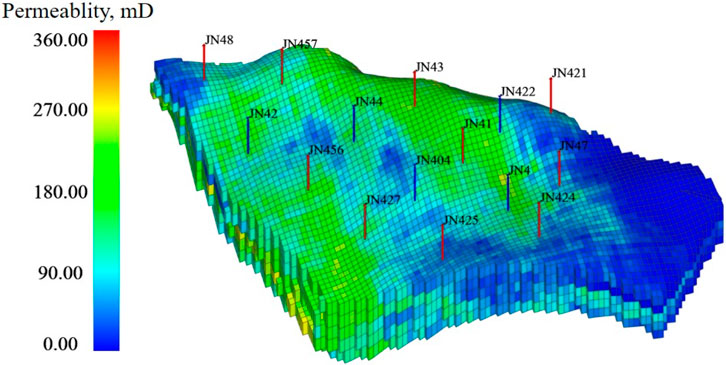
Figure 5. Geological model and wells distribution.
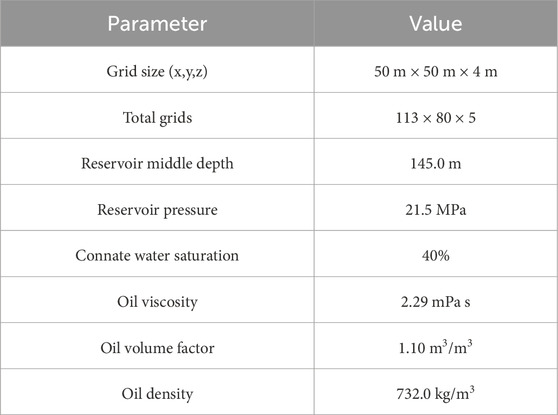
Table 1. Reservoir model information.
The key reservoir properties, fluid characteristics, and initial conditions are summarized in Table 1. The reservoir is at an initial pressure of 21.5 MPa, with a moderate oil viscosity of 2.29 mPas. The base-case relative permeability curves used in the conventional static simulation are also presented in Figure 6. This comprehensive dataset provides a robust basis for comparing the performance of the conventional simulation approach against our new dynamic methodology.
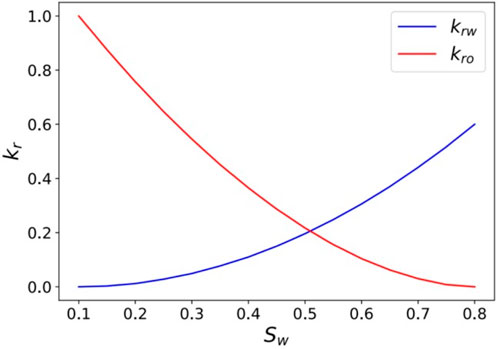
Figure 6. Original relative permeability curve.
Table 2 explicitly lists the core-scale dynamic parameters (Sor,ini, Sor,ult, λsor, etc.) and the grid-scale heterogeneity parameters (K, σ2) that were derived from experimental data and geological models and used as inputs for both the conventional and our new dynamic simulation models.
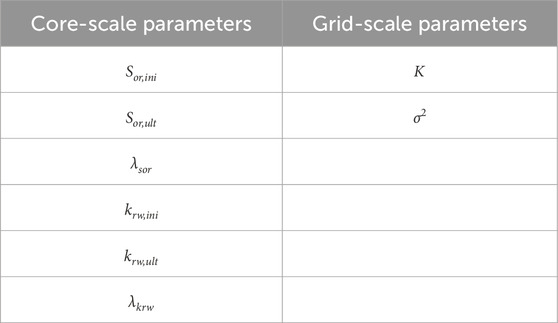
Table 2. Key parameters for dynamic property models in the case study.
4 Results and analysis
To evaluate the efficacy of the proposed methodology, we conducted comparative simulation runs for the Daqing model. The results from the conventional model (using static properties) were compared against those from the new dynamic model (incorporating the upscaled time-varying relative permeability and velocity-dependent absolute permeability).
4.1 Impact of time-varying relative permeability
Figure 7 presents a temporal comparison of the predicted oil saturation distribution between the static and dynamic models. A clear distinction emerges in the water-flooding front and sweep efficiency. The conventional model (top row) exhibits more pronounced viscous fingering, with injected water preferentially breaking through high-permeability channels, leaving significant volumes of unswept oil in adjacent, lower-permeability regions. In contrast, the dynamic model that considers scale effects (bottom row) predicts a more piston-like and uniform displacement front. This is because the dynamic alteration of relative permeability in the highly flushed zones improves the local mobility ratio, diverting more fluid into previously bypassed areas. Consequently, the dynamic model predicts a more dispersed remaining oil distribution and suggests a higher ultimate sweep efficiency. This observation is further confirmed in the layer-specific view (Z > 3) shown in Figure 8, where the dynamic model achieves a more thorough sweep in the high-permeability layer.
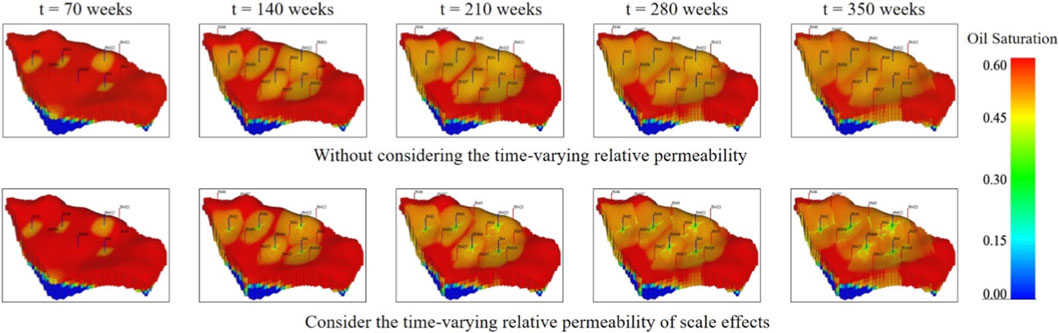
Figure 7. With and without the time-varying relative permeability of scale effects for oil saturation.
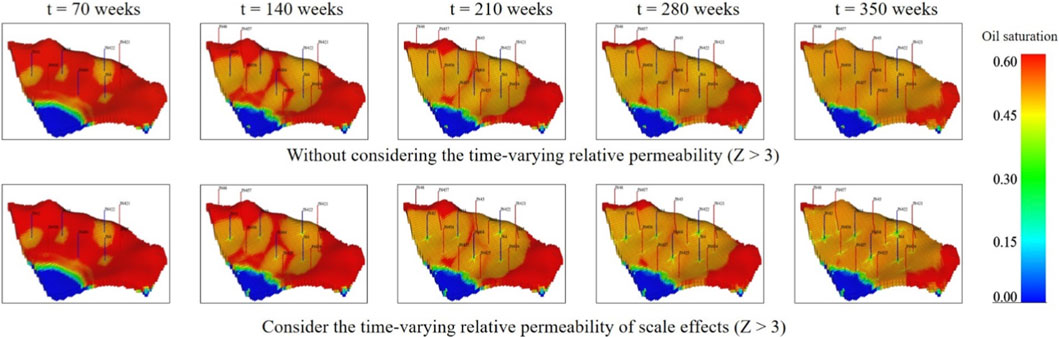
Figure 8. With and without the time-varying relative permeability of scale effects for oil saturation (Z > 3).
The superiority of the dynamic model is quantitatively demonstrated through the history matching of production data for key wells. Figure 9 shows the oil production rate comparison. For the majority of wells (e.g., JN43, JN427, JN457), the dynamic model (purple curve) provides a significantly better match to the historical production decline trend compared to the static model (red curve).

Figure 9. With and without the time-varying relative permeability of scale effects for oil rate in wells.
The improvement in water cut prediction is equally evident, as shown in Figure 10. The dynamic model more accurately captures the timing of water breakthrough and the subsequent rate of water cut increase, particularly in wells like JN48 and JN425. The conventional model often predicts a premature breakthrough and an overly steep rise in water cut, which is a direct consequence of its inability to account for the physical changes that retard water movement in highly swept zones. Overall, the consistent improvement across both oil rate and water cut profiles confirms that the inclusion of upscaled, time-varying relative permeability leads to a more physically realistic and predictive simulation.
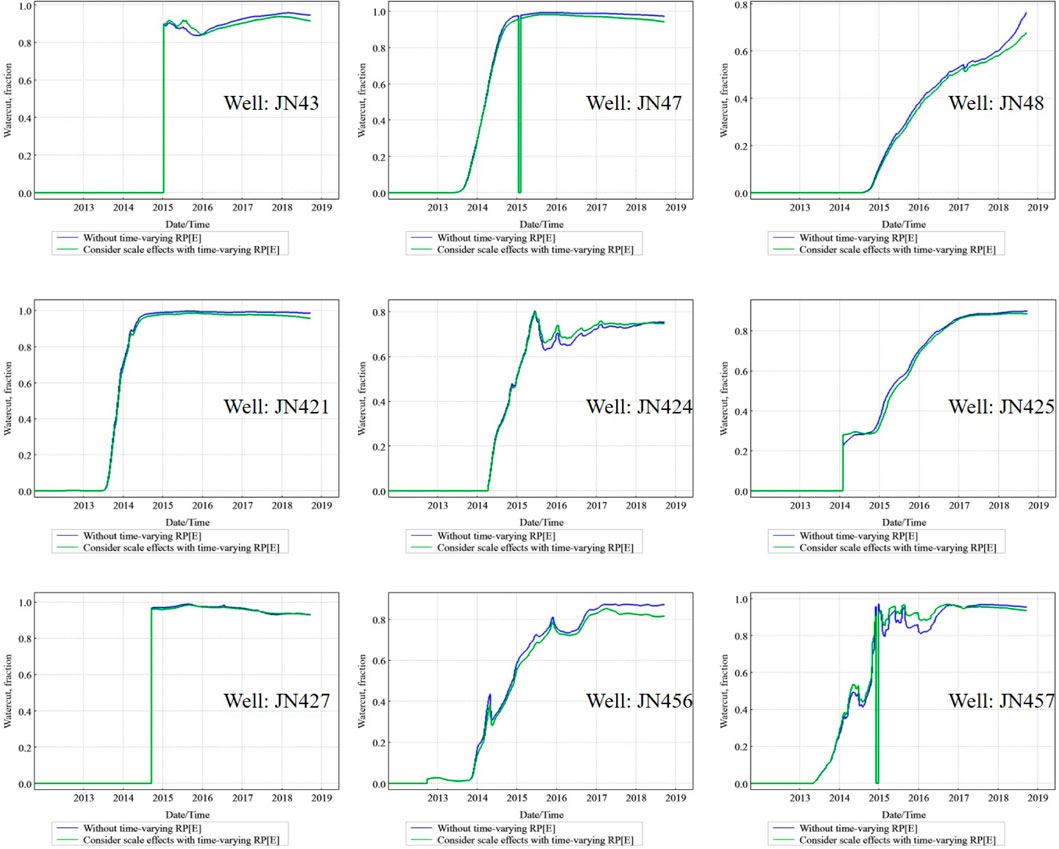
Figure 10. With and without the time-varying relative permeability of scale effects for water-cut in wells.
4.2 Impact of time-varying absolute permeability
In a separate analysis, the effect of velocity-dependent absolute permeability was investigated. While its impact on oil and water production rates was found to be less pronounced than that of relative permeability, it exerted a significant influence on the pressure response of the wells. Figure 11 compares the simulated bottom-hole pressure (BHP) from the static model against a dynamic model incorporating the time-varying absolute permeability. The latter provides a superior fit because it more accurately reflects the reservoir’s true fluid-dynamic behavior, resulting in a substantially better match to the historical pressure data across nearly all wells. It robustly captures the pressure fluctuations corresponding to changes in well operating conditions, which alter the local flow velocities. This is physically consistent, as changes in absolute permeability directly influence the pressure gradient required to sustain a given flow rate. This result highlights the importance of incorporating dynamic absolute permeability for accurate pressure transient analysis and injectivity/productivity forecasting, proving it is a critical component even when its effect on fluid rates is secondary.
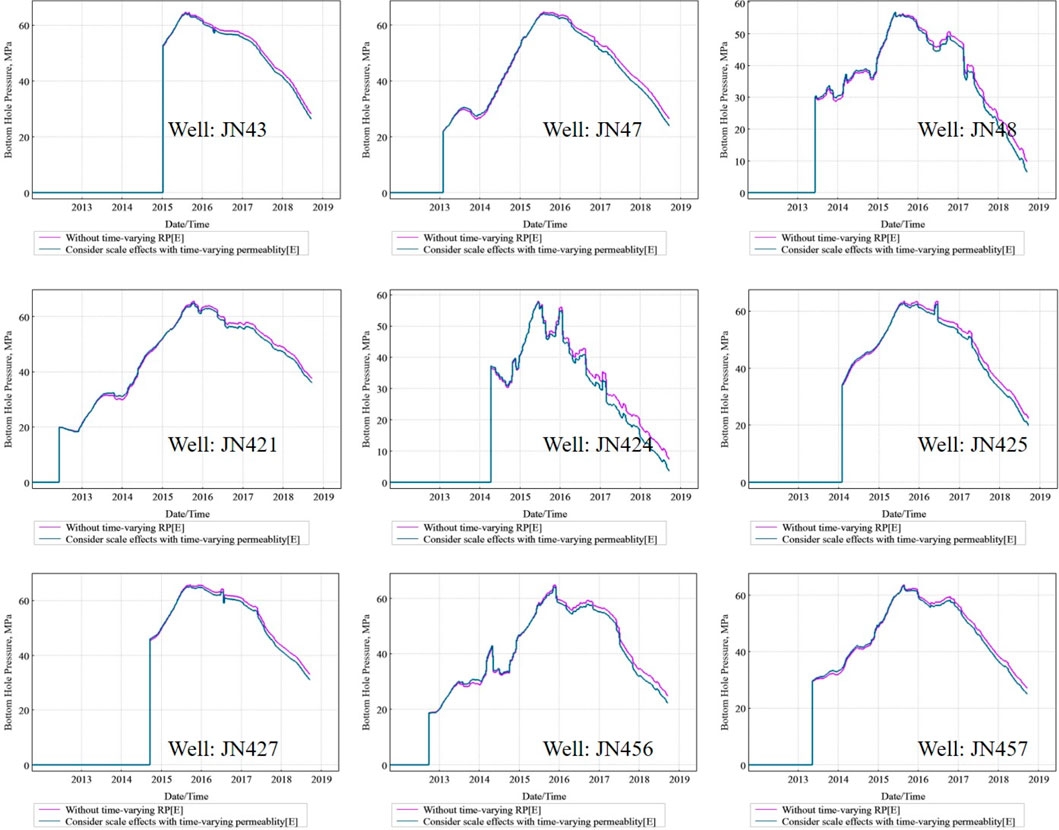
Figure 11. With and without the time-varying permeability of scale effects for bottomhole pressure in wells.
5 Conclusion
This study successfully addressed the critical limitations of conventional reservoir simulation in high water-cut oilfields by developing and validating a novel upscaling methodology for time-varying rock-fluid properties. By conceptualizing a heterogeneous grid block as a statistical ensemble of simpler flow units, we derived a rigorous analytical model that explicitly links the grid-scale dynamic evolution of relative permeability to sub-grid heterogeneity.
A robust analytical model for upscaling time-varying relative permeability was established. Based on volume averaging theory and assuming a Gamma distribution for sub-grid permeability, a closed-form analytical solution was derived. This model quantitatively reveals the critical role of heterogeneity in governing the macroscopic dynamic response. It demonstrates that stronger heterogeneity (i.e., a larger permeability variance) induces a “retardation effect,” causing the effective grid-scale properties to evolve more slowly and gradually than predicted by the core-scale dynamic law.
The proposed dynamic simulation model demonstrated superior performance in history matching. When applied to the Daqing field case, the model incorporating the upscaled time-varying properties achieved a significantly more accurate match of historical production data. It provided a better fit for oil production rates, water cut evolution, and, notably, the bottom-hole pressure profiles when coupled with a velocity-dependent absolute permeability model. This validates the necessity of accounting for both dynamic property evolution and scale effects to reliably simulate the long-term performance of mature reservoirs.
Data availability statement
The original contributions presented in the study are included in the article/supplementary material, further inquiries can be directed to the corresponding author.
Author contributions
YL: Conceptualization, Data curation, Formal Analysis, Investigation, Methodology, Project administration, Writing – original draft, Writing – review and editing. SD: Conceptualization, Data curation, Investigation, Methodology, Writing – original draft. LS: Conceptualization, Investigation, Software, Supervision, Validation, Writing – original draft. SC: Conceptualization, Data curation, Formal Analysis, Methodology, Project administration, Writing – original draft. HW: Conceptualization, Data curation, Formal Analysis, Investigation, Writing – original draft.
Funding
The authors declare that financial support was received for the research and/or publication of this article. We thank Daqing Oilfield and China University of Geosciences for geological models and suggestions. This work is supported by the National Key R&D Project of “Research and Development of Geological Resource Precision Development Risk Prediction Big Data Analysis Platform”, Fund No. 2022YFF0801203.
Conflict of interest
Authors YL, SD, LS, and SC were employed by Exploration and Development Research Institute of Daqing Oilfield Co. Ltd.
The remaining authors declare that the research was conducted in the absence of any commercial or financial relationships that could be construed as a potential conflict of interest.
Generative AI statement
The authors declare that no Generative AI was used in the creation of this manuscript.
Any alternative text (alt text) provided alongside figures in this article has been generated by Frontiers with the support of artificial intelligence and reasonable efforts have been made to ensure accuracy, including review by the authors wherever possible. If you identify any issues, please contact us.
Publisher’s note
All claims expressed in this article are solely those of the authors and do not necessarily represent those of their affiliated organizations, or those of the publisher, the editors and the reviewers. Any product that may be evaluated in this article, or claim that may be made by its manufacturer, is not guaranteed or endorsed by the publisher.
References
Ahmadi, M., Hou, Q., Wang, Y., and Chen, Z. (2024). Experimental and numerical modeling of a novel surfactant flooding: core scale to reservoir models. Chem. Eng. Res. Des. 204, 32–52. doi:10.1016/j.cherd.2024.02.029
AlKhatib, K., Hashash, Y. M. A., and Ziotopoulou, K. (2024). Seismic behavior of shallow buried water reservoirs via large scale three-dimensional numerical models. Soil Dyn. Earthq. Eng. 187, 109005. doi:10.1016/j.soildyn.2024.109005
Aslannezhad, M., Sayyafzadeh, M., Tang, D., Iglauer, S., and Keshavarz, A. (2025). Application of digital core analysis to improve reservoir characterisation and modelling: the otway formation as a case study. Int. J. Greenh. Gas Control 141, 104316. doi:10.1016/j.ijggc.2025.104316
Boison, P. K. N., Ampomah, W., Simmons, J. D., Bui, D., Sibaweihi, N., Amosu, A., et al. (2025). Geochemical assessment of long-term CO2 storage from Core-to field-scale models. Energies 18 (15), 4089. doi:10.3390/en18154089
Cai, J., Qin, X., Xia, X., Jiao, X., Chen, H., Wang, H., et al. (2024). Numerical modeling of multiphase flow in porous media considering micro- and nanoscale effects: a comprehensive review. Gas Sci. Eng. 131, 205441. doi:10.1016/j.jgsce.2024.205441
Cao, Z., Zhang, S., Xue, Y., Wang, Z., Du, F., Li, Z., et al. (2025). Disaster-causing mechanism of spalling rock burst based on folding catastrophe model in coal mine. Rock Mech. and Rock Eng. 58 (7), 7591–7604. doi:10.1007/s00603-025-04497-6
Cui, Y., Zhou, W., and Liu, C. (2025). Integrated modeling of time-varying permeability and non-darcy flow in heavy oil reservoirs: numerical simulator development and case study. Processes 13 (6), 1683. doi:10.3390/pr13061683
Deng, R., Dong, J., and Dang, L. (2025). Numerical simulation and evaluation of residual oil saturation in waterflooded reservoirs. Fuel 384, 134018. doi:10.1016/j.fuel.2024.134018
Hashan, M., Jahan, L. N., Imtiaz, S., and Hossain, M. E. (2020). Modelling of fluid flow through porous media using memory approach: a review. Math. Comput. Simul. 177, 643–673. doi:10.1016/j.matcom.2020.05.026
Hou, J.-R., Zheng, Z.-Y., Song, Z.-J., Luo, M., Li, H.-B., Zhang, L., et al. (2016). Three-dimensional physical simulation and optimization of water injection of a multi-well fractured-vuggy unit. Petroleum Sci. 13 (2), 259–271. doi:10.1007/s12182-016-0079-4
Ji, B., He, Y., Yu, H., Liao, H., and Zhang, Y. (2023). Mechanism study of enhanced oil recovery by entrapped gas in extra high water-cut reservoir. Petroleum Sci. Technol. 41 (8), 850–869. doi:10.1080/10916466.2022.2070208
Jiang, J., Huang, Z., Gong, R., Ren, J., Yu, G., and Zhang, Y. (2021). Time-varying numerical simulation of reservoir physical properties based on surface flux. J. Phys. Conf. Ser. 1894 (1), 012077. doi:10.1088/1742-6596/1894/1/012077
Ke, S., Liu, H., Wang, Y., Dong, M., Liu, Z., and Du, W. (2020). Novel method for inverted five-spot reservoir simulation at high water-cut stage based on time-varying relative permeability curves. ACS Omega 5 (22), 13312–13323. doi:10.1021/acsomega.0c01388
Liao, H., Liu, X., He, X., Li, Y., Jiang, Z., Li, K., et al. (2024). The time-varying characteristics of relative permeability in oil reservoirs with gas injection. Energies 17 (17), 4512. doi:10.3390/en17174512
Liu, J., Yuan, C., Cai, S., Chen, G., Tian, H., Liu, Z., et al. (2020). Improvement of the fast simulation of gamma-gamma density well logging measurement. Appl. Radiat. Isotopes 167, 109423. doi:10.1016/j.apradiso.2020.109423
Meng, Y., Yu, J., Si, G., Armstrong, R. T., and Mostaghimi, P. (2024). Application of image-based diffusion coefficients in multi-scale simulation of coalbed methane reservoirs. Fuel 357 (Part A), 129602. doi:10.1016/j.fuel.2023.129602
Shao-xian, B. (2012). Reservoir numerical simulation study based on formation parameters’ time-variability. Procedia Eng. 29, 2327–2331. doi:10.1016/j.proeng.2012.01.309
Shi, L., Yang, H., Ji, Z., Jiang, L., and Yang, C. (2024). Field-split preconditioned active-set reduced-space algorithm for complex black oil reservoir simulation at large-scale. J. Comput. Phys. 517, 113362. doi:10.1016/j.jcp.2024.113362
Sun, Z., Liu, Y., Cai, H., Gao, Y., and Jiang, R. (2023). The numerical simulation study on the dynamic variation of residual oil with water drive velocity in water flooding reservoir. Front. Energy Res. 10, 977109. doi:10.3389/fenrg.2022.977109
Xu, J., Guo, C., Wei, M., and Jiang, R. (2015). Impact of parameters׳ time variation on waterflooding reservoir performance. J. Petroleum Sci. Eng. 126, 181–189. doi:10.1016/j.petrol.2014.11.032
Yu, H., Wang, Y., Zhang, L., Zhang, Q., Guo, Z., Wang, B., et al. (2024). Remaining oil distribution characteristics in an oil reservoir with ultra-high water-cut. Energy Geosci. 5 (1), 100116. doi:10.1016/j.engeos.2022.06.004
Zhan, W., Zhuang, M., Liu, Q. Q., Shi, L., Sun, Y., and Liu, Q. H. (2021). Frequency domain spectral element method for modelling poroelastic waves in 3-D anisotropic, heterogeneous and attenuative porous media. Geophys. J. Int. 227 (2), 1339–1353. doi:10.1093/gji/ggab269
Zhan, W., Chen, Y., Liu, Q., Li, J., Sacchi, M. D., Zhuang, M., et al. (2024). Simultaneous prediction of petrophysical properties and formation layered thickness from acoustic logging data using a modular cascading residual neural network (MCARNN) with physical constraints. J. Appl. Geophys. 224, 105362. doi:10.1016/j.jappgeo.2024.105362
Zheng, C., Yi, X., Yi, X., Feng, D., Zhenhua, L., Cunhan, H., et al. (2025). Diffusion evolution rules of grouting slurry in mining-induced cracks in overlying strata. Rock Mech. Rock Eng. 58 (6), 6493–6512. doi:10.1007/s00603-025-04445-4
Zhong, C., and Leung, J. Y. (2024). Coupling upscaled discrete fracture matrix and apparent permeability modelling in DFNWORKS for shale reservoir simulation. Adv. Water Resour. 192, 104776. doi:10.1016/j.advwatres.2024.104776
Zhou, W., Li, B., Tang, E., Zhang, J., and Yong, W. (2024). Reservoir numerical simulation method considering time-varying relative permeability during polymer flooding process. J. Phys. Conf. Ser. 2834 (1), 012009. doi:10.1088/1742-6596/2834/1/012009
Appendix A: Derivation of the upscaled analytical models
Part A.1: Derivation of Sor,eff: Start with Equation 9, substitute Equation 4 and Equation 6 into it, and show the integration steps that lead to Equation 10. You will need to use the properties of the Gamma distribution.
Part A.2: Derivation of krw,max,eff: Do the same for krw,max,eff, starting from Equation 11.
Nomenclature
Keywords: reservoir properties, dynamic evolution, upscaling, heterogeneity, numerical simulation
Citation: Lan Y, Deng S, Shi L, Cui S and Wu H (2025) An upscaling-based numerical simulation method for time-varying reservoir properties. Front. Earth Sci. 13:1709301. doi: 10.3389/feart.2025.1709301
Received: 20 September 2025; Accepted: 17 November 2025;
Published: 03 December 2025.
Edited by:
Juntao Liu, Lanzhou University, ChinaReviewed by:
Zhengzheng Cao, Henan Polytechnic University, ChinaWeichen Zhan, The University of Texas at Austin, United States
Copyright © 2025 Lan, Deng, Shi, Cui and Wu. This is an open-access article distributed under the terms of the Creative Commons Attribution License (CC BY). The use, distribution or reproduction in other forums is permitted, provided the original author(s) and the copyright owner(s) are credited and that the original publication in this journal is cited, in accordance with accepted academic practice. No use, distribution or reproduction is permitted which does not comply with these terms.
*Correspondence: HaoQiang Wu, d3VoYW9xaWFuZzE5OThAMTYzLmNvbQ==