 Tao Peng
 Pengrong Liu1,3
 Tao Yan
- 1School of Civil Engineering, Southwest Jiaotong University, Chengdu, China
- 2Chengdu Surveying Geotechnical Research Institute Co., Ltd. of MCC, Chengdu, China
- 3Key Laboratory of Transportation Tunnel Engineering, Ministry of Education, Southwest Jiaotong University, Chengdu, China
- 4Sichuan Jiaotou Design Consulting Research Institute Co., Ltd., Chengdu, China
- 5Broad vision Engineering Consultants, Kunming, Yunnan, China
Introduction: A reasonable advanced support system is crucial for ensuring stable excavation in tunnels with weak surrounding rock. This study aims to address the problems of instability, large deformation, and prolonged construction period in the sidewalls of tunnel faces in plateau high-geostress carbonaceous slate tunnels in western mountainous areas.
Methods: Based on lithology analysis and creep tests, we propose enhanced over-head pre-support, rapid initial support closure, and increased steel arch stiffness. The proposed approach was validated via numerical modeling and field tests.
Results: Results show that compared to no forepoling (Case I), Cases II–V reduced deformation by 17%, 21%, 44%, and 46%, respectively. The additional arch over-support improves stability and reduces sidewall deformation. The combined "arch-wall over-support + HW175 steel arch + 6m anchors" system shortened initial support formation from 20 to 12 days.
Discussion: These findings support the design of active-passive support systems for high-stress weak rock tunnels and offer insights for similar projects.
1 Introduction
The terrain in the mountainous areas of western China is complex and varied, with prevalent adverse geological conditions that pose serious challenges to tunnel safety during construction. Among these challenges, large deformation in soft rock tunnels is particularly prominent and has become a major issue constraining project progress and budget (Siming et al., 2021). Table 1 presents statistics on several major tunnels, both domestically and internationally, that have experienced large deformation.
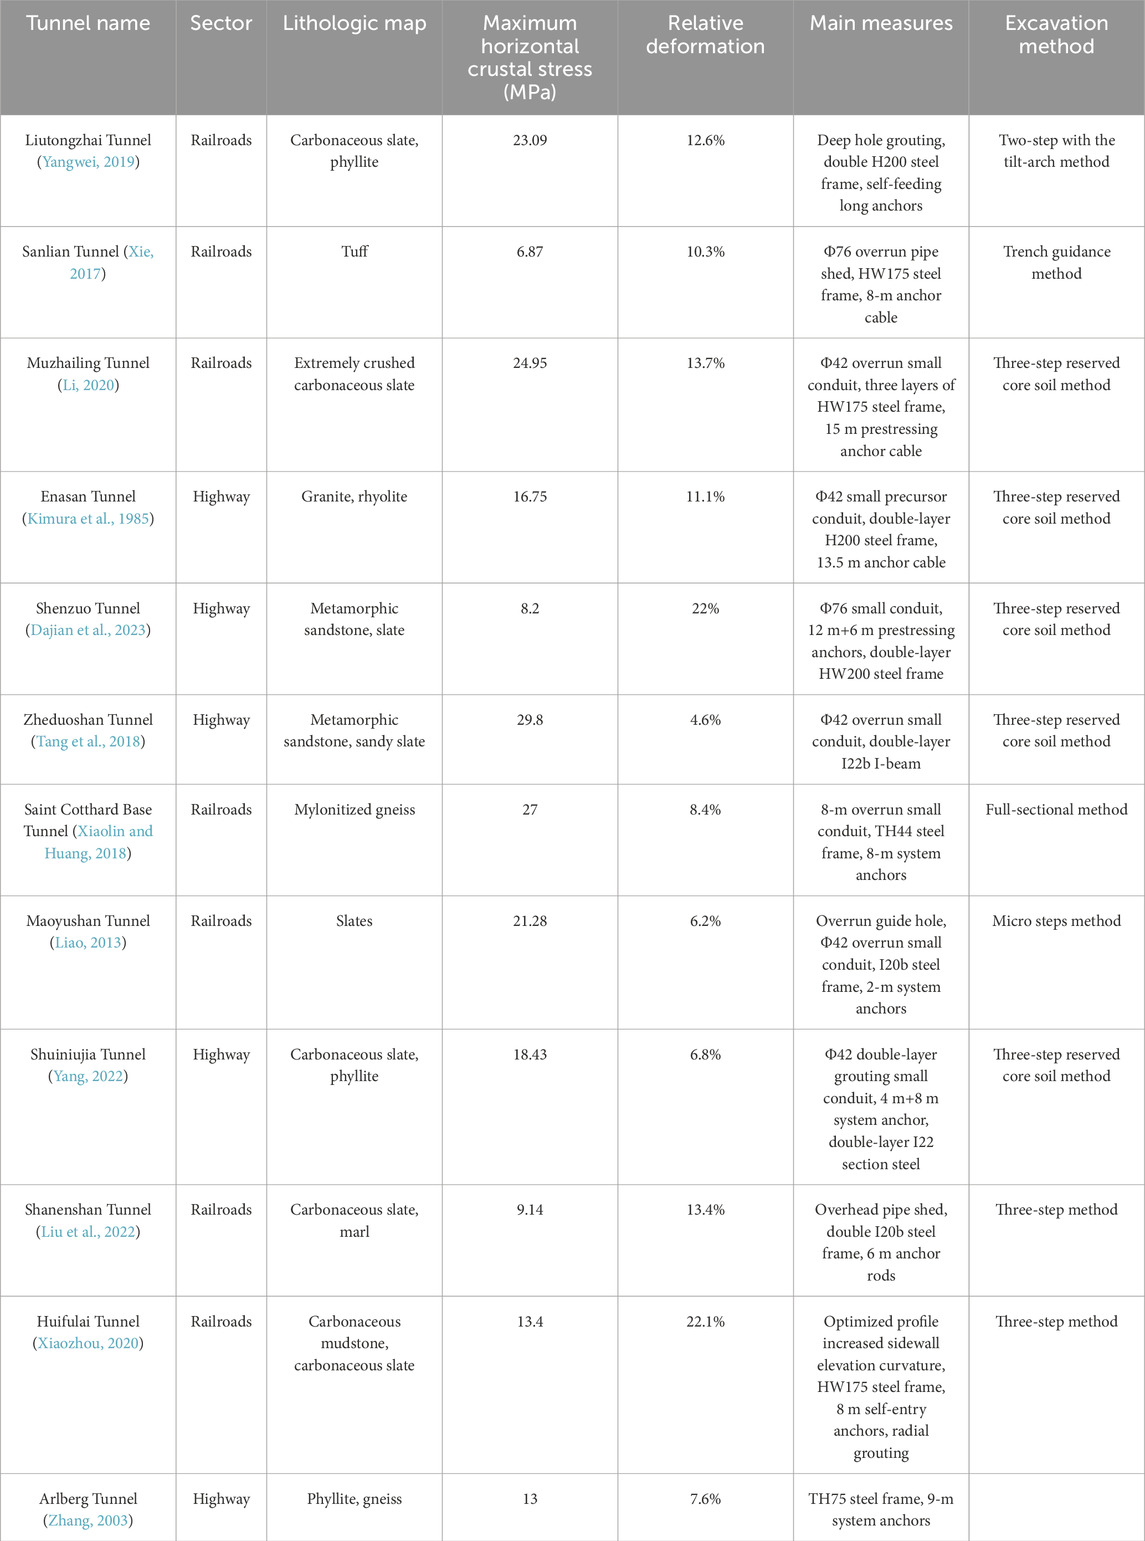
Table 1. Statistical table of large deformations of soft rock tunnels with high ground stress.
Researchers worldwide have conducted extensive research on the mechanisms, classification, and control measures of large deformation in soft rock tunnels. From the viewpoint of causes, Aydan et al. (1996) pointed out that the essence of large deformation is the shear damage of the surrounding rock, and different combinations of viscous, elastic, and plastic deformation will occur under the secondary stress field. Wang et al. (2011) classified large deformation into stress, material, and structural types according to the causes. Qian and Zhou (2018) conducted a study on the deformation and failure behavior of rock masses during the excavation of underground cavern groups under high-geostress conditions, utilizing Jinping I hydropower stations as a basis. The research indicates that under high geostress, rock mass damage manifests as a zonal disintegration phenomenon.
Many scholars have used indoor tests and theoretical derivations to describe the rheological deformation phenomenon in soft rock tunnels. Griggs (1939) carried out creep tests on rocks such as chert and shale and obtained creep curves at different loading levels. After that, Tian et al. (2025), Tian and Zhou (2024), and Tian and Zhou (2022) systematically investigated the nonlinear deformation, damage, and fracture processes of rocks. From integrating the FVEVP constitutive law into a unified statistical damage evolution equation to establish a unified fractional-order creep damage constitutive theory, to proposing a unified progressive damage-fracture criterion and simulating time-dependent deformation and fracturing phenomena in rocks, and further exploring the mechanical responses and rate-dependent fracture behaviors of general viscoelastic materials, a relatively comprehensive research framework has been developed. In the analysis of time-dependent deformation of soft rock tunnels, Zhang et al. (2019) and Zhang et al. (2023) established a novel four-element fractional visco-plastic (FVP) model based on fractional derivative theory, which includes two Abel dashpots, one spring, and one visco-plastic body. On the other hand, in the study of failure mechanisms of fractured rock masses, they employed a true triaxial testing system with synchronous acoustic emission monitoring to investigate the laboratory-scale brittle failure of sandstone specimens containing two different en echelon flaw configurations, revealing the brittle failure mechanisms of flawed rocks. Xiao et al. (2025) established pore structure reconstruction models with controlled porosity variations for systematic numerical experimentation by investigating the relationship between pore structure parameters and mechanical characteristics. Niu and Zhou (2021) and Niu et al. (2023) conducted systematic research on rock instability prediction and shale failure mechanisms. First, the precursory acoustic emission (AE) response rate derived from local spatial AE events was utilized to predict the time-of-instability of sandstone under biaxial and true triaxial compression. Second, the fracture process of shale was characterized based on the evolutionary characteristics of the AE event rate. Furthermore, the introduction of multifractal theory enabled quantitative characterization of the fracture instability process in shale.
In terms of grading, the current mainstream methods can be divided into the deformation evaluation method and the stress evaluation method. Hoek and Marinos (2000) gave five grading indexes for large deformation prediction by summarizing the law of extruding large deformation tunnels. Guoliang et al. (2015), combined with the surrounding rock and deformation characteristics of the soft rock tunnel of the Lanzhou–Chongqing Railway, used the relative deformation and the rock strength stress ratio as the grading index of large deformations in soft rock tunnels and gave the prediction standard and control measures for different grades. In terms of control methods, the mainstream support theories used internationally are the New Austrian Tunnelling Method (NATM) (Karakuş and Fowell, 2004), the Energy Support Method (Salamon, 1984), and the Analysis of Controlled Deformation in Rocks and Soils (Lunardi, 2000). Chinese scholars combined the domestic tunnel technology and foreign research methods to form the “Joint Support Method” (Yu, 1990), the “Loose Circle Theory” (Dong et al., 1994), the “Timely-Strong-Yield Stress support” (Wu et al., 2020), and other methods.
To summarize, previous research on large deformation has achieved fruitful results. However, the causes of large deformation are complicated, and the lithology is diverse, so there is no one-size-fits-all control technology. It is necessary to analyze the causes of deformation by mineral composition analysis and creep test for different rock bodies and combine the results with engineering analogies to determine the large deformation control measures applicable to such rock bodies. Focusing on a plateau charcoal slate tunnel, this study systematically investigates deformation control technologies under extremely high geostress. Therefore, this article analyzes the mineral composition of the surrounding rock at the tunnel face. The Burgers model parameters were obtained by drilling core samples and performing creep tests on the surrounding rock of the tunnel face. The parameters were applied to FLAC3D software to simulate the deformation of the surrounding rock under different working conditions to form an effective control technology. Based on this, a test section was carried out in the large deformation section to verify the reasonableness of the support program.
2 Deformation characteristics and lithologic analysis of the rock body in the large deformation section
2.1 Deformation characteristics
The project, a plateau tunnel, is located in the Yangzi land mass and the Qiangtang–Sanjiang orogenic system at the interface between the west side of the Qiangtang–Sanjiang orogenic system of the Yajiang residual basin. The basement miscellaneous rock deformation is strong and develops a series of anticlines and synclines. The stratigraphic lithology is complex, mainly containing carbonaceous slate, sandstone, and carbonaceous phyllite. The maximum depth of the tunnel is approximately 1100 m, and the crustal stress obtained by the hydraulic fracturing technique is mainly horizontal tectonic stress, with the maximum value of 25.61 MPa. The tunnel alignment is shown in Figure 1.
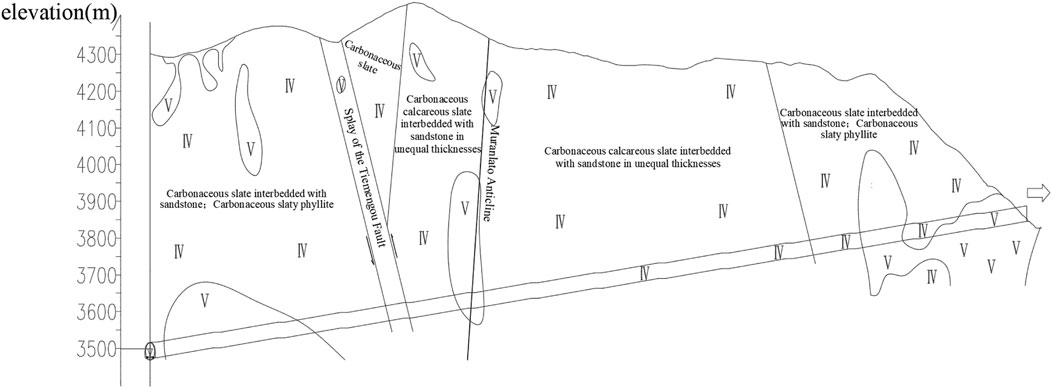
Figure 1. Tunnel alignment schematic diagram.
In order to speed up the construction progress, more of the tunnel face is opened, and an auxiliary trench form of “4 inclined shafts +1 cross-hole” is set up, with the two-bench method being adopted for excavation. As shown in Figure 2, large deformation occurred during the excavation of the cross-hole, accompanied by concrete cracking, steel arch deformation, and other problems. The monitoring curve of the large deformation section on site is shown in Figure 3.
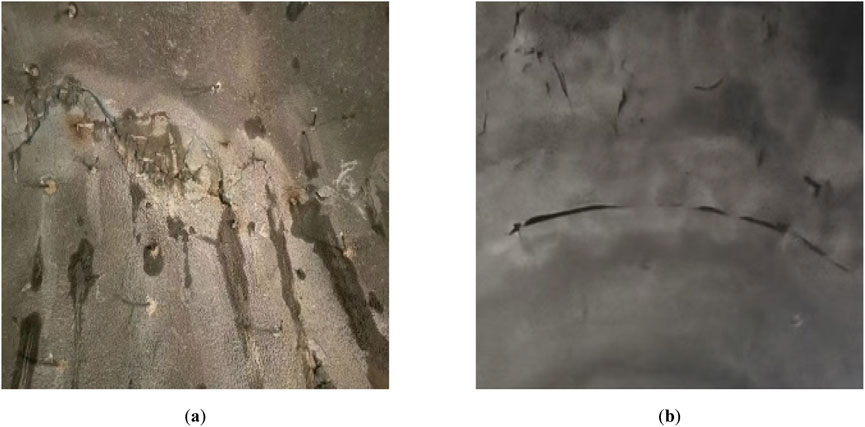
Figure 2. Deformation of initial support: (a) cracking of concrete and (b) deformation of steel arches.
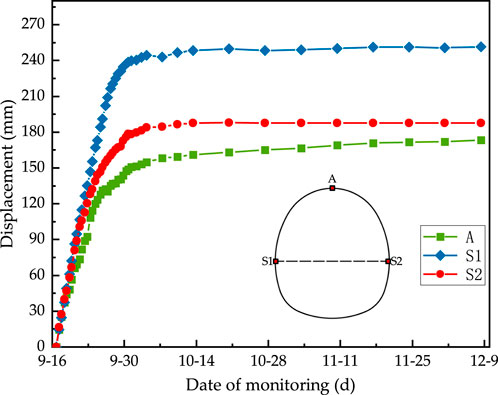
Figure 3. Deformation section monitoring curve.
The monitoring curves indicate that the most severe tunnel deformation occurred between September 16 and September 25 following excavation, with the average daily deformation of both sidewall convergence and crown settlement exceeding 12 mm. During this period, the left sidewall convergence increased from 0 mm to 131.15 mm, the right sidewall convergence increased from 0 mm to 150.63 mm, and the crown settlement increased from 0 mm to 127.71 mm. The deformation in this phase accounted for over 70% of the total deformation. This demonstrates the poor self-stabilizing capacity of the carbonaceous slate, along with insufficient support strength in the original design and an extended initial support closure cycle. Eighty-four days after excavation, the tunnel roof settled by 173 mm, while the left and right sidewalls converged by 251.64 mm and 187.68 mm, respectively. It can be concluded that, under the influence of horizontal tectonic stress, the large deformation section is predominantly characterized by sidewall convergence.
2.2 Rock mass lithology analysis
In order to further study the lithology of the large deformation section, drill core samples were taken on site for whole rock mineral composition analysis, and the contents of various components and the composition of the clay fraction are shown in Table 2. The results show that the main components of the carbonaceous slate are quartz, clay, and plagioclase. Among them, the quartz content is approximately 33–48.9%. It is followed by clay, which accounts for approximately 31.5–39.2%, and the clay consists of illite and chlorite. Plagioclase content, on the other hand, ranges from 11.7% to 19%.
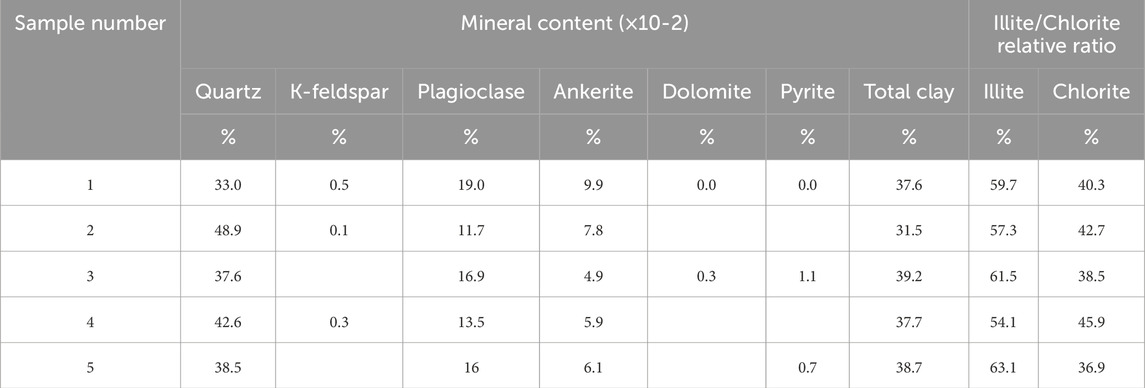
Table 2. Whole-rock mineral content statistical table.
Scanning electron microscopy (SEM) analysis was performed on the sampled rock mass. The results show that the pores of the samples are irregular and disordered. The pore size varies from 5 μm to 200 μm. The surface is dominated by irregular flakes and debris. As can be seen in Figure 4, numerous flakes are arranged and combined to form a unique laminar structure with various cracks. The laminar structure is prone to sliding under external force, causing damage to the structure.
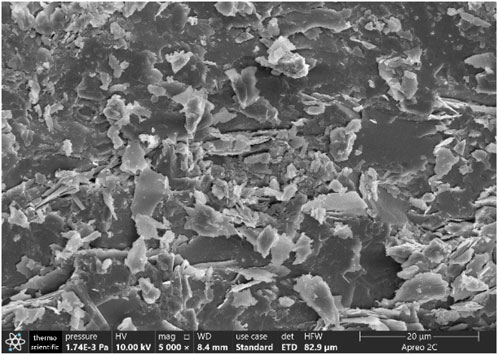
Figure 4. SEM image of sample rock mass.
3 Creep test of carbonaceous slate
3.1 Creep test method
A rock block was collected from the tunnel face of a plateau tunnel, as shown in Figure 5. It was wrapped in plastic film for transport to the laboratory, where standard test specimens with a height of 100 mm and a diameter of 50 mm were drilled. The non-parallelism of the two end faces of the specimens was ensured to be less than 0.05 mm. The prepared standard test specimens are shown in Figure 6.
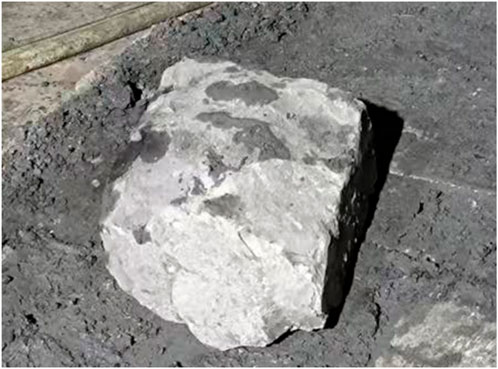
Figure 5. Sampled rock.
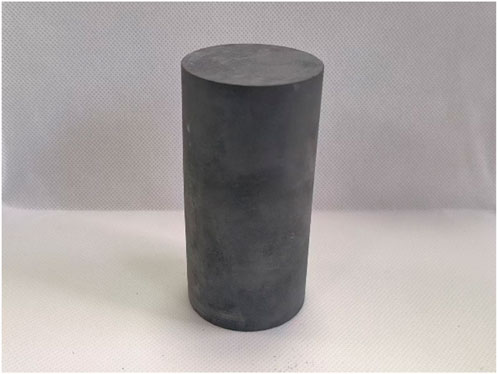
Figure 6. Standard test specimen.
The fabricated specimens were loaded into an MTS815.03 electro-hydraulic servo universal testing machine. Based on a point load strength of 0.74 MPa measured at the sampled excavation surface, the estimated uniaxial compressive strength (UCS) was 16.89 MPa as determined using Equation 1 (Chinese Standard, 2014). Consequently, the initial confining pressure was set to 6 MPa, with incremental increases of 2 MPa for each subsequent stage. In accordance with the ISRM standard, a loading rate of 1 MPa/min (Hatheway, 2009) was applied. The axial load was increased at this constant rate until the target stress for each stage was attained, which was then maintained for 24 h.
Where
The strain gauges were fixed to capture the data, as shown in Figure 7. The deformation was monitored according to the three guidelines described in Table 3, and the data were processed. The final choice was to collect in the decay creep and steady-state creep stage according to the serial number 1 guideline, and in the accelerated creep stage and the destruction stage according to the serial number 3 guideline.
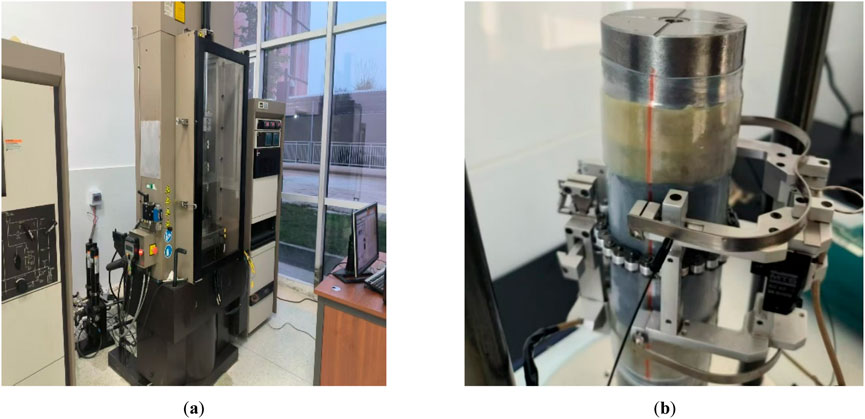
Figure 7. Installation sample of the testing machine. (a) MTS 815.03 Electro-Hydraulic Servo Testing Machine and (b) strain gauge schematic diagram.
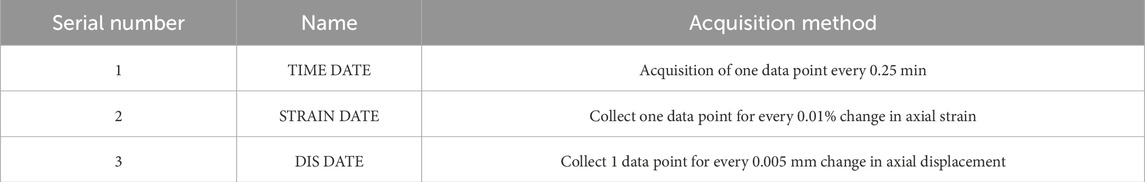
Table 3. Creep data acquisition method table.
3.2 Creep test results
Figure 8 presents the creep curves of three specimens under graded loading. The similarity of these curves indicates comparable physical and mechanical properties among the specimens. At low stress levels, creep deformation is negligible. As the axial deviatoric stress increases, creep behavior becomes progressively more pronounced. During the final loading stage, the specimens underwent a brief period of accelerated creep, culminating in failure. This failure mechanism is attributed to the propagation of pre-existing microcracks within the rock, which were initially induced by tectonic stresses. Once the applied stress exceeded the long-term strength of the rock, these microcracks propagated rapidly, leading to structural collapse.
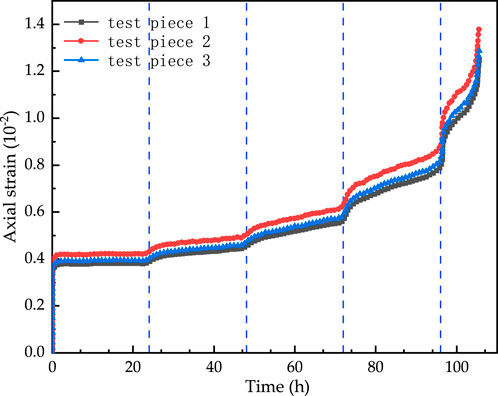
Figure 8. Full-range creep curve.
The axial strain and corresponding creep rates for each stage are summarized as follows. The average change of axial strain of three specimens in the first stage is 1.75 × 10⁻⁴, and the creep rate is 0, basically. The average change in the second stage is 0.057 × 10⁻⁴, and the creep rate is 2.4 × 10⁻³ mm/h. The creep effect is gradually obvious after the third stage, and in the case of Test Piece 2, for example, the creep rate of the third stage is 3.8 × 10⁻³ mm/h. The creep effect is gradually obvious after the third stage, and in the case of Test Piece 2, the creep rate is 3.8 × 10⁻³ mm/h, an increase of 58%. The fourth stage creep rate of 10.3 × 10⁻³ mm/h, an increase of 329%. The fifth stage creep rate is 30.7 × 10⁻³ mm/h, an increase of 1,179%.
3.3 Creep parameter identification
The creep effect was more pronounced for Test Piece 2, so its creep curve was chosen to determine the parameters of the Burgers model (Figure 9). The Burgers model is formed by connecting a Maxwell body, which describes instantaneous elasticity and viscous flow, in series with a Kelvin body, which describes delayed elastic deformation. The constitutive equation for the Burgers model (Duan et al., 2023) is:
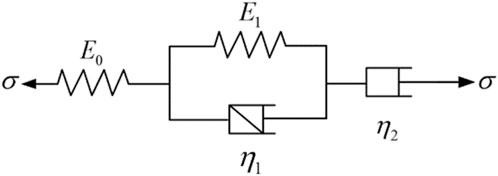
Figure 9. Burgers model diagram.
Where
The creep curves of Test Piece 2 at various levels are shown in Figure 10. Under a stress level of 6 MPa, the test piece exhibited typical instantaneous creep and decaying creep characteristics, with a total strain of only 0.422 × 10⁻² after 24 h. When the stress was increased to 8 MPa, steady-state creep behavior appeared, with a creep rate of approximately 2.0 × 10⁻³ mm/h, and the accumulated strain increased by 17% to 0.493 × 10⁻². At 10 MPa, the steady-state creep characteristics of the test piece became more pronounced, with the steady-state creep rate rising to 3.8 × 10⁻³ mm/h. Under a stress level of 12 MPa, the deformation of the test piece showed significant growth, with the strain rate surging to 11.1 × 10⁻³ mm/h, and it entered the accelerated stage after only 18.7 h, reaching a final strain of 0.87 × 10⁻². At 14 MPa, the test piece became completely unstable, reaching a failure strain of 1.38 × 10⁻² in only 9.5 h, indicating that 14 MPa far exceeded its short-term load-bearing capacity.
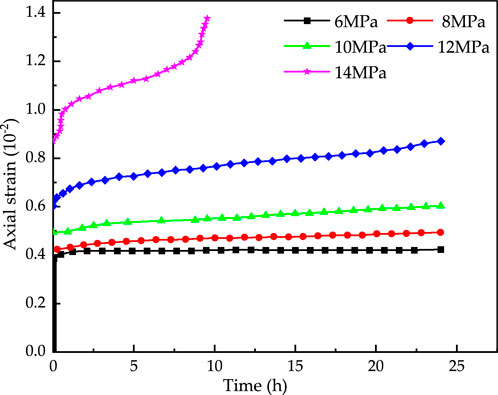
Figure 10. Creep curves at successive load steps.
After fitting the creep curves at all levels by the customized function of the L-M algorithm that is provided by the Origin software, the parameters of (Equation 2) the Burgers model were obtained as shown in Table 4.
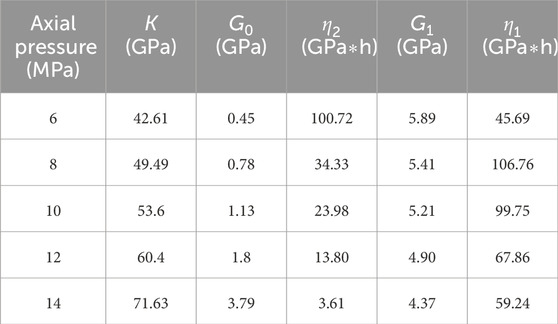
Table 4. Parameter values of the Burgers model under different axial pressure.
4 Large deformation control technology
4.1 Study on control measures
The numerical model is illustrated in Figure 11. It has dimensions of 80 m × 30 m × 80 m (X × Y × Z), with the boundaries extending to five times the tunnel diameter to minimize boundary effects. The mesh consists of 53,244 nodes and 505,150 elements. Referring to the ground investigation data, a load of 25.61 MPa is applied to the top of the model to simulate the most unfavorable situation. The displacement boundaries are fixed around and at the bottom, and the parameters of the shotcrete, steel arch, advance ductule, and bolt are set according to different working conditions. The model employed the two-bench excavation method. To simulate the reinforcing effect of the advance pipe roof support, the surrounding rock within a 3-m range of the upper 180° of the tunnel arch was strengthened in the model.
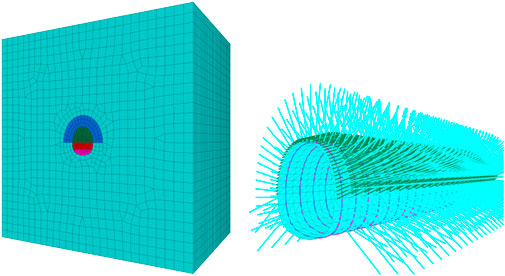
Figure 11. Numerical calculation model.
This study is based on a project of a plateau tunnel auxiliary gallery. The original design parameters listed in Table 5 proved to be inadequate. During the excavation of the section from DK2+960 to DK2+716, medium to large deformations occurred, accompanied by instability issues such as face collapse and sidewall failure. According to the engineering analogy, it is considered to be carried out in accordance with the treatment principle of enhancing over-excavation pre-support, quick closure of initial support, and increasing the stiffness of initial support, and the duration of initial support ring formation is shortened from 20 days to 12 days. According to the above principles, the optimized design parameters for Case I to Case V shown in Table 5 were established, and the Burgers constitutive equations were applied to numerically simulate several support conditions. The deformation convergence curves of the vault and side wall for each condition are shown in Figure 12. The relevant parameters were obtained by fitting the creep curves from the creep tests in Section 2, with the specific values listed in Table 4.
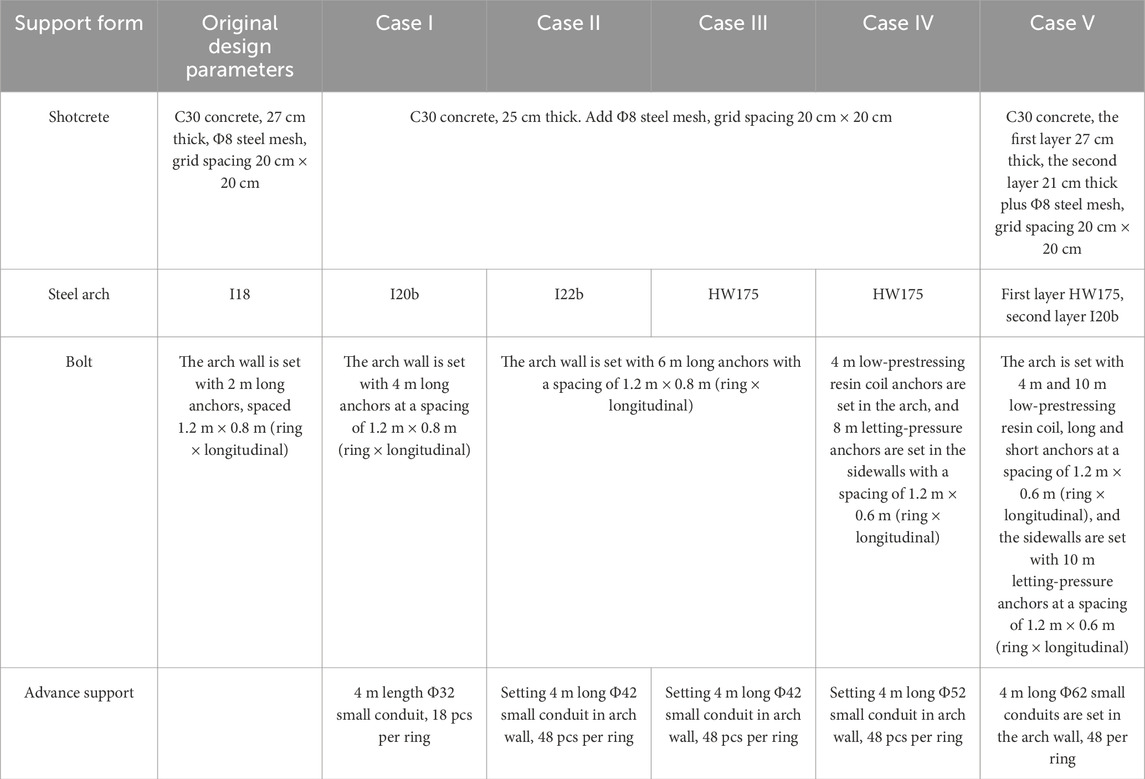
Table 5. Original design parameters and changed design parameters.
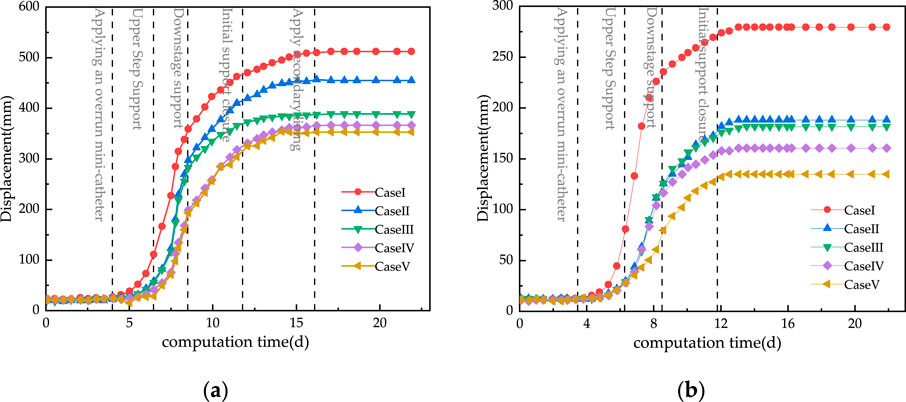
Figure 12. Deformation monitoring curve. (a) Tunnel side wall convergence versus time curve. (b) Tunnel crown settlement versus time curve.
Analyzing Figure 12, the following conclusions can be obtained:
1. In Case I, the advanced support parameters were relatively weak, resulting in excessive deformation rates of both the vault and sidewalls during the initial excavation phase, which was unfavorable for stabilizing the deformation. After installing advanced small conduits on the arch walls and increasing their quantity, the convergence deformation rate of the sidewalls was effectively controlled. This indicates that adding advanced small conduits can effectively expand the grouting reinforcement range, forming a more complete reinforcement ring and significantly improving the integrity and load-bearing capacity of the surrounding rock. Therefore, during the construction process, the laying angle and quantity of small conduits should be increased to prevent instability and collapse of the sidewalls.
2. Increasing the type of steel arch and the length of anchors can significantly reduce the deformation. The cumulative deformation of the side wall after the initial support was 347.81 mm in the original design, and the cumulative deformation in the other conditions was 273.8 mm, 211.64 mm, 198.78 mm, and 197.61 mm, respectively. Compared with the original design settlement, the cumulative deformation was reduced by 21.3%, 39.2%, 42.8%, and 43.2%. Prestressing anchors and double-layer initial support were added for the latter two conditions, but no more obvious effect was achieved, which indicates that reasonable support parameters should be selected to avoid wastage.
3. The deformation of the vault was basically stabilized after the closure of the initial support tilt arch. The side wall convergence was still growing slowly after the initial support was formed into a ring and reached stability after the application of the second lining. It shows that under the condition of tectonic stress, the second lining should be applied in time and combined with the initial support to bear the pressure of the surrounding rock together.
4.2 Analysis of the effect of the test section
A section of the large deformation section of the dependent project was taken as the test section. The maximum horizontal principal stresses measured by the hydraulic fracturing method at the tunnel depth of about 600 m are 17.14–18.91 MPa, the minimum horizontal principal stresses are 9.78–11.05 MPa, and the measured horizontal principal stresses are in the direction of approximately N28°W. The calculated parameters are shown in Table 6.
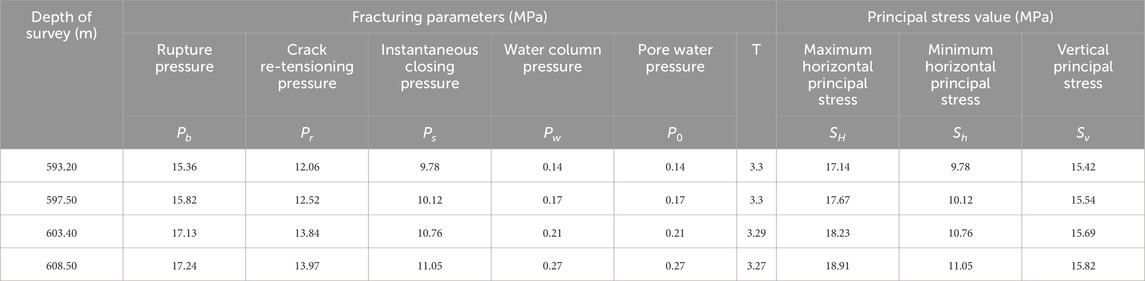
Table 6. Hydraulic fracturing method calculation parameters table.
4.2.1 Optimization of support parameters
After changing the design of the original construction drawings, the level of surrounding rock was reclassified from Class IV to Class V. After adjusting the support measures, there were still problems, such as poor stability of sidewalls, bulging, and large deformation. Therefore, with reference to the numerical calculation results, the support parameters were optimized according to the working condition III in Table 5, and 8-m foot-locking bolt bars were added. The form of support arrangement before and after optimization is shown in Figure 13, and the specific parameters are shown in Table 7. Figure 14 shows the site construction of the test section.
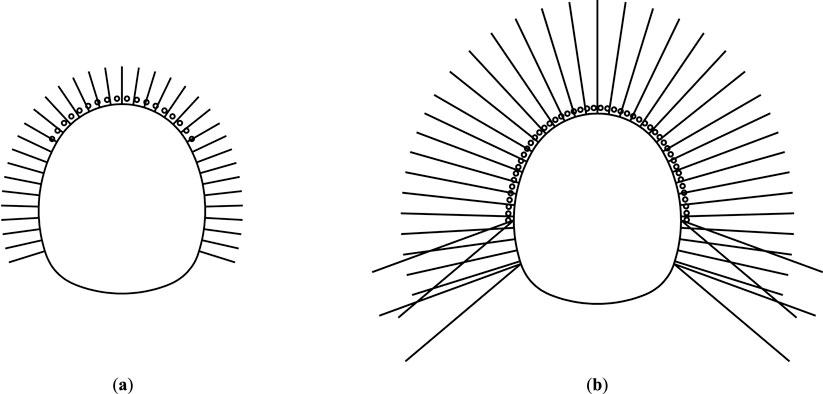
Figure 13. Comparison diagram of bolt layout after changing design parameters. (a) Original support layout schematic diagram. (b) Optimized support layout schematic diagram.
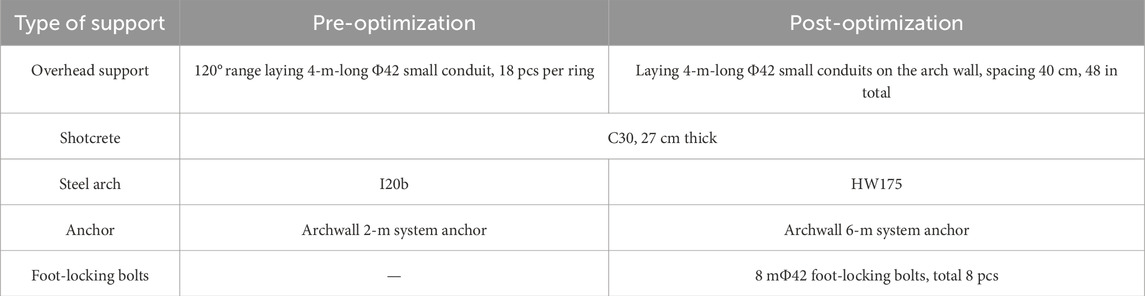
Table 7. Support parameters before and after optimization.
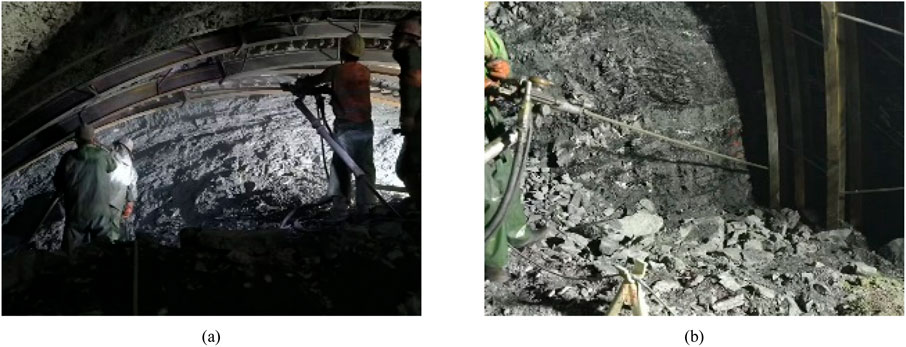
Figure 14. Test section site construction drawing. (a) Workers are applying an overrun small conduit. (b) Installation of foot-locking bolts.
4.2.2 Construction effect analysis
A total of three measurement points were arranged at the tunnel arch and arch waist to monitor the deformation convergence. The measurement points are shown in Figure 15. Among them, the DK2+860–850 section still adopts the original design scheme, and the DK2+845–835 section adopts the optimized scheme. The accumulated deformation of each measuring point is shown in Table 8.
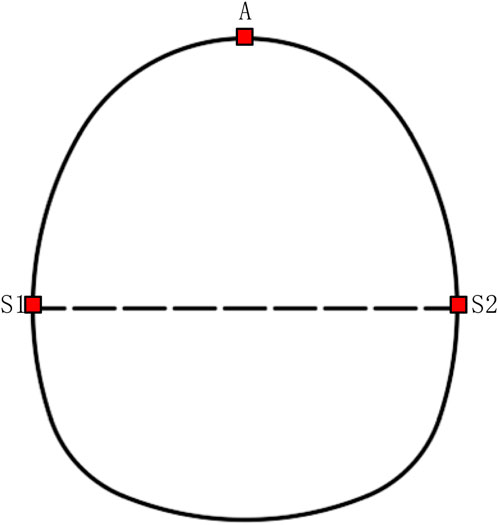
Figure 15. Schematic diagram of monitoring point layout.
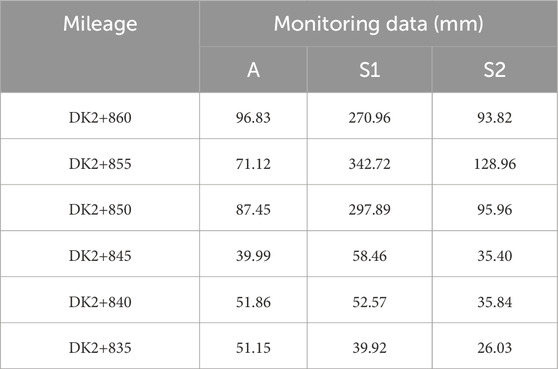
Table 8. Location of each measuring point.
The data from the measurement points were organized and summarized, and the time curves of the settlement of the arch and deformation of the side wall at the site were obtained, as shown in Figure 16.
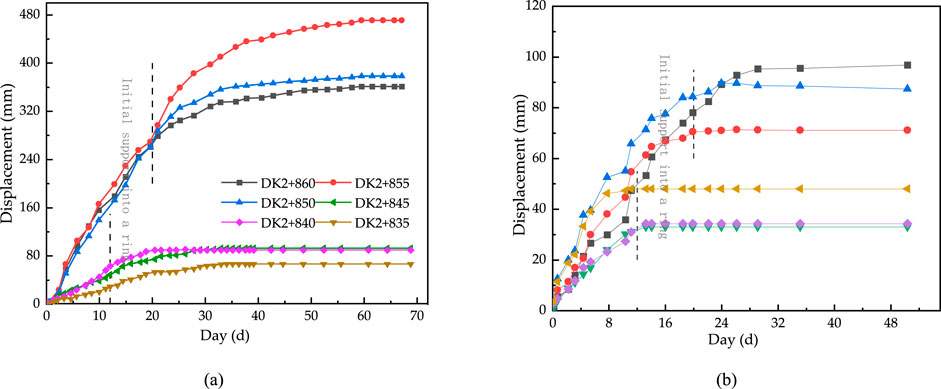
Figure 16. Field monitoring situation. (a) Displacement–time monitoring curve of the sidewall in the test section. (b) Settlement monitoring curve of the crown in the test section.
Combined Figure 16 and Table 8, it can be seen:
1. The excavation deformation rate is basically stable after strengthening the overhead support measures. Under the action of high stress, the deformation space effect is obvious. The average deformation after the initial support ring is 146.18 mm before optimization and 40.7 mm after optimization, which indicates that the deformation can be well controlled after improving the parameters.
2. The reserved deformation of the test section is 250 mm. The settlement of the arch before and after optimization has little change, with an average of 85.13 mm before optimization and an average of 47.67 mm after optimization, accounting for 34% and 19% of the reserved deformation. The convergence of DK2+860–850 side walls in the test section is 361.15 mm, 470.88 mm, and 378.75 mm, which exceeds 44.5%, 88.4% and 51.5% respectively. The DK2+845–835 section adopts optimized support parameters to control the deformation at approximately 90 mm, which meets the control requirements.
3. The data of the DK2+860–850 test section are more discrete. The maximum value is 471.68 mm, the minimum value is 364.78 mm, and the difference is approximately 107 mm, while the difference of the DK2+845–835 section is only 27.9 mm, which shows that the optimized support parameters are more adaptable to the complex and changeable tunnel environment.
5 Conclusion
This article takes a plateau tunnel in western China as a study, analyzes the lithology of the tunnel surrounding rock, carries out a creep test, uses numerical calculation software to compare the influence of different working conditions on tunnel excavation, and verifies the results through the test section segments. The conclusions are as follows:
1. Numerical results and field tests demonstrate that the installation of advanced small conduits in the arch section significantly enhances surrounding rock stability and effectively controls deformation development. The numerical model indicates rapid deformation growth of the surrounding rock during the transition between the upper-bench and lower-bench excavation stages. For the arch section reinforced with advanced small conduits, the sidewall deformations before and after upper-bench excavation support are 297.49 mm, 282.69 mm, 199.06 mm, and 192.88 mm, respectively. In contrast, the sidewall deformation reaches 358.91 mm in the unsupported section. Compared to Case I (without advanced small conduits), the deformations in Cases II, III, IV, and V are reduced by 17%, 21%, 44%, and 46%, respectively.
2. Relying on a plateau tunnel and referring to the support concept of “rigid-flexible and fast closing of initial support,” an active-passive joint support technology of arch wall over-support + HW175 steel arch + 6 m anchors in the arch wall is proposed. The construction period is shortened by adjusting the date of the initial support ring from 20 days to 12 days.
3. A comparative simulation of various improvement schemes demonstrates that all support measures contribute to controlling surrounding rock deformation to some extent. In Case I, the cumulative sidewall deformation reached 347.81 mm after initial support installation, while Cases II, III, IV, and V exhibited reduced deformations of 273.8 mm, 211.64 mm, 198.78 mm, and 197.61 mm, respectively, representing reductions of 21.3%, 39.2%, 42.8%, and 43.2% compared to the original design settlement. Case V, which increased the stiffness of the forepoling pipes, incorporated double-layer support and replaced 8-m yielding bolts with 10-m prestressed anchor bolts based on Case IV, achieved only a marginal 0.4% improvement in deformation control, indicating the necessity of optimizing support parameters to avoid unnecessary costs. Therefore, cost-effective deformation management requires selecting appropriate support types tailored to varying degrees of large deformation.
Data availability statement
The raw data supporting the conclusions of this article will be made available by the authors, without undue reservation.
Author contributions
TP: Writing – original draft, Writing – review and editing. PL: Project administration, Writing – original draft, Writing – review and editing. MS: Conceptualization, Writing – original draft, Writing – review and editing. FH: Conceptualization, Data curation, Methodology, Writing – original draft. WW: Formal Analysis, Methodology, Project administration, Writing – original draft. AW: Project administration, Validation, Writing – original draft. TY: Writing – original draft, Writing – review and editing.
Funding
The author(s) declare that financial support was received for the research and/or publication of this article. Support was received from the National Natural Science Foundation of China, which funded project (51508475), the China Metallurgical 2022 major R&D project in the field of non-steel (CMT Science and Technology [2022] No. 2); the Yunnan Jiaotou Group Science and Technology Innovation Project [YCIC-YF-2022-03], and the Sichuan Jiaotou Design and Consulting Institute Self-supporting Science and Technology Project [KYL2022010056].
Acknowledgements
The authors acknowledge the financial support provided by the National Natural Science Foundation of China and the China Metallurgical 2022 major R&D project in the field of non-steel.
Conflict of interest
Authors TP and FH were employed by Chengdu Surveying Geotechnical Research Institute Co., Ltd. of MCC. Author WW was employed by Sichuan Jiaotou Design Consulting Research Institute Co., Ltd. Author AW was employed by Broad Vision Engineering Consultants.
The remaining authors declare that the research was conducted in the absence of any commercial or financial relationships that could be construed as a potential conflict of interest.
Generative AI statement
The author(s) declare that no Generative AI was used in the creation of this manuscript.
Any alternative text (alt text) provided alongside figures in this article has been generated by Frontiers with the support of artificial intelligence and reasonable efforts have been made to ensure accuracy, including review by the authors wherever possible. If you identify any issues, please contact us.
Publisher’s note
All claims expressed in this article are solely those of the authors and do not necessarily represent those of their affiliated organizations, or those of the publisher, the editors and the reviewers. Any product that may be evaluated in this article, or claim that may be made by its manufacturer, is not guaranteed or endorsed by the publisher.
References
Aydan, Ö., Akagi, T., and Kawamoto, T. (1996). The squeezing potential of rock around tunnels: theory and prediction with examples taken from Japan. Rock Mech. rock Eng. 29 (3), 125–143. doi:10.1007/bf01032650
Chinese Standard (2014). Standard for engineering classification of rock masses (工程岩体分级标准; GB/T 50218-2014). Beijing: China Planning Press.
Dajian, L., Wang, S., and Qiu, W. (2023). Application of treatment measures of large deformation in Shenzuo tunnel. Technol. Highw. Transp. 39 (03), 101–107. doi:10.13607/j.cnki.gljt.2023.03.015
Dong, F., Lai, H., and Guo, Z. (1994). Theory of support for loose circle of roadway perimeter rock. J. China Coal Soc. (1), 21–32. doi:10.13225/j.cnki.jccs.1994.01.004
Duan, W., Liu, Y., and Hu, W. (2023). Stady on operation stability of tunnel under grouting-reinforced body creep. Chin. J. Undergr. Space Eng. 19 (S1), 391–398. doi:10.20174/j.juse.2023.s1.047
Guoliang, Li, Zhichun, L. I. U., and Zhu, Y. (2015). Research on extrusion large deformation law and grading standard of high geostress soft rock tunnel of Lan Yu railroad. Mod. Tunn. Technol. 52 (1), 62–68. doi:10.13807/j.cnki.mtt.2015.01.009
Hatheway, A. W. (2009). The complete ISRM suggested methods for rock characterization, testing and monitoring; 1974–2006. Environ. and Eng. Geoscience 15 (1), 47–48. doi:10.2113/gseegeosci.15.1.47
Hoek, E., and Marinos, P. (2000). Predicting tunnel squeezing problems in weak heterogeneous rock masses. Tunnels Tunneling Int. 32 (11), 45–51.
Karakuş, M., and Fowell, R. J. (2004). An insight into the new Austrian tunnelling method (NATM). Proc. ROCKMEC.
Kimura, F., Okabayashi, N., Ono, K., and Kawamoto, T. (1985). “Rock-mechanical discussion for the mechanism of supporting systems in severe swelling rock tunnel,” in International conference on numerical methods in geomechanics, 1265–1271.
Li, W. (2020). Zhou Xitao analysis and countermeasures for inverted arch diseases in high geostress section of railway tunnel in Plateau and cold region:a case study on muzhailing tunnel of Lanzhou-Chongqing railway. Tunn. Constr. 40 (S2), 249–255. doi:10.3973/j.issn.2096-4498.2020.S2.032
Liao, J. (2013). Characteristics and causes of large deformation of soft rock in Maoyushan tunnel. Railw. Eng. (08), 79–81. doi:10.3969/j.issn.1003-1995.2013.08.25
Liu, Q., Wang, Y., and Wang, J. (2022). Development law and control technology of loosening circle in large deformation section of Shanengshan tunnel of China-Laos railway. Railw. Eng. 62 (11), 103–106. doi:10.3969/j.issn.1003-1995.2022.11.22
Lunardi, P. (2000). The design and construction of tunnels using the approach based on the analysis of controlled deformation in rocks and soils. Tunnels and Tunneling International ADECO-RS Approach.
Niu, Y., and Zhou, X.-P. (2021). Forecast of time-of-instability in rocks under complex stress conditions using spatial precursory AE response rate. Int. J. Rock Mech. Min. Sci. 147, 104908. doi:10.1016/j.ijrmms.2021.104908
Niu, Y., Liu, P.-F., Zhang, C.-P., Hu, Y.-J., and Wang, J.-G. (2023). Mechanical properties and dynamic multifractal characteristics of shale under anisotropic stress using AE technology. Geoenergy Sci. Eng. 226, 211748. doi:10.1016/j.geoen.2023.211748
Qian, Q., and Zhou, X. (2018). Failure behaviors and rock deformation during excavation of Underground Cavern group for jinping I hydropower station. Rock Mech. Rock Eng. 51, 2639–2651. doi:10.1007/s00603-018-1518-x
Salamon, M. D. G. (1984). Energy considerations in rock mechanics: fundamental results. J. South. Afr. Inst. Min. Metallurgy 84 (8), 233–246. Available online at: https://hdl.handle.net/10520/AJA0038223X_1489.
Siming, TIAN, Wang, W., and Gong, J. (2021). Development and prospect of railway tunnels in China (including statistics of railway tunnels in China by the end of 2020). Tunn. Constr. 41 (2), 308. doi:10.3973/j.issn.2096-4498.2021.02.018
Tang, R., Jun, WANG, and Guowen, X. U. (2018). Research on deformation control measures of soft rock tunnels with laminated strata. Subgr. Eng. (04), 140–145. doi:10.13379/j.issn.1003-8825.2018.04.26
Tian, D. L., and Zhou, X. P. (2022). A viscoelastic model of geometry-constraint-based non-ordinary state-based peridynamics with progressive damage. Comput. Mech. 69, 1413–1441. doi:10.1007/s00466-022-02148-z
Tian, D.-L., and Zhou, X.-P. (2024). The kinematic-constraint-inspired non-ordinary state-based peridynamics with fractional viscoelastic-viscoplastic constitutive model to simulating time-dependent deformation and failure of rocks. Comput. Methods Appl. Mech. Eng. 424, 116873. doi:10.1016/j.cma.2024.116873
Tian, D. L., Li, Z. C., Shen, F., Li, Y. t., and Zhou, X. P. (2025). A unified nonlinear creep damage coupled model for rocks based on fractional calculus and statistical damage model. Rock Mech. Rock Eng. 58, 7979–8010. doi:10.1007/s00603-025-04549-x
Wang, C., Peng, S., and Hu, Y. (2011). Study of squeezing deformation problems during tunneling. Rock and Soil Mechanics 32, 143–147.
Wu, K., Shao, Z., and Qin, S. (2020). Study on the interaction mechanism between surrounding rock and liner with highly deformable elements in squeezing tunnels. Eng. Mech. 37 (11), 185–194. doi:10.6052/j.issn.1000-4750.2020.01.0013
Xiao, N., Chen, J.-Q., Qiu, X., Huang, F., and Ling, T.-H. (2025). Study on the relationship between porosity and mechanical properties based on rock pore structure reconstruction model. Appl. Sci. 15 (13), 7247. doi:10.3390/app15137247
Xiaolin, W., and Huang, Y. (2018). Comparison of large deformation control technologies for soft rock tunnel with high ground stress between China and foreign countries: a case study of muzhailing tunnel on danzhou-Chongqing railway in China and saint gotthard base tunnel in Switzerland. Tunn. Constr. 38 (10), 1621–1629. doi:10.3973/j.issn.2096-4498.2018.10.004
Xiaozhou, Yu (2020). Study on control technique for large deformation of soft roeks in huifulai tunnel of China-Laos railway. High. Speed Railw. Technol. 11 (03), 12–17. doi:10.12098/j.issn.1674-8247.2020.03.003
Xie, G. (2017). Causes and treatment technology of large deformation of surrounding rock in sanlian tunnel. Urban Road Bridge Flood Control (06), 220–222+26. doi:10.16799/j.cnki.csdqyfh.2017.06.065
Yang, Z. (2022). Research on control of large deformation and reserved deformation in soft rock tunnels. Sichuan Archit. 42 (05), 162–164. doi:10.3969/j.issn.1007-8983.2022.05.053
Yangwei (2019). Study on large deformation mechanism of stress soft rock in highland of liutongzhai tunnel and application of construction measures. Build. Technol. Dev. 46 (04), 85–87. doi:10.3969/j.issn.1001-523X.2019.04.046
Yu, F. (1990). Research on the support of soft rock tunnel in China. J. Min. and Saf. Eng. 7 (2), 1–5.
Zhang, Z. (2003). Discussion and research on large deformation of extruded surrounding rock tunnel. Mod. Tunn. Technol. (02), 5–12+40. doi:10.3969/j.issn.1009-6582.2003.02.002
Zhang, J.-Z., Zhou, X.-P., and Yin, P. (2019). Visco-plastic deformation analysis of rock tunnels based on fractional derivatives. Tunn. Undergr. Space Technol. 85, 209–219. doi:10.1016/j.tust.2018.12.019
Keywords: advanced support, deformation control, creep characteristics, high geostress, soft rock tunnel
Citation: Peng T, Liu P, Shi M, He F, Wang W, Wang A and Yan T (2025) Research on advanced support and deformation control technology of a high-geostress soft rock tunnel. Front. Earth Sci. 13:1710441. doi: 10.3389/feart.2025.1710441
Received: 22 September 2025; Accepted: 20 October 2025;
Published: 18 November 2025.
Edited by:
Xiaoping Zhou, Chongqing University, ChinaReviewed by:
Yong Niu, Shaoxing University, ChinaNan Xiao, Changsha University of Science and Technology, China
Copyright © 2025 Peng, Liu, Shi, He, Wang, Wang and Yan. This is an open-access article distributed under the terms of the Creative Commons Attribution License (CC BY). The use, distribution or reproduction in other forums is permitted, provided the original author(s) and the copyright owner(s) are credited and that the original publication in this journal is cited, in accordance with accepted academic practice. No use, distribution or reproduction is permitted which does not comply with these terms.
*Correspondence: Tao Yan, eWFudGFvMTk4MjA4MDFAc3dqdHUuZWR1LmNu