 Delin Li1,2,3Zongren Li1,2,3*
 Peng Guan4,5,6Li Huang1,2,3Sailajia Wei7Qiping Li1,2,3Huijun Qi1,2,3Xing Zhang1,2,3Decai Kong1,2,3Shibin Ma1,2,3Yonghao Hou1,2,3Zibin Li8Yi Luo6,7
- 1Institute of Geological Survey of Qinghai Province, Xining, China
- 2Qinghai Remote Sensing Big Data Engineering Technology Research Center, Xining, China
- 3Qinghai Geological Survey Institute, The northern Qinghai-Tibet Plateau Geological Processes and Mineral Resources Laboratory, Xining, China
- 4Faculty of Civil Engineering, Guangzhou institute of Science and Technology, Guangzhou, China
- 5Faculty of Engineering, China University of Geosciences (Wuhan), Wuhan, China
- 6School of Urban Construction, Wuhan University of Science and Technology, Wuhan, China
- 7Geological Environment Monitoring Station of Qinghai Provincial, Xining, China
- 8The Eighth Geological Team of Jiangxi Geological Bureau, Shangrao, China
Against the backdrop of global climate warming, glaciers across the Qinghai–Tibet Plateau are undergoing widespread retreat, glacial lakes are expanding rapidly, and disasters such as ice avalanches and glacial lake outburst floods (GLOFs) are occurring with increasing frequency, posing severe threats to regional transportation arteries, energy facilities, and urban safety. As a typical concentration area of glaciers and glacier-related hazards, Qinghai Province holds great scientific and engineering significance for related research. By integrating medium- and high-resolution optical imagery, SAR data, InSAR techniques, and field investigation records, this study systematically extracted glacier extent, glacial lake evolution, glacier surface velocity, and mass balance variations in Qinghai Province. Results reveal that between 2000 and 2020, the province’s glaciers retreated by approximately 230.49 km2, with the most significant shrinkage occurring within the 5,300–5,500 m elevation range. A threefold classification system for ice avalanche hazards, applicable to the Qinghai-Tibet Plateau, is proposed, which includes direct ice avalanche hazards, ice avalanche-glacial lake outburst hazards, and ice avalanche-dammed lake chain hazards. A total of 551 glacier-related geohazard sites were identified in Qinghai Province, primarily concentrated in the Kunlun and Tanggula Mountains. Based on the engineering geological analogy method and a multi-factor weighted overlay approach, a glacier hazard susceptibility assessment system was constructed, dividing the study area into low, medium, and high susceptibility zones. The findings not only deepen the understanding of glacier-climate-hazard coupling mechanisms but also provide a scientific basis for regional disaster prevention, mitigation, and the operational safety of major infrastructure projects.
1 Introduction
As a sensitive component of the global climate system, glaciers are a critical source of regional water cycles and runoff recharge, as well as direct indicators of climate change (Sandhu et al., 2024). Under global warming, glaciers across the Qinghai-Tibet Plateau have generally retreated, with widespread glacier mass loss and rapid expansion of glacial lakes in recent years (Wei et al., 2019). These changes have reshaped regional hydrology and triggered alpine hazards, including ice avalanches and glacial lake outburst floods (GLOFs), threatening transportation networks, energy facilities, and urban settlements (Paul, 2019; Ke et al., 2024). Qinghai Province, a major glacier concentration area, has experienced frequent glacier-related hazards closely linked to critical infrastructure such as the Qinghai-Tibet Railway and Beijing-Tibet Highway (Wang et al., 2021). Consequently, glacier hazard research in this region carries not only scientific significance but also substantial social and economic value.
Traditional glacier monitoring methods have primarily relied on field investigations. However, due to the harsh environmental conditions of high-altitude mountainous regions, such methods face limitations in achieving wide-area and high-frequency observations. In recent years, the rapid development of remote sensing technologies has provided entirely new technical support for glacier studies (Yue et al., 2018; Gu et al., 2024). The integrated use of high-resolution optical imagery, multi-temporal SAR data, and InSAR techniques now enables long-term, continuous, and quantitative monitoring of key glacier indicators, including changes in glacier extent, glacial lake dynamics, ice flow velocity, and mass balance (Friedl et al., 2020; Forte et al., 2021). Remote sensing supports understanding of glacier–climate–hydrology interactions and offers a scientific basis for disaster risk management and sustainable development.
In the past decade, multi-source remote sensing and modeling have advanced glacier monitoring. For example, Ke et al. (2022) combined MODIS and Landsat data for large-scale surge monitoring, Gao et al. (2025) systematically analyzed the characteristics and basal processes of an unnamed glacier in the central Himalayas using high temporal resolution remote sensing data combined with glacier modeling. Zhu et al. (2024) employed high-resolution remote sensing data from 2015 to 2023 to examine the continuous retreat of the Thwaites Glacier calving front and associated influencing factors, such as surface meltwater and ice flow velocity. Fang et al. (2024) investigated the spatiotemporal patterns of glacier melt in the upper reaches of the Shule River Basin, driven by climate change, using multi-source, multi-temporal remote sensing imagery. Zhou et al. (2021) identified glaciers in the Tien Shan region during 1990–2019 using Landsat TM/ETM+/OLI data and found evidence of 48 advancing glaciers.
Beyond glacier monitoring, remote sensing imagery has also been widely applied to the identification and analysis of glacier hazards. For instance, Gao et al. (2023) analyzed the spatiotemporal evolution and triggering mechanisms of a GLOF in southeastern Tibet using multi-temporal optical imagery, SAR/InSAR-based surface deformation monitoring, meteorological data, and soil moisture information. Dubey and Goyal. (2020) identified 329 glacial lakes larger than 0.05 km2 in the Indian Himalayas and conducted hazard and risk assessments based on remote sensing. Shangguan et al. (2021) combined satellite data with field investigations to analyze GLOFs in the Karakoram region of India. Yang et al. (2023) integrated multi-source remote sensing data to perform a comprehensive analysis of GLOFs and developed flood simulation models for the Galong Co region that considered different breach depths and outburst volumes. Wang et al. (20242) reconstructed potential future GLOFs in the Poiqu River Basin, central Himalaya, by integrating remote sensing observations and field surveys, while also identifying potential triggers and assessing downstream impacts. Wang et al. (2025) characterized the geological and climatic conditions of recurrent ice-rock avalanches using satellite imagery, meteorological records, and field observations. Yang et al. (2025) developed an integrated framework combining remote sensing and hydrological modeling to quantify mass movement volumes and simulate GLOF process chains, applying it to Jiongpu Co, the largest glacial lake in southeastern Tibet.
In addition, researchers have conducted extensive assessments of glacier hazards based on remote sensing data. For example, Singh et al. (Singh et al., 2023) investigated the 7 May 2022, GLOF event at Shisper Glacier’s ice-dammed lake, identifying potential incision zones at the Mochowar Glacier terminus to assess its susceptibility to future outbursts. Colavitto et al. (2024) compiled a glacial lake inventory for the Patagonian Andes using remote sensing and evaluated key features of regional GLOF events. Kumar et al. (2025) assessed the risk of a potential GLOF from Kashang Lake in the Sutlej River Basin, India. Li et al. (2025) combined remote sensing, field investigation, and numerical modeling to assess the GLOF hazard at Jiongpu Co in southeastern Tibet. Although remote sensing has become a key tool for glacier monitoring and hazard assessment, and related research outcomes continue to grow, Qinghai Province, as one of the most hazard-prone glacier regions with diverse glacier types and strong connections to transportation corridors, still lacks systematic and quantitative regional-scale studies.
Therefore, this study focuses on Qinghai Province, integrating medium- and high-resolution optical imagery, SAR data, and field investigation to analyze glaciers and related hazards. A classification framework for ice avalanche hazards is proposed, including direct ice avalanche hazards, ice avalanche-glacial lake outburst hazards, and ice avalanche-dammed lake chain hazards. The study aims to reveal spatiotemporal patterns of glacier changes and hazards, refine hazard classification for the Qinghai-Tibet Plateau, and provide theoretical and practical support for regional disaster risk assessment and the safety of major engineering projects.
2 Engineering background
Qinghai Province, in the northern Qinghai-Tibet Plateau and part of the “Roof of the World”, features predominantly high terrain, decreasing from west to east, with highlands in the north and south and a lower central region. The mean elevation exceeds 3,000 m, with areas of 4,000–5,000 m covering over half the province. Major mountain ranges, including the Qilian, Kunlun, Bayankala, Animaqin, and Tanggula Mountains, extend over 1,000 km. Peaks above 5,000 m are snow-covered year-round, glaciers are widespread, and ice lakes commonly form in depressions at glacier termini or margins. Intermontane plateaus, basins, and valleys create a complex mosaic of tectonic, fluvial, lacustrine, glacial, and glacial-marginal landforms.
Under global warming, glaciers, glacial lakes, and permafrost in the region have been retreating and degrading. Since the 1990s, accelerated glacier ablation has increased ice avalanches, glacial lake outburst floods, and secondary hazards such as debris flows and dammed-lake breaches, threatening transportation, energy infrastructure, urban safety, and regional ecological and socio-economic stability.
Research on glacier hazards in Qinghai Province is therefore of scientific and practical importance, enhancing understanding of glacier evolution under climate change, refining glacier-climate-hydrology frameworks, and supporting disaster risk reduction and safe infrastructure planning.
3 Remote sensing-based glacier survey and interpretation
This study builds on the principles of geospatial science, image processing, and hazard mapping, integrating multi-source remote sensing data, InSAR techniques, unmanned aerial vehicle (UAV) imagery, and field investigations to develop a comprehensive workflow for glacier dynamics monitoring and hazard assessment. The research framework consists of four key components: acquisition of remote sensing data, data processing and interpretation, InSAR-derived information extraction and analysis, and field-based validation.
3.1 Remote sensing data collection
A total of medium-resolution remote sensing images for general areas of Qinghai Province in 2000, 2015, and 2020 were acquired, along with high-resolution GF and ZY series satellite imagery for nine key monitoring regions, including Geladandong, Sedie Ri, Yanbaoyuze, Kunlun Mountains, Lenglongling, Animaqin, and Qilian Mountains, totaling 839 scenes. Additionally, 185 synthetic aperture radar (SAR) images were collected for three key regions, Kunlun Mountains, Lenglongling, and Animaqin, to facilitate glacier deformation and ice flow velocity retrieval.
3.2 Processing and interpretation of remote sensing data
After acquiring multi-source remote sensing data, a semi-automated interactive interpretation approach, grounded in image processing and geospatial analysis, was applied to systematically process glacier imagery and extract relevant information. The workflow consisted of two main stages, image preprocessing and post-processing, designed to maximize data quality and accuracy and ensure the scientific reliability of glacier feature identification and analysis.
1. Image Preprocessing. Image preprocessing involves radiometric correction, geometric correction, and data optimization and standardization. Radiometric correction removes the effects of non-target factors, including sensor errors, atmospheric scattering, cloud and haze coverage, and terrain shadows, to restore the true radiometric characteristics of glaciers and their surroundings. This process focuses on correcting radiometric distortions through sensor calibration, atmospheric correction, and terrain correction. Geometric correction eliminates distortions introduced during image acquisition, ensuring precise alignment of the image coordinate system with real-world geographic coordinates. This is achieved through control-point-based preliminary correction and high-precision geometric registration. Additional preprocessing and optimization steps, such as image denoising, registration, data fusion, format conversion, standardization, and defect repair, are applied to enhance data compatibility and analytical stability.
To ensure both temporal and geometric consistency across optical, SAR, and InSAR datasets, all imagery was co-registered to a unified spatial reference framework. Geometric alignment was performed using DEM-assisted terrain correction and high-order polynomial warping based on more than 30 ground control points evenly distributed across the study area. For optical data, multi-temporal scenes were orthorectified using the SRTM 30 m DEM, while SAR and InSAR products were co-registered through sub-pixel correlation with a root mean square error below 0.2 pixels. Temporal harmonization was achieved by selecting image pairs within ±12 days of each other to minimize seasonal discrepancies in snow cover and surface reflectance. This workflow ensures comparability and reliability of derived glacier extent, velocity, and deformation products.
2. Remote Sensing Image Interpretation. Based on high-quality preprocessed imagery, systematic interpretation and information extraction were conducted, focusing on three key steps: image classification and target identification, feature extraction and enhancement, and change detection.
Image Classification and Target Identification. Random forest classification was applied, integrating spectral characteristics and ancillary data of glaciers, glacial lakes, snow, bare rock, and water bodies. This approach improved classification accuracy and enabled structured representation of the glacier environment, providing a basis for subsequent dynamic analysis.
Feature Extraction and Enhancement. Multidimensional discriminative features, including spectral, texture, shape, and edge information, were extracted to improve classification and target recognition. Feature enhancement techniques effectively distinguished land cover types with similar spectral characteristics but differing in texture or morphology.
Change Detection. To capture glacier dynamics, multi-temporal images were co-registered and analyzed using image differencing, allowing extraction of typical changes such as glacier retreat and glacial lake expansion. Time-series analysis revealed the spatiotemporal patterns and evolutionary characteristics of glaciers in Qinghai Province.
To ensure temporal and spatial consistency, optical and InSAR datasets were co-registered to a common UTM grid (30 m) using DEM-assisted terrain correction. Temporal harmonization was achieved by selecting imagery of 12 days of each acquisition pair.
This workflow ensures high accuracy and reliability in glacier feature extraction, enabling quantitative assessment of glacier extent and glacial lake area over time, while capturing subtle environmental changes. Using medium-resolution imagery, glacier and glacial lake distributions were extracted for 2000, 2015, and 2020, and area changes were analyzed across these periods. Additionally, multi-temporal high-resolution imagery was employed to monitor glaciers, glacial lakes, and human activities from 2012 to 2020 in nine key monitoring regions, which are Geladandong, Sedie Ri, Baojunse, Yanbaoyuze, Kunlun Mountains, Lenglongling, North Qaidam Mountains, Animaqin, and Qilian Mountains, allowing identification of glacier- and glacial lake-related hazard points.
3.3 Extraction and analysis of InSAR-Derived information
This study combined differential interferometric synthetic aperture radar (D-InSAR), image offset-tracking, small baseline subset InSAR (SBAS-InSAR), and satellite altimetry to systematically monitor glacier surface velocities and estimate changes in glacier mass balance, establishing a multi-tiered framework for dynamic glacier remote sensing.
3.3.1 Monitoring and analysis of glacier surface velocities
To quantify glacier surface velocities, a combined approach using differential interferometric synthetic aperture radar (D-InSAR) and SAR image offset-tracking was employed. D-InSAR derives line-of-sight (LOS) surface displacements from multi-temporal SAR imagery. The workflow comprises four main steps:
1. Image Registration. Sub-pixel registration corrects minor differences in orbit, viewing angle, and resolution among multi-temporal images to ensure spatial consistency.
2. Interferogram Generation. Primary and secondary images acquired over the same area at different times are cross-multiplied to produce interferometric phase maps.
3. Removal of Non-Deformation Phase. Flat-Earth effects are removed using orbital parameters, and topographic phase is eliminated using SRTM or higher-precision Multi-temporal digital elevation models (DEMs).
4. Phase Filtering and Unwrapping. Goldstein adaptive filtering reduces noise, followed by phase unwrapping to obtain continuous LOS displacement fields.
Offset-tracking estimates pixel displacements in azimuth and range directions from intensity differences between SAR images, making it suitable for regions with large deformations or D-InSAR decorrelation. The procedure includes:
1. Image Registration. Coarse registration using orbital data followed by fine registration via cross-correlation analysis.
2. Phase Ramp Removal. Correction of systematic phase errors in Sentinel-1 TOPS mode through azimuth Doppler centroid adjustment.
3. Offset Estimation. Displacements are calculated using normalized cross-correlation (NCC) within template and search windows (1,000 × 200 pixels with step size 20 × 4 pixels).
4. Geocoding. Offsets are georeferenced with precise orbital parameters and DEM data, then converted to surface velocity fields.
This approach was applied to glaciers in the Animaqin and eastern Kunlun Mountains, proving effective for fast-moving glaciers and regions with severe decorrelation.
3.3.2 Monitoring and analysis of glacier mass balance changes
Glacier mass balance in this study was quantified using the geodetic differencing method, which calculates elevation change between multi-temporal DEMs to derive volumetric variation. Multi-temporal DEMs derived from InSAR were used to analyze glacier surface elevation changes through time-series differencing. Glacier volume changes were estimated by integrating these elevation variations with glacier boundary data, and corresponding mass balance changes were calculated using an ice density of 900 kg/m3, following the conventions of previous studies (Friedl et al., 2020; Ke et al., 2024). DEMs generated from InSAR data were temporally matched to optical-derived glacier boundaries to ensure consistency of glacier extent. Field observations at selected sites were used for qualitative validation of glacier thinning patterns. This approach enables spatially continuous, quantitative estimation of glacier mass balance without the need for gravimetric inversion or in situ calibration, which remain challenging in the high-altitude regions of Qinghai Province. The workflow for monitoring and analyzing glacier mass balance is shown in Figure 1.
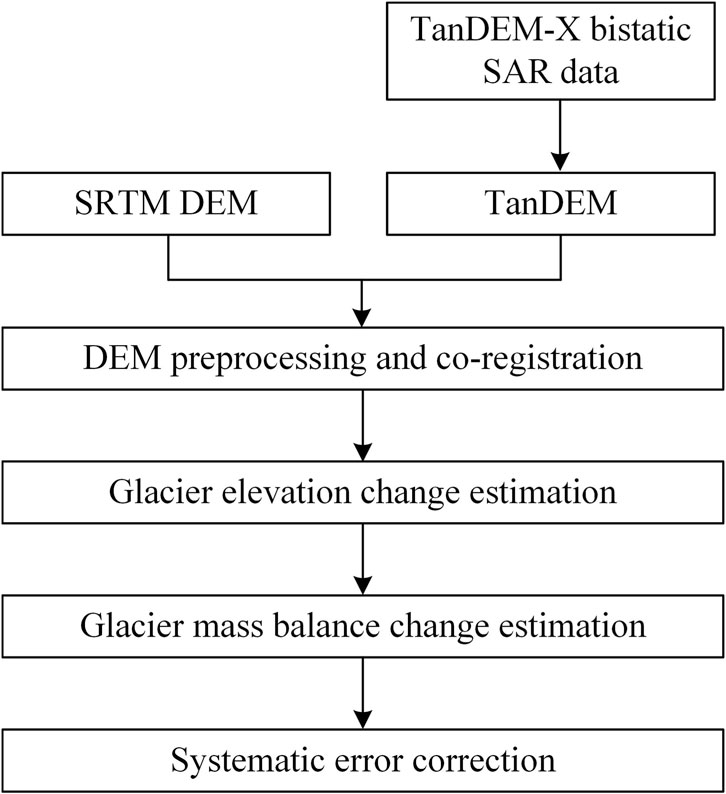
Figure 1. Workflow for monitoring glacier mass balance changes.
3.4 Field-based validation and verification
To verify glacier-related hazards and potential risk sites preliminarily identified through remote sensing interpretation, we combined ground-based field surveys with UAV remote sensing. Verification efforts prioritized sites that may threaten township-level and larger settlements, major transportation corridors, critical infrastructure, and military facilities. During field investigations, suspected hazard sites triggered by glacier melt, GLOFs, and ice/rock avalanches were systematically examined and risk-assessed. Particular attention was given to identifying causal mechanisms, developmental stages, stability conditions, and the exposure of surrounding elements at risk.
For hazard-prone sites that were inaccessible or posed significant safety risks, low-altitude UAV surveys were employed to acquire high-resolution oblique and nadir images. These data were further processed into three-dimensional models, providing supplementary terrain information, enabling the detection of deformation indicators, and supporting the analysis of hydrological connectivity and moraine-dam stability.
The field validation dataset not only provides critical ground-truth evidence for remote sensing interpretation, but also delivers essential baseline information for subsequent hazard risk classification and the development of emergency monitoring systems.
4 Glacier characteristics analysis
4.1 Glacier remote sensing image features
The interpretation of glaciers from remote sensing imagery relies on distinct tonal, morphological, textural, and structural signatures. These characteristics are fundamental for the extraction and monitoring of glaciers. Based on glacier morphology, surface properties, and imaging principles, glaciers in Qinghai Province can be identified using tonal, morphological, textural, climatic, and indirect indicators.
1. Tonal features: Glacier surfaces generally appear brighter than surrounding rocks and bare land, although brightness is often heterogeneous and may display stripes or patches. Glaciers and snowfields exhibit similar tones; however, snow margins are typically brighter than glacier edges. Snow-covered surfaces appear white, while shaded areas or those affected by dust deposition tend to appear darker.
2. Morphological features: Glacier surfaces present a variety of geomorphic expressions, such as convex ridges, concave depressions, and undulating terrain.
3. Textural features: Bare ice often reveals stratification and distinctive structural textures.
4. Climatic features: In glaciology, a glacier is divided into accumulation and ablation zones. The boundary observed during periods of highest temperature and minimal snow cover provides an important indicator of glacier extent in imagery.
5. Indirect interpretation features: Water bodies adjacent to glacier termini serve as strong indicators of intense ablation and mark significant geomorphic boundaries.
Figure 2 presents representative images of different glacier types identified in this study using the above interpretation features.
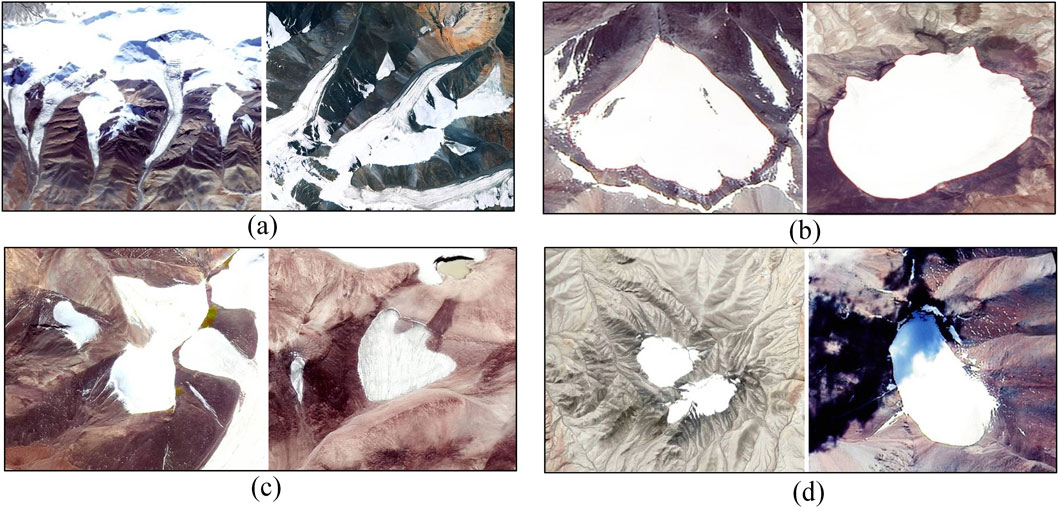
Figure 2. Remote sensing images of glaciers: (a) valley glacier from GF-1; (b) cirque glacier from GF-6; (c) hanging glacier from GF-6; (d) flat-topped glacier from GF-1.
4.2 Regional distribution of glaciers
Analysis of 2020 remote sensing data shows that Qinghai Province contains 3,985 glaciers, with a total area of 3,745.04 km2, accounting for approximately 0.54% of the provincial landmass. Glaciers are mainly concentrated in the headwater regions of major mountain ranges (Figure 3). The Qilian Mountains host 1,271 glaciers with a combined area of 807.45 km2. The Kunlun Mountains contain 1,354 glaciers with an area of 1,345.86 km2, and the Tanggula Mountains comprise 1,351 glaciers with a total area of 1,592.51 km2.
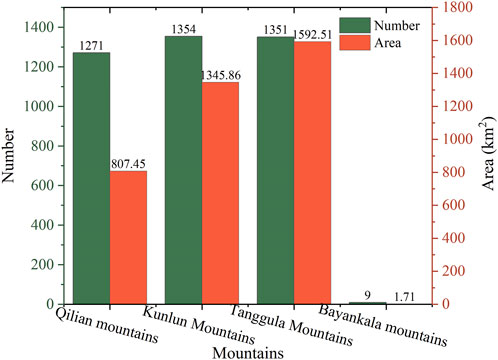
Figure 3. Distribution of glaciers across mountain ranges in Qinghai Province.
At the county level (Figure 4), glaciers are predominantly distributed in Golmud City, Zhiduo County, Tianjun County, Delingha City, and Zaduo County. Among these, Golmud City has the largest glacierized area, covering 1,744.77 km2.
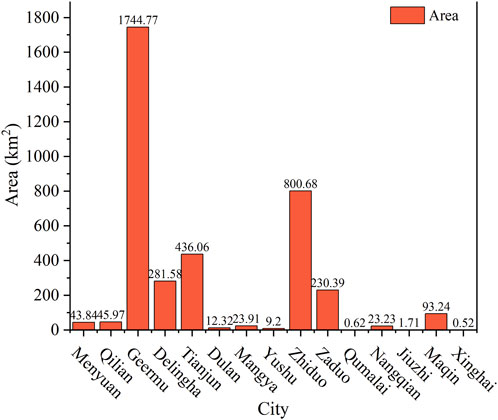
Figure 4. Glacierized area by county.
4.3 Altitudinal distribution of glaciers
The distribution of glacier areas across elevation bands is illustrated in Figure 5. From 2000 to 2020, glaciers in Qinghai Province showed a consistent retreat. The most significant shrinkage occurred between 5,300 and 5,500 m, where glacier area decreased by 73.59 km2, indicating a marked upward shift of the snowline under a warming climate. In contrast, glaciers situated below 4,500 m exhibited only a minor reduction of 7.32 km2. These results demonstrate that glaciers at mid-to high elevations are more sensitive to climatic warming, whereas local shading effects and the buffering capacity of small low-elevation glaciers have partially delayed melting processes.
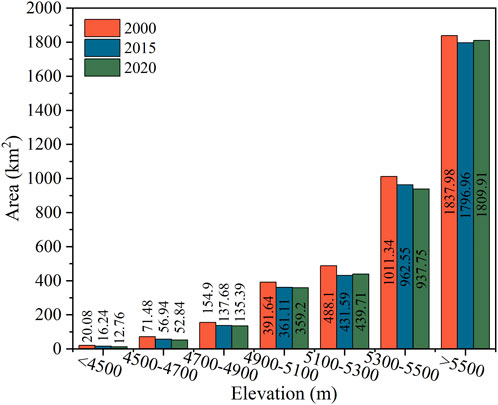
Figure 5. Altitudinal distribution of glaciers in different years.
4.4 Glacier mass balance changes
Glacier variations are a direct response to climate change, with temperature and precipitation acting as primary controls on advance and retreat. Between 2000 and 2020, glaciers in all major mountain ranges of Qinghai Province experienced a net reduction in area, although a few glaciers advanced locally. Overall, glacier area decreased from 3,975.53 km2 in 2000 to 3,745.04 km2 in 2020, representing a total loss of 230.49 km2.
Based on glacier delineation in 2000, 2015, and 2020, glaciers in the Kunlun, Qilian, and Bayan Har Mountains all experienced contraction (Figure 6). For instance, glacier area in the Qilian Mountains declined from 1,755.49 km2 in 2000 to 1,592.51 km2 in 2020, a net loss of 162.98 km2. In the Kunlun Mountains, glacier area decreased from 881.10 km2 in 2000 to 807.47 km2 in 2020, a reduction of 73.63 km2. Only the Tanggula Mountains showed a slight increase, from 1,335.32 km2 in 2000 to 1,345.87 km2 in 2020.
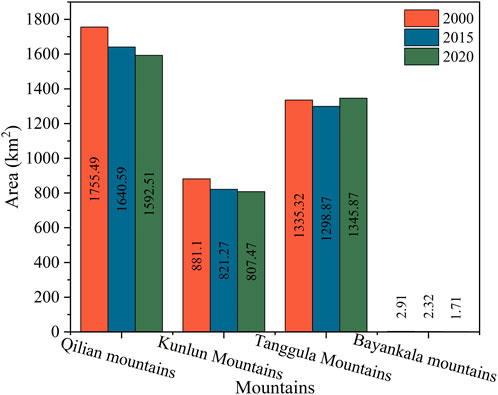
Figure 6. Glacier area changes in major mountain ranges across different periods.
4.5 Glacier flow velocity characteristics
Using the SAR offset-tracking method, the surface velocity of the Yuzhu Peak glacier was monitored from 2015 to 2020. Results revealed significant spatial and temporal variability in glacier dynamics across Qinghai Province. Sentinel-1A ascending-pass data were processed to generate offset fields, which were subsequently converted to range displacement and geocoded using the SRTM 90 m DEM. This produced annual glacier velocity maps expressed in meters per year.
The highest velocities were concentrated in the central part of the glacier, with speeds gradually decreasing toward the terminus, where they approached zero, as illustrated in Figure 7. Seasonal analysis further demonstrated that during the ablation season (May to September), velocities increased markedly, reflecting enhanced basal sliding and meltwater lubrication. Conversely, during February to June and October to February, glacier velocities remained relatively low, indicating a period of stability.
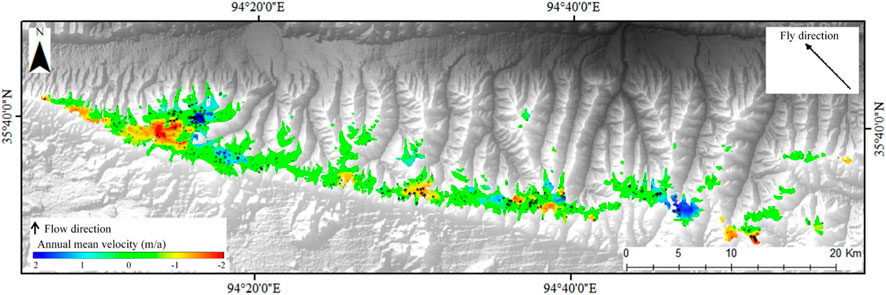
Figure 7. Annual mean surface velocity of the Yuzhu Peak glacier based on data from Sentinel-1A.
These findings highlight the rapid response of Qinghai–Tibet Plateau glaciers to climate fluctuations. Their dynamic behavior not only serves as a sensitive indicator of climate warming but also provides an essential reference for future runoff projections and hazard risk assessments.
5 Characteristics of glacier-related hazards
5.1 Classification of glacier hazards and remote sensing features
Existing classification schemes for ice avalanche hazards remain limited and lack standardization. Since prevention and mitigation strategies differ significantly among hazard types, establishing a comprehensive classification system is essential for the Qinghai–Tibet Plateau. Earlier studies, such as Salzmann et al. (2004), categorized ice avalanche hazards into four groups: (1) avalanches triggered by glacier collapse, (2) mixed ice–rock avalanches, (3) debris flows caused by mixed avalanches, and (4) GLOFs induced by ice avalanches. However, this framework does not fully account for conditions on the Qinghai-Tibet Plateau, where, for example, debris from ice avalanches can block rivers and subsequently trigger dam-break floods. Based on a synthesis of previous research and guided by the principles of comprehensiveness, operability, and standardization, this study proposes a tripartite classification system: direct ice avalanche (DIA) hazards, ice avalanche–glacial lake outburst (IAGLO) hazards, and ice avalanche–dammed lake chain (IADLC) hazards.
This threefold scheme provides a more complete representation of hazard processes induced by glacier collapse and offers a theoretical foundation for subsequent hazard research. Validation of the threefold ice avalanche hazard classification was conducted primarily through empirical threshold comparison and field verification. For each hazard category, geomorphological indicators such as slope angle, glacier thickness, and proximity to glacial lakes were compared against observed field conditions to verify classification accuracy. Although no physically based numerical simulation was conducted, the empirical thresholds correspond well with documented hazard processes and field evidence, ensuring classification reliability and practical applicability for regional-scale assessments.
5.1.1 Direct ice avalanche hazards
Direct ice avalanche hazards occur when glaciers situated on steep slopes fracture and collapse under gravity, mixing with debris to form rapidly moving mass flows that damage downstream settlements and infrastructure, as shown in Figure 8. Such hazards typically develop in three zones: initiation, transport, and deposition. The initiation zone is often located in steep, glacier-dense areas of the plateau. The transport zone lies close to the source, with debris moving along valleys that can be clearly observed in remote sensing imagery. The deposition zone occurs in gentler terrain, where debris loses momentum and accumulates into alluvial fans.
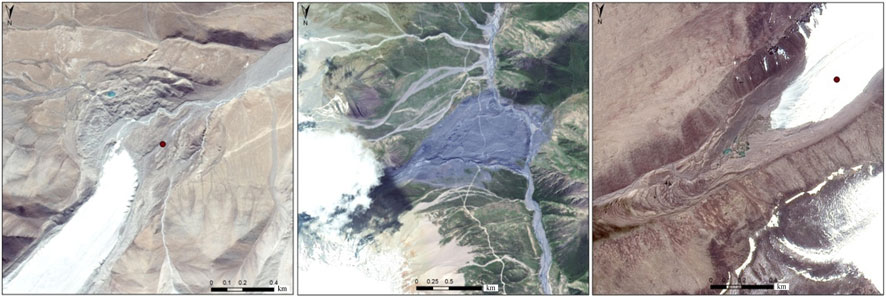
Figure 8. Remote sensing image of a DIA hazard from GF-1.
In Qinghai Province, steep topography amplifies hazard intensity, as fractured ice masses gain substantial initial velocity. Although movement slows in lower-gradient terrain, deposition often forms conspicuous fans distinguishable in imagery by their lighter gray or brown tones, contrasting with surrounding bedrock, as shown in Figure 8.
A representative example is hazard site IV-9 in the East Kunlun monitoring area, located in Xidatan, Geermu City (94°14′54.897″E, 35°41′2.441″N), as illustrated in Figure 9. The glacier covers 3.6172 km2, with elevations ranging from 4,593 to 5,969 m and a relative relief of 1,376 m. This valley glacier shows well-developed arcuate crevasses, indicating past avalanches. The absence of significant moraine deposits increases risk to the Qinghai–Tibet Railway. The transport zone extends for approximately 4 km.
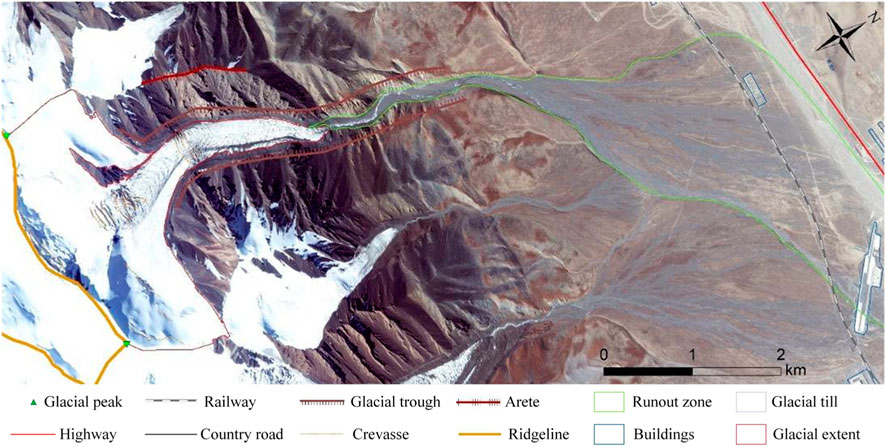
Figure 9. Remote sensing interpretation of the IV-9 DIA hazard from GF-1 in the East Kunlun key monitoring area.
Figure 10 illustrates field investigation photographs of the IV-9 DIA hazard site. Field investigation confirmed that the IV-9 hazard is large in scale, threatening 2.2 km of the Qinghai–Tibet Railway, 2.5 km of the Beijing–Tibet Highway, 15 houses, and 20 residents, with an estimated economic exposure of 80 million RMB. The glacier remains unstable, with melt, rainfall, and seismic activity identified as primary triggers. While the long transport channel limits the likelihood of debris reaching beyond the valley, the retreating glacier poses a significant risk of debris flows, which could endanger railway operations.
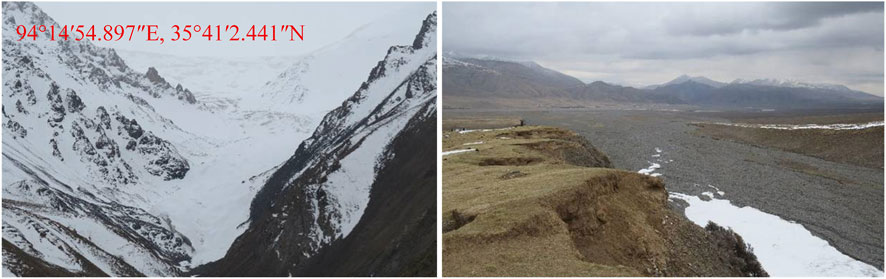
Figure 10. Field investigation image of the IV-9 DIA hazard.
5.1.2 Ice avalanche-glacial lake outburst hazard
An ice avalanche-glacial lake outburst hazard occurs when avalanche debris plunges into a glacial lake, generating waves that breach the moraine or ice dam and trigger downstream flooding. Unlike conventional GLOFs, which result from spontaneous drainage or dam failure, this type is specifically induced by glacier collapse. The resulting floods often form hazard chains, destroying villages, roads, and bridges downstream.
The sequence typically follows: accelerated glacier ablation, increased meltwater supply, glacial lake expansion, declining lake stability, avalanche entry into the lake, and eventual dam breach leading to catastrophic flooding. In remote sensing imagery, these events are identifiable by flood deposits with darker brown or gray tones, sharply contrasting with surrounding terrain, as illustrated in Figure 11.
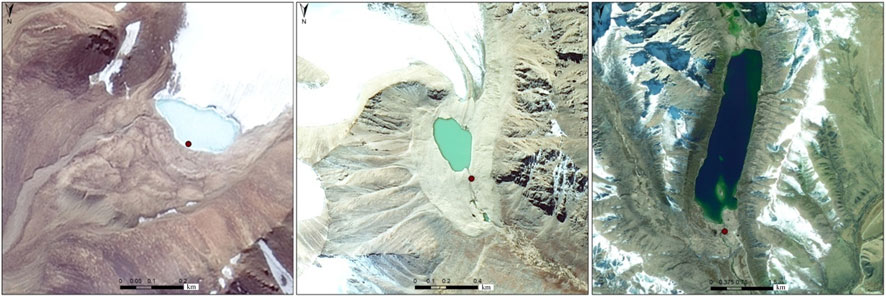
Figure 11. Remote sensing image of IAGLO hazard from GF-1.
Hazard site IV-14 in the East Kunlun monitoring area provides an example, as illustrated in Figure 12. Located in Xidatan, Geermu City (94°8′45.876″E, 35°40′55.221″N), the glacier covers 0.7886 km2 with an elevation range of 4,886–5,535 m. It exhibits arcuate crevasses indicative of past avalanches. The associated glacial lake, situated at 4,876.5 m, has an area of 0.0083 km2 and formed as meltwater was impounded by moraine deposits. The debris threatens the Qinghai–Tibet Railway and Highway within a 2 km downstream reach, with a transport zone length of about 3 km.
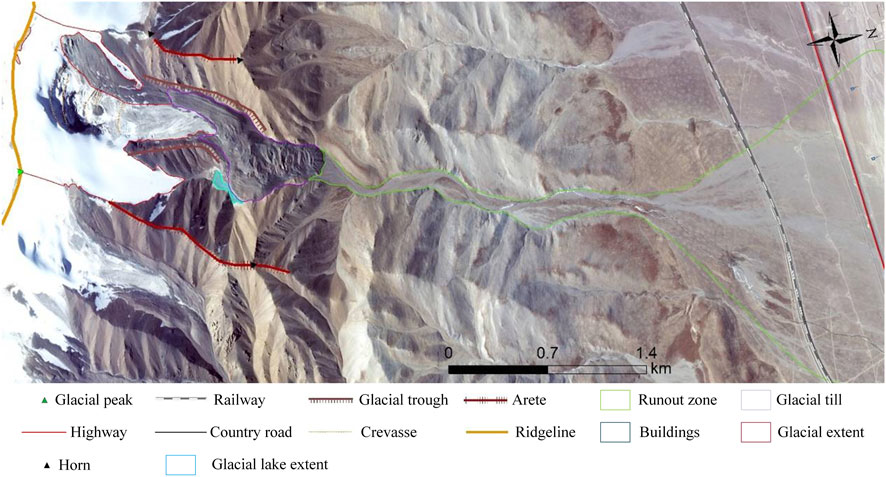
Figure 12. Remote sensing interpretation of the IV-14 IAGLO hazard from GF-1 in the East Kunlun key monitoring area.
Figure 13 displays field investigation photographs of the IV-14 IAGLO hazard site. Field investigations confirmed that IV-14 is a large-scale hazard, posing risks to 1.5 km of railway and 2 km of highway, with an estimated exposure of 55 million RMB. Although the glacial lake remains relatively small and stable, abundant channel debris increases the probability of debris flows, thereby maintaining a threat to infrastructure.
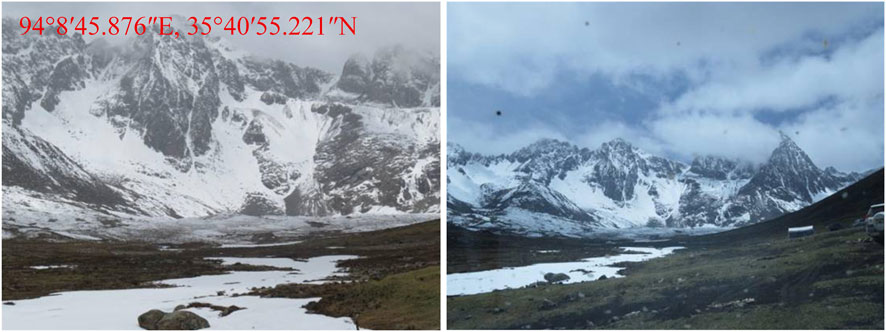
Figure 13. Field investigation image of the IV-14 IAGLO hazard.
5.1.3 Ice avalanche–dammed lake chain hazard
Ice avalanche–dammed lake chain hazards are the most complex type, involving glacier collapse that produces debris blocking river channels, forming temporary lakes that eventually breach and release catastrophic floods. These events closely resemble debris flow–flood disasters.
In this process, fractured glacier blocks slide downslope, entraining Quaternary loose deposits in valleys. Frictional heat partially melts ice, generating water that infiltrates sediments, inducing slope creep and debris movement. Unmelted ice and debris block rivers, forming dammed lakes. As residual ice melts and the dam is eroded by river discharge, eventual breach produces destructive floods or debris flows. Remote sensing imagery reveals these events through distinct tonal and textural contrasts between debris source zones and surrounding terrain, typically in slopes of 10°–45°, as shown in Figure 14.
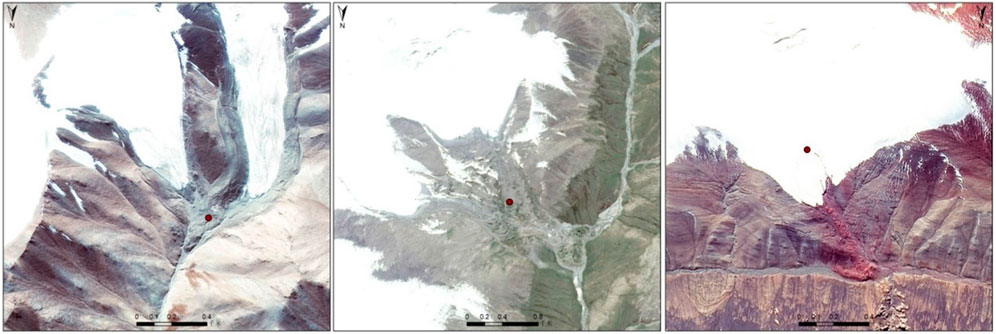
Figure 14. Remote sensing image of an IADLC hazard from GF-1.
An illustrative case is site IV-6 in the East Kunlun monitoring area, located in Xidatan, Geermu City (94°18′26.703″E, 35°40′39.749″N), as illustrated in Figure 15. The site contains two glaciers with areas of 2.2527 and 0.1975 km2. Elevations range from 4,593 to 5,741 m, with well-developed arcuate crevasses indicating previous avalanches. Moraine deposits are extensive, threatening the Qinghai-Tibet Railway and the Kunlun Mountain Mineral Water Plant. The transport zone extends approximately 5 km.
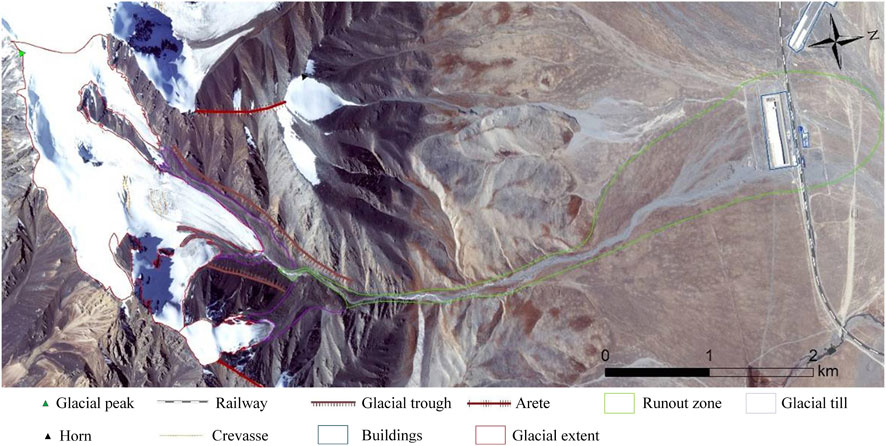
Figure 15. Remote sensing interpretation of the IV-6 IADLC hazard from GF-1 in the East Kunlun key monitoring area.
Field investigation photographs of the IV-14 IADLC hazard site is illustrated in Figure 16. Field investigation confirmed IV-6 as a large hazard, threatening 1 km of railway, 1 km of highway, a factory, a railway station, 20 houses, and about 100 people, with an estimated exposure of 260 million RMB. The event was mainly caused by avalanches from smaller external glaciers, whose debris blocked drainage channels of larger valley glaciers, forming a temporary dammed lake. Although current channels are relatively unobstructed, abundant debris maintains the potential for debris flows, posing risks to both the railway and the mineral water plant.
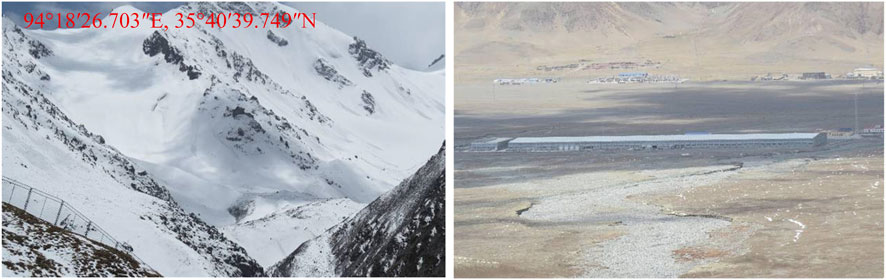
Figure 16. Field investigation image of the IV-6 IADLC hazard.
5.2 Spatial distribution of glacier hazards
Remote sensing interpretation identified 551 glacier hazards in Qinghai Province, including 411 DIA hazards, 111 IAGLO hazards, and 29 IADLC hazards. As illustrated in Figure 17, these hazards are primarily concentrated in Haixi Prefecture (286 sites) and Yushu (173 sites), with smaller clusters in Haibei (45 sites) and Guoluo (47 sites). IAGLO hazards are most frequent in Geermu (30 sites), followed by Zaduo (15 sites) and Yushu (13 sites). IADLC hazards are concentrated in Geermu (14 sites) and Zaduo (5 sites). DIA hazards are most prevalent in Geermu (167 sites), with additional clusters in Zhiduo (65 sites) and Zaduo (44 sites).
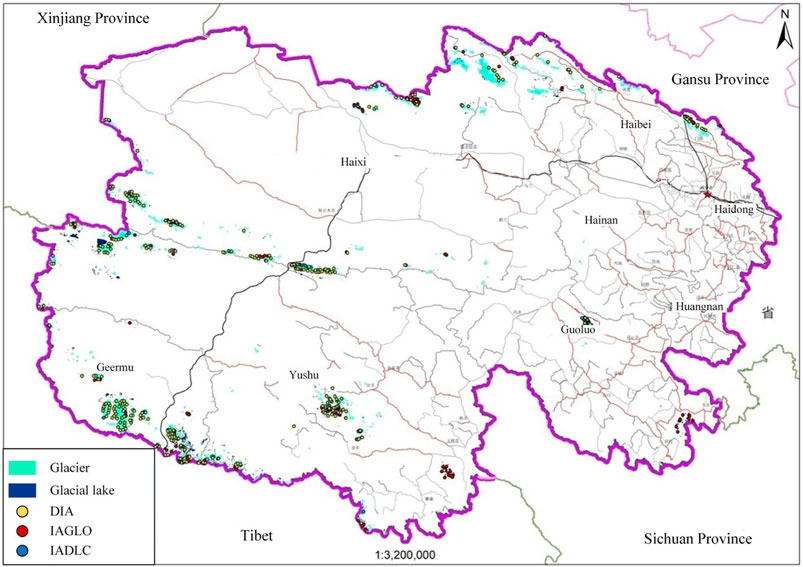
Figure 17. Spatial distribution of glacier hazards in Qinghai Province.
By mountain range, glacier hazards are most widely distributed in the Tanggula Mountains (242 sites, 44%) and the Kunlun Mountains (189 sites, 34%), while the Bayankala Mountains contain the fewest (9 sites, 2%). The Qilian Mountains account for 111 sites (20%), as depicted in Figure 18. In the Tanggula Mountains, 179 are DIA hazards, 57 are IAGLO hazards, and 6 are IADLC hazards. In the Kunlun Mountains, there are 152 DIA hazards, 18 IAGLO hazards, and 19 IADLC hazards. The Qilian Mountains host 80 DIA hazards, 27 IAGLO hazards, and 4 IADLC hazards. In the Bayankala Mountains, only 9 IAGLO hazards were identified.
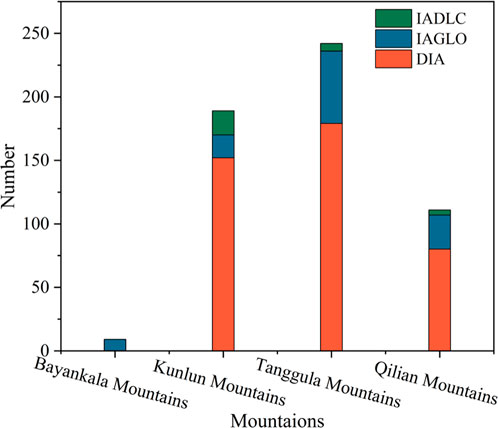
Figure 18. Number of glacier hazards by mountain range.
5.3 Topographic and geomorphic controls on hazards
5.3.1 Correlation between glacier hazards and elevation
Statistical analysis shows that most glacier hazards occur between 4,500 and 4,600 m and 5,200–5,500 m. This pattern reflects distinct regional characteristics: the 4,500–4,600 m band corresponds mainly to hazard development in the Qilian Mountains of northern Qinghai, while the 5,100–5,500 m band represents the primary elevation range of hazards in the Kunlun and Tanggula Mountains of central and southern Qinghai. As illustrated in Figure 19, DIA hazards are concentrated between 4,400 and 4,500 m and 5,100–5,500 m, IAGLO hazards occur mainly between 4,000 and 4,300 m and 4,500–4,600 m, while IAADLC hazards are most frequent at 5,200–5,300 m.
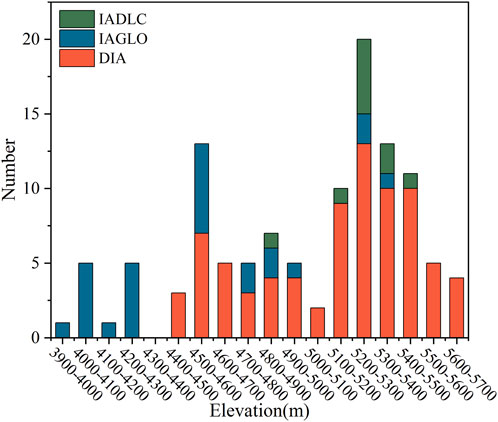
Figure 19. Elevation distribution of glacier hazards.
5.3.2 Correlation between glacier hazards and slope
Statistical analysis of 115 interpreted glacier hazard sites indicates that most hazards occur on slopes of 5°–35°. Specifically, 12 sites (10%) are located on slopes of 0°–5°, 22 sites (19%) on 5°–15°, 31 sites (27%) on 15°–25°, 33 sites (29%) on 25°–35°, and 17 sites (15%) on 35°–45°. As shown in Figure 20, the number of IAGLO hazards decreases with increasing slope, whereas other hazard types show an initial increase followed by a decline. Overall, approximately 56% of glacier hazards are concentrated on slopes between 15° and 35%, demonstrating that hazard occurrence in Qinghai Province is not only controlled by climatic and glaciological factors but also strongly constrained by topographic and geomorphic conditions.
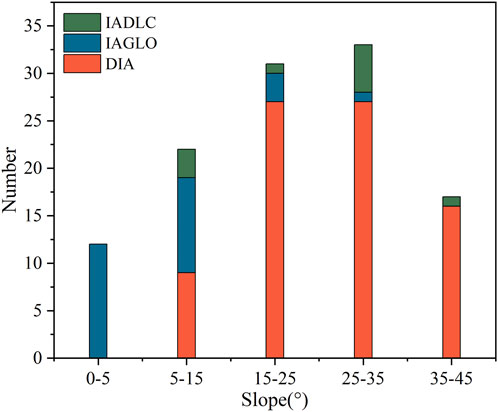
Figure 20. Slope distribution of glacier-related hazards.
5.4 Glacier hazard susceptibility assessment
Glacier hazard susceptibility zones refer to areas where glacier-related hazards are more likely to occur. The delineation is based on the principle of engineering geological analogy, which assumes that similar static and dynamic environmental conditions produce similar hazards, and that regions with frequent past occurrences are likely to remain hazard-prone in the future. The susceptibility assessment in this study focuses on the frequency and activity of DIA hazards, IAGLO hazards, and IADLC hazards, as well as the development of related geological phenomena. By integrating the geological and environmental background of the study area with hazard characteristics, key influencing factors such as slope, aspect, morphology, and human engineering activities were selected as fundamental evaluation parameters (Cemiloglu et al., 2023; Mao et al., 2024). On this basis, a glacier hazard susceptibility index system for Qinghai Province was established and illustrated in Figure 21.
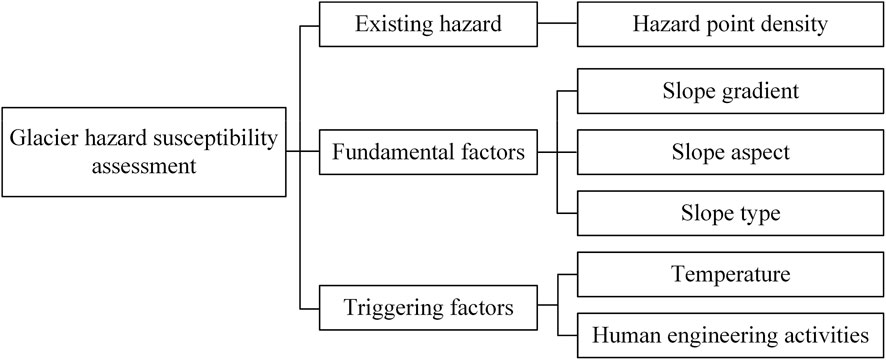
Figure 21. Assessment indicators of glacier hazards susceptibility.
Building on a comprehensive analysis of the natural environment and hazard conditions in the study area, this research systematically summarized and quantified the key factors influencing glacier hazards. In addition to topographic and anthropogenic factors, regional climatic indicators such as mean annual temperature were incorporated to fully capture the environmental drivers of hazard occurrence (Ahadi and Rosta, 2024). Given the multi-state and differentiated impacts of these factors, continuous variables were reasonably classified and stratified in accordance with the principle of differentiation, thereby ensuring both scientific validity and operational feasibility of the evaluation system.
All evaluation indicators were normalized to construct an indicator matrix for assessment units (Yeganeh et al., 2025). Given the high frequency of ice avalanche occurrences on slopes steeper than 40°, the susceptibility level for slopes greater than 40° was defined as 1. In contrast, ice avalanche events are rare on slopes below 10°, and therefore their susceptibility level was defined as 0. For slopes ranging from 10° to 40°, the susceptibility values were normalized between 0 and 1 according to the observed probability of natural ice avalanche phenomena within each slope interval. Since most glacier-related hazard phenomena in the study area occur on south-facing slopes, slopes with an aspect greater than 180° were assigned a susceptibility value of 1, while those with aspects between 0° and ±180° were linearly normalized within the range of 0–1. For slope type, when the curvature value is less than 0, the surface is concave or step-like and exhibits the lowest susceptibility. When the curvature value is greater than 0, the surface tends to be planar or convex, indicating higher susceptibility. The curvature values were linearly normalized between 0 and 1 to reflect this trend. High-resolution remote sensing interpretation data from the study area were used to calculate glacier change rates, which were subsequently normalized between 0 and 1 for the entire region. The non-uniformity coefficient of mean annual temperature across the region was also processed using a 0–1 normalized differential method.
A comprehensive susceptibility map of glacier hazards across Qinghai Province was then generated through spatial overlay and weighted calculations. Weights for each indicator were derived using an Analytic Hierarchy Process (AHP) informed by empirically expert judgment. To classify susceptibility levels, the mutation point method was applied to determine threshold values, dividing the study area into three categories: low, medium, and high susceptibility zones, with corresponding classification criteria. Validation was performed by comparing the zoning results with the spatial distribution of 551 identified glacier-related geohazards. Results indicate a clear spatial differentiation: high-susceptibility zones are concentrated along major transportation corridors and densely populated urban areas, whereas medium- and low-susceptibility zones are mainly distributed in regions with gentler terrain and smaller glaciers, as shown in Figure 22. This framework not only achieves a quantitative spatial delineation of glacier hazard susceptibility but also provides a robust scientific basis for hazard monitoring, early warning, and regional disaster prevention and mitigation.
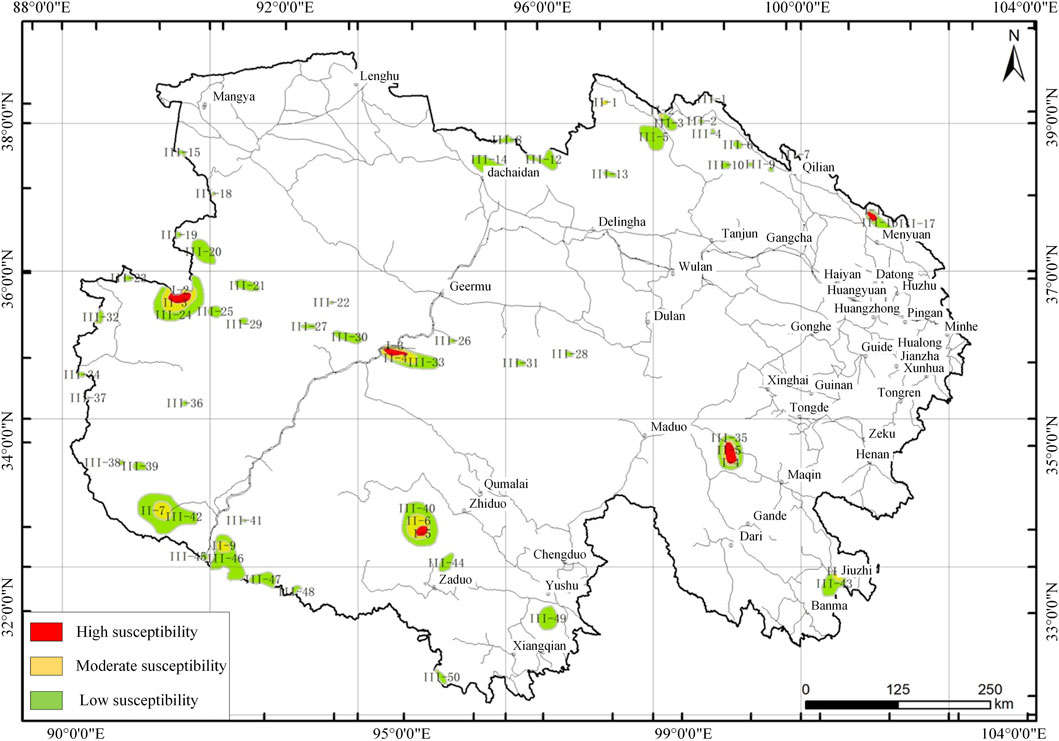
Figure 22. Glacier hazard susceptibility assessment results.
6 Discussion
6.1 Evaluation of multi-source remote sensing integration
The integration of optical and SAR datasets in this study has proven effective for characterizing glacier surface changes and hazard-related deformation. Optical imagery provided detailed surface information for delineating glacier boundaries and detecting visible collapse features, while SAR and InSAR observations captured subtle displacement and elevation changes. This complementary approach demonstrates the necessity of combining different remote sensing modalities to overcome the limitations of single-source data.
Although differences in spatial resolution and acquisition geometry pose challenges to data fusion, the joint use of optical and radar products significantly improves the temporal coverage and interpretability of glacier change patterns. Future studies can further enhance this integration through standardized preprocessing and by incorporating higher temporal frequency datasets to better capture short-term instability processes.
6.2 Reliability and limitations of the hazard susceptibility assessment
The glacier hazard susceptibility assessment approach established in this study effectively distinguishes regions of differing instability potential. The assessment results reflect the combined influence of slope, glacier thickness, proximity to water bodies, and thermal-hydrological conditions, aligning with observed patterns from field verification. However, the assessment does not account for interdependence between climatic, geomorphological, and hydrological drivers. The sensitivity of the identified 551 glacier-related hazard sites to projected temperature and precipitation trends, as well as forward-looking scenarios (e.g., CMIP6-based) are not considered in this study, which should be considered in future research.
While the multi-factor weighted overlay method provides an intuitive and quantitative framework for susceptibility assessment, its reliance on empirical weighting introduces a degree of subjectivity. Interdependence among climatic and topographic variables may also affect the robustness of the index in certain areas. Consequently, the results should be interpreted as a relative indication of susceptibility rather than an absolute prediction of hazard occurrence.
6.3 Implications for regional risk management and operational application
The identification of glacier hazard-prone zones across the highlands of China offers valuable insights for regional disaster prevention and infrastructure safety planning. By highlighting regions where glacier retreat, slope instability, and hydrological connectivity overlap, this study provides a scientific basis for prioritizing monitoring and mitigation efforts in high-risk basins.
From a practical standpoint, the developed susceptibility assessment system can be operationalized as part of an early-warning and planning framework in several ways. Firstly, the susceptibility layers can be integrated into existing geographic information systems (GIS) used by regional authorities to support real-time decision-making for transportation corridors, hydropower projects, and settlement planning (Abgrami et al., 2025). Secondly, hazard susceptibility maps can serve as baseline references for the prioritization of field surveys and the placement of ground-based sensors in key catchments. For instance, the combination of satellite-derived hazard zones with hydrometeorological data can help delineate threshold levels for issuing local alerts. This provides an operational pathway toward low-cost, scalable early-warning systems that account for both spatial uncertainty and observational constraints. Finally, for infrastructure planning, the susceptibility framework can be applied at the feasibility assessment stage to identify potentially unstable terrain and evaluate alternative routing or protective engineering options. In areas with limited data connectivity, periodic satellite updates can complement traditional risk inspection, forming a hybrid monitoring approach suited to the plateau’s logistical and environmental constraints.
Through these applications, the susceptibility assessment system developed in this study not only enhances scientific understanding but also provides a transferable tool to support disaster preparedness and sustainable development in high-mountain regions.
7 Conclusion
Based on multi-source remote sensing data, InSAR techniques, and field investigations, this study systematically examined the spatial and temporal patterns of glaciers and glacier-related hazards in Qinghai Province, and developed a regional hazard susceptibility assessment framework. The main conclusions are as follows:
1. From 2000 to 2020, glacier area decreased by about 230.49 km2, with the most significant retreat occurring at 5,300–5,500 m.
2. InSAR monitoring showed seasonal acceleration of glacier flow during ablation periods, reflecting the strong climatic sensitivity of glaciers such as Yuzhu Peak.
3. A tripartite classification of glacier hazards was proposed, consisting of DIA hazards, IAGLO hazards, and IADLC hazards, and 551 hazard sites were identified, mainly concentrated in the Kunlun and Tanggula Mountains.
4. Hazards occur most frequently between 4,500 and 5,500 m and on slopes of 15°–35°, indicating strong climatic and topographic controls.
5. A susceptibility assessment system was constructed using a multi-factor weighted overlay approach, dividing the study area into low, medium, and high susceptibility zones with high-risk zones concentrated along transport corridors and urban areas.
In summary, this study reveals the retreat patterns and dynamic responses of glaciers in Qinghai Province under a warming climate, clarifies the classification and spatial distribution of glacier hazards, and proposes a quantitative susceptibility assessment framework. The findings enhance understanding of glacier–climate–hazard interactions on the Qinghai–Tibet Plateau and provide a scientific basis for regional disaster prevention, mitigation, and the safety of major engineering projects, as well as for maintaining ecological security.
Data availability statement
The datasets presented in this article are not readily available because the authors do not have permissions to share the data. Requests to access the datasets should be directed toMTMzODk3NTU4ODFAMTYzLmNvbQ==.
Author contributions
DL: Conceptualization, Funding acquisition, Methodology, Writing – original draft. ZL: Data curation, Funding acquisition, Investigation, Writing – original draft. PG: Funding acquisition, Supervision, Writing – review and editing. LH: Formal Analysis, Validation, Writing – original draft. SW: Project administration, Resources, Validation, Writing – original draft. QL: Data curation, Investigation, Software, Writing – original draft. HQ: Formal Analysis, Project administration, Validation, Writing – original draft. XZ: Formal Analysis, Validation, Visualization, Writing – original draft. DK: Validation, Writing – review and editing. SM: Conceptualization, Investigation, Software, Writing – original draft. YH: Data curation, Methodology, Validation, Writing – original draft. ZL: Investigation, Software, Writing – original draft. YL: Methodology, Supervision, Writing – review and editing.
Funding
The authors declare that financial support was received for the research and/or publication of this article. This work was financially supported by the Qinghai Province Natural Resources Development Special Project “Basic Investigation of Water Resources in Qinghai Province - Remote Sensing Monitoring and Field Review of Typical Glaciers (QHCX-2025–033)”, “Investigation and Monitoring of Natural Resources of Glaciers and Ice Lakes in Qinghai Province (QHZC-2021–050)”, National Natural Science Foundation of China (Grant No. 42407204), Postdoctoral Fellowship Program of CPSF (Grant No. GZC20232473), China Postdoctoral Science Foundation Funded Project (Grant No. 2024M763062) and Hubei Postdoctoral Innovation Talent Support Project (Grant No. 2024HBBHCXA088).
Conflict of interest
The authors declare that the research was conducted in the absence of any commercial or financial relationships that could be construed as a potential conflict of interest.
Generative AI statement
The authors declare that no Generative AI was used in the creation of this manuscript.
Any alternative text (alt text) provided alongside figures in this article has been generated by Frontiers with the support of artificial intelligence and reasonable efforts have been made to ensure accuracy, including review by the authors wherever possible. If you identify any issues, please contact us.
Publisher’s note
All claims expressed in this article are solely those of the authors and do not necessarily represent those of their affiliated organizations, or those of the publisher, the editors and the reviewers. Any product that may be evaluated in this article, or claim that may be made by its manufacturer, is not guaranteed or endorsed by the publisher.
References
Abgrami, A., Zhang, W.-F., Mao, H., and Wang, L. (2025). GIS-based comparative landslide susceptibility mapping for Kelardasht county with ANN, SVM and RF models. Civ. Geoengin. Lett. 2. doi:10.22034/CGEL.2.1.e100028
Ahadi, E., and Rosta, D. A. (2024). Landslide susceptibility analysis for Azershahr region using SVM and logistic regression methods. Civ. Geoengin. Lett. 1. doi:10.22034/CGEL.1.2.e100022
Cemiloglu, A., Zhu, L., Mohammednour, A. B., Azarafza, M., and Nanehkaran, Y. A. (2023). Landslide susceptibility assessment for Maragheh county, Iran, using the logistic regression algorithm. Land 12, 1397. doi:10.3390/land12071397
Colavitto, B., Allen, S., Winocur, D., Guillet, S., Dussaillant, A., Manchado, A. M.-T., et al. (2024). A glacial lake outburst floods hazard assessment in the Patagonian Andes combining inventory data and case-studies. Sci. Total Environ. 916, 169703. doi:10.1016/j.scitotenv.2023.169703
Dubey, S., and Goyal, M. K. (2020). Glacial Lake outburst flood hazard, downstream impact, and risk over the Indian himalayas. Water Resour. Res. 56, e2019WR026533. doi:10.1029/2019WR026533
Fang, C., Zhu, R., Yin, Z., Chen, Z., Shan, J., Wang, L., et al. (2024). Remote sensing monitoring of glacier area and volume changes in glacier-fed mountainous watershed on the Northern margin of the Qinghai-Tibet Plateau under climate change. Environ. Monit. Assess. 196, 966. doi:10.1007/s10661-024-13130-y
Forte, E., Santin, I., Ponti, S., Colucci, R. R., Gutgesell, P., and Guglielmin, M. (2021). New insights in glaciers characterization by differential diagnosis integrating GPR and remote sensing techniques: a case study for the Eastern Gran Zebrù glacier (Central Alps). Remote Sens. Environ. 267, 112715. doi:10.1016/j.rse.2021.112715
Friedl, P., Weiser, F., Fluhrer, A., and Braun, M. H. (2020). Remote sensing of glacier and ice sheet grounding lines: a review. Earth-Sci. Rev. 201, 102948. doi:10.1016/j.earscirev.2019.102948
Gao, Y., Yang, W., Guo, R., and Jiang, L. (2023). Remote sensing monitoring and analysis of Jinwuco lateral moraine landslide-glacial Lake outburst in Southeast Tibet. Remote Sens. 15, 1475. doi:10.3390/rs15061475
Gao, Y., Wang, J., Liu, S., Qi, M., Liang, P., and Mu, J. (2025). Mechanisms of glacier surges in the central himalayas uncovered using remote sensing and glacier modelling. Geomorphology 482, 109816. doi:10.1016/j.geomorph.2025.109816
Gu, F., Zhang, S., Zhang, Q., Li, D., Fu, Y., and Chen, X. (2024). The velocity extraction and feature analysis of glacier surface motion in the gongar region based on multi-source remote sensing data. Front. Earth Sci. 12, 1413531. doi:10.3389/feart.2024.1413531
Ke, L., Zhang, J., Fan, C., Zhou, J., and Song, C. (2022). Large-scale monitoring of glacier surges by integrating High-Temporal- and -Spatial-Resolution satellite observations: a case study in the karakoram. Remote Sens. 14, 4668. doi:10.3390/rs14184668
Ke, L., Wang, R., Zhang, J., and Ding, X. (2024). Remote-sensing characterization of surging glaciers in high Mountain Asia in the past two decades. Front. Earth Sci. 12, 1499882. doi:10.3389/feart.2024.1499882
Kumar, R., Goswami, A., and Kulkarni, A. V. (2025). Understanding the future dynamics of Kashang Glacial Lake in Indian himalaya: remote sensing and modeling-based hazard assessment. J. Indian Soc. Remote Sens. doi:10.1007/s12524-025-02250-8
Li, S., Li, C., Li, Z., Li, L., and Wang, W. (2025). Ice avalanche-triggered Glacier Lake outburst flood: hazard assessment at jiongpuco, Southeastern Tibet. Water 17, 2102. doi:10.3390/w17142102
Mao, Y., Li, Y., Teng, F., Sabonchi, A. K. S., Azarafza, M., and Zhang, M. (2024). Utilizing hybrid machine learning and soft computing techniques for landslide susceptibility mapping in a drainage basin. Water 16, 380. doi:10.3390/w16030380
Paul, F. (2019). Repeat Glacier collapses and surges in the amney Machen Mountain range, Tibet, possibly triggered by a developing rock-slope instability. Remote Sens. 11, 708. doi:10.3390/rs11060708
Salzmann, N., Kääb, A., Huggel, C., Allgöwer, B., and Haeberli, W. (2004). Assessment of the hazard potential of ice avalanches using remote sensing and GIS-modelling. Nor. Geogr. Tidsskr. 58, 74–84. doi:10.1080/00291950410006805
Sandhu, H. A. S., Gusain, H. S., Arora, M., Cherubini, C., Singh, D. K., and Tripathi, N. (2024). Monitoring of spatio-temporal glaciers dynamics in Bhagirathi basin, gharhwal himalayas using remote sensing data. Environ. Earth Sci. 83, 305. doi:10.1007/s12665-024-11565-7
Shangguan, D., Li, D., Ding, Y., Liu, J., Anjum, M. N., Li, Y., et al. (2021). Determining the events in a glacial disaster chain at badswat glacier in the karakoram range using remote sensing. Remote Sens. 13, 1165. doi:10.3390/rs13061165
Singh, H., Varade, D., de Vries, M. V. W., Adhikari, K., Rawat, M., Awasthi, S., et al. (2023). Assessment of potential present and future glacial lake outburst flood hazard in the Hunza valley: a case study of Shisper and Mochowar glacier. Sci. Total Environ. 868, 161717. doi:10.1016/j.scitotenv.2023.161717
Wang, X., Liu, L., Hu, Y., Wu, T., Zhao, L., Liu, Q., et al. (2021). Multi-decadal geomorphic changes of a low-angle valley glacier in the East Kunlun Mountains: remote sensing observations and detachment hazard assessment. Nat. Hazards Earth Syst. Sci. 21, 2791–2810. doi:10.5194/nhess-21-2791-2021
Wang, X., Zhang, G., Veh, G., Sattar, A., Wang, W., Allen, S. K., et al. (2024). Reconstructing glacial lake outburst floods in the Poiqu River basin, central Himalaya. Geomorphology 449, 109063. doi:10.1016/j.geomorph.2024.109063
Wang, Q., Li, B., Xing, A., Liu, Y., and Zhuang, Y. (2025). A 15-year history of repeated ice-rock avalanches from a single source area in the Qinghai-Tibet Plateau. Landslides 22, 235–253. doi:10.1007/s10346-024-02355-0
Wei, Y., Wang, S., Liu, J., and Zhou, L. (2019). Multi-Source remote-sensing monitoring of the monsoonal maritime glaciers at Mt. Dagu, East Qinghai-Tibetan Plateau, China. IEEE Access 7, 48307–48317. doi:10.1109/ACCESS.2019.2909991
Yang, L., Lu, Z., Ouyang, C., Zhao, C., Hu, X., and Zhang, Q. (2023). Glacial Lake outburst flood monitoring and modeling through integrating multiple remote sensing methods and HEC-RAS. Remote Sens. 15, 5327. doi:10.3390/rs15225327
Yang, L., Lu, Z., Zhao, C., Hu, X., and Wang, B. (2025). Studying mass movement sources and potential glacial Lake outburst flood at Jiongpu Co, Southeastern Tibet, using multiple remote sensing methods and HEC-RAS model. J. Geophys Res-Earth 130, e2024JF008067. doi:10.1029/2024JF008067
Yeganeh, A., Nazari, R., Zhu, D., Tagizadeh, P., and Chen, Z. (2025). Landslide inventory database for hazard assessment in the Alborz Mountains, Iran, 2. Civil and Geoengineering Letters. doi:10.22034/CGEL.2.1.e100035
Yue, L., Shen, H., Yu, W., and Zhang, L. (2018). Monitoring of historical Glacier recession in Yulong Mountain by the integration of Multisource remote sensing data. IEEE J-STARS 11, 388–400. doi:10.1109/JSTARS.2017.2776901
Zhou, S., Yao, X., Zhang, D., Zhang, Y., Liu, S., and Min, Y. (2021). Remote sensing monitoring of advancing and surging glaciers in the Tien Shan, 1990–2019. Remote Sens. 13, 1973. doi:10.3390/rs13101973
Zhu, Q., Guo, H., Zhang, L., Liang, D., Wu, Z., Liu, Y., et al. (2024). Analysis of continuous calving front retreat and the associated influencing factors of the Thwaites glacier using high-resolution remote sensing data from 2015 to 2023. Int. J. Digit. Earth 17, 2390438. doi:10.1080/17538947.2024.2390438
Keywords: Qinghai Province, remote sensing monitoring, InSAR, glacier hazards, susceptibility assessment
Citation: Li D, Li Z, Guan P, Huang L, Wei S, Li Q, Qi H, Zhang X, Kong D, Ma S, Hou Y, Li Z and Luo Y (2025) Glacier and glacier hazard characterization based on remote sensing interpretation: a case study in Qinghai Province, China. Front. Earth Sci. 13:1712450. doi: 10.3389/feart.2025.1712450
Received: 24 September 2025; Accepted: 04 November 2025;
Published: 02 December 2025.
Edited by:
Hans-Balder Havenith, University of Liège, BelgiumReviewed by:
Karoly Nemeth, Institute of Earth Physics and Space Science (EPSS), HungaryMohammad Azarafza, University of Tabriz, Iran
Copyright © 2025 Li, Li, Guan, Huang, Wei, Li, Qi, Zhang, Kong, Ma, Hou, Li and Luo. This is an open-access article distributed under the terms of the Creative Commons Attribution License (CC BY). The use, distribution or reproduction in other forums is permitted, provided the original author(s) and the copyright owner(s) are credited and that the original publication in this journal is cited, in accordance with accepted academic practice. No use, distribution or reproduction is permitted which does not comply with these terms.
*Correspondence: Zongren Li, MTg2OTcyMzgzMzlAMTYzLmNvbQ==