 Songlin Chen
 Mingjie Zhao1,2
 Kui Wang
- 1Engineering Research Center of Diagnosis Technology and Instruments of Hydro-Construction, Chongqing Jiaotong University, Chongqing, China
- 2School of Civil and Hydraulic Engineering, Chongqing University of Science and Technology, Chongqing, China
Based on the established theory of electrical resistivity, models for the electrical resistivity of soil-rock mixture (S-RM) are developed from the perspectives of two distinct conductive media. Shear tests were conducted on the S-RM using a modified triaxial device, and electrical resistivity and deformation were measured simultaneously. The theoretical models were evaluated against the experimental results to assess its accuracy. The results indicate that as shear deformation increases, the deviatoric stress and electrical resistivity of S-RM sample exhibit an inverse relationship. The stress-strain-resistivity curve for S-RM differs from that of soil and concrete. When the confining pressure is low, the Maxwell conduction model effectively characterizes the resistivity changes of S-RM. However, as the confining pressure increases, its ability to characterize these changes diminishes. The relative error between the theoretical resistivity values derived from Maxwell conduction model and the measured values exhibits a discrete distribution, ranging from 1% to 14%. Notably, the maximum relative error reaches 13.61%. The series-parallel model demonstrates stable and exceptional resistivity characterization capability across varying rock contents and confining pressures. The distribution of relative errors is more concentrated, exhibiting a variation range of 3%–8%, and the maximum relative error is merely 7.16%. The available resistivity models combined with practical applications do indeed provide the possibility for the precise application of the electrical resistivity method in geotechnical engineering.
1 Introduction
A special geotechnical material composed of high-strength rock blocks and low-strength soil matrix was broadly distributed around the nature. Different from the traditional geological classification method of soil, several researchers had defined this geomaterial as a soil-rock mixture (S-RM) from the perspective of several physical characteristics such as soil-rock strength ratio, soil-rock threshold (S-RT) and rock content (Zhong et al., 2016; Zhang et al., 2016). Moreover, from the perspective of physical mechanics, the definition of this type of geomaterial has been elaborated in greater detail, significantly advancing the development of the concept of S-RM (Wang et al., 2015; Afifipour and Moarefvand, 2014). In general, we can understand the S-RM as: it is a typical inhomogeneous porous media system composed of rocks and fine-grained soils with different strength and particle sizes. It serves as a crucial raw material for the formation of hillsides (Zhang and Liu, 2023) and landslides (Li et al., 2024), and is also utilized as filling material in earth-rock dams, highways, airports, and other construction projects. For example, the Jiuzhai Huanglong Airport located in Sichuan, China, has a S-RM foundation fill of up to 104 m.
Xu et al. (2011) concluded that the differences in the accumulation types of S-RM have an effect on its geological origin. Wang et al. (2014) proposed that the material composition characteristics and morphological characteristics of S-RM are complex. Compared to conventional soil and rock, the shear strength characteristics, permeability, and constitutive model of S-RM exhibited greater complexity (Jin et al., 2021; Wang et al., 2022). These properties are not a simple superposition of the individual properties of soil and rock. Factors such as rock block content, moisture content, rock lithology and stress conditions greatly influenced the mechanical behavior of S-RM (Liang et al., 2023; Tu et al., 2021; Zhang et al., 2020).
The S-RMs are widely distributed in China and are always found in shallow strata. The differences in the strength characteristics of S-RM can easily lead to various geological disasters, including landslides, debris flows, and wetting deformation, with landslides being the most prevalent. According to the survey by Chinese researchers, 1736 landslides were found in an area of 100 km2 in the upper Yangtze River, China, with a total volume of 133.9 × 10⁸ m3, and 90% of them were the S-RM landslides (Xia and Guo, 1997). An inventory of geological hazards that had occurred in the Three Gorges reservoir area, China revealed that there were as many as 117 S-RM landslides with volumes >1 × 10⁷ m3 within the entire reservoir area (Deng et al., 2017). In general, hydraulic action, including rainfall and prolonged river erosion, can lead to the failure of bank slopes and subsequently result in soil-rock landslides. These phenomena are particularly prevalent in southwestern China. These landslides incurred massive environmental damage and economic loss (Zhang et al., 2018). However, a method for precisely and rapidly detecting soil-rock landslides in on-site measurements is lacking. Thus, there is a need to explore an appropriate technique for estimating the stability of geological bodies composed of S-RM.
An intriguing challenge for researchers is to identify an internal variable that can be detected nondestructively throughout the deformation process while also conveying the necessary information pertinent to the corresponding study. Generally, the measured physical properties (e.g., electrical resistivity, acoustic emission, ultrasonic method and computed tomography) often reflect the spatial distribution and evolution of various physical phases (solid, liquid, gas) within porous media (Falzone et al., 2019). Measuring mechanical waves in cemented geotechnical materials enabled the identification and analysis of crack initiation and propagation under dynamic loading conditions (Rizvi et al., 2020). Recent analyses on temperature field evolution under steady and cyclic loading conditions further demonstrated that conductive path reconfiguration governs macroscopic resistivity response in geomaterials (Ahmad et al., 2021). Detailed thermal characterization of soil under ultra-high voltage operational conditions had demonstrated nonlinear dependencies between temperature gradients, moisture content, and conductivity, analogous to resistivity variations under shear deformation (Ahmad et al., 2025a). Machine learning frameworks had successfully correlated resistivity-derived features with structural deterioration in cementitious and clay-rich systems, supporting data-integrated approaches for resistivity modeling (Ahmad et al., 2025b). It is evident that current research on soil electrical resistivity has transitioned from indoor testing to field applications, evolving from qualitative analyses to quantitative discussions. With the advancement of research, the study of soil electrical resistivity models has garnered increasing attention from scholars, and the established theoretical models have also created opportunities for the precise application of electrical resistivity methods in geotechnical engineering.
Cai et al. (2017) conducted a comprehensive review of electrical resistivity models for saturated porous media. The existing models were systematically categorized into four main groups: empirical model based on experimental results, pore network models, bound and mixing models, and theoretical models. Chu et al. (2023) conducted a review of the research on electrical conduction models applicable to rock and soil media. They classified the predominant electrical conductivity models into three categories: the simple resistance model, the pore network model, and the equivalent medium model. From the perspective of various soil types, Xu et al. (2022) had also provided a comprehensive summary of soil resistivity models and their current application status. The findings indicate that there is a relative scarcity of studies focusing on resistivity models for regionally specific soil types, and the parameters employed in existing resistivity models across different soil types exhibit significant variability. It is important to acknowledge that the existing soil electrical resistivity model serves as a theoretical foundation for developing the electrical resistivity model of S-RM.
In recent years, partial studies on the electrical properties of S-RM had also been carried out. On the basis of the test results of Zhao et al. (2010), we found that the soil-rock ratio (S-RR), moisture content and dry density all had an impact on the electrical resistivity of S-RM. Wang et al. (2019) discussed the variation regularity of electrical resistivity of S-RM with different dry densities and rock contents through indoor experiments. Wang et al. (2021) deemed that there is a correlation between the change of electrical resistivity and the matrix suction of S-RM, and the matrix suction can be evaluated through the electrical resistivity. Zhang et al. (2021) deduced the influence factors of streaming potential of S-RM and analyzed the dependence of the potential coupling coefficient on compactness and concentration. Since conventional experimental methods fall short of monitoring and characterizing the internal structure changes in the process of shearing tests. Therefore, the application of the electrical resistivity method to the shear test of S-RM had been tentatively discussed (Liu et al., 2024a; Zhao et al., 2023). In general, current research on the electrical characteristics of S-RM predominantly focuses on the influence of physical and mechanical properties on their electrical resistivity behavior. Furthermore, the few established resistivity models are predominantly empirical in nature, derived from fitting experimental results. Besides, in terms of the electrical conductivity models, Wang and Zhao, (2014) established a series-parallel connection model applicable to S-RM, which can better characterize the effect of physical property parameters on the electrical resistivity. Based on the macroscopic structure of soil and fragmented rock, Zhou et al. (2016) developed a mathematical model for calculating the electrical resistivity of S-RM, which accounts for the effect of volume reduction following the integration of soil and rock components. The aforementioned non-empirical models (Wang and Zhao, 2014; Zhou et al., 2016) primarily investigate the effects of physical property indicators, such as rock content, saturation degree, and porosity, on the electrical resistivity of S-RM. However, they failed to adequately characterize the coupling deformation–resistivity behavior of these mixtures. The theoretical resistivity models developed in this paper not only address this deficiency but also offer valuable theoretical insights into the coupling between mechanical deformation and electrical response.
Based on the established theoretical framework of electrical conduction, this paper primarily investigates the computational model for electrical resistivity of S-RM subjected to deformation loading by considering that the mixtures are composed of solid, liquid, and gas phases. Meanwhile, an indoor triaxial shear-resistivity synchronous test was conducted to validate the accuracy of the Maxwell conduction model that accounts for liquid phase conduction, as well as the series-parallel model that accounts for solid-liquid phase conduction. Also, the merits and demerits of each model were thoroughly discussed, thereby further enhancing the application of the electrical resistivity method in the study of S-RM as geological materials.
2 Computing models of soil-rock mixture
2.1 Maxwell conduction model
The conductive media in S-RM can be classified into solid phase, liquid phase and gas phase. Firstly, the S-RM is considered a two-phase conductive material consisting of a gaseous phase and a solid-liquid phase. Based on the Maxwell conduction theory for two-phase conductive materials (Zeng et al., 2020), the electrical conductivity of S-RM can be represented by the following formula:
where
Since the gas is nearly equivalent to an insulator, the electrical conductivity of the solid-liquid phase is significantly higher than that of the gaseous phase; specifically, this can be expressed as
The integrated electrical conductivity of the solid-liquid phase can be obtained again using Maxwell conduction theory:
where
Since the electrical conductivity of the solid phase is much lower than that of the liquid phase, that is,
By substituting Equations 2, 5, 6 into Equation 3, the following formula can be obtained:
During the shear process of S-RM, if we assume that the compressive deformation of the sample is solely attributed to the compression of the internal pore space within the S-RM, while considering that the solid particle skeleton remains incompressible, then the saturation
where
Substituting Equations 8, 9 into Equation 7, the expression for the electrical conductivity of S-RM under stress can be derived:
Therefore, the electrical resistivity model of S-RM can be written as follows:
where
The preliminary exploration of the model relationship not only establishes a connection between stress and electrical resistivity through volume strain, but also enhances our theoretical understanding of the electrical resistivity response mechanism in S-RM under stress.
2.2 Series–parallel model
It is important to recognize that incorporating the conductivity of solid-phase media often aligns more closely with the actual conductive mechanism present in porous media. In a S-RM, the solid media comprises both soil and rock components. Consequently, it is essential to consider the electrical conductivity of soil and rock separately. While the Maxwell conduction model does not allow for further subdivision of solid-phase media, the series-parallel model provides a more effective solution to this issue.
The series-parallel model effectively simulates the conductive structure of a mixture through a simplified circuit representation (series-parallel circuit). Grounded in the three-phase framework of porous media and fundamental circuit principles, the series-parallel resistivity model has found extensive application in analyzing the electrical conduction characteristics of soil (Chu et al., 2023; Dong et al., 2015). In the derivation of the series-parallel electrical resistivity model for unsaturated soil, it is assumed that the soil element consists of soil particles, pore water, and gas arranged in a series-parallel configuration, as illustrated in Figure 1a, where S denotes the base area of the soil element and L represents its height. However, considering the extremely low electrical conductivity of the gaseous phase, the portions of the medium connected in series with the gaseous phase are regarded as non-conductive. Consequently, the classic series-parallel simplified model of soil electrical resistivity is obtained, as shown in Figure 1b.

Figure 1. Details of series-parallel: (a) Macrostructure model of soil; (b) Series-parallel simplified model of soil; (c) Series-parallel model of soil and rock particles.
Based on the series-parallel model of soil, several researchers had developed series-parallel electrical resistivity models for S-RM (Wang and Zhao, 2014; Zhou et al., 2016). This derivation considers solid particles as comprising both soil and rock components, treating these particles in a series and parallel configuration, as illustrated in Figure 1c. It can be observed that the conduction model, characterized by a series-parallel structure, is still realized through the conduction of current within the medium via different conductive phases. Wang and Zhao, (2014) posited that the conductivity of S-RM is primarily governed by solid particles and pore water. Based on the structure illustrated in Figure 1c, they derived a series-parallel electrical resistivity model for S-RM, as presented in Equation 12:
where
In fact, when soil and rock particles are mixed freely, the larger pores within the S-RM become filled with fine-grained soil. This phenomenon leads to a reduction in the overall volume of the mixed soil and rock compared to what would be expected from theoretical mixing. In view of this, Zhou et al. (2016) also established a series-parallel electrical resistivity model for S-RM based on the structure illustrated in Figure 1c. This model addressed the influence of volume reduction resulting from mixing; however, the cementation coefficient and parameter for saturation degree derived from this model were challenging to obtain, which limited its applicability. Therefore, this paper continues to adopt the series-parallel model (i.e., Equation 12) proposed by Wang et al. as the foundational framework and further develops the target electrical resistivity model. Substituting Equations 8, 9 into Equation 12, we can obtain the following electrical resistivity model:
When the electrical resistivity of soil particles, rock particles, and pore water, along with the porosity and saturation degree prior to shear deformation, are known, it becomes possible to determine the variation in electrical resistivity of S-RM sample throughout the shear deformation process.
3 Experimental measurements
3.1 Materials
In this paper, a representative mudstone-broken soil taken from a slope in the Longgang reservoir area in Chongqing, China was utilized, which exhibited distinct weathering characteristics and was composed of a blend of weathered mudstone and fine-grained soil. Such materials are widely used in the construction of reservoirs and levees in southwestern China. The test materials obtained from the site were sieved and then subjected to secondary proportioning. According to testing standard (ASTM D7181-20, 2020) (ASTM, 2020), the maximum particle size used in the triaxial test should be less than 1/5 of the sample diameter. Considering the sample diameter for subsequent testing, the particle size range of experimental materials was determined as 0–20 mm (see Figure 2a). S-RT is defined as the boundary particle size that distinguishes the “rock block” from the “soil matrix” in the S-RM. In reference to existed studies (Zhang et al., 2016; Tu et al., 2021; Zhang et al., 2015), some scholars had given the methods of determining the S-RT. Zhang et al. (2016) gave the S-RT criterion as 0.05

Figure 2. Details of experimental materials: (a) Particle size groups; (b) Particle size distribution (Rc, rock content).
Referring to Chinese Standard GB/T 50123–2019 (Chinese Standard, 2019), the basic material property indexes of S-RM obtained from the site were presented in Table 1. Figure 3 presented the scanning electron microscope (SEM) photo of the mudstone-broken soil. The blocky particles were observed to be densely packed without obvious layering structure. Tiny pores were evident between the particles, and both curved and linear micro-cracks could be identified. Additionally, some particles exhibited honeycomb-like holes on their surfaces. The microscopic mineral component of the material was determined using X-ray diffraction by Zhang et al. (2021), and the results were summarized in Table 2. Rock blocks are an important constituent of S-RM, whose function is similar to that of coarse aggregates in concrete. Previous studies had indicated that the strength properties of S-RM are co-determined by the rock blocks and soil only when the rock content falls within the range of 25%–75% (Liu et al., 2024a). Considering the significant characteristic that the strength of the mixture is influenced by both soil and rock, as well as the rock content of materials sourced from the site, we established four different rock content levels for S-RM samples: 20%, 30%, 40%, and 50%. The corresponding designed grading curves for these varying rock contents were illustrated in Figure 2b. The nonuniform coefficient Cu corresponding to different rock contents were 14.53 (20%), 17.36 (30%), 18.52 (40%) and 25.13 (50%). The curvature coefficient Cc corresponding to different rock contents were 2.02 (20%), 1.61 (30%), 1.44 (40%) and 1.54 (50%). All the above obtained grading characteristics values satisfied both the conditions of Cu > 5 and Cc = 1-3, therefore, they can be considered as well-graded soils (Zhang et al., 2021).
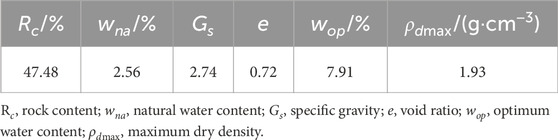
Table 1. Main physical property indexes of S-RM.

Figure 3. SEM photo of particles surface.

Table 2. Mineral component of soil (in %).
3.2 Test apparatus and method
For determining the electrical resistivity, researchers had employed different methods, which can be categorized into two-electrode and four-electrode methods for laboratory one dimensional measurement. In the case of the four-electrode method, the test sample will be interfered by the insertion of the electrode probes. In addition, the practical application of the four-electrode method is infrequent due to the uncertainty associated with the distance between the electrodes. Consequently, there are very few academic examples found in triaxial tests (Chen et al., 2018). Therefore, in this study, the electrical resistivity of S-RM is measured using the two-electrode method. In the two-electrode method, the polarization phenomena are invariably present. In this paper, we propose a solution to eliminate these polarization effects by reversing the polarity of the contact electrode.
The conventional triaxial apparatus had been modified to facilitate the measurement of electrical resistivity changes in S-RM samples during the triaxial test, utilizing the two-electrode method. For this purpose, stainless-steel porous disc copper electrodes with a diameter of 100 mm and a thickness of 5 mm were installed on the pedestal and top cap of the triaxial pressure chamber. A number of microholes, each with a diameter of 1 mm, were perforated in the copper plates to ensure the drainage of water within the sample. The modified triaxial apparatus was illustrated in Figure 4. The apparatus primarily consists of a rigid reaction frame, a pressure chamber, a loading device, and a data control and collection system. The cylindrical sample within the pressure chamber has a diameter of 100 mm and a height of 200 mm. One end of the two fine copper wires wrapped with insulation material inside the pressure chamber are connected to both ends of the tested sample, and the other end are led out from the base pedestal. The test variables obtained—including deviator stress, volumetric strain, displacement, electrical resistivity, among others—are measured and stored by the data collection system. Among them, the resistivity testing system incorporated an electrical signal converter that employed the single-arm bridge technique, accompanied by software for resistivity data acquisition. Before conducting the test, the two ends of the electrodes were directly contacted to measure the electrical resistivity of the testing apparatus. The electrical resistivity of the sample at any given time can be determined by subtracting the apparatus resistivity from the measured value obtained during testing. Meanwhile, a pre-experiment was carried out to not only calibrate the reliability of the modified apparatus, but also to determine a data-acquisition interval of 120 s.

Figure 4. Modified triaxial test equipment.
The soil and rock at each particle size were deposited in an oven at 105 °C for 24 h. According to the particle size distribution curves under different rock contents, the corresponding mass of rock and soil required for each grain group was weighed. Subsequently, an amount of water equivalent to 5% of the mass of the solid materials was added and mixed thoroughly. The S-RM samples were then prepared in three layers within a cylindrical sample barrel, which had a diameter of 100 mm and a height of 200 mm. Each layer was compacted sequentially. To avoid anisotropy caused by layers in layered compaction, hand-chiseling was carried out on the interlaminar contact during the sample preparation process. Double rubber membranes were used to prevent the sharp blocks from puncturing the membrane during the testing process. Table 3 listed the primary physical parameter values of the S-RM samples with four rock contents before triaxial loading (Chinese Standard, 2019), where the maximum dry density was obtained from the standard Proctor test.

Table 3. Primary physical parameters.
After the completion of S-RM samples preparation, the back pressure saturation method was used to accelerate the sample saturation process. Consolidation drainage (CD) tests were carried out at four different rock contents (20%, 30%, 40% and 50%) and under different confining pressures (100 kPa, 250 kPa, 400 kPa, 550 kPa and 700 kPa). Electrical resistivity was measured and recorded during the consolidation and shearing processes. The strain-control mode was adopted and shear rate was 0.15 mm/min. The shearing test was terminated when the axial strain was 15% (Chinese Standard, GB/T 50123–2019) (Chinese Standard, 2019). At this point, the axial displacement reached 30 mm. The loss of confining pressure caused by sample drainage was compensated by the confining pressure regulator to ensure a constant test pressure. In view of the triaxial shearing test is time-consuming, the polishing treatment of the electrode contact surfaces was conducted after each test to reduce the impact of contact resistance. A total of 20 triaxial shearing tests were conducted. All the S-RM samples after the triaxial shear were presented in Figure 5.

Figure 5. S-RM samples after the shearing.
3.3 Results and discussion
3.3.1 Stress–strain–resistivity throughout process
Clarifying the trend of electrical resistivity variation throughout the entire shearing process of S-RM not only aids in assessing the engineering stability of these mixtures but also contributes to improving the electrical theoretical model applicable to rock and soil masses. It can be observed that in the conventional triaxial test, variations in stress, strain, and electrical resistivity of the S-RM samples exhibit similar trends under different rock contents and confining pressures. This finding aligns with the research results presented by Zhao et al. (Zhao et al., 2023). Therefore, taking a rock content of 30% as a case study, the variations of deviator stress and electrical resistivity in relation to axial strain are examined, as shown in Figure 6.

Figure 6. Variations of deviator stress and electrical resistivity with axial strain for 30% rock content: (a) deviator stress-axial strain; (b) electrical resistivity-axial strain.
The stress–strain characteristics of S-RM exhibited slight strain softening under low confining pressure, and gradually changed to intense strain hardening as the testing pressure increased. Different from the brittle rock mass, the evident peak stress phenomenon was not found in the stress-strain curve of S-RM. A common regular pattern under different confining pressure levels was that the increasing trend of deviator stress was rapid in the early stage of strain, and then the increasing rate slowed down.
On analyzing the electrical resistivity–strain curve, under different confining pressures, the electrical resistivity always showed a decreasing trend, but the decreasing rate gradually diminished until it reached the minimum value at an axial strain of 15%. In the initial stage of axial strain (i.e., axial strain from 0% to 2%), the continuous and rapid decrease in the electrical resistivity could be attributed to the discharge of the high resistance vapor phase and the closure of the preexisting defects. Beyond this stage, the electrical resistivity showed a continuous decreasing trend, which may be due to the fact that the formation of multiple conductive paths during shearing. In the later stage of axial loading, the decrease amplitude of the electrical resistivity was already very small. The progressive discharge of a small amount of pore water remained in the S-RM sample and the qualitative changes of the internal microstructure can explain the behavior of such changes in electrical resistivity. Structural rearrangement behaviors of S-RM samples are complex, such as rock block movement, particle breakage, and micro-cracks propagation and closure, etc., which result in the change in the tortuosity of conductive path (Wang et al., 2018). Before the application of stress loading, the rock blocks within S-RM sample exhibit a strong coupling with the surrounding soil. Following the loading process, micro-cracks develop in the interface transition zone between the blocks and the soil. While new conductive pathways continue to form within the sample, it appears that the “cut-off effect” associated with existing cracks exerts a more significant influence on electrical resistivity.
The electrical resistivity evolution results obtained for S-RM under the triaxial compression in this paper are inconsistent with those obtained for concrete and soil under the uniaxial compression. The testing results obtained under a rock content of 30% and confining pressure of 400 kPa were selected and compared with the findings of similar studies, as illustrated in Figure 7 (

Figure 7. Comparison with other research results: (a) this paper; (b) literature (Bai et al., 2017); (c) literature (An et al., 2020); (d) literature (Zeng et al., 2020).
3.3.2 Maxwell conduction model
Wang et al. (2019) conducted research on the overall electrical resistivity of S-RM with varying rock contents and found that the influence range of difference in rock content on the electrical resistivity of these mixtures is negligible. Furthermore, the Maxwell conduction model established in this study treats “soil” and “rock” as solid phases for analytical purposes, without differentiating based on varying rock contents. Consequently, it is adequate to select one rock content for validating the conduction model.
The porosity of the sample prior to consolidation corresponds to the porosity measured at the time of sample preparation. The specific values were presented in Table 3. The saturation level of the sample before consolidation is equal to 1. The porosity and saturation of the sample upon completion of consolidation can be determined using Equations 8, 9. These values represent the initial conditions for porosity and saturation prior to conducting the shear test. Therefore, when the porosity and saturation of S-RM sample are known prior to the commencement of the shear test, it is possible to derive the theoretically calculated value of the sample electrical resistivity during the shear process using the Maxwell conduction model. Taking a rock content of 40% as an example, the validity of the derived theoretical model was verified. The initial values of porosity and saturation prior to the commencement of the shear test were presented in Table 4. The electrical resistivity values calculated by the Maxwell conduction model were compared with the measured values, as shown in Figure 8.

Table 4. Initial values before shearing (Rc = 40%).

Figure 8. Comparison of the measured and model-calculated electrical resistivity: (a) confining pressure 100 kPa; (b) confining pressure 250 kPa; (c) confining pressure 400 kPa; (d) confining pressure 550 kPa; (e) confining pressure 700 kPa.
As illustrated in Figure 8, the electrical resistivity of S-RM obtained from tests conducted under varying confining pressures exhibited a consistent downward trend with increasing volume strain. At the conclusion of the shear process, the test curve revealed a slight downward bending. This phenomenon can be primarily attributed to the fact that there is minimal change in the volume strain of the sample at this stage, while electrical resistivity continues to decrease gradually. Overall, the results of the model calculations exhibited a relatively consistent trend with the experimental curves. The electrical resistivity values derived from these tests were consistently lower than the theoretical calculation values. This discrepancy can be attributed to the fact that the established relationship does not account for the conductivity of the solid phase; it solely considers the conductivity of the liquid present within the pores. However, when water is present on the surface of the solid phase, both the intrinsic conductivity of solid particles and the effects of double electric layers at their surfaces contribute to an actual measured electrical resistivity value that is lower than what is theoretically calculated, which aligns with the findings presented in this paper. The greater the confining pressure during testing, the more pronounced the discrepancy between the measured values and theoretical predictions. As the confining pressure increases, both saturation levels and internal water content decrease. This phenomenon is reflected in theoretical calculation as an increase in electrical resistivity.
Although there exists a certain degree of divergence between the theoretical results and the measured values, overall, the theoretical relationships established in this study can still predict the changes in electrical resistivity for loaded S-RM with relative accuracy, thereby validating the rationality of our theoretical derivation. It is undeniable that the Maxwell conduction model can demonstrate high accuracy when the S-RM has an extremely low water content, as it primarily considers the conductivity of the liquid phase, which had been supported by previous studies on the electrical resistivity of concrete and rock. To more intuitively assess the reliability of the model’s computational outcomes, we calculated the relative error between the theoretical results and the measured values. Taking volume strains of 1%, 2%, and 3% as selection points, we calculated the relative errors between the measured values corresponding to these three volume strains and their respective model calculation values. The average of these three relative errors was taken as the actual relative error under this working condition. Consequently, the relative errors of Maxwell conduction model under five confining pressures were determined to be 2.06% (100 kPa), 1.53% (250 kPa), 4.32% (400 kPa), 8.75% (550 kPa), and 13.61% (700 kPa) respectively. Overall, the obtained relative error values exhibited a significant degree of dispersion, which increased with rising confining pressure, with the maximum error reaching 13.61%. In addition, the root mean square error (RMSE) of electrical resistivity was calculated to be 0.740
3.3.3 Series–parallel model
The series-parallel model incorporates the contribution of solid-phase media to the electrical conductivity of S-RM. Therefore, determining the electrical conductivity values for both soil and rock is essential for effectively applying the series-parallel model. Rh et al. (1976) investigated the relationship among the electrical conductivity of soil, pore fluid, and solid particles through indoor experiments, as given by Equation 14
where
Clearly, when the water content of soil is 0, its electrical conductivity corresponds to that of the solid particles. Consequently, by preparing S-RM samples with pore water exhibiting varying electrical conductivities, it becomes possible to test their overall electrical conductivity (or electrical resistivity). By plotting electrical conductivity on the vertical axis and volumetric water content on the horizontal axis, a curve representing conductivity versus volumetric water content can be generated. The intercept of this curve on the electrical conductivity axis indicates the electrical conductivity of the solid particles.
The soil materials with particle size less than 5 mm from the raw materials taken on site were used as the testing materials. Five types of water, each exhibiting different electrical conductivity properties (including distilled water, tap water, 0.1 mol/L NaCl solution, 0.8 mol/L NaCl solution and 1 mol/L NaCl solution), were selected for this study. Soil samples with varying volumetric water contents were prepared accordingly. Similarly, rock materials with a particle size exceeding 5 mm, obtained from the site, were utilized as testing materials. Additionally, five types of water exhibiting varying electrical conductivity properties were employed for testing purposes. Rock samples with different volumetric water contents were prepared accordingly. The electrical resistivity of these prepared samples was measured using the two-electrode method, and the corresponding electrical conductivity was subsequently calculated. The relationship curves illustrating the correlation between electrical conductivity and volumetric water content for soil samples and rock samples were presented in Figures 9a,b, respectively.

Figure 9. Relationship between electrical conductivity and volumetric water content: (a) soil samples; (b) rock samples.
The electrical conductivity values of the soil and rock particles under five types of testing water were presented in Table 5, and the corresponding average values were used to represent the electrical conductivity of the soil and rock particles. Therefore, the calculated electrical resistivity values of the soil and rock particles were 409.84

Table 5. Electrical conductivity values of soil and rock particles (S·m-1).
The test results presented in this paper, as well as those reported in reference (Liu et al., 2024b), indicated that the effect of confining pressure on the evolution of sample resistivity during triaxial shear is manifested solely in the magnitude of electrical resistivity change before and after the test, without influencing the overall trend of electrical resistivity change. Therefore, it is adequate to choose part of the test confining pressures for the validation of the series-parallel model (250 kPa and 400 kPa). The failure of S-RM slopes is primarily characterized by shallow surface landslides, indicating that the normal stress experienced by the soil at the time of failure is relatively low. In light of this observation, it is both reasonable and sufficient to select lower test confining pressures for model validation. Similarly, the initial values of porosity and saturation required to verify the series-parallel model were shown in Table 6. The calculated values of the series-parallel model were compared with the measured values, as illustrated in Figures 10, 11.

Table 6. Initial values before shearing (Confining pressure: 250 kPa and 400 kPa).

Figure 10. Comparison of the measured and model-calculated electrical resistivity at 250 kPa: (a) Rc = 20%; (b) Rc = 30%; (c) Rc = 40%; (d) Rc = 50%.

Figure 11. Comparison of the measured and model-calculated electrical resistivity at 400 kPa: (a) Rc = 20%; (b) Rc = 30%; (c) Rc = 40%; (d) Rc = 50%.
As illustrated in Figures 10, 11, under two different confining pressures, with an increase in volume strain, the calculated results of the resistivity model were consistent with the measured values obtained from the tests. The test curve exhibited a slight downward bending trend at the conclusion of the shear process. This alteration is primarily attributed to the fact that the volume strain remains nearly constant at the end of shear, while electrical resistivity continues to decrease gradually. Similar to the Maxwell conduction model, we selected volume strain values of 1%, 2%, and 3% as reference points. We then calculated the relative error at each of these selection points and took the average of these three values to determine the actual relative error under this working condition. The calculation results of the relative error were listed in Table 7. Table 7 illustrated that the relative errors of electrical resistivity between the model-calculated values and the measured values at various rock contents, corresponding to each confining pressure, fall within a range of 3%–8%. Compared to the Maxwell conduction model, the relative error distribution of the series-parallel model is more concentrated. The maximum relative error for the series-parallel model is 7.16%, which is lower than that observed in the Maxwell conduction model. Meanwhile, the RMSE of electrical resistivity under various testing conditions can be determined, and the corresponding values were presented in Table 8. Under higher confining pressure, a notable discrepancy exists between the results derived from the Maxwell conduction model and the measured values. However, when accounting for the conductivity of the solid-phase medium, this discrepancy is significantly diminished in the results obtained through the series-parallel model. This finding suggests that incorporating the conductivity of the solid-phase medium allows for a more accurate characterization of the electrical resistivity properties of S-RM.

Table 7. Relative error of electrical resistivity.

Table 8. RMSE of electrical resistivity.
Of course, there are still slight discrepancies between the calculated values of series-parallel model and the measured values. It is believed that these discrepancies arise primarily from two factors: On one hand, there exists an inherent difference between the calculated resistivity values of soil and rock particles and their actual values. Additionally, the resistivity values obtained during the shear process are inevitably influenced by testing accuracy. On the other hand, during the derivation of the model, it is assumed that the soil-to-rock volume ratio (f) for a given sample remains constant throughout the shearing process. However, in reality, during the shearing of a S-RM sample, coarse particle breakage occurs, leading to the variations in f throughout this process. After the coarse particles within the sample are fragmented, there is a corresponding increase in the fine particle component and a decrease in the coarse particle component. Fine particles possess a larger specific surface area and exhibit superior electrical conductivity compared to their coarse counterparts. Furthermore, an increased quantity of fine particles enhances the conductive pathways within the solid-phase medium. Consequently, throughout the deformation process, the actual measured electrical resistivity values are lower than those predicted by the series-parallel model. This observation aligns with the results presented in Figures 10, 11.
Certainly, both the series and parallel models that solely consider soil and rock exhibit evident limitations. The disparity in electrical conductivity between soil and rock particles leads to a decline in overall electrical conductivity when these materials are connected in series. As current traverses through the rock block, a “bottleneck effect” occurs (see Figure 12), resulting in an increase in the model electrical resistivity. Conversely, when soil and rock are arranged in parallel, the “diversion effect” of current (see Figure 12) allows the soil—characterized by superior electrical conductivity—to accommodate a greater amount of current. In this scenario, less current flows through the rock block, resulting in a lower value for model electrical resistivity.

Figure 12. Current flow in series and parallel models of soil and rock particles.
Considering the presence of three conductive channels in the series-parallel model, namely, soil-rock in series, soil-rock in parallel and pore water, the electrical resistivity derived from this model is greater than that obtained from the parallel model but less than that from the series model. This conclusion is further supported by existing experimental results (Zhou et al., 2016). The inherent randomness of the spatial structure of soil and rock blocks within a natural S-RM does not conform to a simple hierarchical stacking arrangement, thus, an error associated with the series-parallel model is always present.
4 Conclusion
Based on existing conductivity models, this study developed electrical resistivity models for S-RM from two distinct perspectives: liquid phase conductivity and solid-liquid phase conductivity. Simultaneously, the validity of the established models was confirmed through indoor triaxial shear tests. Both the Maxwell conduction model and the series-parallel model effectively describe the changes in electrical resistivity of S-RM samples during the shearing process. However, when compared, the series-parallel model demonstrates superior characterization capabilities. Furthermore, we analyzed the advantages and disadvantages of each model to provide guidance for future improvements in modeling approaches. The main conclusions of this study are drawn as follows:
• Under varying rock contents and confining pressures, an increase in deformation leads to a rise in the deviator stress of S-RM samples, accompanied by a decrease in resistivity. The alterations in the mesoscopic structure within the sample, induced by rising deviator stress, can effectively elucidate the macroscopic electrical resistivity response observed in the test. Due to the variations in material properties and pressure conditions, the stress-strain-resistivity curve for S-RM differs from that of soil and concrete.
• Due to the insufficient consideration of the conductivity of solid-phase medium, there exists a significant deviation between the results predicted by Maxwell conduction model and the measured values. The varying confining pressures during testing impact the accuracy of model characterization. As confining pressure increases, the relative error between theoretical resistivity values and measured values escalates from 1.53% to 13.61%, exhibiting a relatively dispersed distribution.
• The series-parallel model, which considered the conductivity of solid-phase medium (soil and rock), provides a highly accurate predicted value compared with the measured value. The distribution of relative errors between the theoretical values derived from this model and the measured values is notably concentrated, with values ranging from 3.52% to 7.16%. The bottleneck effect of series model and the diversion effect of parallel model result in significant limitations in both configurations.
• Building upon existing theories, this study proposes different electrical resistivity models to enable quantitative prediction of the electrical resistivity of S-RM. Although the theoretical models developed in this paper each have their own shortcomings and limitations, they effectively characterize the electrical resistivity behavior of S-RM under deformation loading.
Data availability statement
The original contributions presented in the study are included in the article/supplementary material, further inquiries can be directed to the corresponding author.
Author contributions
SC: Investigation, Methodology, Writing – original draft, Formal Analysis. MZ: Writing – review and editing, Supervision, Funding acquisition, Conceptualization, Project administration. KW: Formal Analysis, Methodology, Writing – review and editing, Funding acquisition, Supervision.
Funding
The authors declare that financial support was received for the research and/or publication of this article. This research was funded by the National Natural Science Foundation of China (Grant No. 51879017); Chongqing Water Conservancy Science and Technology Project (Grant No. CQSLK-2023010); Chongqing Talent Program “Package System” Project (Grant No. CSTC2022YCJH-BGZXM0080).
Conflict of interest
The authors declare that the research was conducted in the absence of any commercial or financial relationships that could be construed as a potential conflict of interest.
Generative AI statement
The authors declare that no Generative AI was used in the creation of this manuscript.
Any alternative text (alt text) provided alongside figures in this article has been generated by Frontiers with the support of artificial intelligence and reasonable efforts have been made to ensure accuracy, including review by the authors wherever possible. If you identify any issues, please contact us.
Publisher’s note
All claims expressed in this article are solely those of the authors and do not necessarily represent those of their affiliated organizations, or those of the publisher, the editors and the reviewers. Any product that may be evaluated in this article, or claim that may be made by its manufacturer, is not guaranteed or endorsed by the publisher.
References
Afifipour, M., and Moarefvand, P. (2014). Mechanical behavior of bimrocks having high rock block proportion. Int. J. Rock Mech. Min. Sci. 65, 40–48. doi:10.1016/j.ijrmms.2013.11.008
Ahmad, S., Rizvi, Z. H., Arp, J. C. C., Wuttke, F., Tirth, V., and Islam, S. (2021). Evolution of temperature field around underground power cable for static and cyclic heating. Energies 14, 8191. doi:10.3390/en14238191
Ahmad, S., Rizvi, Z. H., and Wuttke, F. (2025a). Unveiling soil thermal behavior under ultra-high voltage power cable operations. Sci. Rep. 15, 7315. doi:10.1038/s41598-025-91831-1
Ahmad, S., Ahmad, S., Akhtar, S., Ahmad, F., and Ansari, M. A. (2025b). Data-driven assessment of corrosion in reinforced concrete structures embedded in clay dominated soils. Sci. Rep. 15, 22744. doi:10.1038/s41598-025-08526-w
An, R., Kong, L. W., Bai, W., and Li, C. S. (2020). The resistivity damage model of residual soil under uniaxial load and the law of drying-wetting effects. Chin. J. Rock Mech. Eng. 39 (6), 3159–3167. doi:10.13722/j.cnki.jrme.2019.0514
ASTM (2020). D7181-20. Standard test method for consolidated drained triaxial compression test for soils. West Conshohocken, PA: ASTM International.
Bai, W., Kong, L. W., Guo, A. G., and Lin, R. B. (2017). Stress–strain–electrical evolution properties and damage-evolution equation of lateritic soil under uniaxial compression. J. Test. Eval. 45 (4), 1247–1260. doi:10.1520/JTE20150237
Cai, J. C., Wei, W., Hu, X. Y., and Wood, D. A. (2017). Electrical conductivity models in saturated porous media: a review. Earth-Science Rev. 171, 419–433. doi:10.1016/j.earscirev.2017.06.013
Chen, Y. L., Wei, Z. A., Irfan, M., Xu, J., and Yang, Y. (2018). Laboratory investigation of the relationship between electrical resistivity and geotechnical properties of phosphate tailings. Measurement 126, 289–298. doi:10.1016/j.measurement.2018.05.095
Chinese Standard (2019). Standard for geotechnical testing method. GB/T50123. Beijing: Ministry of Housing and Urban-Rural Development of the People’s Republic of China.
Chu, Y., Cai, G. J., Liu, S. Y., and Han, A. M. (2023). Review of the electrical conduction model of rock and soil medium. J. Southeast Univ. Nat. Sci. Ed. 53 (5), 926–938. doi:10.3969/j.issn.1001-0505.2023.05.020
Deng, Q. L., Fu, M., Ren, X. W., Liu, F., and Tang, H. (2017). Precedent long-term gravitational deformation of large scale landslides in the three gorges reservoir area, China. Eng. Geol. 221, 170–183. doi:10.1016/j.enggeo.2017.02.017
Dong, X. Q., Huang, F. F., Su, N. N., Zhou, W., Zhang, J., and Bai, X. H. (2015). Experimental study of AC electrical resistivity of unsaturated loess during compression. Chin. J. Rock Mech. Eng. 34 (1), 189–197. doi:10.13722/j.cnki.jrme.2015.01.021
Falzone, S., Robinson, J., and Slater, L. (2019). Characterization and monitoring of porous media with electrical imaging: a review. Transp. Porous Media 130, 251–276. doi:10.1007/s11242-018-1203-2
Jin, L., Zeng, Y. W., Li, J. J., and Sun, H. (2021). Investigation of the permeability of soil-rock mixtures using lattice boltzmann simulations. Period. Polytechnica-Civil Eng. 65 (2), 486–499. doi:10.3311/PPci.16276
Li, Q. P., Liu, W. H., He, R. J., Ying, C. Y., Liu, H. R., Dou, Z. N., et al. (2024). A local rainfall-triggered giant landslide occurred in a region along a high-speed railway on the Qinghai–Tibetan Plateau. J. Mt. Sci. 21, 2939–2955. doi:10.1007/s11629-023-8408-8
Liang, S. H., Xiao, X. L., and Feng, D. L. (2023). Study on large-scale direct shear test on soil–rock mixture in an immersion state under water. Int. J. Geomechanics 23 (2), 04022294. doi:10.1061/IJGNAI.GMENG-7643
Liu, G., Wang, K., and Xia, Z. T. (2024a). Experimental study on shear properties and resistivity change of soil-rock mixture. J. Mt. Sci. 21, 3930–3944. doi:10.1007/s11629-024-8911-6
Liu, G., Wang, K., and Zhao, M. J. (2024b). Experimental analysis of resistivity changes and wetting deformation of soil−rock mixture. J. Mater. Civ. Eng. 36 (4), 04024047. doi:10.1061/jmcee7.mteng-16549
Rhoades, J. D., and van Schilfgaarde, J. (1976). An electrical conductivity probe for determining soil salinity. Soil Sci. Soc. Am. J. 40 (5), 647–651. doi:10.2136/sssaj1976.03615995004000050016x
Rizvi, Z. H., Mustafa, S. H., Sattari, A. S., Ahmad, S., Furtner, P., and Wuttke, F. (2020). Dynamic lattice element modelling of cemented geomaterials. Adv. Comput. Methods Geomechanics 55, 655–665. doi:10.1007/978-981-15-0886-8_53
Tu, Y. L., Chai, H. J., Liu, X. R., Wang, J., Zeng, B., Fu, X., et al. (2021). An experimental investigation on the particle breakage and strength properties of soil-rock mixture. Arabian J. Geosciences 14, 840. doi:10.1007/s12517-021-07186-0
Wang, K., and Zhao, M. J. (2014). Characteristics and application of electrical resistivity of soil-stone composite medium. J. Chongqing Jiaot. Univ. Nat. Sci. 33 (2), 90–94. doi:10.3969/j.issn.1674-0696.2014.02.20
Wang, Y., Li, X., and Wu, Y. F. (2014). Damage evolution analysis of SRM under compression using X-ray tomography and numerical simulation. Eur. J. Environ. Civ. Eng. 19 (4), 400–417. doi:10.1080/19648189.2014.945044
Wang, Y., Li, X., Zheng, B., Zhang, B., and Wang, J. B. (2015). Real-time ultrasonic experiments and mechanical properties of soil and rock mixture during triaxial deformation. Geotech. Lett. 5 (4), 281–286. doi:10.1680/jgele.15.00131
Wang, Y., Li, C. H., and Hu, Y. Z. (2018). Use of X-ray computed tomography to investigate the effect of rock blocks on meso-structural changes in soil-rock mixture under triaxial deformation. Constr. Build. Mater. 164, 386–399. doi:10.1016/j.conbuildmat.2017.12.173
Wang, R. S., Zhao, M. J., and Wang, R. Q. (2019). Experimental research on variation of resistivity in soil-rock composite media. J. Build. Mater. 22 (1), 94–100. doi:10.3969/j.issn.1007-9629.2019.01.014
Wang, K., Xia, Z. T., and Li, X. (2021). Matrix suction evaluation of soil-rock mixture based on electrical resistivity. Water 13 (20), 2937. doi:10.3390/w13202937
Wang, T., Liu, S. H., Wautier, A., and Nicot, F. (2022). Constitutive model for soil-rock mixtures in the light of an updated skeleton void ratio concept. Acta Geotech. 18 (6), 2991–3003. doi:10.1007/s11440-022-01756-6
Xia, J. W., and Guo, H. Z. (1997). Distribution characteristics and main controlling factors of landslide in the upper reaches of the yangtze river. Hydrogeology Eng. Geol. 40 (1), 19–22. doi:10.16030/j.cnki.issn.1000-3665.1997.01.007
Xu, W. J., Xu, Q., and Hu, R. L. (2011). Study on the shear strength of soil-rock mixture by large scale direct shear test. Int. J. Rock Mech. Min. Sci. 48 (8), 1235–1247. doi:10.1016/j.ijrmms.2011.09.018
Xu, X. Q., Cai, B., Qu, X., Zeng, Z. F., and Zhao, X. (2022). Review of soil resistivity model. Prog. Geophys. 37 (5), 2205–2217. doi:10.6038/pg2022FF0531
Zeng, X. H., Liu, H. C., Zhu, H. S., Ling, C., Liang, K., Umar, H., et al. (2020). Study on damage of concrete under uniaxial compression based on electrical resistivity method. Constr. Build. Mater. 254, 119270. doi:10.1016/j.conbuildmat.2020.119270
Zhang, S., and Liu, X. L. (2023). Theoretical, experimental, and numerical studies of flow field characteristics and incipient scouring erosion for slope with rigid vegetations. J. Hydrology 622, 129638. doi:10.1016/j.jhydrol.2023.129638
Zhang, S., Tang, H. M., Zhan, H. B., Lei, G., and Cheng, H. (2015). Investigation of scale effect of numerical unconfined compression strengths of virtual colluvial-deluvial soil-rock mixture. Int. J. Rock Mech. Min. Sci. 77, 208–219. doi:10.1016/j.ijrmms.2015.04.012
Zhang, H. Y., Xu, W. J., and Yu, Y. Z. (2016). Triaxial tests of soil–rock mixtures with different rock block distributions. Soils Found. 56 (1), 44–56. doi:10.1016/j.sandf.2016.01.004
Zhang, F. Y., and Huang, X. W. (2018). Trend and spatiotemporal distribution of fatal landslides triggered by non-seismic effects in China. Landslides 15 (8), 1663–1674. doi:10.1007/s10346-018-1007-z
Zhang, Z. P., Sheng, Q., Fu, X. D., Zhou, Y., Huang, J., and Du, Y. (2020). An approach to predicting the shear strength of soil-rock mixture based on rock block proportion. Bull. Eng. Geol. Environ. 79 (5), 2423–2437. doi:10.1007/s10064-019-01658-0
Zhang, X., Zhao, M. J., and Wang, K. (2021). Experimental study on the streaming potential phenomenon response to compactness and salinity in soil-rock mixture. Water 13 (15), 2071. doi:10.3390/w13152071
Zhao, M. J., Li, G., Huang, W. D., and Li, J. (2010). Experiment on electrical resistivity properties of polyphase soil-stone mediums. J. Chongqing Jiaot. Univ. Nat. Sci. 29 (6), 928–933.
Zhao, M. J., Chen, S. L., Wang, K., and Liu, G. (2023). Analysis of electrical resistivity characteristics and damage evolution of soil–rock mixture under triaxial shear. Materials 16, 3698. doi:10.3390/ma16103698
Zhong, Z. L., Tu, Y. L., He, X. Y., Feng, J. H., and Wang, Z. L. (2016). Research progress on physical index and strength characteristics of bimsoils. Chin. J. Undergr. Space Eng. 12 (4), 1135–1144.
Keywords: soil-rock mixture, electrical resistivity, maxwell conduction model, series–parallel model, shear test
Citation: Chen S, Zhao M and Wang K (2025) Study on electrical resistivity model of soil-rock mixture. Front. Earth Sci. 13:1714474. doi: 10.3389/feart.2025.1714474
Received: 27 September 2025; Accepted: 04 November 2025;
Published: 02 December 2025.
Edited by:
Jialai Wang, University of Alabama, United StatesReviewed by:
Zarghaam Rizvi, GeoAnalysis Engineering GmbH, GermanyHaijun Wang, Chinese Academy of Sciences (CAS), China
Copyright © 2025 Chen, Zhao and Wang. This is an open-access article distributed under the terms of the Creative Commons Attribution License (CC BY). The use, distribution or reproduction in other forums is permitted, provided the original author(s) and the copyright owner(s) are credited and that the original publication in this journal is cited, in accordance with accepted academic practice. No use, distribution or reproduction is permitted which does not comply with these terms.
*Correspondence: Kui Wang, YW5odWl3a0AxNjMuY29t