 Ping Tan
 Yonghong Duan3*
- 1Institute of Disaster Prevention, Sanhe, Hebei, China
- 2Hebei Key Laboratory of Earthquake Dynamics, Sanhe, Hebei, China
- 3Geophysical Exploration Center, China Earthquake Administration, Zhengzhou, China
- 4Chinese Academy of Geological Sciences, Beijing, China
The Cathaysia Block, a pivotal tectonic unit in South China, possesses a complex crustal architecture shaped by multi-phase tectonic evolution. This study integrates harmonic analysis of crustal anisotropy with an advanced H-κ-c stacking method applied to teleseismic receiver functions from 185 stations, to investigate crustal thickness (H), Vp/Vs ratio (κ), and anisotropic characteristics. The results reveal significant spatial heterogeneity: crustal thickness ranges from 24.5 to 36.6 km, while Vp/Vs ratios (1.65–1.84) indicate a compositional transition from felsic-dominated inland regions to mafic-enriched coastal zones. Crustal anisotropy, quantified by fast polarization directions (FPDs) and delay times (0.06–0.46 s), exhibits systematic spatial variations. In eastern Cathaysia, FPDs systematically rotate from NW-SE in the north to NNW-SSE in the south, aligning with the subduction trajectory of the Paleo-Pacific Plate. This pattern, along with crustal thinning, reflects extension induced by slab rollback, associated with mantle upwelling and underplating. Conversely, in western Cathaysia, E-W trending FPDs primarily reflect NW-SE compressive stresses imparted by Paleo-Pacific Plate subduction. Post-rollback thermal relaxation and widespread granitic emplacement subsequently enhanced crustal strength, promoting brittle fracture over ductile flow during regional extension. Collectively, this study elucidates the interplay between Paleo-Pacific Plate dynamics, crustal deformation mechanisms (brittle vs. ductile), and compositional evolution in shaping the tectonic architecture of the Cathaysia Block.
1 Introduction
The Cathaysia Block, constituting a pivotal tectonic unit in eastern China, occupies the southeastern segment of the composite South China Block (amalgamated from the Yangtze and Cathaysia blocks). Neoproterozoic amalgamation during the Jiangnan Orogeny drove subduction and subsequent collision of the Cathaysia Block beneath the Yangtze Block along the Jiangshan-Shaoxing Fault (JSF), culminating in the consolidation of the unified South China Block. Subsequent multi-phase tectono-magmatic reactivation affected the Cathaysia Block (Shu et al., 2011). Mesozoic tectonic activity, dominantly controlled by Paleo-Pacific Plate subduction beneath Cathaysia, generated alternating compressional and extensional regimes accompanied by extensive magmatism and mineralization (Chu et al., 2019; Li et al., 2023a; Ma et al., 2023; Mao et al., 2021). Since the Late Mesozoic, the tectonic framework of South China has been largely established, with weakened activity and the cessation of surface magmatism (Li et al., 2023a; Li and Li, 2007; Liu et al., 2012). The dynamic setting of this period has been primarily controlled by the combined effects of the subduction of the Pacific Plate and the far-field impact of the India-Eurasia collision. GPS measurements further reveal consistent surface deformation within the Cathaysia Block, indicating the absence of significant internal strain (Wang and Shen, 2020; Zheng et al., 2017).
The spatiotemporal correlation between Mesozoic magmatism and Paleo-Pacific plate subduction has motivated numerous studies utilizing magmatic records to constrain subduction dynamics (Chu et al., 2019; Li et al., 2023a; Li and Li, 2007; Zhou and Li, 2000). Key proposed mechanisms include: (1) a transition from shallow to steep slab subduction to explain seaward-younging volcanic sequences (Zhou and Li, 2000); (2) Permian-initiated flat-slab subduction accounting for broad (1300 km wide) intracontinental orogenesis and magmatism (Li and Li, 2007); and (3) lithospheric extension coupled with coeval asthenospheric upwelling (Guo et al., 2012; Liu and Niu, 2012; Wang et al., 2003). Crucially, discriminating between these models requires high-resolution quantification of crustal deformation. Crustal anisotropy serves as a direct proxy for finite strain, providing key constraints on deformation mechanisms.
Although crustal anisotropy is well-documented globally (Savage, 1999; Silver, 1996) and measurable via receiver function analysis of Pms converted phase sinusoidal variations (Kong et al., 2016), extant studies in the Cathaysia Block yield conflicting fast polarization directions (FPDs). The results from Gao et al. (2009) revealed that the crustal anisotropy in the southeastern Cathaysia Block is predominantly oriented NE–SW. In contrast, Xu et al. (2023), utilizing a more extensive dataset from seismic stations, reported that the fast-wave polarization directions in the Cathaysia Block are mainly oriented NW–SE. However, Li et al. (2023b), employing a similar seismic station network to that of Xu et al. (2023), found that the crustal anisotropy in the western Cathaysia Block is oriented NE–SW, while in the central Cathaysia Block, the fast polarization directions exhibit a radial pattern. These discrepancies likely stem from unmodelled dipping Moho effects during Pms-phase analysis. Significant Moho topography across the block (Deng et al., 2014) implies that neglecting interface inclination compromises Pms fitting accuracy and induces data loss. Furthermore, sparse seismic network geometries have precluded continuous spatial tracking of anisotropy, hindering robust deformation pattern analysis.
To address these limitations, this study uses integrated 2D broadband seismic networks and dense arrays across the Cathaysia Block. This approach enables simultaneous resolution of crustal anisotropy parameters and Moho geometry, yielding high-resolution spatial anisotropy distributions. Combined with crustal thickness and Vp/Vs ratio measurements from H-κ-c stacking method, these results provide unprecedented quantitative constraints on crustal deformation processes and the tectonic evolution of the Cathaysia Block.
2 Data and methods
2.1 Data
We analyzed continuous broadband seismic data from 148 permanent stations deployed in the Cathaysia Block (Figure 1), covering the operational period from January 2011 to December 2012. Complementary data were obtained from a temporary broadband seismic array comprising 37 stations deployed across the Cathaysia block between 2012 and 2014, with average inter-station spacing of 10–20 km. This integrated network of 185 stations provided continuous waveform records for teleseismic event selection. We extracted events meeting the following criteria: surface-wave magnitude (MS) ≥ 5.0 and epicentral distances between 30° and 90°. As illustrated in Figure 1, the spatial distribution of the selected events demonstrates comprehensive azimuthal coverage.
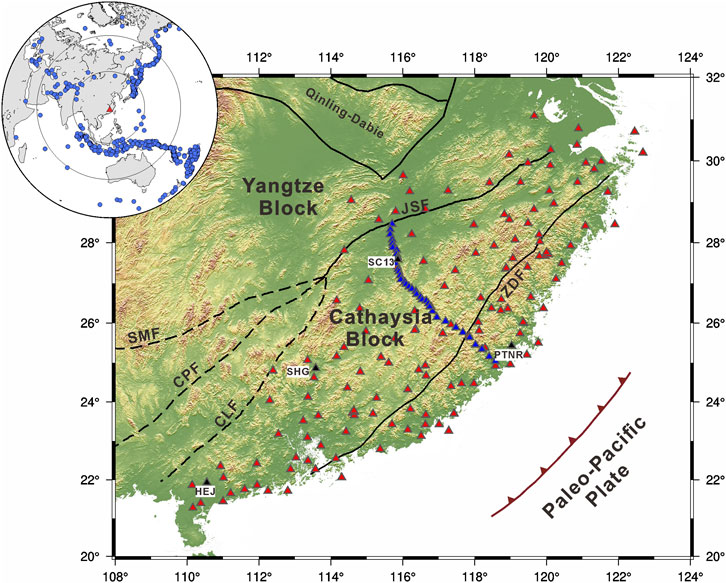
Figure 1. Tectonic map (Zhao and Cawood, 2012) and seismic stations distribution in the study area. Red triangles denote permanent seismic stations, while temporary stations are indicated by blue triangles; black triangles specifically highlight stations that are featured in Figure 2. Major faults are shown as black lines: JSF (Jiangshan-Shaoxing Fault), ZDF (Zhenghe-Dapu Fault), CPF (Chaling-Pingxiang Fault), CLF (Chenzhou-Linwu Fault), and SMF (Shizong-Mile Fault). Dashed lines delineate potential boundaries between the Yangtze and Cathaysia block within the southwestern South China block. The upper-left inset displays epicentral distributions of analyzed teleseismic events and red triangle indicates the study area.
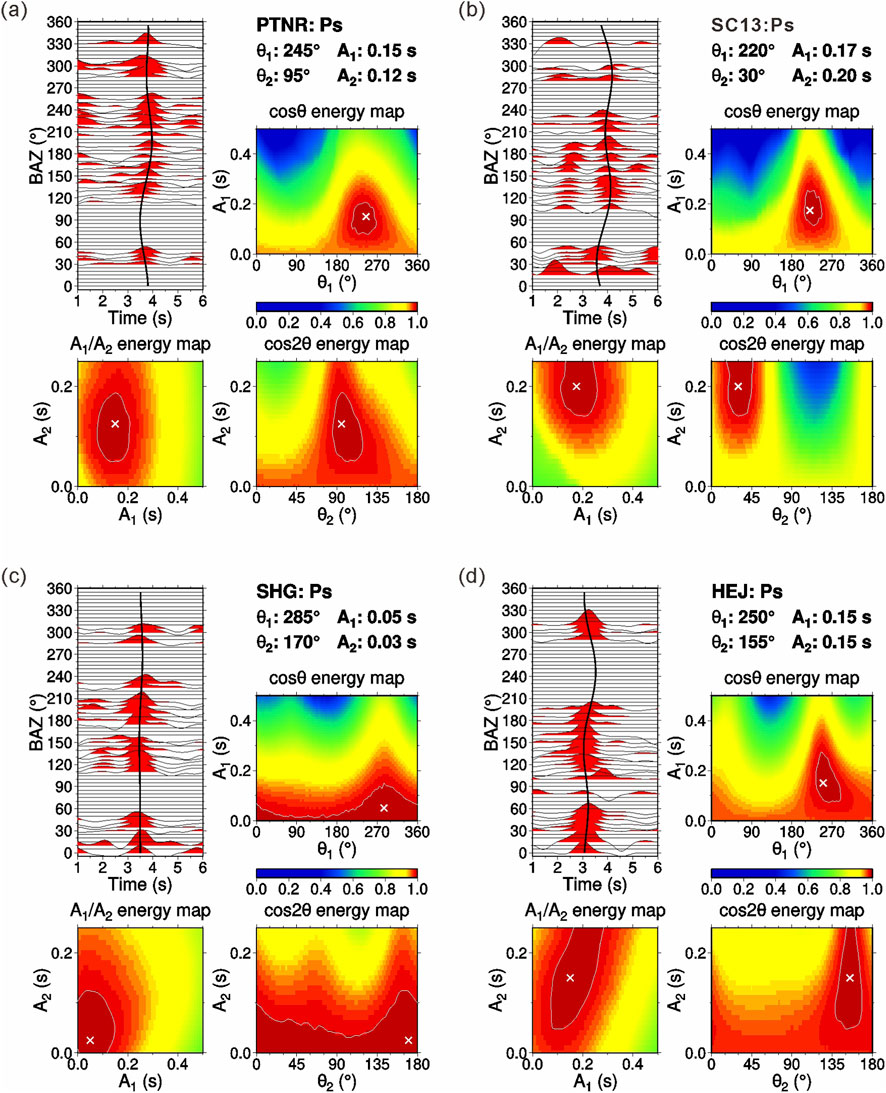
Figure 2. Harmonic fitting analysis of Pms phases recorded at four seismic stations: (a) PTNR, (b) SC13, (c) SHG, and (d) HEJ. In the receiver function profiles, black curves demarcate theoretical arrival times of Pms phases, while white crosses in the energy maps indicate optimal solution positions derived from harmonic analysis.
P- wave receiver functions were computed using the time-domain iterative deconvolution algorithm proposed by Ligorría and Ammon (1999), employing a Gaussian coefficient of 2.5. The derived receiver functions underwent rigorous manual selection based on signal-to-noise ratio (SNR) criteria and waveform stability, with particular emphasis on retaining those exhibiting clear Moho Pms converted phases. This quality control procedure resulted in 26,244 validated receiver functions from 185 seismic stations.
2.2 Harmonic fitting method
Crustal anisotropy was characterized through harmonic analysis of the backazimuthal variations in the Pms phase. Adopting the method of Li et al. (2019), the incident moveout corrections and backazimuth (BAZ) binning were applied prior to harmonic fitting to enhance measurement reliability. To minimize arrival time variations caused by differential ray parameters, Pms moveout corrections were computed using the global IASP91 reference model (Kennett and Engdahl, 1991) and standardized to a reference ray parameter of 0.06 s/km (Yuan et al., 1997). Subsequently, the corrected waveforms were stacked within 5° backazimuth intervals to ensure uniform azimuthal coverage and optimize the SNR.
Theoretical formulations (Liu and Niu, 2012; Savage, 1998) and synthetic modeling (Tan and Nie, 2021) demonstrate distinct azimuthal dependencies: isotropic crust with horizontal Moho exhibits BAZ-independent Pms arrivals, anisotropic media with horizontal symmetry axis display 180° periodicity, while dipping Moho interfaces produce 360° periodic variations. Our analysis employs a composite harmonic function (Equation 1) to resolve these effects:
where θ represents BAZ,
2.3 H-
Crustal thickness (H) and Vp/Vs ratio (κ) constitute critical parameters for elucidating crustal evolution and composition (Ji et al., 2009; Zandt and Ammon, 1995). While the H-κ stacking method represents the standard method for their simultaneous determination (Zhu and Kanamori, 2000), it assumes an isotropic crust with a flat Moho interface. This assumption may yield biased estimates in regions exhibiting complex crustal structures, as both crustal anisotropy and a dipping Moho can significantly perturb the arrival times of converted and multiple seismic phases (Li et al., 2019; Lombardi et al., 2008; Wang et al., 2010; Zha et al., 2013).
To mitigate the limitations of conventional H-κ stacking, we employ the improved H-κ-c method (Li et al., 2019), which incorporates pre-stacking corrections for crustal anisotropy and Moho inclination in receiver function analysis. Our implementation proceeds through three sequential stages: First, conventional H-κ stacking is applied to derive preliminary reference arrival times for the Pms phase and crustal multiples at each station. Subsequently, harmonic analysis is performed on the azimuthal variations of both phase arrivals following the procedure in Section 2.2. The sinusoidal functions containing
3 Results
3.1 Crustal anisotropy measurements
Owing to insufficient azimuthal coverage of receiver functions at certain stations, reliable harmonic fitting of Pms phases was unattainable. Ultimately, crustal anisotropy parameters were successfully determined for 131 stations. Examples from four stations across distinct tectonic domains of the Cathaysia Block are illustrated in Figure 2. The derived parameters
Figure 2 demonstrates strong consistency between theoretical and observed Pms arrival times. Station PTNR, situated in the eastern coastal region, exhibits an FPD of 95° (
Figure 3 graphically summarizes the spatial distribution of crustal anisotropy measurements across the study area, while Supplementary Table S1 provides detailed anisotropy parameters of FPD (
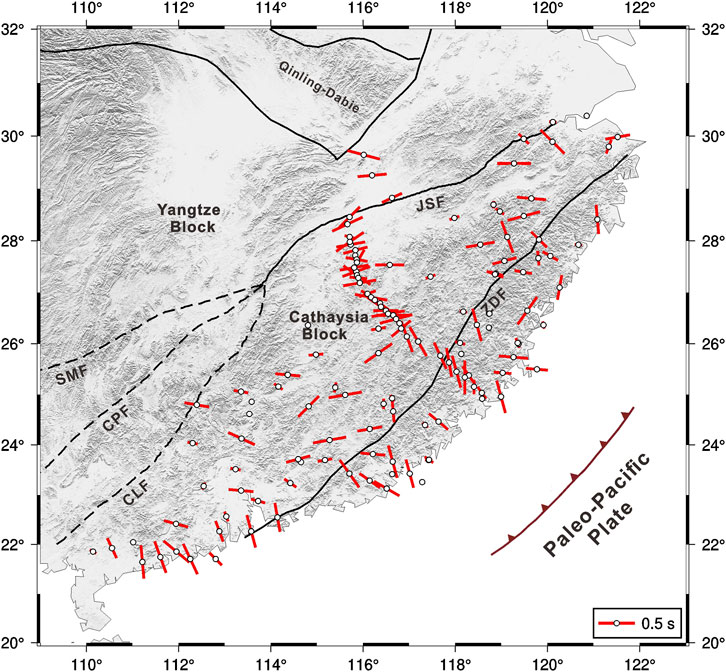
Figure 3. Crustal anisotropy characteristics across the study area. Red bar orientations correspond to FPDs, with their lengths scaled to delay-time magnitudes.
The delay time in the Cathaysia Block varies from less than 0.1 s–0.46 s. With an average delay time of 0.28 s. Our crustal anisotropy results are consistent with those of previous studies at the majority of stations (Supplementary Figure S1) (Li et al., 2023b). However, significant discrepancies are observed at some stations. We have conducted a thorough analysis of the reasons behind these discrepancies. Li et al. (2023b) presented four stations as examples; due to their broader station coverage, only one of these stations (JX.ANY) coincides with those used in our study. To facilitate a clearer comparison with previous results, we have plotted the receiver functions together (Supplementary Figure S2). It can be observed that although the characteristics of the receiver functions are generally consistent, our receiver functions exhibit better azimuthal coverage compared to those of Li et al. (2023). More importantly, the fitting of the Pms phase in our receiver functions is superior. For instance, in the back-azimuth range of 180–280
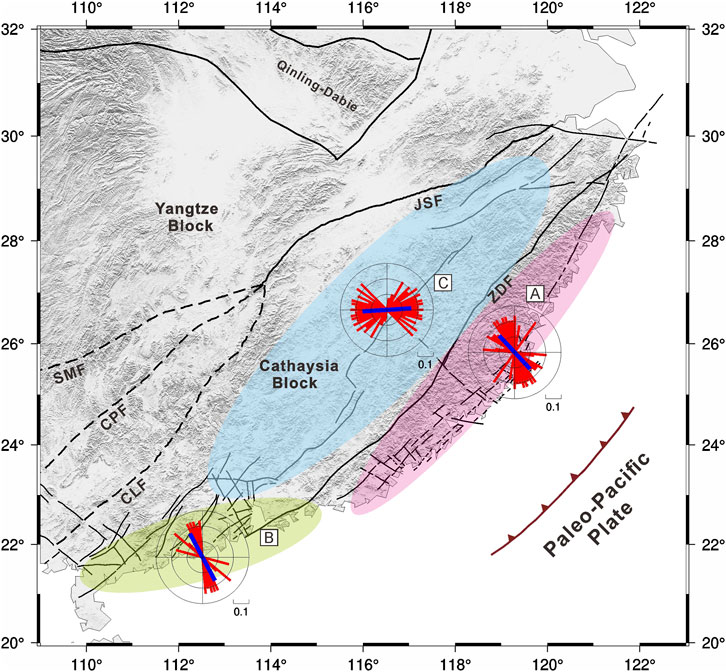
Figure 4. Rose maps of crustal anisotropy in different regions of the study area. The varying shades delineate the Cathaysia block’s three regions: A (northern coastal), B (southern coastal), and C (inland). Each rose map displays per-station anisotropic parameters (red bars) and regional averages (blue bars). The time difference from the center of the annular ring to the outermost periphery is 0.3 s, and the interval between each ring is 0.1 s.
In the Cathaysia Block, the northern coastal, southern coastal, and inland regions have average delay times of 0.27 s, 0.32 s, and 0.29 s, respectively. While the average delay times across these three regions are modestly similar, the FPDs reveal striking differences. More specifically, the FPDs of crustal anisotropy display marked spatial heterogeneity along the coastal region from north to south. In the northern region, the FPDs are predominantly NW-SE, gradually transitioning to NNW-SSE towards the south. This anisotropic alignment exhibits strong coherence with the subduction trajectory of the paleo-Pacific plate. In contrast, the inland region is characterized by predominantly near E-W FPDs, yet with notable regional variations. In the southern part of this region, the FPDs are mainly near E-W and NWW-SEE, while in the northern part, they shift to NEE-SWW. Furthermore, the principal anisotropic directions in this zone are nearly orthogonal to the subduction direction of the paleo-Pacific plate.
3.2 Crustal thicknesses and Vp/Vs ratios
Figures 5, 6 illustrate the application of H-κ and H-κ-c stacking methodologies at stations PTNR and HEJ, respectively. Both panels incorporate harmonic fitting results for multi-phase arrivals of PpPs (labeled M1) and PpSs + PsPs (labeled M2). Detailed fitting outcomes for the Pms phase are presented in Figure 2. The comparison of derived crustal thicknesses (H), Vp/Vs ratios (κ), their associated uncertainties, and stacking images reveals that the H-κ-c stacking method demonstrates superior accuracy compared to conventional H-κ approaches.
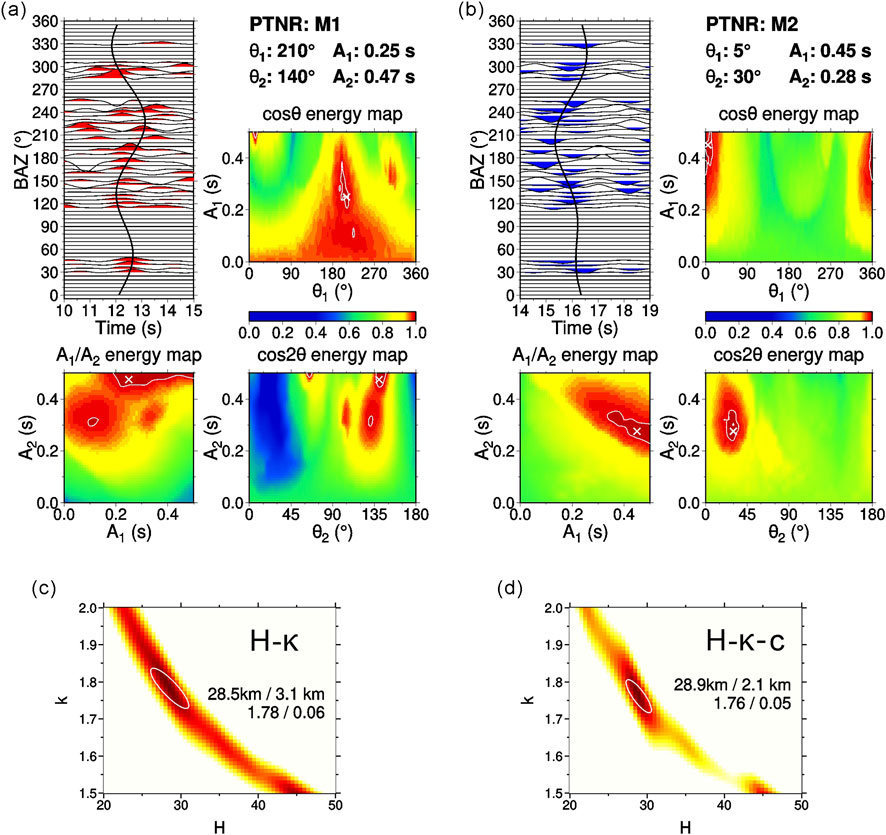
Figure 5. (a–b) Harmonic fitting of multiple-phase arrivals of PpPs (M1) and PpSs + PsPs (M2) at station PTNR, with corresponding (c–d) crustal thickness (H) and Vp/Vs ratios (κ) determinations derived from H-κ and H-κ-c stacking method.
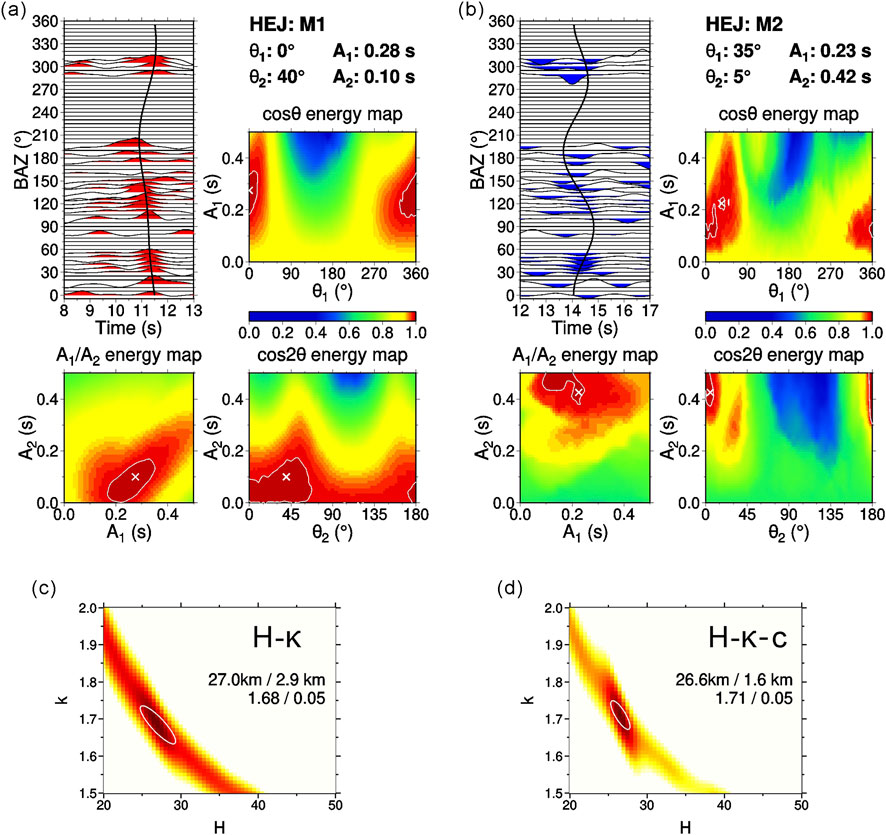
Figure 6. (a,b) Harmonic fitting of multiple-phase arrivals of PpPs (M1) and PpSs + PsPs (M2) at station HEJ, with corresponding (c,d) crustal thickness (H) and Vp/Vs ratios (κ) determinations derived from H-κ and H-κ-c stacking method."
Figure 7 and Supplementary Table S1 delineate the crustal thickness (H) and Vp/Vs ratio (κ) of the study area as determined via the H-κ-c stacking method. Our findings unveil marked spatial heterogeneity in both crustal thickness and Vp/Vs ratio across the Cathaysia Block.
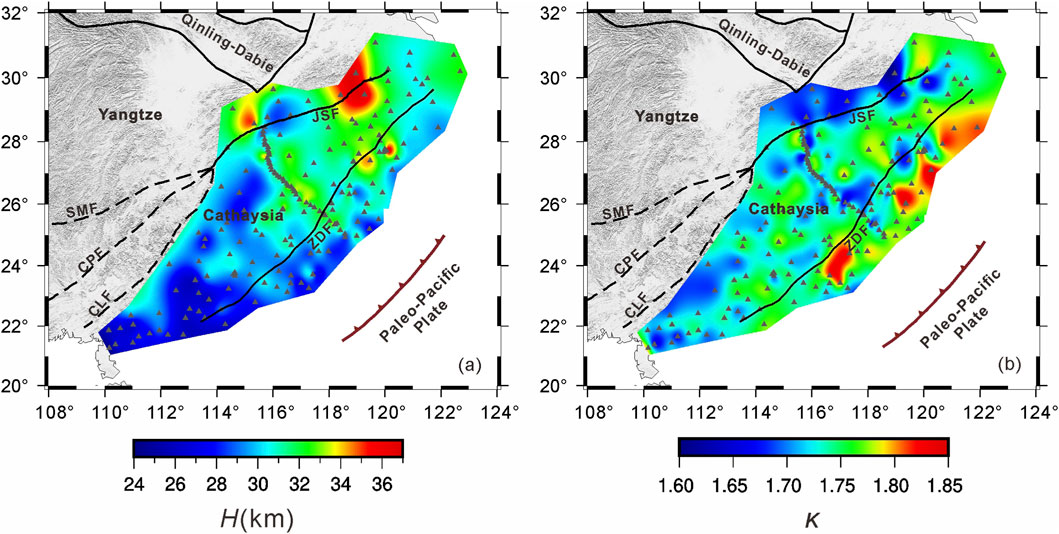
Figure 7. The distribution of crustal thickness (a) and Vp/Vs ratios (b) in the study area.
The crustal thickness in the Cathaysia Block varies between 24.5 and 36.6 km, which is significantly less than the global average. A northeastward thickening trend of the crust is evident, aligning with previous studies (Deng et al., 2019), while the southwestern region is characterized by considerable thinning, with values below 30 km.
The crustal Vp/Vs ratios in the Cathaysia Block range from 1.65 to 1.84. Higher ratios are observed southeast of the Zhenghe-Dapu Fault (ZDF), whereas lower ratios are present to the northwest. This range is comparable to the conventional H-κ stacking results (Xia et al., 2015). In the eastern coastal region, the crustal Vp/Vs ratio is relatively high (1.75–1.84), which may result from thick sedimentary layers, partial melting, high crustal temperature, or specific crustal composition. However, several lines of evidence argue against these mechanisms: (1) the sedimentary layers in this area are relatively thin (Li et al., 2006), making their contribution to the average crustal Vp/Vs ratio negligible; (2) although partial melting strongly elevates Vp/Vs ratios, its occurrence usually requires crustal S-wave velocities below ∼3.4 km/s (Nie et al., 2023; Yang et al., 2012), and the high crustal velocities observed in previous studies (Bao et al., 2015; Han et al., 2021; Li et al., 2022) preclude large-scale melting; (3) the estimated crustal temperature in this region (approximately 400 °C) (Sun et al., 2013) is not anomalously high and thus insufficient to solely account for the observed Vp/Vs anomaly. Therefore, the high Vp/Vs ratio reflects a crustal composition in which the mafic mineral content is equivalent to or surpasses the felsic components. In contrast, the northwestern regions exhibit Vp/Vs ratios of 1.65–1.81, with most areas having values below 1.76, suggesting a crust dominated by felsic compositions. Additionally, the stations in the Yangtze Block present a distinct pattern of thicker crust combined with lower Vp/Vs ratios.
4 Discussion
4.1 Crustal anisotropy aligned with Paleo-Pacific plate subduction suggests strong coastal extension
Our results reveal significant spatial heterogeneity in crustal anisotropy across the Cathaysia Block. The FPDs exhibit a systematic north-to-south transition in orientation within the coastal region: predominantly NW-SE in the north (region A), gradually shifting to NNW-SE towards the south (region B). While Li et al. (2023b) reported fast polarization directions sub-parallel to the continental margin along the coast—nearly orthogonal to our results—we argue this difference may stem from the effect of coastal Moho topography on anisotropy measurements. Our results, especially the profile within the coastal area, robustly demonstrate a fast polarization direction perpendicular to the continental margin. Notably, these anisotropic orientations closely parallel the subduction trajectory of the Paleo-Pacific Plate, conflicting with classical models predicting compressional deformation induced by slab subduction (Li et al., 2023a; Long and Becker, 2010).
Previous studies propose a two-stage tectonic evolution for the Paleo-Pacific slab: an initial phase of flat-slab subduction followed by slab rollback (Chu et al., 2019; Li et al., 2014). Numerical simulations demonstrate that slab rollback typically induces extensional deformation within the overriding block, oriented parallel to the plate motion direction (Long, 2016; Long and Silver, 2009). This mechanism is consistent with the observed FPD orientations. Structural evidence from the Cathaysia Block further supports this interpretation, including NE-trending basins bounded by high-angle normal faults and NW-dipping, low-angle detachment faults (shear zones), which collectively record NW-SE extensional deformation (Dong et al., 2020; Li et al., 2020). The synchronicity between this extensional direction and the southeastward migration of magmatic activity suggests extension occurred in a back-arc setting dynamically linked to rollback of the subducting Paleo-Pacific slab (Li et al., 2014).
Furthermore, the widespread exposure of intermediate-mafic volcanic rocks (Li et al., 2023a) and deep seismic reflection observations of mafic sills in the middle-lower crust indicate mantle-derived magma underplating/intrusion beneath the coastal region (Dong et al., 2020; Li et al., 2023a). This magmatism aligns with our observation of high Vp/Vs ratios in the same area, which is also consistent with NE-trending high gravity and magnetic anomalies (Guo and Gao, 2018). Therefore, we interpret the FPDs parallel to the Paleo-Pacific plate subduction direction as indicative of intense crustal extension within the coastal Cathaysia Block. As the Paleo-Pacific Plate rolled back, the subduction angle became steeper, and the coastal crust experienced strong NW-SE extension. This extension facilitated the ascent of mantle-derived magmas through lithospheric fractures, leading to the eruption of intermediate-mafic volcanic rocks observed at the surface (Chu et al., 2019; Li et al., 2023a) and potentially contributing to the development of porphyry copper deposits in the region (Mao et al., 2021). An interesting discovery is that the lower Vp/Vs ratios in region B compared to region A are likely attributable to a significant reduction in the volume of mantle-derived magmatic intrusions, which leads to a lower average crustal Vp/Vs ratio. This interpretation is further supported by the substantial decrease of Cretaceous volcanic rocks observed from region A to region B (Li et al., 2023a).
4.2 Anomalous rheology in the interior of Cathaysia preserves flat-slab deformation during rollback
Li et al. (2023b) observed a radial pattern of fast crustal anisotropy directions within the interior of the Cathaysia Block, which they attributed to asthenospheric upwelling associated with the retreat of the Paleo-Pacific Plate. However, our results, constrained by a better fit to the receiver function Pms phase, reveal that the FPDs of crustal anisotropy exhibit a predominant near E-W trend in the interior of the Cathaysia Block (bounded by the ZDF and JSF). This orientation is nearly orthogonal to the subduction direction of the Paleo-Pacific Plate, indicating lateral deformation driven by NW-SE compressive stresses generated during slab subduction. Despite significant slab rollback occurring after the flat subduction (Chu et al., 2019; Li et al., 2023a; Li and Li, 2007; Zhou and Li, 2000), the FPDs within this inland region show no alignment with the rollback direction. Instead, the region retains compressional deformation features characteristic of the earlier flat-slab subduction phase.
The underlying mechanism for this anomaly likely involves a coupled effect: slab rollback-induced thermomechanical changes reduced crustal temperatures, while widespread granitic plutons within the region significantly enhanced crustal rigidity. Consequently, despite the shift in regional tectonic setting to an extensional regime, the crust in the interior of the Cathaysia Block did not undergo ductile flow. Instead, it accommodated changes in the tectonic stress field through brittle fracturing. This spatiotemporal disparity in the brittle-ductile transition mechanism offers a novel perspective for elucidating crustal response patterns during slab rollback.
The ambient noise tomography results reveal that the crustal velocity in the coastal area east of the ZDF is significantly higher than that in the region west of the fault (Li et al., 2022). Deep seismic reflection profiling also observed notable variations in crustal structure across the ZDF, with the eastern part dominated by more mafic lithologies (Dong et al., 2020), a feature consistent with the main findings of this study. We propose that the marked and non-gradual structural contrast across the ZDF may be attributed to the fault representing the western boundary of the volcanic arc associated with the Paleo-Pacific Plate subduction.
We also compared our results with SKS splitting measurements. The observed SKS splitting in the Cathaysia Block is primarily attributed to asthenospheric flow, given its relatively thin lithospheric thickness and the approximately E-W fast polarization direction that aligns subparallel to the absolute plate motion (Yang et al., 2019). However, within the interior of the Cathaysia Block, the fast polarization direction of crustal anisotropy exhibits distinct and abrupt changes, which is inconsistent with the anisotropy pattern obtained from SKS measurements. Therefore, we do not interpret the observed crustal anisotropy as resulting from crustal deformation induced by asthenospheric flow.
4.3 Revisiting the transformation of the Cathaysia Block driven by Paleo-Pacific Plate subduction
Previous studies, based on the spatiotemporal distribution of surface volcanic rocks, suggested the flat subduction of the paleo-Pacific Plate followed by its rollback (Li et al., 2023a; Li and Li, 2007; Zhou and Li, 2000). They also linked these tectonic events to the formation of the extensional structures in the South China Block, with the change in the geometry of the subducting slab being supported by deep seismic reflection results (Li et al., 2023a). By incorporating the results of crustal anisotropy, thickness, and Vp/Vs ratio of the Cathaysia Block, our understanding of the impact of the paleo-Pacific Plate subduction on the overlying Cathaysian Block has been further enhanced. Initially, from the Early Jurassic to the Late Cretaceous, the strong compression resulting from the flat subduction of the paleo-Pacific Plate caused the overlying Cathaysia Block to thicken and undergo plastic deformation perpendicular to the subduction direction, leading to anisotropy that is perpendicular to the subduction direction within the Cathaysia Block.
In the late Cretaceous, the paleo-Pacific Plate began to roll back. The asthenospheric flow caused by the slab rollback induced significant extension in the overlying Cathaysia Block (Lin and Li, 2021; Ma et al., 2023). This extension was most pronounced in the coastal regions and gradually weakened inland, which is consistent with our crustal thickness results showing a marked thinning of the Cathaysia Block’s crust towards the coastal areas. Due to the high temperatures in the coastal regions, where the two plates interact, the crust is more prone to mineral alignment under extensional conditions. As a result, the strong crustal extension in the coastal areas has led to significant plastic deformation of the crust in the direction consistent with the subduction direction. At the same time, the intense extension also allowed the arc magmatism generated by the subducted slab to directly intrude into the crust, resulting in the high Vp/Vs ratio observed in the coastal regions.
In contrast, the interior of the Cathaysia Block, experiencing weaker extension, did not undergo significant plastic deformation of the crust. Instead, it preserved the lateral extensional deformation from the flat subduction period, as indicated by the observed near E-W anisotropy direction. This may be due to the reduced mantle heat flow following the slab rollback, causing the molten middle and lower crust to cool and form granitic rocks. This is supported by the middle crust velocity results of the Cathysia Block (Deng et al., 2019). Our crustal Vp/Vs ratio results also show a relatively low Vp/Vs ratio in the interior of the Cathaysia Block, indicating a crust dominated by felsic rocks. The relatively hard granitic rocks (Li et al., 2023a), under weaker extension and cooler crustal temperatures (Jiang et al., 2019), are less likely to undergo significant ductile deformation and are therefore more prone to the formation of large-scale normal faults.
5 Conclusion
The crustal structure of the Cathaysia Block exhibits significant spatial heterogeneity. Crustal thickness, ranging from 24.5 to 36.6 km, displays a southwestward thinning trend. In contrast, the Vp/Vs ratio (1.65–1.84) increases towards the coastal regions, potentially reflecting a transition in crustal composition from more mafic inland to more mafic coastal areas. In eastern Cathaysia, the crustal anisotropy-characterized by a transition in FPDs from NW-SE in the north to NNW-SSE in the south-aligns with the direction of the Paleo-Pacific Plate subduction and rollback. It is proposed that this anisotropy likely relates to intense extension induced by slab rollback along the subduction direction. The highest Vp/Vs ratios (indicative of magmatic intrusion) and the thinnest crust observed in the coastal region further support the occurrence of significant extension.
In contrast, western Cathaysia exhibits dominantly E-W oriented FPDs, nearly perpendicular to the Paleo-Pacific Plate subduction direction. This pattern may reflect crustal lateral deformation generated during the earlier phase of flat-slab subduction. Although the Paleo-Pacific Plate subsequently underwent rollback, the associated thermal relaxation and granite emplacement in western Cathaysia support the observed lower Vp/Vs ratios. These processes strengthened the crust, favoring brittle fracturing over ductile flow. Consequently, western Cathaysia has preserved the crustal deformation features characteristic of the earlier flat-slab subduction period.
Data availability statement
The data analyzed in this study is subject to the following licenses/restrictions: The raw data supporting the conclusions of this article will be made available by the authors, without undue reservation. Requests to access these datasets should be directed to dGFucGluZ0BjaWRwLmVkdS5jbg==.
Author contributions
PT: Conceptualization, Formal Analysis, Funding acquisition, Investigation, Methodology, Software, Writing – original draft. YD: Conceptualization, Data curation, Project administration, Resources, Supervision, Writing – review and editing. YW: Conceptualization, Methodology, Supervision, Validation, Writing – review and editing. YT: Conceptualization, Methodology, Supervision, Validation, Writing – review and editing. YZ: Conceptualization, Methodology, Supervision, Validation, Writing – review and editing.
Funding
The authors declare that financial support was received for the research and/or publication of this article. This study is funded by Science Research Project of Hebei Education Department (BJ2025123), National Natural Science Foundation of China (Grant No. 41904055, 42204057), and Hebei Natural Science Foundation (Grant No. D2020512005).
Acknowledgements
We thank Jiangtao Li for providing the H-
Conflict of interest
The authors declare that the research was conducted in the absence of any commercial or financial relationships that could be construed as a potential conflict of interest.
The reviewer ZY declared a shared affiliation with the author YW to the handling editor at time of review.
Generative AI statement
The authors declare that no Generative AI was used in the creation of this manuscript.
Any alternative text (alt text) provided alongside figures in this article has been generated by Frontiers with the support of artificial intelligence and reasonable efforts have been made to ensure accuracy, including review by the authors wherever possible. If you identify any issues, please contact us.
Publisher’s note
All claims expressed in this article are solely those of the authors and do not necessarily represent those of their affiliated organizations, or those of the publisher, the editors and the reviewers. Any product that may be evaluated in this article, or claim that may be made by its manufacturer, is not guaranteed or endorsed by the publisher.
Supplementary material
The Supplementary Material for this article can be found online at: https://www.frontiersin.org/articles/10.3389/feart.2025.1716086/full#supplementary-material
References
Bao, X., Song, X., and Li, J. (2015). High-resolution lithospheric structure beneath mainland China from ambient noise and earthquake surface-wave tomography. Earth Planet. Sci. Lett. 417, 132–141. doi:10.1016/j.epsl.2015.02.024
Chu, Y., Lin, W., Faure, M., Xue, Z., Ji, W., and Feng, Z. (2019). Cretaceous episodic extension in the south China block, east Asia: evidence from the yuechengling massif of central south China. Tectonics 38, 3675–3702. doi:10.1029/2019tc005516
Deng, Y., Zhang, Z., Badal, J., and Fan, W. (2014). 3-D density structure under South China constrained by seismic velocity and gravity data. Tectonophysics 627, 159–170. doi:10.1016/j.tecto.2013.07.032
Deng, Y., Li, J., Peng, T., Ma, Q., Song, X., Sun, X., et al. (2019). Lithospheric structure in the Cathaysia block (South China) and its implication for the late Mesozoic magmatism. Phys. Earth Planet. Interiors 291, 24–34. doi:10.1016/j.pepi.2019.04.003
Dong, S., Li, J., Cawood, P. A., Gao, R., Zhang, Y., and Xin, Y. (2020). Mantle influx compensates crustal thinning beneath the Cathaysia block, South China: evidence from SINOPROBE reflection profiling. Earth Planet. Sci. Lett. 544, 116360. doi:10.1016/j.epsl.2020.116360
Frederiksen, A. W., and Bostock, M. G. (2000). Modelling teleseismic waves in dipping anisotropic structures. Geophys. J. Int. 141, 401–412. doi:10.1046/j.1365-246x.2000.00090.x
Gao, Y., Wu, J., Cai, J. A., Shi, Y. T., Lin, S., Bao, T., et al. (2009). Shear-wave splitting in the southeast of Cathaysia block, South China. J. Seismol. 13, 267–275. doi:10.1007/s10950-008-9126-y
Guo, L., and Gao, R. (2018). Potential-field evidence for the tectonic boundaries of the central and western Jiangnan belt in South China. Precambrian Res. 309, 45–55. doi:10.1016/j.precamres.2017.01.028
Guo, F., Fan, W., Li, C., Zhao, L., Li, H., and Yang, J. (2012). Multi-stage crust–mantle interaction in SE China: temporal, thermal and compositional constraints from the Mesozoic felsic volcanic rocks in eastern Guangdong–Fujian provinces. Lithos 150, 62–84. doi:10.1016/j.lithos.2011.12.009
Han, S., Zhang, H., Xin, H., Shen, W., and Yao, H. (2021). USTClitho2.0: updated unified seismic tomography models for Continental China lithosphere from joint inversion of body-wave arrival times and surface-wave dispersion data. Seismol. Res. Lett. 93, 201–215. doi:10.1785/0220210122
Ji, S., Wang, Q., and Yang, W. (2009). Correlation between crustal thickness and poisson's ratio in the north China craton and its implication for lithospheric thinning. Acta Geol. Sin. 83, 324–330.
Jiang, G., Hu, S., Shi, Y., Zhang, C., Wang, Z., and Hu, D. (2019). Terrestrial heat flow of continental China: updated dataset and tectonic implications. Tectonophysics 753, 36–48. doi:10.1016/j.tecto.2019.01.006
Kennett, B. L. N., and Engdahl, E. R. (1991). Traveltimes for global earthquake location and phase identification. Geophys. J. R. Astronomical Soc. 105, 429–465. doi:10.1111/j.1365-246x.1991.tb06724.x
Kong, F., Wu, J., Liu, K. H., and Gao, S. S. (2016). Crustal anisotropy and ductile flow beneath the eastern Tibetan Plateau and adjacent areas. Earth Planet. Sci. Lett. 442, 72–79. doi:10.1016/j.epsl.2016.03.003
Li, Z., and Li, X. (2007). Formation of the 1300-km-wide intracontinental orogen and postorogenic magmatic province in Mesozoic South China: a flat-slab subduction model. Geology 35, 179. doi:10.1130/g23193a.1
Li, S., Mooney, W. D., and Fan, J. (2006). Crustal structure of mainland China from deep seismic sounding data. Tectonophysics 420, 239–252. doi:10.1016/j.tecto.2006.01.026
Li, J., Ma, Z., Zhang, Y., Dong, S., Li, Y., Lu, M. a., et al. (2014). Tectonic evolution of Cretaceous extensional basins in Zhejiang Province, eastern South China: structural and geochronological constraints. Int. Geol. Rev. 56, 1602–1629. doi:10.1080/00206814.2014.951978
Li, J., Song, X., Wang, P., and Zhu, L. (2019). A generalized H-κ method with harmonic corrections on Ps and its crustal multiples in receiver functions. J. Geophys. Res. 124, 3782–3801. doi:10.1029/2018jb016356
Li, J., Cawood, P. A., Ratschbacher, L., Zhang, Y., Dong, S., Xin, Y., et al. (2020). Building Southeast China in the late Mesozoic: insights from alternating episodes of shortening and extension along the Lianhuashan fault zone. Earth-Sci. Rev. 201, 103056. doi:10.1016/j.earscirev.2019.103056
Li, T., Jiang, M., Zhao, L., Yao, W., Chen, L., Chu, Y., et al. (2022). Wedge tectonics in South China: constraints from new seismic data. Sci. Bull. 67, 1496–1507. doi:10.1016/j.scib.2022.05.007
Li, J., Dong, S., Cawood, P. A., Thybo, H., Clift, P. D., Johnston, S. T., et al. (2023a). Cretaceous long-distance lithospheric extension and surface response in South China. Earth-Sci. Rev. 243, 104496. doi:10.1016/j.earscirev.2023.104496
Li, M., Zhang, S., Wei, Y., and Xu, C. (2023b). Complex crustal deformation beneath the Cathaysia block in south China: evidence from receiver function analysis. Earth Space Sci. 10, e2022EA002235. doi:10.1029/2022ea002235
Ligorría, J. P., and Ammon, C. J. (1999). Iterative deconvolution and receiver-function estimation. B. Seismol. Soc. Am. 89, 1395–1400. doi:10.1785/bssa0890051395
Lin, W., and Li, J. (2021). Cretaceous two stage extensional tectonic in eastern Eurasia continent and its geodynamics. Acta Petrol. Sin. 37, 2303–2323. doi:10.18654/1000-0569/2021.08.04
Liu, H., and Niu, F. (2012). Estimating crustal seismic anisotropy with a joint analysis of radial and transverse receiver function data. Geophys. J. Int. 188, 144–164. doi:10.1111/j.1365-246x.2011.05249.x
Liu, C., Liu, Z., Wu, F., and Chu, Z. (2012). Mesozoic accretion of juvenile sub-continental lithospheric mantle beneath South China and its implications: geochemical and Re–Os isotopic results from Ningyuan mantle xenoliths. Chem. Geol. 291, 186–198. doi:10.1016/j.chemgeo.2011.10.006
Lombardi, D., Braunmiller, J., Kissling, E., and Giardini, D. (2008). Moho depth and Poisson's ratio in the Western-central alps from receiver functions. Geophys. J. Int. 173, 249–264. doi:10.1111/j.1365-246x.2007.03706.x
Long, M. D. (2016). The Cascadia Paradox: mantle flow and slab fragmentation in the Cascadia subduction system. J. Geodyn. 102, 151–170. doi:10.1016/j.jog.2016.09.006
Long, M. D., and Becker, T. W. (2010). Mantle dynamics and seismic anisotropy. Earth Planet. Sci. Lett. 297, 341–354. doi:10.1016/j.epsl.2010.06.036
Long, M. D., and Silver, P. G. (2009). Shear wave splitting and mantle anisotropy: measurements, interpretations, and new directions. Surv. Geophys. 30, 407–461. doi:10.1007/s10712-009-9075-1
Ma, J., Guo, Z., Huang, J., Fu, Y. V., and Barnard, A. (2023). Defining the Yangtze–Cathaysia suture zone in South China using ambient noise tomography. Geophys. J. Int. 234, 512–527. doi:10.1093/gji/ggad043
Mao, J., Zheng, W., Xie, G., Lehmann, B., and Goldfarb, R. (2021). Recognition of a middle–late Jurassic arc-related porphyry copper belt along the southeast China coast: geological characteristics and metallogenic implications. Geology 49, 592–596. doi:10.1130/g48615.1
Nie, S., Tian, X., Liang, X., and Wan, B. (2023). Less-well-developed crustal channel-flow in the central Tibetan Plateau revealed by receiver function and surface wave joint inversion. J. Geophys. Res. 128, e2022JB025747. doi:10.1029/2022jb025747
Savage, M. K. (1998). Lower crustal anisotropy or dipping boundaries? Effects on receiver functions and a case study in New Zealand. J. Geophys. Res. 103, 15069–15087. doi:10.1029/98jb00795
Savage, M. K. (1999). Seismic anisotropy and mantle deformation: what have we learned from shear wave splitting? Rev. Geophys. 37, 65–106. doi:10.1029/98rg02075
Shu, L., Faure, M., Yu, J., and Jahn, B. M. (2011). Geochronological and geochemical features of the Cathaysia block (South China): new evidence for the Neoproterozoic breakup of rodinia. Precambrian Res. 187, 263–276. doi:10.1016/j.precamres.2011.03.003
Silver, P. G. (1996). Seismic anisotropy beneath the continents: probing the depths of geology. Annu. Rev. Earth Planet. Sci. 24, 385–432. doi:10.1146/annurev.earth.24.1.385
Sun, Y., Dong, S., Zhang, H., Li, H., and Shi, Y. (2013). 3D thermal structure of the continental lithosphere beneath China and adjacent regions. J. Asian Earth Sci. 62, 697–704. doi:10.1016/j.jseaes.2012.11.020
Tan, P., and Nie, S. (2021). Crustal deformation in eastern margin of Tibetan Plateau from a dense linear seismic array. Phys. Earth Planet. Interiors 321, 106801. doi:10.1016/j.pepi.2021.106801
Wang, M., and Shen, Z. (2020). Present-day crustal deformation of Continental China derived from GPS and its tectonic implications. J. Geophys. Res. 125, e2019JB018774. doi:10.1029/2019jb018774
Wang, Y., Fan, W., Guo, F., Peng, T., and Li, C. (2003). Geochemistry of Mesozoic mafic rocks adjacent to the Chenzhou-linwu fault, south China: implications for the lithospheric boundary between the Yangtze and cathaysia blocks. Int. Geol. Rev. 45, 263–286. doi:10.2747/0020-6814.45.3.263
Wang, P., Wang, L., Mi, N., Liu, J., Li, H., Yu, D., et al. (2010). Crustal thickness and average Vp/Vs ratio variations in southwest Yunnan, China, from teleseismic receiver functions. J. Geophys. Res. 115. doi:10.1029/2009JB006651
Wei, Y., Yang, H., Li, W., and Wang, G. (2025). Passive and active source imaging of the deep structure in the Pearl river Delta using a dense nodal array. Rev. Geophys. Planet. Phys. (in Chinese) 56, 193–200. doi:10.19975/j.dqyxx.2024-035
Xia, S., Shen, Y., Zhao, D., and Qiu, X. (2015). Lateral variation of crustal structure and composition in the Cathaysia block of South China and its geodynamic implications. J. Asian Earth Sci. 109, 20–28. doi:10.1016/j.jseaes.2015.05.010
Xu, J., Xu, X., Shen, X., and Huang, H. (2023). Crustal anisotropy of the South China block and tectonic implications. J. Asian Earth Sci. 258, 105734. doi:10.1016/j.jseaes.2023.105734
Yang, Y., Ritzwoller, M. H., Zheng, Y., Shen, W., Levshin, A. L., and Xie, Z. (2012). A synoptic view of the distribution and connectivity of the mid-crustal low velocity zone beneath Tibet. J. Geophys. Res. 117, B04303. doi:10.1029/2011jb008810
Yang, X., Li, H., Li, Y., Lü, Q., Zhang, G., Jiang, G., et al. (2019). Seismic anisotropy beneath eastern China from shear wave splitting. Geophys. J. Int. 218, 1642–1651. doi:10.1093/gji/ggz242
Yuan, X., Ni, J., Kind, R., Mechie, J., and Sandvol, E. (1997). Lithospheric and upper mantle structure of southern Tibet from a seismological passive source experiment. J. Geophys. Res. 102, 27491–27500. doi:10.1029/97jb02379
Zandt, G., and Ammon, C. J. (1995). Continental crust composition constrained by measurements of crustal poisson's ratio. Nature 374, 152–154. doi:10.1038/374152a0
Zha, X., sun, C., and Li, C. (2013). The effects of dipping interface and anisotropic layer on the result of H-κ method. Progress in Geophys. (in Chinese) 28, 121–131. doi:10.6038/pg20130113
Zhao, G., and Cawood, P. A. (2012). Precambrian geology of China. Precambrian Research 222-223, 13–54. doi:10.1016/j.precamres.2012.09.017
Zheng, G., Wang, H., Wright, T. J., Lou, Y., Zhang, R., Zhang, W., et al. (2017). Crustal deformation in the India-Eurasia Collision zone from 25 years of GPS measurements. J. Geophys. Res. 122, 9290–9312. doi:10.1002/2017jb014465
Zhou, X. M., and Li, W. X. (2000). Origin of late Mesozoic igneous rocks in Southeastern China: implications for lithosphere subduction and underplating of mafic magmas. Tectonophysics 326, 269–287. doi:10.1016/s0040-1951(00)00120-7
Keywords: South China Block, Cathaysia Block, receiver functions, crustal anisotropy, H-k-c stacking method
Citation: Tan P, Duan Y, Wei Y, Tan Y and Zhao Y (2025) Crustal deformation in the Cathaysia Block, South China: insights from receiver function analysis. Front. Earth Sci. 13:1716086. doi: 10.3389/feart.2025.1716086
Received: 30 September 2025; Accepted: 03 November 2025;
Published: 18 November 2025.
Edited by:
Nicola Alessandro Pino, University of Camerino, ItalyReviewed by:
Han Rubing, Tsinghua University, ChinaZhuo Ye, Chinese Academy of Geological Sciences, China
Alex Barnard, Geolibra, United Kingdom
Copyright © 2025 Tan, Duan, Wei, Tan and Zhao. This is an open-access article distributed under the terms of the Creative Commons Attribution License (CC BY). The use, distribution or reproduction in other forums is permitted, provided the original author(s) and the copyright owner(s) are credited and that the original publication in this journal is cited, in accordance with accepted academic practice. No use, distribution or reproduction is permitted which does not comply with these terms.
*Correspondence: Yonghong Duan, eWhkdWFuMTIzQDEyNi5jb20=