Abstract
The interface of a structural system in the soil is usually unsaturated. A decrease in the shear strength of the soil-structure interface can degrade the structure, especially under humid conditions. Studying the shear characteristics of the silt-concrete interface using a shear apparatus. Suction-controlled ring shear tests were carried out on the silt-concrete interface for three interface roughness values. The influence of the matric suction (s) and interface roughness (R) on the shear strength index of the silt-concrete interface was analyzed. The test results showed that high values of s and R improved the shear strength of the interface, but the result was affected by the net normal stress (NNS). High values of NNS and R improved the strain-hardening characteristics. NNS, s, and R significantly affected the interface shear shrinkage. The internal friction angle of the saturated interface was smaller than that of saturated silt, whereas the opposite occurred in the unsaturated state. The cohesion and internal friction angle of the interface rose with an increase in R, and they were larger than that of silt. A shear strength model of the silt and interface was established.
1 Introduction
The shear characteristics of the soil-structure interface are critical to the design of structures in the soil (such as pile foundations, retaining walls, and soil nails). The interaction between the soil and the structure significantly influences the bearing capacity and stability evaluation of geotechnical engineering. The interface shear test is a direct and simple method widely used to study the shear characteristics of the soil-structure interface (Li Y. H. et al., 2021). The interfaces of most structural systems in the soil are usually unsaturated, and external factors, such as temperature and humidity, affect the matric suction. In particular, humid conditions at the interface alter the matric suction, decreasing the shear strength of the soil-structure interface, deteriorating the structure, and reducing its operating performance.
Researchers have studied the shear characteristics of unsaturated interfaces using suction- and stress-controlled direct shear tests (Borana et al., 2016; Hamid and Miller, 2008; Hamid and Miller, 2009; Hossain and Yin, 2012). Peng et al. (2022) performed direct shear tests on the interface between unsaturated soil and steel plates, considering the influence of matric suction and interface roughness. However, due to the limited strain range of the direct shear instrument, it cannot accurately reflect the deformation and failure law of the soil-structure interface after long-distance shearing. Various methods, including direct shear (Li D. et al., 2022; Borana et al., 2016; Chen et al., 2015; Shi et al., 2020), simple shear (Hossain and Yin, 2014; Kim et al., 2023), and ring shear (Mijic et al., 2021) tests have been employed to investigate the soil-structure interaction. These studies examined the impact of the water content, stress state, freeze-thaw cycles, and temperature, cyclic load (Li et al., 2022b; Yin et al., 2020; Ravera and Laloui, 2022; Shi et al., 2020; Rui et al., 2021), and other factors on the interface shear strength and shear strength parameters. Most studies focused on sand, silt sand, and cohesive soil (Kou et al., 2021; Konkol and Mikina, 2021; Li et al., 2022b; Chen et al., 2015; Shi et al., 2020). For example, Li Y. et al. (2021) experimentally studied the interface shear behavior between microbially induced calcite precipitation (MCIP)-treated calcareous sand and steel under different cementation degrees and normal stress conditions. Zhang et al. (2021) conducted ring shear tests using loose and dense sand with different roughness values. Monotonic shear tests were performed at the steel interface. Qu et al. (2021) conducted large-scale direct shear tests on the freeze-thaw interface of unsaturated coarse-grained soil using a temperature control system. It is noted that researchers have conducted suction-controlled direct shear tests (Borana et al., 2016). Nonetheless, the shear displacement of the direct shear instrument is limited. The shear area remains the same during the ring shear test (Hong et al., 2009). The shear testing equipment is capable of subjecting the soil specimen to rather large strains. The residual shear stress state in the field can be accurately simulated in the laboratory (Patil et al., 2020). However, a lack of data exists on the silt-structure interface characteristics in suction-controlled shear tests.
Furthermore, although the studies mentioned above have revealed the influence of various factors on the shear characteristics at the soil-structure interface at the macro level, there remains a lack of in-depth mechanistic exploration into the initiation, evolution, and dominant patterns of micro-damage within the interface zone during the shear process. In recent years, research on the fracture mechanics of geosynthetics has provided new insights into understanding such issues. For example, Niu et al. (2020) proposed a systematic mode classification framework for identifying fractures in defective red sandstone. This analytical framework is applicable for distinguishing shear-dominated interface failure mechanisms from tensile or mixed-mode microfracture processes in rough interfaces. Meanwhile, Zhou et al. (2014), Zhou et al. (2018), Zhou et al., (2019a), and Zhang and Zhou (2020c) experimentally investigated crack growth, coalescence, and encapsulation in rock materials containing pre-existing defects under uniaxial loading. Their insights into defect interactions and coalescence pathways provide a basis for exploring how protrusions on rough interfaces and soil interactions influence tensile cracking, strain hardening behavior, and the ultimate transition to residual strength states. Furthermore, these scholars (Zhou et al., 2019b; Zhang J. W. et al., 2020; Zhang and Zhou, 2022; Zhang and Zhou, 2023) employed combined acoustic-optical-mechanical testing to reveal correlations between acoustic emission characteristics and crack sequences in defective sandstone. Their findings on damage evolution provide insights into interpreting transitions between strain hardening and softening. Therefore, this paper will draw upon these advanced concepts from fracture mechanics and damage theory. It aims not only to investigate the macroscopic shear behavior at the silt-concrete interface experimentally but also to elucidate its underlying mechanisms at the micro-mechanical level.
The interface of a structural system in the soil is usually unsaturated. Therefore, it is crucial to study the influence mechanism of matric suction on the silt-structure interface under humid conditions. The shear characteristics of the silt-concrete interface were analyzed, and the influences of the net normal stress (NNS), matric suction (s), and interface roughness (R) on the shear stress-shear displacement relationship were investigated. By integrating advanced concepts from fracture mechanics and damage theory, an attempt was made to explain its macroscopic mechanical behavior. Estimating the shear strength of the unsaturated soil interface is essential in geotechnical engineering (Escario and Saez, 1986; Fredlund et al., 1978; Borana et al., 2015). Therefore, a calculation model of the interface shear strength index was established. The research results improve our understanding of the unsaturated silt-structure interface in practical applications.
2 Laboratory tests
2.1 Test materials
The silt was obtained from a foundation pit engineering project in the Zhongyuan District of Zhengzhou City. The physical and mechanical properties of the silt are listed in Table 1, and the particle size distribution is shown in Figure 1. From Figure 1, it can be seen that the test soil is a typical silt, and its particle size is mainly concentrated in the range of 0.05–0.075 mm (approximately 57.8%). So, the test soil is poorly graded silt (fine-grained soil).
TABLE 1
| Natural moisture content w (%) | Natural density ρ (g/cm3) | Specific gravity Gs | Liquid limit wL (%) | Plastic limit wP (%) | Plasticity index IP |
|---|---|---|---|---|---|
| 13.24 | 1.82 | 2.71 | 21.6 | 15.2 | 6.4 |
The physical and mechanical properties of the silt.
FIGURE 1

The grain size distribution curve of silt.
2.2 Test apparatus
We used the SRS-150 unsaturated soil dynamic ring shear apparatus (GCTS company, United States). This instrument is a Bromhead ring shear apparatus, featuring an integrated shear box that prevents soil leakage during shearing. Its design ensures shearing occurs along a predetermined plane, effectively eliminating stress-strain nonuniformity along the shear plane and stress concentration at the shear edges. It primarily consists of a data acquisition system, PCP-15U pressure control panel, control cabinet, and shear device (Figure 2). This apparatus applies a moment to a ring-shaped soil specimen, inducing shear deformation and failure to determine the soil’s stress-strain relationship and residual strength. The PCP-15U module utilizes axial translation technology to measure matrix suction, which is controlled via the SWCC panel to regulate suction within the pressure chamber. For triaxial tests, the instruments employed are the GDS unsaturated triaxial apparatus and the GDS conventional triaxial apparatus.
FIGURE 2

SRS-150 dynamic ring shear apparatus for unsaturated soil.
2.3 Improvement of test apparatus
The device in the main ring shear module of the ring shear used is only suitable for performing ring shear on the soil itself, and its upper shear box comprises a load plate and a circular rotating pressure plate. The interior of the load plate is equipped with porous stone and grooves to simulate soil-soil shear. The height of the load plate shell is 6 mm, which prevents the soil from overflowing during the test and ensures that the porous stone inside the load plate is not crushed. For this test, the shear at the soil-structure interface was required, so the upper load plate was modified from the original device.
Our idea of improvement is to realize soil-concrete interfacial shear by pouring concrete into the load plate shell, which is mounted to the circular rotating pressure plate by means of set screws after standard curing. However, considering that the coarse aggregate in the concrete tends to protrude and cause unevenness in the contact surface, the height of the original load plate shell was increased, and the height of the circular rotating pressure plate was reduced accordingly. As shown in Figure 3, the specific change is the height of the load plate from the original 6 mm–12 mm, the height of the circular rotating pressure plate correspondingly reduced by 6 mm, so that the overall height of the two with the original (Figure 4), other geometric parameters (inner and outer radius, etc.) are not changed. Four positioning holes are provided on the circular rotating pressure plate to facilitate the positioning and fixing of the load plate. Twelve screw holes are provided for connecting the ring-shaped pressurized plate with the load plate, and it is easy to replace the load plate with different roughness materials. Twelve air venting holes are provided to facilitate the application of air pressure to the specimen. The load plate and the ring-shaped pressure plate are fixed to form the upper shear box, and the connection between the upper shear box and the rotating shaft remains unchanged and is fixed by eight screws.
FIGURE 3

Improved shear loading device. (a) Circular rotating pressure plate. (b) Load plate. (c) Upper shear box.
FIGURE 4

Before and after improvement of the upper shear box. (a) Before improvement. (b) After improvement.
Concrete preparation was selected as 42.5 normal silicate cement with a mix ratio of water: sand: gravel: cement = 1:4.26:0.8. Rough surface was achieved by pouring concrete into the load plate shell. Based on the mixing ratio, sand and gravel of different grain sizes were added to the concrete to change its surface roughness. After casting, the concrete load plates were covered with cling film and placed in a curing room at a temperature of 20 °C ± 2 °C and a humidity of >95% for a period of 28 days.
In this paper, the average depth of sand filling proposed by Zhao et al. (2000) was used to quantify the interface roughness. The sand filling method is to find a horizontal plane with a level meter, then place the test block to be measured on it, surround the concrete bonding surface with four pieces of plastic boards so that the top surface of the plastic boards is flush with the highest point of the bonding surface protrusion, fill them with the standard sand specified in GB178, and wipe the top surface of the plastic boards flat until no more sand particles fall down. Pour all the sand on the bonding surface of the test block into the measuring cylinder, measure its volume, and repeat the above procedure three times. Calculate the cross-sectional area of the concrete load plate and express the roughness in terms of the average depth of sand filling using the Equation 1:where V0 is the volume of sand on the surface of the structure, mm3, and A0 is the structure surface area, mm2.
We assessed concrete interfaces with three roughness values (Figure 5).
FIGURE 5
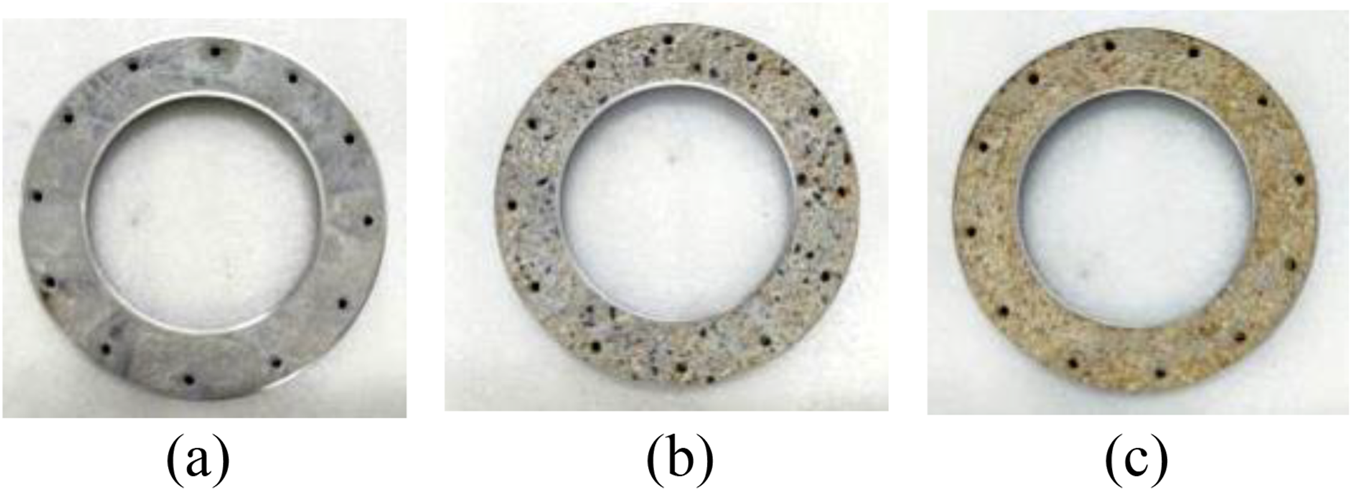
Concrete interface with different roughness. (a)R = 0.11 mm. (b)R = 0.37 mm. (c)R = 0.54 mm.
2.4 Test procedure
2.4.1 Preparation of soil specimens
The ring shear test specimens are hollow ring-shaped. Due to limitations in shape and the nature of silt, undisturbed samples are difficult to obtain. Therefore, remolded specimens were used in this test. Saturated silt specimens were prepared using the saturated slurry method. First, the undisturbed soil was dried, crushed, and sieved through a 2 mm mesh. The initial dry density of all soil specimens was set to 1.60 g/cm3, with a fill height of 20 mm. The saturated slurry is prepared by ensuring each weighing yields the same mass of dry soil, adding twice the liquid limit of deaerated water, and thoroughly mixing with a vacuum mixer while simultaneously applying vacuum pressure. Filter paper is placed at the bottom of the shear cell, and saturated slurry is poured into the shear cell and distributed evenly, with a ring-shaped filter paper matching the device’s dimensions placed above the slurry. After resting for a period, apply pre-compression using the instrument’s built-in shear box with weights to compress the test specimens to the same height, ensuring consistency among initial specimens. Upon completion of pre-compression, the initial saturated specimens are obtained. The specimen preparation process is illustrated in Figure 6.
FIGURE 6

Sample preparation process.
2.4.2 Specimen mounting
Connect the CATS software control system to the main shear module system of the instrument and zero the sensor readings. Raise the rotating shaft via the servo controller until it reads −15 mm, then secure the lower shear box holding the specimen to the specimen holder with six screws. Secure the upper shear box to the rotating shaft with eight screws. Slowly lower the rotating shaft until interface contact is achieved. Contact is established when the normal stress exceeds zero. Apply a normal stress of 25 kPa to ensure full contact between the specimen and the upper shear box. Install the acrylic cover and secure the top cover plate to the main body with screws.
2.4.3 Flush line
The air-free water is injected through the inlet using the instrument’s flushing tube to flush the liquid level tube. This process aims to expel air bubbles from the main pipeline, ensuring the pipeline is completely filled with air-free water. The presence of air bubbles within the pipeline can cause inaccurate readings and errors in the liquid level tube.
2.4.4 Solidification
In accordance with the test program, the consolidation time, consolidation stress and loading time were set, and the operation started. Initial normal displacements and liquid level tube readings were recorded after the load was applied and then hourly for comparison. Solidification is completed when the change in normal displacement is less than 0.01 mm per hour and the liquid level tube reading does not change.
2.4.5 Substrate suction balancing
At this stage, a small value of air pressure is applied to test the device for air leakage. If there is no problem, the air pressure and normal stress values are increased synchronously to keep the net normal stress constant, and when the stress is applied to the set value, the initial normal displacement and liquid level tube reading are recorded. Every day thereafter, the liquid level tube needs to be pumped back and forth using a flushing tube to expel air bubbles in the tube connected to the shear module, and the liquid level tube readings are recorded after the flushing is completed. The suction equilibrium criterion was less than 0.035 mL of drainage per 24 h and no change in vertical displacement (Hoyos et al., 2014).
2.4.6 Shearing
This instrument is an integrated shear box with a gap between the shear box and the rotating pressure plate. Therefore, consolidated drained shear testing was employed for this experiment. Research indicates that the shear displacement at the interface between silt and concrete in this region reaches peak strength and stabilizes around 4 mm. The shear displacement for this test is set at 10 mm. When the shear rate is less than 0.1 mm/min, its effect on the shear strength at the interface is negligible (Li D. Y. et al., 2022; Bhat et al., 2013). Therefore, a shear rate of 0.02 mm/min is selected for the ring shear test, corresponding to a shear duration of 500 min.
2.5 Test design
The mechanical properties of the interface between unsaturated silt and concrete under suction control were analyzed. The NNS (σn-ua) values were 100 kPa, 200 kPa, and 400 kPa. The mechanical properties of the soil at low matric suction (0–400 kPa) are of interest in practical applications (Gan et al., 1988; Naghadeh and Toker, 2019). Therefore, the matric suction values (ua-uw) of the unsaturated triaxial test were selected as 0, 50, 100, and 200 kPa. When conducting shear tests on interfaces with different roughness on silt, the roughness of the contact surface should not be excessive (Li, 2022a). The interface roughness (R) values were 0.11 mm, 0.37 mm, and 0.54 mm. This test employs a constant net normal stress control method, wherein a specimen undergoes a single continuous shear under the same net normal stress level, allowing for vertical deformation. When the interfacial shear stress reaches a stable state, shearing is halted. The shear strength at this point is deemed the residual strength of the interface. An unsaturated triaxial test with constant water content and a conventional triaxial test with consolidated undrained conditions were used to calculate the shear strength parameters of silt. The types of silt-concrete interface shear tests are listed in Table 2, and the types of silt shear strength tests are listed in Table 3.
TABLE 2
| No. | σ n -ua (kPa) | u a -uw (kPa) | R (mm) | NO. | σ n -ua (kPa) | u a -uw (kPa) | R (mm) |
|---|---|---|---|---|---|---|---|
| M1 | 100 | 0 | 0.11 | M10 | 100 | 200 | 0.11 |
| M2 | 200 | 0 | 0.11 | M11 | 200 | 200 | 0.11 |
| M3 | 400 | 0 | 0.11 | M12 | 400 | 200 | 0.11 |
| M4 | 100 | 50 | 0.11 | N1 | 100 | 50 | 0.37 |
| M5 | 200 | 50 | 0.11 | N2 | 200 | 50 | 0.37 |
| M6 | 400 | 50 | 0.11 | N3 | 400 | 50 | 0.37 |
| M7 | 100 | 100 | 0.11 | N4 | 100 | 50 | 0.54 |
| M8 | 200 | 100 | 0.11 | N5 | 200 | 50 | 0.54 |
| M9 | 400 | 100 | 0.11 | N6 | 400 | 50 | 0.54 |
The types of silt-concrete interface shear tests.
TABLE 3
| No. | σ n -ua (kPa) | u a -uw (kPa) | No. | σ n -ua (kPa) | u a -uw (kPa) | No. | σ n -ua (kPa) | u a -uw (kPa) |
|---|---|---|---|---|---|---|---|---|
| S1 | 100 | 0 | S4 | 100 | 50 | S7 | 100 | 100 |
| S2 | 200 | 0 | S5 | 200 | 50 | S8 | 200 | 100 |
| S3 | 400 | 0 | S6 | 400 | 50 | S9 | 400 | 100 |
The types of silt shear strength tests.
3 Results
3.1 Interface shear properties
Figures 7–10 show the test results for different values of the NNS, matric suction, and interface roughness, respectively.
FIGURE 7

Effect curve of net normal stress on shear stress-shear displacement under different matrix suctions. (a)ua-uw = 0 kPa. (b)ua-uw = 50 kPa. (c)ua-uw = 100 kPa. (d)ua-uw = 200 kPa.
FIGURE 8

Effect curve of net normal stress on shear stress-shear displacement under different interface roughness. (a)R = 0.11 mm. (b)R = 0.37 mm. (c)R = 0.54 mm.
FIGURE 9

Shear stress-shear displacement curve under different matrix suctions. (a)σn-ua = 100 kPa. (b)σn-ua = 200 kPa. (c)σn-ua = 400 kPa.
FIGURE 10

Shear stress-shear displacement curve under different interface roughness. (a)σn-ua = 100 kPa. (b)σn-ua = 200 kPa. (c)σn-ua = 400 kPa.
3.1.1 Effect of net normal stress (NNS)
Figure 7 shows the silt-concrete interface shear results for different NNS and matric suctions at an interface roughness of 0.11 mm. The shear stress of the specimen increases with the horizontal displacement (Zhang Z. L. et al., 2020). The shear stress stabilizes when the horizontal displacement reaches a critical value, which is consistent with a large-scale direct shear test result (De et al., 2022). The critical value and initial shear stiffness increase with the NNS (Li et al., 2021; Zhang Z. L. et al., 2020; Rui et al., 2020). The NNS has a significant effect on the interface shear stress. As the NNS increases, the soil at the interface is compacted, the contact surface between the silt particles and concrete increases, and the interface friction coefficient increases. Therefore, the shear displacement required to achieve a stable shear stress is larger, and the shear strength at the interfaces increases.
When the suction is 200 kPa, shear dilation occurs at the interface at lower NNS, and shear shrinkage and dilation are observed at higher NNS (Figure (d)). The shear shrinkage is significant at low matric suction; the higher the matric suction, the more significant the dilatancy. The larger NNS, the greater the volume shrink and the smaller the shear dilatancy (Qu et al., 2021). When the matric suction is low, and the NNS is high, the silt particles are broken during the shearing process, and the particle may be damaged or ruptured, resulting in an increase occlusal friction and soil compression. During the interface shearing process, the soil grains tend to rearrange and possibly roll over the concrete counterface as a result causing dilation (Borana et al., 2015).
Figure 8 shows the silt-concrete interface shear results for different NNSs and roughnesses at a matric suction of 50 kPa. The NNS has a significantly greater impact on the interface shear strength than R. The interfaces exhibit shear shrinkage. As shown in Figure (a), weak strain-softening occurs at lower NNS, whereas strain-hardening is observed at NNS of 400 kPa.
3.1.2 Effect of matric suction (s)
Figure 9 shows the silt-concrete interface shear results for different NNS and s when R is 0.11 mm. The increase of s significantly increases the interface shear strength (Li et al., 2021; Borana et al., 2015; Borana et al., 2016). The interface shear strength of unsaturated soil is significantly higher than that of saturated soil. As the NNS increases, the effect of s on the interface shear strength is improved, and a nonlinear relationship exists between s and the residual shear strength. As s increases, the bound water film on the surface of the soil particles becomes thinner, and the cementation effect of the soil particles increases. As the contact area between the soil and concrete increases, the interface friction and the interface shear stress increase. All shear stress-displacement curves do not exhibit softening characteristics for higher matric suction. These results are different from the research observations of Li et al. (2021) for the silt.
The interface shear shrinkage tends to exhibit shear dilatancy as s increases, which is similar to the findings of Borana et al. (2015); however, this trend decreases with an increase in the NNS. The effect of the NNS on shear dilatancy is greater than that of s; therefore, the NNS has a larger influence on the interface strength than s. The preparation of remolded soil samples requires pre-compaction. Part of the force during the test compacts the soil samples compacted, and the other part is transformed into potential energy. During the shear test, the soil sample structure is destroyed during the shear test, releasing the potential energy and resulting in the volume expansion of the soil sample. When the NNS is high, the expansion force cannot offset the NNS; thus, the volume expansion is limited. This phenomenon can be explained according to the test conclusions drawn by Yu et al. (2022). The curves of shear stress-horizontal displacement for interfaces indicate gradual hardening behavior at higher suction and partial hardening/softening behavior at lower suction, which is contrary to the results on completely decomposed granite soil by Borana et al. (2016).
3.1.3 Effect of interface roughness (R)
Figure 10 compares the silt-concrete interface shear results for different NNS and R values, with a constant s value of 50 kPa. The interface with greater R gains a higher peak shear strength value, which was consistent with the conclusion of the other shear test (Borana et al., 2016; Yu et al., 2022). As R increases, the friction and bite force at the interface between the silt and concrete increase, causing the formation of a thicker shear band, which requires a greater force to produce relative displacement (Li et al., 2021). Additionally, the interface shear stress and vertical deformation increase. The contribution of R to the interface shear stress depends on the NNS level. When the NNS is high, the contribution is significant.
Strain-softening occurs when R is 0.11 mm (Figure (a) and (b)), and strain-hardening is observed when R is 0.37 and 0.54 mm, indicating that a high value of R results in strain-hardening, which is contrary to the law of the dense sand (Zhang et al., 2021). As R increases, the shear shrinkage becomes more significant (Li et al., 2021). However, due to the higher NNS, the soil is compacted, reducing its compressibility (Borana et al., 2016). The difference in the shear shrinkage of the specimens at different R values is small when the NNS is 400 kPa.
4 Discussion and analysis
4.1 Interface shear strength
The test results show that the stress-strain curve has no significant peak, and a negligible difference is observed between the peak stress and the residual stress. Therefore, we analyzed the effect of matric suction and interface roughness on the residual effective cohesion and internal friction angle of the interface. The relationship between the residual shear strength of the silt-concrete interface and the NNS is Equation 2:where τr is the residual shear strength of the interface (kPa), σ0 is the net normal stress (kPa), φ0 is the effective internal friction angle of the interface (°), and c0 is the effective cohesion of the interface (kPa).
Figure 11 shows the fitted relationship between the interface residual shear strength and NNS under different s values for R = 0.11 mm. The effect of matric suction on the residual effective cohesion and effective friction angle of the interface residual shear strength is shown in Figure 12.
FIGURE 11

Fitting line under different matrix suctions.
FIGURE 12

Shear strength index changes with matrix suction.
The results in Figure 11 show that the residual shear strength of the interface increases with the increase in s and NNS. The results were consistent with the direct shear test results (Li et al., 2021; Yu et al., 2022). When NNS is consistent, a nonlinear correlation is present between matric suction and residual shear strength of the interface. Combined with Figure 9 in the test results, the entire shear process can be regarded as a continuous damage evolution process. Drawing on the concept proposed by Zhang and Zhou (2022) of using the acoustic emission event rate to distinguish between microfracturing and macrofracturing, the different stages of the shear stress-displacement curve in this experiment essentially reflect the cumulative sequence of damage events, including the failure of cementation within the interface zone, the rearrangement of soil particles, the formation of new contact points, and ultimately the complete formation of the shear zone. The increase in substrate suction strength enhances the bonding between soil particles, effectively raising the threshold for damage evolution. This delays the onset of strain softening and elevates the peak strength.
Figure 12 shows that as s increases, c0 exhibits a significant nonlinear growth with a decreasing growth rate, demonstrating that s contributes significantly to cohesion within a certain range (Marinho and do Amaral Vargas, 2020). As the matric suction increases, the amount of weakly bound water around the silt particles decreases, and the level of cementation of insoluble salts increases. The water film becomes thinner, increasing the molecular attraction between the soil particles, resulting in increased cohesion (Qu et al., 2021). As s increases, φ0 generally increases. φ0 is very small in the shear stage of the saturated silt and concrete interface. φ0 exhibits no significant change in the unsaturated state, which is similar to the result for the silty sand and the medium-coarse sand interfaces (De et al., 2022), and the matric suction has a negligible effect. However, the matric suction has a significant effect on φ0 at low values (0–50 kPa).
In summary, the effective shear strength index of the interface is significantly different in the unsaturated and saturated states, and the contribution of the matric suction to c0 is much larger than that of φ0.
Figure 13 shows the fitted relationship between the interface residual shear strength and NNS under different R values for a matric suction of 50 kPa. The changes in c0 and φ0 with a change in the interface roughness are shown in Figure 14.
FIGURE 13

Fitting line under different roughness.
FIGURE 14

Shear strength index changes with roughness.
Figure 13 indicates that the interface residual shear strength increases nonlinearly as the interface roughness increases (Yu et al., 2022). The contribution of the interface roughness to the interface residual shear strength strongly depends on the NNS level. The contribution is larger at a higher NNS. Combined with Figure 9 in the test results, stress softening occurs under low roughness conditions (R = 0.11 mm). Referring to Niu et al. (2020)’s classification system for rock fractures, low-roughness interfaces primarily exhibit smooth friction, where microcrack activity may be dominated by a shear-prevailing mode, leading to significant strain softening. This is analogous to the reduction in bearing capacity caused by the formation of macroscopic shear cracks in rock. As R increases to 0.37 and 0.54 mm, a strong “interlocking” effect develops between the protrusions on the concrete surface and the silt particles. This interaction may resemble the three-dimensional cross-defects studied by Zhou et al. (2018), where complex stress redistribution and crack wrapping occur under loading. During this process, soil particles sheared by protrusions generate numerous tensile and mixed-mode microcracks, consuming additional energy. Macro-scale manifestations include sustained strain hardening and elevated shear strength.
Figure 14 shows that c0 and φ0 increase with the R nonlinearly, but the growth rate of c0 is higher. The growth rate gradually decreases (Pei et al., 2021). The main reason is that the interface roughness increases, causing more soil particles to be embedded in the concrete groove, enhancing the interlocking between the soil and the soil in the groove (De et al., 2022; Zhang J. W. et al., 2020). The friction between the soil and the smooth part of the concrete is weakened, but the interlocking is enhanced in the groove, causing a slight increase in φ0.
The effective cohesion is more affected by the change in suction. However, it seems that the interface roughness plays an important role on the change of cohesion. Although the silt-concrete interface presents the highest cohesion for high suction, its value rapidly decreases with the reduction in suction. The similar phenomenon had been reported in other research papers (Marinho and do Amaral Vargas, 2020).
4.2 Comparison of silt strength and interface shear strength
The shear strength indicators of the silt and the silt-concrete interface (S-I) for different matric suction and interface roughness values were analyzed. Figure 15 shows the shear strength indexes of the silt and S-I for different suction (R = 0.11 mm). Figure 16 depicts the shear strength indexes of the silt and S-I for different R values (s = 50 kPa).
FIGURE 15

Comparison of shear strength indicators under different matrix suctions (R = 0.11 mm). (a) Cohesion. (b) The internal friction angle.
FIGURE 16

Comparison of shear strength indicators under different interface roughness (s = 50 kPa). (a) Cohesion. (b) The internal friction angle.
As s increases, the difference in cohesion is not significant, and a linear relationship is observed (Figure 15). However, a significant difference in the internal friction angle between silt and interface occurs. Matrix suction predominantly affects the moisture content of the silt, thereby influencing the silt cohesion and consequently impacting the cohesion of interface. It is likely that the high proportion of silt particles in the concrete grooves caused the shear zone to form in the silt, and it appears not to follow the actual interface with the concrete. This is similar to the findings of other researchers (Borana et al., 2015; Marinho and do Amaral Vargas, 2020). Therefore, the interface shear behavior is similar to the shearing of the silt. The interface cohesion depends on the soil type. As the state changes from saturated to unsaturated, the internal friction angle of S-I increases, whereas that of the silt decreases slightly. This may occur due to an increase in matric suction, which reduces the amount of pore water and increases the pore space (Wang and Chou, 2023). An increase in the contact area between the soil particles and the interface increases the friction force and the internal friction angle. However, the soil particles are broken and redistributed, reducing the interlocking between the soil particles and the internal friction angle of the silt. The interfacial shear strength decreases with the decrease in the unsaturated soil matric suction (Wang and Chou, 2023). It is noted that whether it is silt or silt-concrete interface. The cohesion increased significantly with the matric suction, but the internal friction angle fluctuated in a small range and exhibited no significant change. The internal friction angle of the saturated silt interface is observed to be lower than that of the silt, demonstrating a significant relationship with the critical value for the matrix suction. Interestingly, as matrix suction progressively increases, the internal friction angle of the interface will gradually align with that of the silt.
Figure 16 shows that the difference in the cohesion and internal friction angle between S-I and the silt is very small when R is 0.11 mm. As R increases, the cohesion and internal friction angle of S-I increase. The shear strength of S-I was found to be greater than of the silt (Li M. et al., 2021). The reason is that the microscopic concave-convex structures between the contact surfaces come into more as R increases, increasing the contact area between the surfaces, the bite force, the friction force, and the internal friction angle. The cohesion increases due to the more capillary contacts of the soil with the interface. A rough interface produces higher cohesion and friction force during interface shearing, increasing the shear resistance and energy loss. In addition, the interface roughness affects the contact area of the interface, influencing the interface’s mechanical properties and stability (Gholampour and Johari, 2019).
4.3 Calculation model of the shear strength of the silt-concrete interface
The improved Mohr-Coulomb strength formula to effectively predict the shear strength of unsaturated soils, as Equation 3 (Yao et al., 2009):where τs is the shear strength of unsaturated soils, σn is the normal stress, ua is the pore air pressure on the failure surface during shear failure, and cg and ϕg are the cohesion and internal friction angle of the soil, which are functions of the water content, respectively.
Matrix suction is closely related to water content (Liu et al., 2009). And the matrix suction is affected by the interface friction angle and cohesion. The interface shear strength between the silt and the silt-structure interface can be expressed as Equation 4:where τf is the interface shear strength, c' (ua) and ϕ′ (ua) are the interface cohesion and interface friction angle, which are functions of the matric suction of unsaturated silt, respectively.
The results in Section 4.2 indicate a significant relationship between the strength index of silt and the shear strength index of the interface. This relationship can be expressed as Equations 5, 6 (Potyondy, 1961):where fc and fϕ are the influence parameters of the interface roughness on the cohesion and the internal friction angle, respectively.
c g and ϕg are calculated by the Equations 7, 8 (Ling and Yin, 2007):where c50 and ϕ50 are the cohesion and internal friction angle when Sr = 50%, respectively; Sr is the degree of saturation; kc and kϕ are parameters that express the effect of the change in soil water content on the cohesion and internal friction angle, respectively; w50 is the water content of the soil when Sr = 50%.
The interface roughness is normalized. Consider the effect of relative roughness of the interface. The influence parameters fc and fϕ can be expressed as Equations 9, 10:where R is the interface roughness, mm; D50 is the median particle diameter, which is 0.06 mm; Rn is the relative roughness of the interface, defined as the ratio of the interface roughness to the median particle size; b1 and b2 denote the influence parameters of the relative interface roughness on the interface cohesion and friction angle, respectively. R0c and R0ϕ represent the influence parameters on the interface cohesion and the friction angle, respectively, when the interface is smooth (R = 0 mm).
The fc and fϕ of different interface roughness values are fitted with the relative roughness of the interface. The results are shown in Figure 17.
FIGURE 17

Determination of influencing parameters. (a)Rn-fc. (b)Rn-fϕ.
Therefore, b1 = 0.05, b2 = 0.01, R0c = 1.34, and R0ϕ = 0.96. We can derive the following relationship (Equation 11):
The proposed model can accurately predict the interface shear strength for different interface roughness conditions.
However, this model has the following limitations and shortcomings: On one hand, it was developed based on ring shear tests conducted on the interface between alluvial silt and concrete in the Yellow River basin. The model parameters b1, b2, R0c, and R0ϕ may exhibit soil-type dependency. Therefore, when applying this model to silt or other soil types in different regions, particularly soils with high cohesion (>200 kPa), recalibration of these parameters is recommended. On the other hand, considering the reason that the test period is too long, only three kinds of interfacial roughness, 0.11, 0.37 and 0.54 mm, were selected. However, based on the analysis of the test results, we predict that there may be a critical value where the interface roughness increases while the effective shear strength parameter of the interface no longer increases. Therefore, the mechanism of the influence of interface roughness needs to be further investigated.
5 Conclusion
A suction-controlled silt-concrete interface ring shear test was carried out to study the influence of matric suction and interface roughness on the interface under different stress states. A mathematical model for calculating the interface shear strength was proposed. The main conclusions are as follows:
The shear strength was significantly higher for the unsaturated than the saturated interface. Increases in the NNS, matric suction (s), or interface roughness (R) improved the interface’s shear strength. A higher NNS had a larger effect of s or R on the interface strength. The NNS affected the interface shear strength more than s or R. Increasing NNS or R improved the interface’s strain-hardening properties, whereas increasing s had the opposite effect. As s increased, the interface shear shrinkage was weakened, and shear dilation was more likely. However, the shear shrinkage was enhanced with increases in NNS or R.
The interface residual shear strength (τr) had a nonlinear positive correlation with s or R. τr increased with the NNS. The contribution of s or R to τr was larger when the NNS was high. The effective cohesion of the interface (c0) increased significantly and nonlinearly as s or R increased. The effective shear strength index of the interface differed significantly between the unsaturated and saturated states. The effective internal friction angle (φ0) of the unsaturated interface was significantly larger than that of the saturated interface. When s was low, it contributed significantly to c0 and φ0, and the contribution to the former was much larger than to the latter. As R increased, φ0 only increased slightly.
As s increased, the difference in cohesion between the silt and the silt-concrete interface (S-I) was not significant, but the internal friction angle was significantly different. The interfacial cohesion depended on the soil and the interface type, whereas the internal friction angle depended on s. The internal friction angle of the saturated interface was smaller than that of the saturated silt, but the internal friction angle of the interface in the unsaturated state was larger than that of the silt. As R increased, the unsaturated interface cohesion increased. R may have affected the contact area and stress of the interface, influencing the mechanical properties and stability of the interface. The shear strength of S-I was higher than that of silt.
A relationship model of the shear strength of the silt and the silt-structure interface considering the influence of the interface roughness was established. The influencing parameters were determined by inverse fitting. The model accurately predicted the shear strength of the silt-concrete interface under different R conditions.
Statements
Data availability statement
The original contributions presented in the study are included in the article/supplementary material, further inquiries can be directed to the corresponding author.
Author contributions
CH: Supervision, Writing – review and editing. MM: Data curation, Investigation, Visualization, Writing – original draft. YL: Funding acquisition, Methodology, Writing – original draft, Writing – review and editing. XJ: Data curation, Writing – review and editing. LR: Data curation, Writing – original draft.
Funding
The authors declare that financial support was received for the research and/or publication of this article. The study was financially supported by the Cultivation Fund of Zhengzhou University in 2021 (JC21439018) and the Natural Science Foundation of Henan Province (222300420555).
Conflict of interest
Authors CH and LR were employed by Zhengzhou Metro Group Co., Ltd. Author XJ was employed by Shanghai Urban Construction Municipal Engineering (Group) Co., Ltd.
The remaining authors declare that the research was conducted in the absence of any commercial or financial relationships that could be construed as a potential conflict of interest.
Generative AI statement
The authors declare that no Generative AI was used in the creation of this manuscript.
Any alternative text (alt text) provided alongside figures in this article has been generated by Frontiers with the support of artificial intelligence and reasonable efforts have been made to ensure accuracy, including review by the authors wherever possible. If you identify any issues, please contact us.
Publisher’s note
All claims expressed in this article are solely those of the authors and do not necessarily represent those of their affiliated organizations, or those of the publisher, the editors and the reviewers. Any product that may be evaluated in this article, or claim that may be made by its manufacturer, is not guaranteed or endorsed by the publisher.
References
1
Bhat D. R. Bhandary N. P. Yatabe R. (2013). Residual-state creep behavior of typical clayey soils. Nat. Hazards69, 2161–2178. 10.1007/s11069-013-0799-3
2
Borana L. Yin J. H. Singh D. N. Shukla S. K. (2015). A modified suction controlled direct shear device for testing unsaturated soil and steel plate interface. Mar. Georesour. Geotechnol.33 (4), 289–298. 10.1080/1064119X.2013.843045
3
Borana L. Yin J. H. Singh D. N. Shukla S. K. (2016). Interface behavior from suction-controlled direct shear test on completely decomposed granitic soil and steel surfaces. Int. J. Geomechanics16 (6), D4016008. 10.1061/(ASCE)GM.1943-5622.0000658
4
Chen X. Zhang J. Xiao Y. Li J. (2015). Effect of roughness on shear behavior of red clay-concrete interface in large-scale direct shear tests. Can. Geotechnical J.52 (8), 1122–1135. 10.1139/cgj-2014-0399
5
Escario V. Sáez J. (1986). The shear strength of partly saturated soils. Géotechnique36 (3), 453–456. 10.1680/geot.1986.36.3.453
6
Fredlund D. G. Morgenstern N. R. Widger R. A. (1978). The shear strength of unsaturated soils. Can. Geotechnical J.15 (3), 313–321. 10.1139/t78-029
7
Gan J. K. M. Fredlund D. G. Rahardjo H. (1988). Determination of the shear strength parameters of an unsaturated soil using the direct shear test. Can. Geotechnical J.25 (3), 500–510. 10.1139/t88-055
8
Gholampour A. Johari A. (2019). Reliability-based analysis of braced excavation in unsaturated soils considering conditional spatial variability. Comput. Geotechnics115, 103163. 10.1016/j.compgeo.2019.103163
9
Hamid T. B. Miller G. A. (2008). A constitutive model for unsaturated soil interfaces. Intern. J. Numer. Analy. Meth. Geomecs.32 (13), 1693–1714. 10.1002/nag.692
10
Hamid T. B. Miller G. A. (2009). Shear strength of unsaturated soil interfaces. Can. Geotechnical J.46 (5), 595–606. 10.1139/T09-002
11
Hong Y. Sun T. Luan M. T. Zheng X. Y. Wang F. W. (2009). Development and application of geotechnical ring shear apparatus: an overview. Rock Soil Mech.30 (3), 628–634. 10.16285/j.rsm.2009.03.043
12
Hossain M. A. Yin J. H. (2012). Influence of grouting pressure on the behavior of an unsaturated soil-cement interface. J. Geotech. Geoenviron. Engin.138 (2), 193–202. 10.1061/(ASCE)GT.1943-5606.0000585
13
Hossain M. A. Yin J. H. (2014). Dilatancy and strength of an unsaturated soil-cement interface in direct shear tests. Int. J. Geomechanics15 (5), 04014081. 10.1061/(ASCE)GM.1943-5622.0000428
14
Hoyos L. R. Velosa C. L. Puppala A. J. (2014). Residual shear strength of unsaturated soils via suction-controlled ring shear testing. Eng. Geol.172, 1–11. 10.1016/j.enggeo.2014.01.001
15
Kim J. Athanasopoulos-Zekkos A. Cubrinovski M. (2023). Monotonic and cyclic simple shear response of well-graded sandy gravel soils from wellington, New Zealand. J. Geotechnical Geoenvironmental Eng.149 (7), 04023046. 10.1061/JGGEFK.GTENG-10619
16
Konkol J. Mikina K. (2021). Some aspects of shear behavior of soft soil–concrete interfaces and its consequences in pile shaft friction modeling. Materials14 (10), 2578. 10.3390/ma14102578
17
Kou H. L. Diao W. Z. Zhang W. C. Zheng J. B. Ni P. Jang B. A. et al (2021). Experimental study of interface shearing between calcareous sand and steel plate considering surface roughness and particle size. Appl. Ocean Res.107, 102490. 10.1016/j.apor.2020.102490
18
Li J. C. (2022a). Ring shear test of saturated silty soil-mud-concrete interface and research on the parameters of the boundary surface model. Zhengzhou University. [Master]. 10.27466/d.cnki.gzzdu.2022.003337
19
Li Y. H. Lv M. F. Guo Y. C. Huang M. S. (2021a). Effects of the soil water content and relative roughness on the shear strength of silt and steel plate interface. Measurement174, 109003. 10.1016/j.measurement.2021.109003
20
Li M. Li Y. Islam M. R. (2021b). Effects of water content and interface roughness on the shear strength of silt-cement mortar interface. Soils Found.61 (6), 1615–1629. 10.1016/j.sandf.2021.08.011
21
Li Y. Guo Z. Wang L. Ye Z. Shen C. Zhou W. (2021c). Interface shear behavior between MICP-treated calcareous sand and steel. J. Mater. Civ. Eng.33 (2), 04020455. 10.1061/(asce)mt.1943-5533.0003549
22
Li D. Y. Zhang Y. K. Gao Y. F. (2022b). Shear behavior of suction foundation-clay interface under different shear rates. J. Disaster Prev. Mitig. Eng.42 (01), 231–236. 10.13409/j.cnki.jdpme.201909017
23
Li D. Shi C. Ruan H. Li B. (2022c). Shear characteristics of soil—concrete structure interaction interfaces. Appl. Sci.12 (18), 9145. 10.3390/app12189145
24
Ling H. Yin Z. Z. (2007). Variation of unsaturated soil strength with water contents. Chin. J. Rock Mech. Eng.26, 1499–1503.
25
Liu X. W. Chang L. J. Hu X. R. (2009). Ling, C. Experimental research of matric suction with water content and dry density of unsaturated laterite. Rock Soil Mech.30 (11), 3302–3306. 10.16285/j.rsm.2009.11.036
26
Marinho F. A. M. do Amaral Vargas E. (2020). Effect of suction on the shear strength of soil-rock interfaces. Geotechnical Geol. Eng.38 (6), 6145–6155. 10.1007/s10706-020-01421-3
27
Mijic Z. Bray J. D. Riemer M. F. Rees S. D. Cubrinovski M. (2021). Cyclic and monotonic simple shear testing of native Christchurch silty soil. Soil Dyn. Earthq. Eng.148, 106834. 10.1016/j.soildyn.2021.106834
28
Naghadeh R. A. Toker N. K. (2019). Exponential equation for predicting shear strength envelope of unsaturated soils. Int. J. Geomechanics19 (7), 04019061. 10.1061/(ASCE)GM.1943-5622.0001435
29
Niu Y. Zhou X. P. Berto F. (2020). Evaluation of fracture mode classification in flawed red sandstone under uniaxial compression. Theor. Appl. Fract. Mech.107, 102528. 10.1016/j.tafmec.2020.102528
30
Patil U. D. Hoyos L. R. Puppala A. J. Congress S. S. C. (2020). Suction stress characteristic curves of cohesive-frictional soils from multiple suction-controlled testing methods. Int. J. Geomechanics20 (7), 04020077. 10.1061/(ASCE)GM.1943-5622.0001698
31
Peng F. Li X. Lv M. F. Li Y. H. Guo Y. C. (2022). A hierarchical single-surface model for an unsaturated soil-structure interface. KSCE J. Civ. Eng.26 (6), 2675–2684. 10.1007/s12205-022-1693-x
32
Potyondy J. G. (1961). Skin friction between various soils and construction materials. Géotechnique.11 (4), 339–353. 10.1680/geot.1961.11.4.339
33
Qu Y. L. Ni W. K. Niu F. J. Mu Y. H. Luo J. He H. (2021). Shear properties and mechanism of freeze-thaw interface in unsaturated coarse-grained soil from Qinghai-Tibet Plateau. Adv. Civ. Eng.2021, 6688724. 10.1155/2021/6688724
34
Ravera E. Laloui L. (2022). Failure mechanism of fine-grained soil-structure interface for energy piles. Soils Found.62, 101152. 10.1016/j.sandf.2022.101152
35
Rui S. J. Zhen G. Wang L. Z. Zhou W. J. Li Y. J. (2020). Experimental study on cyclic shear stiffness and damping ratio of carbonate sand-steel interface. Rock Soil Mech.41 (1), 78–86. 10.16285/j.rsm.2018.7129
36
Rui S. Wang L. Guo Z. Zhou W. Li Y. (2021). Cyclic behavior of interface shear between carbonate sand and steel. Acta Geotech.16, 189–209. 10.1007/s11440-020-01002-x
37
Shi S. Zhang F. Feng D. Xu X. (2020). Experimental investigation on shear characteristics of ice-frozen clay interface. Cold Regions Sci. Technol.176, 103090. 10.1016/j.coldregions.2020.103090
38
Wang L. Chou Y. (2023). Experimental study on direct shear mechanical behavior of unsaturated loess–steel interface considering freeze–thaw cycles. Indian Geotech. J.53, 523–537. 10.1007/s40098-022-00684-2
39
Yao P. F. Qi S. W. Zhang M. (2009). Simplified method for determining shear strength of unsaturated soils based on different paths. Rock Soil Mech.30 (9), 2605–2608. 10.16285/j.rsm.2009.09.034
40
Yin K. Vasilescu R. Fauchille A.-L. Kotronis P. (2020). Thermal effects on the mechanical behavior of Paris green clay-concrete interface. In E3S Web Conf., E3S Web Conf.; EDP Sciences: Les Ulis, France, 2020; p. 13006. 10.1051/e3sconf/202020513006
41
Yu P. Dong J. Liu H. Xu R. Wang R. Xu M. et al (2022). Analysis of cyclic shear stress-displacement mechanical properties of silt-steel interface in the Yellow River Delta. J. Mar. Sci. Eng.10 (11), 1704. 10.3390/jmse10111704
42
Zhang J. Z. Zhou X. P. (2020c). AE event rate characteristics of flawed granite: from damage stress to ultimate failure. Geophys. J. Int.222 (2), 795–814. 10.1093/gji/ggaa207
43
Zhang J. Z. Zhou X. P. (2022). Fracture process zone (FPZ) in quasi-brittle materials: review and new insights from flawed granite subjected to uniaxial stress. Eng. Fract. Mech.274, 108795. 10.1016/j.engfracmech.2022.108795
44
Zhang J. W. Mu Q. Y. Garg A. Liu F. L. Cao J. (2020a). Shear behavior of unsaturated intact and compacted loess: a comparison study. Environ. Earth Sci.79, 79. 10.1007/s12665-020-8820-0
45
Zhang Z. L. Cui Z. D. Zhao L. Z. (2020b). Shear strength of sand–clay interfaces through large-scale direct shear tests. Arabian J. Sci. Eng.45, 4343–4357. 10.1007/s13369-020-04459-w
46
Zhang P. Ding S. Fei K. (2021). Research on shear behavior of sand–structure interface based on monotonic and cyclic tests. Appl. Sci.11 (24), 11837. 10.3390/app112411837
47
Zhang J. Z. Zhou X. P. Du Y. H. (2023). Cracking behaviors and acoustic emission characteristics in brittle failure of flawed sandstone: a true triaxial experiment investigation. Rock Mech. Rock Eng.56, 167–182. 10.1007/s00603-022-03087-0
48
Zhao Z. F. Yu Y. H. Zhao G. F. (2000). Method for measuring the roughness of bonded surfaces between new and old concrete. Build. Struct.30 (1), 26–29. 10.19701/j.jzjg.2000.01.009
49
Zhou X. P. Cheng H. Feng Y. F. (2014). An experimental study of crack coalescence behaviour in rock-like materials containing multiple flaws under uniaxial compression. Rock Mech. Rock Eng.47, 1961–1986. 10.1007/s00603-013-0511-7
50
Zhou X. P. Zhang J. Z. Wong L. N. Y. (2018). Experimental study on the growth, coalescence and wrapping behaviors of 3D cross-embedded flaws under uniaxial compression. Rock Mech. Rock Eng.51, 1379–1400. 10.1007/s00603-018-1406-4
51
Zhou X. P. Wang Y. T. Zhang J. Z. Liu F. N. (2019a). Fracturing behavior study of three-flawed specimens by uniaxial compression and 3D digital image correlation: sensitivity to brittleness. Rock Mech. Rock Eng.52, 691–718. 10.1007/s00603-018-1600-4
52
Zhou X. P. Zhang J. Z. Qian Q. H. Niu Y. (2019b). Experimental investigation of progressive cracking processes in granite under uniaxial loading using digital imaging and AE techniques. J. Struct. Geol.126, 129–145. 10.1016/j.jsg.2019.06.003
Summary
Keywords
unsaturated silt, suction control, ring shear test, interface roughness, shear strength
Citation
Huang C, Ma M, Li Y, Jiang X and Ren L (2025) Suction-controlled ring shear test of the silt and concrete interface. Front. Earth Sci. 13:1716560. doi: 10.3389/feart.2025.1716560
Received
30 September 2025
Revised
03 November 2025
Accepted
03 November 2025
Published
27 November 2025
Volume
13 - 2025
Edited by
Xiaoping Zhou, Chongqing University, China
Reviewed by
Jing Bi, Guizhou University, China
Lunshi Zhou, Stanford University, United States
Updates
Copyright
© 2025 Huang, Ma, Li, Jiang and Ren.
This is an open-access article distributed under the terms of the Creative Commons Attribution License (CC BY). The use, distribution or reproduction in other forums is permitted, provided the original author(s) and the copyright owner(s) are credited and that the original publication in this journal is cited, in accordance with accepted academic practice. No use, distribution or reproduction is permitted which does not comply with these terms.
*Correspondence: Yonghui Li, liyonghuizzu@163.com
Disclaimer
All claims expressed in this article are solely those of the authors and do not necessarily represent those of their affiliated organizations, or those of the publisher, the editors and the reviewers. Any product that may be evaluated in this article or claim that may be made by its manufacturer is not guaranteed or endorsed by the publisher.