There was a mistake in Figures 1, 5, 6 as published. All coordinates in the figures have been removed. Figure 10 has also been updated to improve the clarity of the y-axis. The corrected figures appear below.
FIGURE 1

Geologic background of the research area.
FIGURE 5
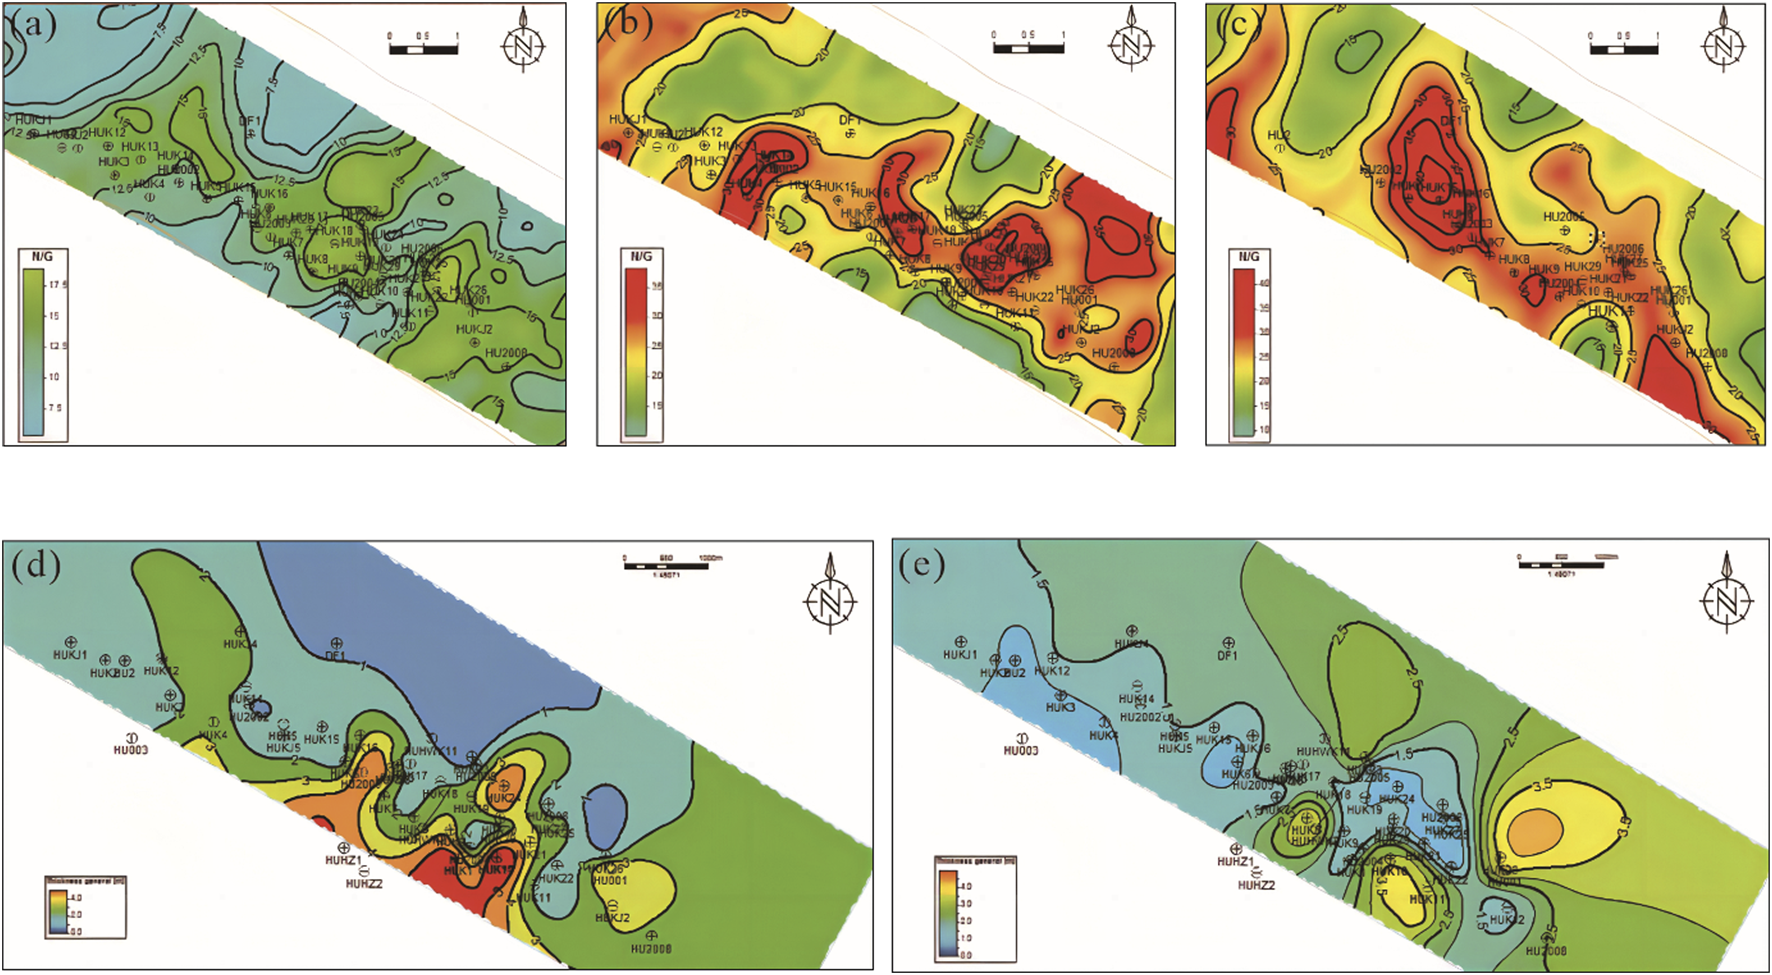
Distribution Characteristics of sandstone bodies and interlayer for the second member of the Paleogene Ziniquanzi Formation sandstone from the Hutubi gas storage: (a–c) The sandstone bodies distribution characteristics of E1-2z21-1, E1-2z21-2 and E1-2z22; (d,e) The interlayer distribution characteristics between E1-2z21 and E1-2z22, E1-2z21-1 and E1-2z21-2.
FIGURE 6

The Distribution Characteristics of porosity, permeability and formation factor of the second member of the Paleogene Ziniquanzi Formation sandstone from the Hutubi gas storage: (a–c) The porosity distribution characteristics of E1-2z21-1, E1-2z21-2 and E1-2z22; (d–f) The permeability distribution characteristics of E1-2z21-1, E1-2z21-2 and E1-2z22; (g–i) The formation factor distribution characteristics of E1-2z21-1, E1-2z21-2 and E1-2z22.
FIGURE 10

The water invasion characteristics of the second member of the Paleogene Ziniquanzi Formation sandstone from the Hutubi gas storage at the end of development and the seventh cycle of gas production: (a,b) The water invasion characteristics in the western area of E1-2z21 gas reservoir at the end of development and the seventh cycle of gas production; (c,d) The water invasion characteristics of the 7th layer in the western area of E1-2z21 gas reservoir at the end of development and the seventh cycle of gas production; (e,f) The water invasion characteristics of the 7th layer in the eastern area of E1-2z21 gas reservoir at the end of development and the seventh cycle of gas production; (g,h) The water invasion characteristics of the 12th layer of E1-2z22 gas reservoir at the end of development and the seventh cycle of gas production.
The original article has been updated.
Generative AI statement
Any alternative text (alt text) provided alongside figures in this article has been generated by Frontiers with the support of artificial intelligence and reasonable efforts have been made to ensure accuracy, including review by the authors wherever possible. If you identify any issues, please contact us.
Statements
Publisher’s note
All claims expressed in this article are solely those of the authors and do not necessarily represent those of their affiliated organizations, or those of the publisher, the editors and the reviewers. Any product that may be evaluated in this article, or claim that may be made by its manufacturer, is not guaranteed or endorsed by the publisher.
Summary
Keywords
underground gas storage, aquifer energy, water invasion patterns, geological modeling, numerical simulation
Citation
Liao W, Zhang S, Lv M, Zhao Y, Yan H, Shi G, Nooraiepour M, Ma L, Spasennykh M and Song Z (2025) Correction: The impact of multi-cycle water invasion on underground gas storages and its controlling factors. Front. Earth Sci. 13:1717287. doi: 10.3389/feart.2025.1717287
Received
01 October 2025
Accepted
13 October 2025
Published
03 November 2025
Volume
13 - 2025
Edited and reviewed by
Hu Li, Sichuan University of Science and Engineering, China
Updates
Copyright
© 2025 Liao, Zhang, Lv, Zhao, Yan, Shi, Nooraiepour, Ma, Spasennykh and Song.
This is an open-access article distributed under the terms of the Creative Commons Attribution License (CC BY). The use, distribution or reproduction in other forums is permitted, provided the original author(s) and the copyright owner(s) are credited and that the original publication in this journal is cited, in accordance with accepted academic practice. No use, distribution or reproduction is permitted which does not comply with these terms.
*Correspondence: Mingyang Lv, 2024310054@student.cup.edu.cn; Zezhang Song, songzz@cup.edu.cn
Disclaimer
All claims expressed in this article are solely those of the authors and do not necessarily represent those of their affiliated organizations, or those of the publisher, the editors and the reviewers. Any product that may be evaluated in this article or claim that may be made by its manufacturer is not guaranteed or endorsed by the publisher.