 Zhongwei Li1,2
 Xiang Li3*
- 1CCTEG Coal Mining Research Institute, Beijing, China
- 2Coal Mining and Designing Department, Tiandi Science and Technology Co., Ltd., Beijing, China
- 3School of Civil Engineering and Architecture, Wuhan University of Technology, Wuhan, China
Background: With increasing coal mining depth, underground geological conditions grow more complex. Surrounding rock stability control has become a critical bottleneck for safe coal mining. Thus, there is an urgent need to develop more reliable support theories for optimizing engineering support parameters.
Methods: Based on the surrounding rock strength enhancement theory, this study constructs a coupling support model integrating pre-tightening force reinforcement and composite arch support principles. Through single-factor variable analysis, we investigate the influence of bolt support parameters on anchorage body strength.
Results: Bolt length correlates positively with anchorage body support strength, enabling effective reinforcement through adjusting the thickness of the composite arch. Bolt spacing correlates negatively with support strength. Excessive spacing hinders effective superposition of conical compressive stress zones from individual bolts, impeding continuous composite arch structures formation. Pre-tightening force consistently enhances surrounding rock mechanical properties, steadily increasing anchorage body support strength.
Conclusion: Comparative calculations on actual coal mine roadway bolt support designs verify the effectiveness of this coupling support model.
1 Introduction
As China’s mineral resource extraction extends beyond 1,000 m, underground construction projects face growing complex conditions defined by “high ground stress, strong unloading, large deformation and dynamic disturbance” (Xie, 2017; Chu et al., 2023; He et al., 2024). Under these complex geological conditions, surrounding rock is prone to fissure propagation and plastic flow, and severe cases may even cause collapse accidents (Zhao et al., 2022; Hou et al., 2022). As a core active support technology, bolt-supported rockfill is fundamentally distinct from traditional support methods. Internationally, Panek (1952) pioneered the suspension theory, illustrating how bolts can suspend weak rock layers above stable overburden to provide support. However, conventional support methods (e.g., U-shaped steel frames) rely on passive resistance induced by surrounding rock deformation, often exhibiting structural inefficiency and low working resistance. Such systems are prone to yielding and fracturing under high stress, and cannot effectively control early-stage crack propagation in high-stress environments (Zhou et al., 2023; Xie et al., 2025). In contrast, the international scientific community has widely acknowledged the advantages of bolts in actively applying prestress to reinforce rock masses. The maximum horizontal stress theory, proposed by Australian scholars Gale (1991), further establishes that bolts can effectively constrain axial expansion and shear displacement in rock layers—laying a theoretical foundation for high-strength bolt systems. Despite the widespread acceptance of active support principles, challenges remain in soft fractured rock environments, such as bolt loosening and shotcrete cracking. These issues ultimately result in support failure, loss of rock mass control, and impaired load-bearing capacity—making it difficult to meet the requirements for deformation control and long-term stability. This underscores the need for theoretical innovation and technological breakthroughs grounded in active support concepts.
To address roadway support shortcomings, pre-tightening support technology has been developed. Pre-tightening support technologies—including pre-tightening force rock bolts and high pre-tightening bolt cables—enhance surrounding rock by active initial tension. This tension pre-compresses surrounding rock fissures, suppresses plastic zone development in surrounding rock, and significantly improves its self-supporting capacity (Kang, 2021; Chen et al., 2021; Ranjbarnia et al., 2022; Wu et al., 2024; Wang et al., 2024). However, standalone pre-tightening support tends to develop “stress blind zones” due to uneven pre-tightening force distribution—e.g., excessive bolt spacing. This makes forming an overall load-bearing structure in surrounding rock difficult and still risks local instability in large-span roadways (Wei and Li, 2013; Ranjbarnia et al., 2016). Thus, the composite arch theory has also gained widespread attention and use in support design. The composite arch theory was first proposed by Lang (1961) and validated by two-dimensional photoelastic experiments. The theory posits that rock bolts form conical compression zones at their ends in surrounding rock, and the overlap of adjacent bolt compression zones construct a load-bearing composite arch, which serves as an important reference for practical applications. The composite arch bears radial loads from upper fractured rocks, placing surrounding rock in a triaxial stress state and effectively improving its stability and support capacity. However, most existing composite arch designs overlook the “active regulatory effect” of prestress. Insufficient prestress renders composite arches prone to cracking induced by surrounding rock deformation. Tao et al. (2024) demonstrated via monitoring that moderate prestress significantly reduces rock displacement, whereas inadequate prestress leads to rapid rock deformation and elevates the risk of arch crown cracking. Excessive prestress may induce stress concentration within arch structures. Bednarek et al. (2024) demonstrated via experiments and numerical simulations on prestressed fully grouted bolts that excessive pre-tightening force can form a compression beam at the arch crown, potentially resulting in localized stress concentration and structural failure. A systematic coupling design between pre-tightening force reinforcement and composite arch support is lacking.
Regarding the current status and limitations of research on surrounding rock pre-tightening force reinforcement and composite arch support, many scholars have conducted relevant investigations (Yang et al., 2020; Lei et al., 2024). As a core branch of active support systems, the surrounding rock pre-tightening force reinforcement theory has driven extensive scholarly research on pre-tightening force transmission mechanisms, bolt structure optimization, and long-term stability assessment. Zhang et al. (2024) proposed a surrounding rock reinforcement mechanical model accounting for pre-tightening force effects, based on the stress superposition principle, and investigated how rock bolt parameters influence surrounding rock reinforcement. Zhao et al. (2024) proposed a thick bolting and high pre-tightening force roof support reinforcement technology, which reduced surrounding rock deformation by 40%–50% and increased the speed of roadway excavation by 33%. Meanwhile, applying the composite arch support theory has significantly improved the load-bearing capacity and anti-deformation performance of support systems. Yang et al. (2020) proposed rock bolt length selection rules based on the composite arch support theory through experiments and numerical simulations. Wang et al. (2024) proposed the model of bolt anchorage and anchorage effect angle, established the calculation model of bolt anchorage, and calculated the optimal anchorage parameters. Oliveira et al. (2016) discussed the arching effect of prestressed bolts in layered rock masses and proposed an equivalent rock beam model.
In summary, while research on rock mass pre-tightening force reinforcement and composite arch support has made significant progress, several limitations persist. At the model level, existing support models mainly treat pre-tightening force and composite arches as “decoupled” components, failing to quantify their coupled interactions (e.g., how pre-tightening force magnitude influences composite arch radius and stiffness). In practical applications, engineering parameter design remains overly dependent on empirical methods, lacking optimization approaches for pre-tightening force-composite arch parameters (e.g., bolt spacing, pre-tightening force value) based on coupling models.
To address these challenges, this study aims to clarify the coupling mechanism between rock mass pre-tightening force reinforcement and composite arch support, analyze pre-tightening force influence during composite arch formation in depth, and explore how pre-tightening force reduces plastic zones and enhances bearing stiffness. This study establishes a coupling support model to quantify their synergistic effects and derives quantitative relationships between composite arch bearing capacity, pre-tightening force magnitude, and bolt parameters by parametric analysis. Using deep mine roadway engineering cases, this study optimizes support parameters by the coupling model to verify its engineering applicability, providing a theoretical basis for optimizing support parameters in underground projects with complex geological conditions.
2 Theoretical analysis of the coupling support model
Figure 1 is a schematic of rock bolt support in a coal mine roadway, where D denotes the spacing of bolts and w represents the span of the composite arch. In the rock bolt reinforcement zone, surrounding rock undergoes compressive deformation under rock bolt action. For a group rock bolt arrangement, compressive zones formed by individual rock bolts overlap to form a continuous compressive zone, termed the “composite arch”. The confining pressure increment caused by pre-tightening force is introduced into the strength strengthening model of surrounding rock, and the mechanical parameters of surrounding rock after anchorage body strengthening can be obtained. This section performs a mechanical stability analysis of the composite arch structure, derives its stability calculation formula, and accounts for the effect of confining pressure increment caused by pre-tightening force on the strength reinforcement of anchorage body.
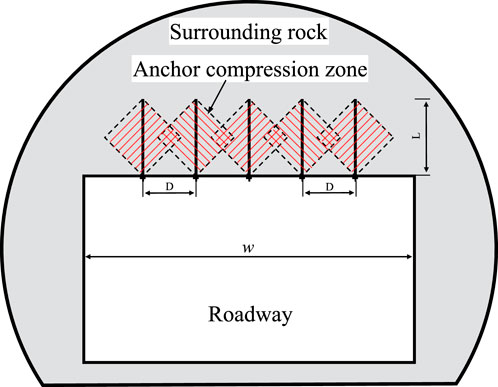
Figure 1. Roadway bolt support.
After roadway excavation, bolt support is applied. When bolt arrangement density in the loose, fractured rock layer meets a certain requirement, conical compressive stress zones from individual bolts overlap to create a uniform, continuous compression zone in the rock mass. This compression zone can provide a support effect similar to that of a compressive arch. Conical reinforcement zones from individual bolts are spaced at certain intervals. The resulting continuous compression zone constitutes a composite arch (as shown in Figure 2).
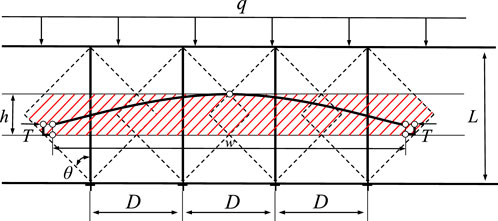
Figure 2. A stress analysis model for three hinged arches.
From the geometric relationship in Figure 2, the relationship between the thickness of the composite arch and the bolt length and spacing is shown in Equation 1:
where: h is the composite arch thickness, L is the bolt length, D is the bolt spacing, θ is the reinforcement angle (approximately 30° in loose rock, reaching 48°–66° in coal, but the commonly accepted reinforcement angle for bolts in surrounding rock is 45° (Hobst and Zajic, 1977; Foote, 1964)).
The load-bearing arch forms by mutual compression of the bolted structure in broken rock mass, relying on bolt-provided bolting constraint reactions. Its tensile strength is relatively low. Under overburden load, tensile cracks first form in the upper regions at both arch ends due to tensile stress. Rotation of the composite arch causes the upper middle part to bear higher horizontal compressive stress, while the lower part is in tension, this ultimately forms a balanced three-hinged arch structure between anchorage body. The following analyzes the arching conditions of the three-hinged arch and the post-formation arch strength.
If friction provided by the composite arch at the support resists shear force, the structure remains stable, otherwise, shear slip instability occurs. Based on the Mohr-Coulomb strength criterion, the arch deflection condition for a three-hinged arch is ultimately derived as shown in Equation 2:
where: q is the actual roof load, qcr is the critical load for roof failure under composite arch shear, c is the cohesion, w is the span of the composite arch, h is the thickness of the composite arch, φ is the friction angle of the surrounding rock.
According to the strength calculation Equation 3 for reinforced arch proposed by Chunlin (2006):
where: σmax represents the maximum uniaxial compressive strength of the reinforced anchorage rock mass. k is the coefficient related to the reinforced arch force arm, typically taken as 1.5, σc is the uniaxial compressive strength of the anchorage rock mass.
Substituting Equation 1 into the above Equation 3 gives the strength calculation Equation 4 for the composite arch as:
To systematically evaluate the reinforcement mechanism of bolt bar support, numerous scholars have investigated changes in the mechanical parameters of the anchorage body before and after reinforcement. For surrounding rock strength enhancement, early studies focused on shallow, non-mining-influenced hydraulic, roadway, and slope engineering, and identified the reinforcing effect of bolt bars on rock cohesion, internal friction angle, and pre-peak elastic modulus. A systematic analytical framework for this field was not established until Hou and Gou. (2000) proposed the surrounding rock strength reinforcement theory for deep coal mine roadways. Subsequently, further studies examined the reinforcing effect of anchorage body parameters, with relatively consistent conclusions: bolt bar support significantly increases rock mass cohesion but has a negligible effect on internal friction angle (Wei and Gou, 2012).
However, the aforementioned studies focus primarily on the additional cohesion provided by bolt bars themselves—they simply superimpose the cohesion between bolt bars and surrounding rock physically, without fully accounting for the key role of pre-tightening force in surrounding rock reinforcement. A study shows that the primary manifestation of increased surrounding rock strength post-bolt bar installation is that internal friction angle remains essentially unchanged, whereas cohesion is significantly enhanced. This enhanced cohesion arises from two mechanisms: (1) bolt bar materials typically have higher inherent cohesion than surrounding rock, leading the anchorage body’s overall cohesion to appear as the area-weighted average of the two, (2) pre-tightening force induces additional stress in surrounding rock, enhancing its shear resistance—this contribution can be equivalently expressed as increased cohesion (Kang et al., 2007). Chen et al. introduced a pre-tightening force factor based on existing surrounding rock strength reinforcement theory, further refining the anchorage body’s strength theory Equation 5 that accounts for pre-tightening force effects (Cheng et al., 2025).
where: cb is the cohesion of the bolt, cr is the cohesion of the surrounding rock, n is the density of bolt arrangement, S is the cross-sectional area of the bolt, P is the pre-tightening force.
In Equation 5, the cohesion reinforcement considers the cohesion of the bolt itself and the additional stress generated by the bolt, but compared to the actual reinforcement effect of bolt support in the field, the reinforcement effect is relatively weak. To improve the bolt reinforcement mechanism and make it more consistent with the actual engineering conditions in the field, this paper, based on previous research, considers the confining pressure effect of bolt pre-tightening force on the surrounding rock mass.
Pretensioned bolts apply confining pressure to surrounding rock, converting its uniaxial and biaxial stress states to biaxial and triaxial states, and thus enhancing surrounding rock stability. As shown in Figure 3, when the confining pressure is 0 MPa, the residual strength approaches 0 MPa. When the confining pressure is 1 MPa, the residual strength is approximately 10 MPa. With increasing confining pressure, rock strain softening degree decreases and residual strength increases gradually (Lu et al., 1998). Notably, residual strength is highly sensitive to confining pressure when it ranges from 0 to 1 MPa: a slight increase in confining pressure induces a rapid rise in residual strength. Under low confining pressure, residual strength is highly sensitive to it due to the relatively rough rock failure surface. For fractured rocks under sustained loading, their deformation mainly occurs in two modes: sliding along fracture planes and breaking through protrusions on fracture surfaces. At 0 confining pressure, rock deformation is entirely sliding along fracture planes. As confining pressure increases gradually from 0, deformation mode shifts from sliding to breaking through protrusions on fracture planes, and residual strength rises rapidly. This characteristic of fractured rocks under post-peak confining pressure is highly important for roadway support system research.
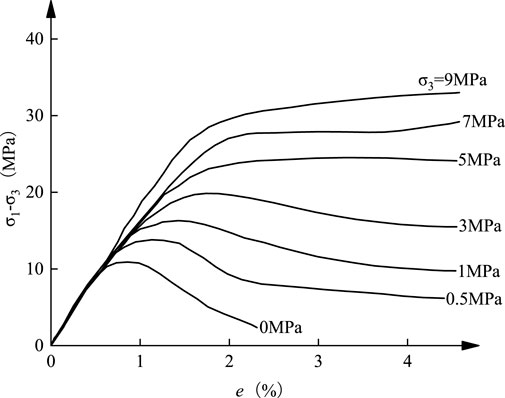
Figure 3. Relationship between residual strength and confining pressure (Lu et al., 1998).
For rock bolt support with surface protection components (e.g., steel mesh, steel strips), radial pre-tightening force can be uniformly distributed over the unit area of rock mass in the bolting zone. Under 2D analysis, the confining pressure increment for the unit area of bolted rock mass is P/D (for 3D analysis, this value is P/D2). In this study, the enhancement of rock mass strength is converted into an increase in cohesion c. The study considers that the pre-tightening force increases the confining pressure, thereby improving the overall stability of the surrounding rock. A pre-tightening force reinforcement coefficient a is added to the pre-tightening force component in Equation 5, yielding Equation 6. The confining pressure increment induced by pre-tightening force typically falls within the low-range interval of 0.1–0.5 MPa. As shown in Figure 3, this corresponds to an increase in residual strength of 1.2–4.0 MPa. The preliminary determined range of coefficient a is 8–12.
where: a is the pre-tightening force reinforcement coefficient.
Assuming that the failure of the anchorage body follows the criterion, the uniaxial compressive strength of the anchorage body is given by Equation 7:
Substituting Equation 6 into Equation 7, the uniaxial compressive strength of the reinforced anchorage body is obtained as Equation 8:
Substituting Equations 1 and 6 into Equation 2, the composite arch condition is obtained as Equation 9:
Substituting Equation 8 into Equation 4, the ultimate bearing strength of the composite arch is obtained as Equation 10:
Through trial calculations based on the actual conditions of numerous coal mine roadways (e.g., Guotun Coal Mine, Lilou Coal Mine, and Tangkou Coal Mine), the pre-tightening force reinforcement coefficient a was finally determined to be 10. At this value, the actual design value of roadway bolt spacing is closest to the trial calculation value, as presented in Table 1.
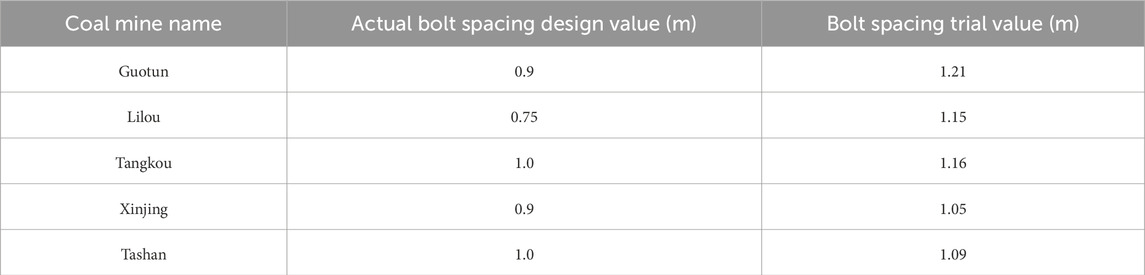
Table 1. Actual design value and trial value of bolt spacing in different coal mine roadway.
3 Parameter analysis of the coupling support model
In studies on the pre-tightening force rock reinforcement and coupling arch support model, the regulation of support strength is affected by the combined action of multiple parameters, and different parameters have distinctly different effects on the mechanical properties of the anchorage body. To clarify the influence degree of each parameter on anchorage body strength and its intrinsic action mechanism, this study uses a single-factor variable analysis method. It focuses on exploring the quantitative correlation and variation law between the three key parameters of pre-tightening force, bolt spacing and bolt length and the strength of anchorage body. Table 2 shows the basic values of each variable. When using these values, the support strength is 2.79 × 10⁵ Pa, where σs represents the yield strength of the bolt and d denotes its diameter. The value range of the basic parameters of bolt support is based on Technical Specifications for Rock Bolting in Coal Mine Roadways. The row spacing between bolts is 0.6 ∼ 1.5 m, the length of bolt is 1.6 ∼ 3.0 m, and the pre-tightening force of bolt is 30% ∼ 60% of the yield force of bolt.

Table 2. Basic values for bolt support design.
The numerical simulation in this study adopted two tunnel cross-sectional configurations: rectangular and semi-circular arch. The semi-circular arch tunnel has a wall height of 2 m and an arch height of 3.15 m, whereas the rectangular tunnel has dimensions (length × width) of 5.2 m × 4 m, as presented in Figure 4. The tunnel model was built in FLAC3D using solid modeling techniques and the Mohr-Coulomb material model, with dimensions of 60 m (length) × 10 m (width) × 60 m (height). Cable bolts were modeled using cable elements. To clearly illustrate the support effect of prestressed bolts, no in-situ rock stress was applied to the surrounding rock during the simulation.
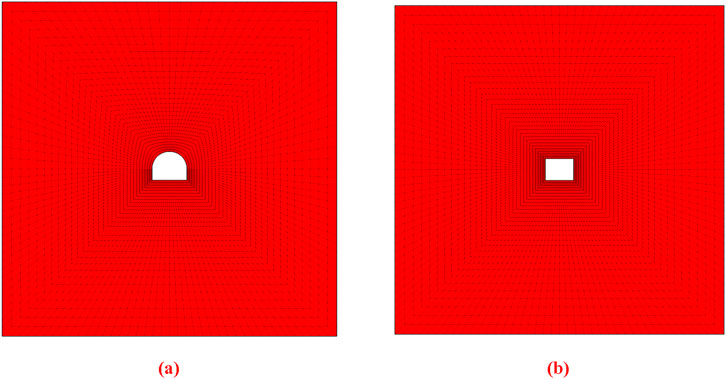
Figure 4. Tunnel numerical model. (a) Semi-circular arch roadway; (b) rectangular roadway.
Figure 5 presents the curve of anchorage body support strength versus bolt spacing. As shown in Figure 5, anchorage body support strength decreases gradually with increasing bolt spacing. Specifically, increasing bolt spacing from 0.5 m to 1.5 m reduces anchorage body support strength from 7.91 × 10⁵ Pa to 9.37 × 10⁴ Pa. This confirms that bolt spacing has a significant impact on anchorage body support strength. Figures 6, 7 present the additional stress field distribution under a 50 kN preload at bolt spacings of 0.6 m, 0.8 m, 1.0 m, and 1.5 m. As presented in the figures, with increasing bolt spacing, the variation law of the prestress field remains consistent for both rectangular and semi-circular arch roadways. The compressive stress is the highest at the beginning of the bol, followed by the middle of the bolt’s free section; the bolt end exhibits a state of near-zero stress and slight tensile stress. Excessively large bolt spacing results in independent conical compressive stress zones for each bolt, which fail to form an effective composite arch structure. With decreasing bolt spacing, the conical compressive stress zones of each bolt gradually approach, overlap, and merge into a complete, effective composite arch. When the number of bolts reaches a certain threshold, further increasing support density has a negligible effect on expanding the effective compressive stress zone or enhancing the diffusion of bolt pre-tightening force.
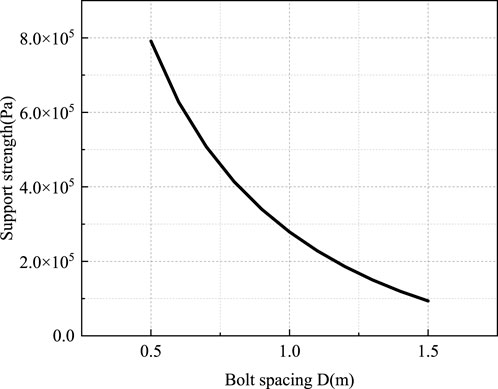
Figure 5. Relationship between the support strength of the anchorage body and the bolt spacing.
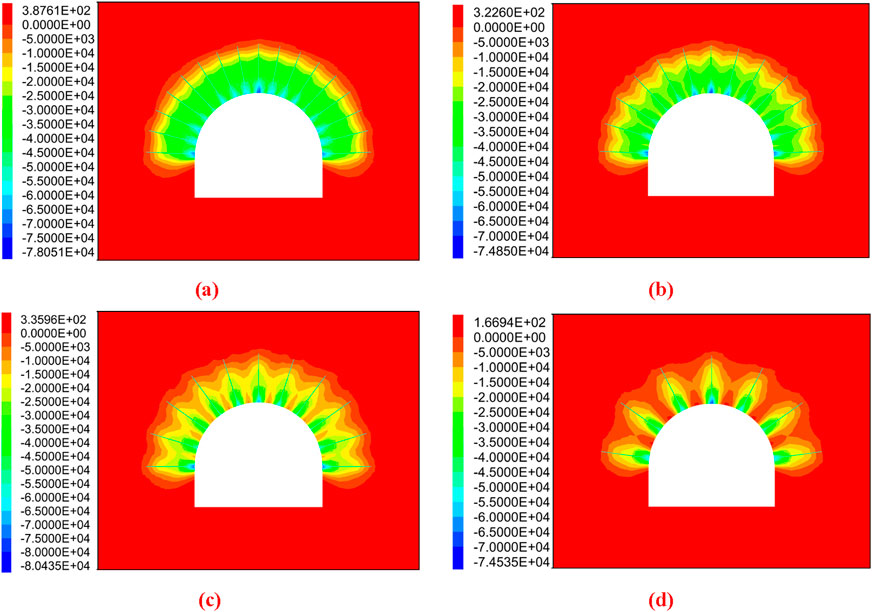
Figure 6. Effect of different bolt spacings on prestress field distribution in semi-circular roadway. (a) Bolt spacing 0.6 m; (b) Bolt spacing 0.8 m; (c) Bolt spacing 1.0 m; (d) Bolt spacing 1.5 m.
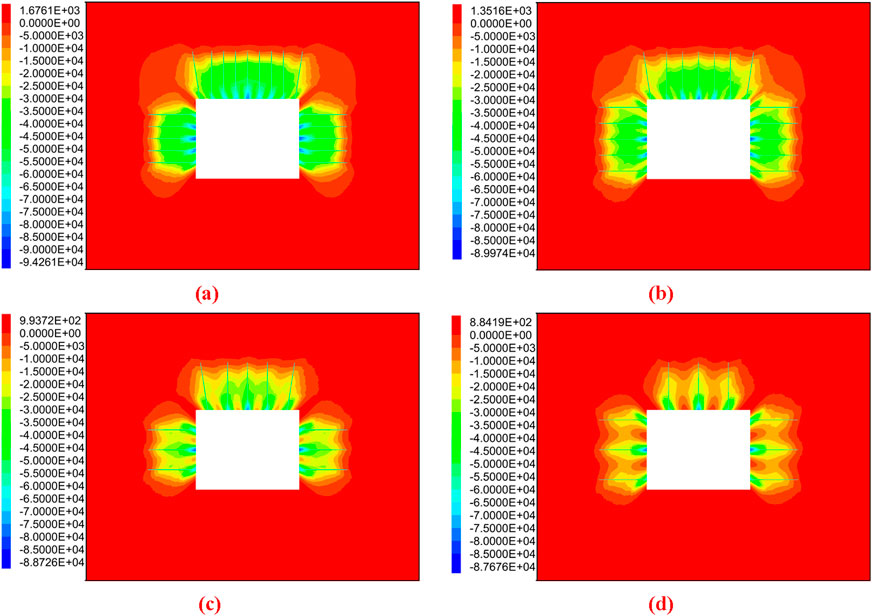
Figure 7. Effect of different bolt spacings on prestress field distribution in rectangular roadway. (a) Bolt spacing 0.6 m; (b) Bolt spacing 0.8 m; (c) Bolt spacing 1.0 m; (d) Bolt spacing 1.5 m.
Figure 8 presents the curve of anchorage body support strength versus bolt length. As shown in Figure 8, anchorage body support strength increases gradually with increasing bolt length. Specifically, increasing bolt length from 1.5 m to 3.0 m raises anchorage body support strength from 3.56 × 10⁴ Pa to 5.67 × 10⁵ Pa. Figures 9, 10 present the additional stress field distribution under a 50 kN preload for bolts with lengths of 1.6 m, 2.0 m, 2.4 m, and 3.0 m. As shown in the figure, increasing bolt length increases the range and thickness of the effective compressive stress zone and expands the bolt’s action range. However, compressive stress decreases in the upper-middle section of the bolt and in the surrounding rock between two bolts. Compared with rectangular roadway cross-sections, the prestress field in semi-circular arch roadway cross-sections exhibits more pronounced variations with changes in bolt length. This is because bolts in semi-circular arch roadways are arranged in a fan-shaped pattern. As bolts lengthen, the vertical distance between them increases accordingly—weakening the superposition effect of compressive stress and leading to a more significant decrease in compressive stress magnitude. Under a fixed pre-tightening force, longer bolts result in less obvious pretension effects and poorer active support performance. Thus, longer bolts require a higher applied pre-tightening force. Conversely, increasing pre-tightening force allows for appropriate reduction in bolt length.
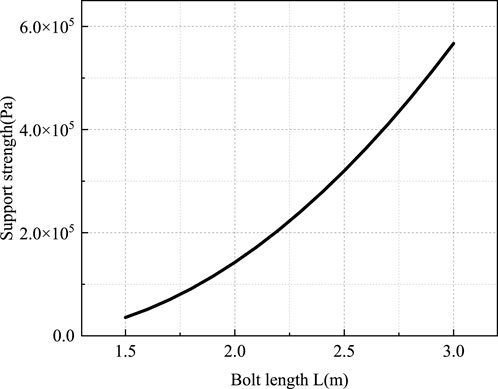
Figure 8. Relationship between bolt body support strength and bolt length.
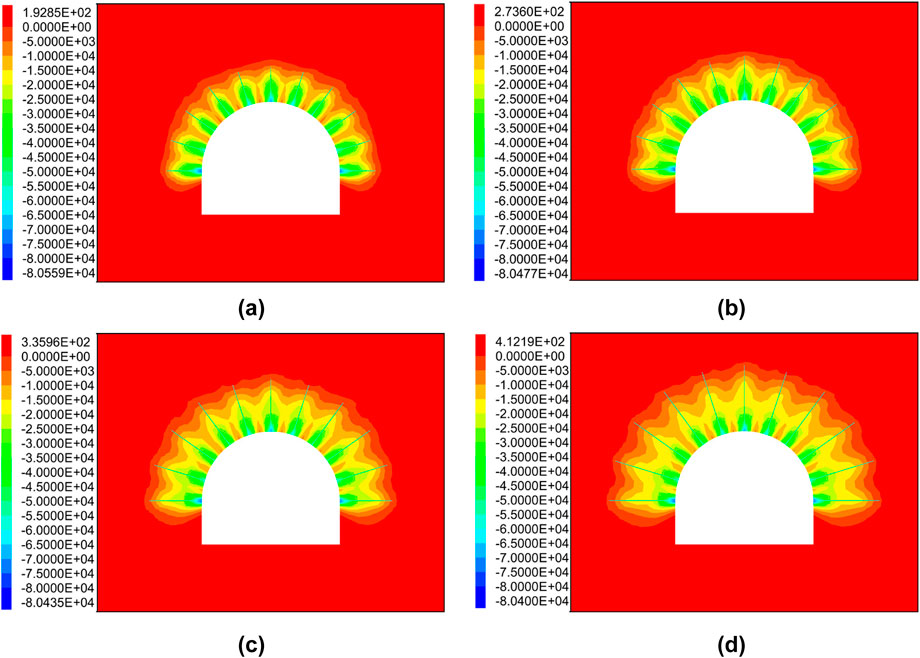
Figure 9. Effect of different bolt lengths on prestress field distribution in semi-circular roadway. (a) Bolt length 1.6 m; (b) Bolt length 2.0 m; (c) Bolt length 2.4 m; (d) Bolt length 3.0 m.
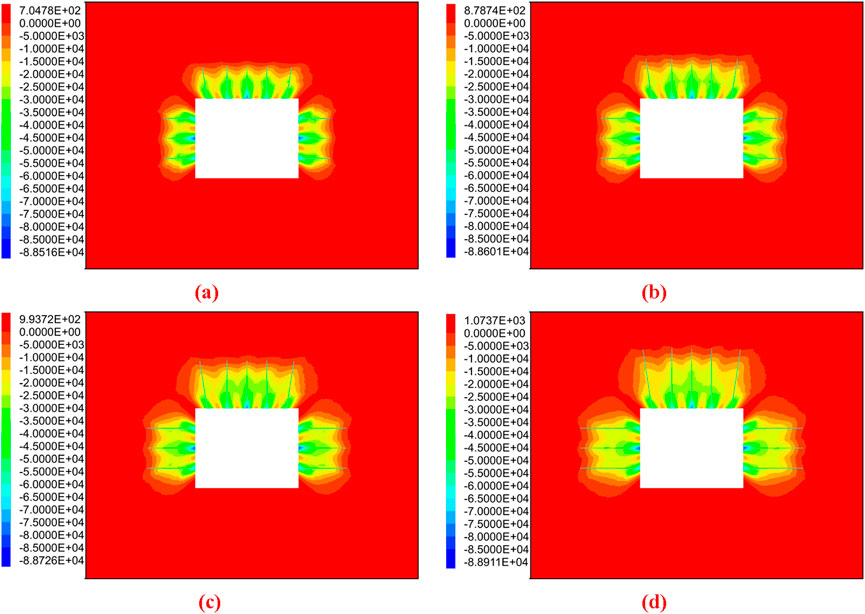
Figure 10. Effect of different bolt lengths on prestress field distribution in rectangular roadway. (a) Bolt length 1.6 m; (b) Bolt length 2.0 m; (c) Bolt length 2.4 m; (d) Bolt length 3.0 m.
Figure 11 presents the curve of anchorage body support strength versus bolt pre-tightening force. As shown in Figure 11, anchorage body support strength increases monotonically with increasing bolt pre-tightening force. Specifically, increasing the bolt pre-tightening force from 0 kN to 150 kN increases the support strength of the anchorage body from 1.48 × 10⁵ Pa to 5.40 × 10⁵ Pa. To visually compare changes in prestress distribution, preload forces of 20 kN, 50 kN, 100 kN, and 150 kN were applied to bolts with a spacing of 1.0 m, length of 2.4 m, and diameter of 22 mm. The resulting ranges and values of the prestress field under different preload conditions are presented in Figures 12, 13. The figures demonstrate that preload is the decisive parameter of the anchor support system, and stress values in the prestress field increase significantly with increasing preload. After preload application, a pronounced compressive stress concentration occurs at the bolt’s initial section; this concentration gradually diffuses and diminishes toward the surrounding rock, leading to a distinct layered prestress distribution in the rock mass. Further analysis of prestress distribution under different preload conditions shows that as preload increases, both the compressive stress range and the effective compressive stress zone expand. This indicates that increasing the bolt preload can fully leverage the active support function of the bolts.
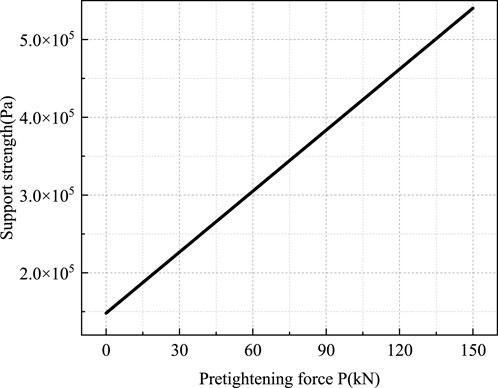
Figure 11. Relationship between support strength of anchorage body and pre-tightening force.
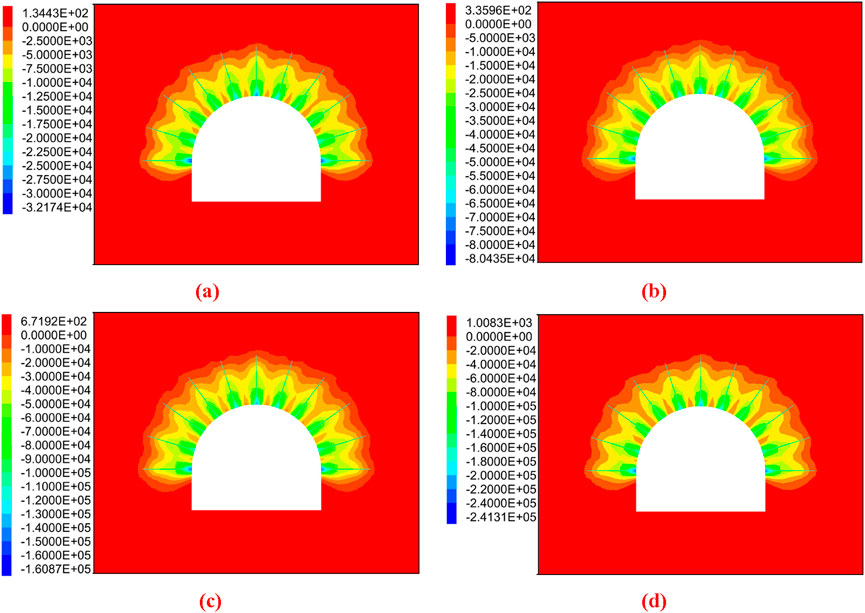
Figure 12. Effect of different bolt pre-tightening force on prestress field distribution in semi-circular roadway. (a) Pre-tightening force 20 kN; (b) Pre-tightening force 50 kN; (c) Pre-tightening force 100 kN; (d) Pre-tightening force 150 kN.
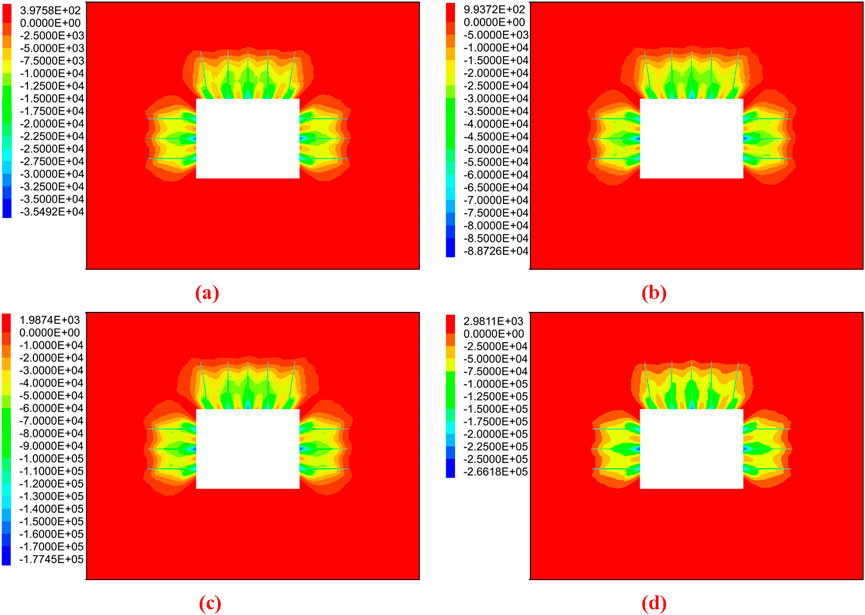
Figure 13. Effect of different bolt pre-tightening force on prestress field distribution in rectangular roadway. (a) Pre-tightening force 20 kN; (b) Pre-tightening force 50 kN; (c) Pre-tightening force 100 kN; (d) Pre-tightening force 150 kN.
The pre-tightening force of bolt and its diffusion play a decisive role in roadway support. Determining a reasonable pre-tightening force based on roadway conditions and ensuring effective pre-tightening force diffusion are key to support design. The effective range of pre-tightening force for a single bolt is very limited and must be diffused to surrounding rock far from the bolt by components (e.g., pallets, steel strips and metal mesh). Notably, even a small support force on the roadway surface can significantly suppress surrounding rock deformation and failure, while preserving roof integrity. Surface protection components play a critical role in the pre-tightening force support system.
Figure 14 presents the bolt spacing variation curve under different pre-tightening force for the coupling support model in this study and Cheng’s model (Cheng et al., 2025). As shown in Figure 14, increasing bolt pre-tightening force allows an increase in bolt spacing, while reducing bolt support density. Specifically, the model in this study exhibits a significant growth rate: bolt spacing increases from 1.24 m at P = 0 kN to 1.36 m at P = 100 kN, showing a clear linear trend. In contrast, Cheng’s model shows a smaller growth rate: bolt spacing increases from 1.24 m at P = 0 kN to 1.26 m at P = 100 kN, exhibiting a gentle trend. Cheng et al. (2025) argue that pre-tightening force has a weak effect on bolt spacing, and bolt spacing is insensitive to pre-tightening force changes. In contrast, the model in this study suggests that pre-tightening force has a significant, linearly correlated effect on bolt spacing: increasing pre-tightening force significantly increases the reasonable bolt spacing. Practical engineering cases confirm that pre-tightening force is a key control factor for bolt support. Increasing pre-tightening force expands the bolt’s active constraint range on surrounding rock. To ensure support effectiveness, bolt spacing must be adjusted accordingly to match the pre-tightening force influence range. The significant linear increase in bolt spacing with pre-tightening force in this study’s model is more consistent with the engineering design logic: “the higher the pre-tightening force, the larger the reasonable bolt spacing can be, thereby optimizing support density.”
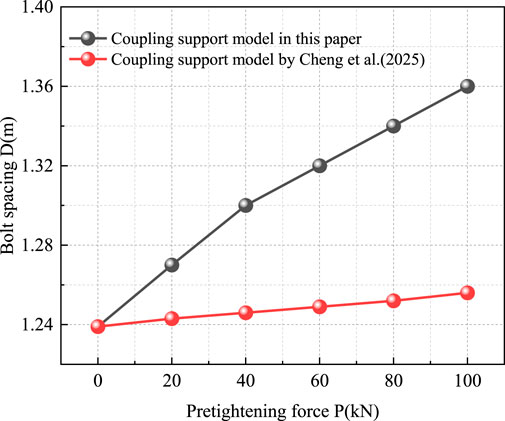
Figure 14. Relationship between bolt spacing and pre-tightening force.
4 Application in engineering projects
4.1 Project overview
The main auxiliary transport roadway of Xingjulong Coal Mine (Shandong, China) has a span of 6,330 mm. Surface elevation ranges from +42.38 m to +43.65 m, and roadway elevation ranges from −966.9 m to −938.9 m. The length of the mine roadway is 2,606.5 m, which meets the requirements of auxiliary transportation and ventilation for mine production. Its service life is 60 years, as shown in Figure 15. The lithologic characters in the roadway excavation area are mainly fine sandstone and siltstone, with most layers relatively small. In the roadway excavation area, the southern and northern permeable zones are coal seam composite zones. Within these zones, the 3rd coal seam has a thickness of 5.63–9.26 m, with 0–2 interlayers in its middle-lower section (mostly mudstone and carbonaceous mudstone). The central section is a layered zone, where the 3 (3 Upper) coal seam has a thickness of ∼1.47–2.52 m. The 3 Lower coal seam has a thickness of ∼2.26–5.21 m. The interlayers have an average thickness of 2 m and are composed of mudstone. The 3rd coal seam in this area is stable but has a complex structure.
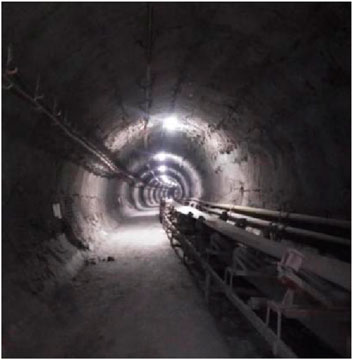
Figure 15. Coal mine auxiliary transport main roadway.
Roof and roadway side bolts are fine-threaded steel resin bolts (Model: MSGLD(X)-600/Φ22 × 2,400 mm) with an inter-row spacing of 1,000 × 1,000 mm. The bolts require a pre-tightening torque of 400–550 N·m. Roof cables are pre-tightening force steel wire ropes (Specification: Φ21.8 × 6,300 mm), paired with large anchor cable support plates and arranged in a “3-0-3″ layout, with an inter-row spacing of 1800 × 1,000 mm. All cables are installed perpendicular to the roadway roof and tensioned to 240 kN. The current support scheme for the main auxiliary transport roadway is presented in Figure 16.
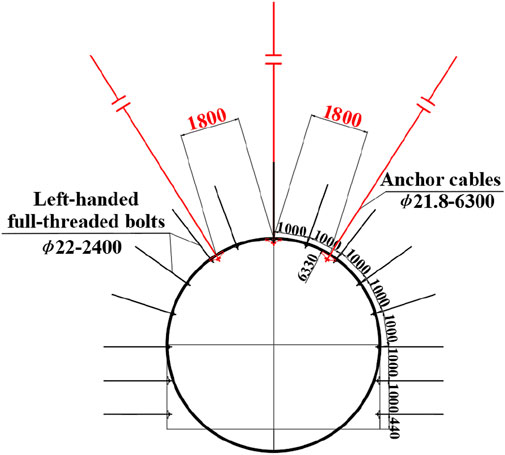
Figure 16. Current support scheme for auxiliary transport main roadway (Unit: mm).
4.2 Application of coupling support model
The original design scheme for the main auxiliary transport roadway of Xingjulong Coal Mine (Shandong, China) was developed based on the suspension theory, incorporating the roadway’s geological conditions. Bolt length was determined as 2.4 m, and diameter as 22 mm. Bolt spacing was calculated using Equation 11:
Where: D1 is the bolt spacing (unit: m), Q is the designed bolting force of the rock bolt (228 kN/rod), Per the Technical Specification for Rock Bolting Support of Coal Mine Roadways, the bolting force must meet the standard value of the bolt yield force, H is the bolt effective length (1.05 m), γ is the unit weight of the suspended coal (13.6 kN/m3), K is the safety factor (K = 2). By substituting the aforementioned values into Equation 11, the maximum spacing of bolts is derived, as presented in Equation 12.
Based on the rock pre-tightening force reinforcement and composite arch coupling support theory proposed in this study, the maximum spacing of bolts in Equation 14 can be derived by combining Equations 9, 10 and 13.
Where: Dmax is the maximum spacing of bolts.
Figure 17 shows the design calculation flowchart for roadway bolt support, which consists of three parts: parameter input, formula system, and result output. The program utilizes Excel’s Goal Seek function to solve implicit solutions. Surrounding rock cohesion is 3.05 MPa, and internal friction angle is 35°. Bolts selected have a yield strength of 600 MPa, diameter of 22 mm, and pre-tightening force of 50 kN. Based on roadway roof and floor parameters, the minimum support force is 304.51 kN/m, and the engineering safety factor is set to 2. In the formula, coefficient k is set to 1.5, and the pre-tightening force reinforcement coefficient is set to 10. The selected bolt length is 2.4 m. Based on the rock pre-tightening force reinforcement and composite arch coupling support model, the maximum bolt spacing on the roadway roof is 1.31 m. In contrast, the traditional suspension theory yields a calculated value of 2.82 m. The method proposed in this study is closer to the actual design value (1.0 m), with an accuracy improvement of nearly 6-fold, which validates the rationality of the coupling theory. Figure 18 shows the force measurement data of bolts at the site after the optimized support scheme. As observed from the diagram, the force of bolts on the roof and right side increases significantly within 50 m of the working face, ranging from 20 kN to 100 kN. Beyond this range, the force increase is minimal and gradually stabilizes. The stress of bolts on the left side increases sharply within 130 m of the working face, ranging from 60 kN to 230 kN. Beyond this range, the bolt stress remains basically stable, which fully meets the stability control requirements for coal mine roadways.
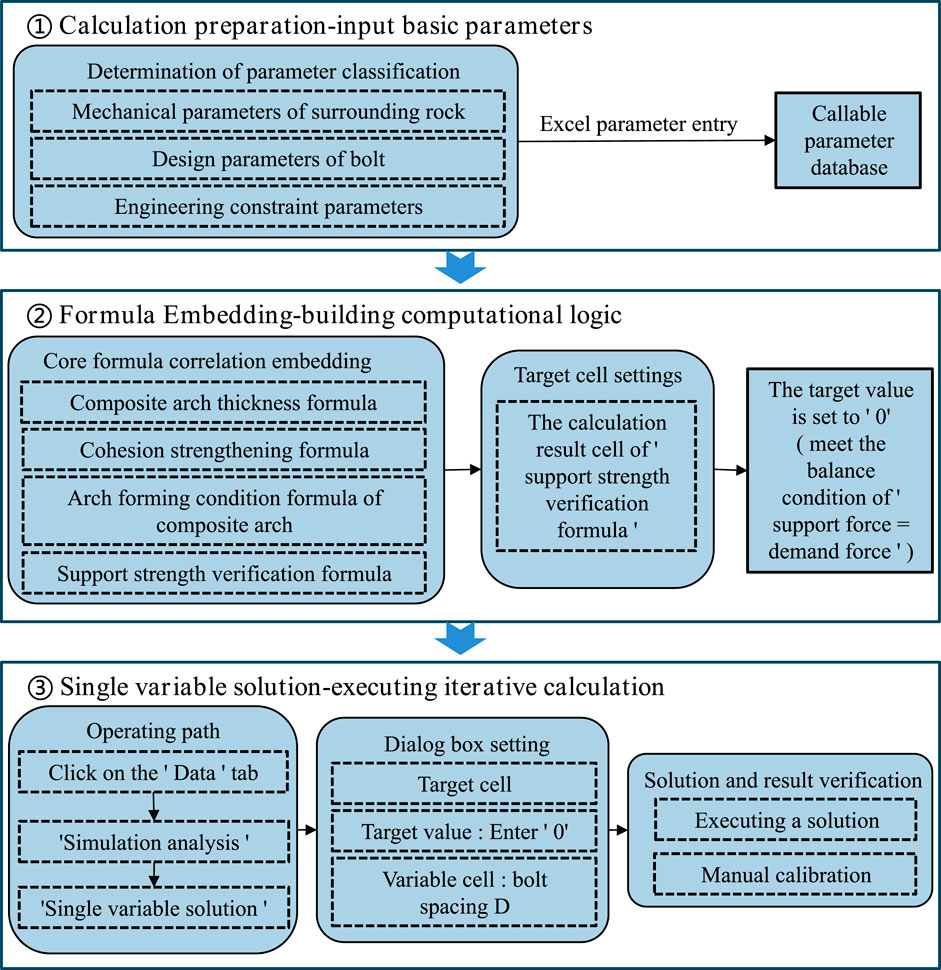
Figure 17. Roadway bolt support design calculation flow chart.
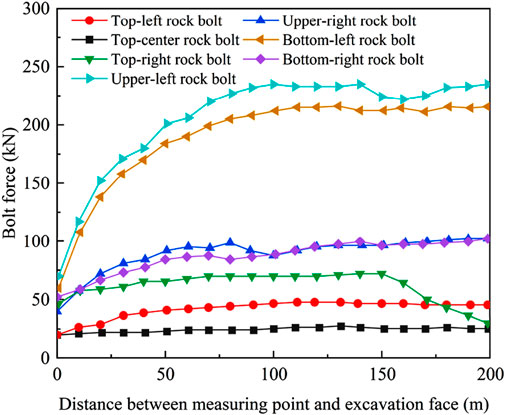
Figure 18. Optimized roadway bolt force measurement data.
The currently developed coupling support model for rock mass prestress enhancement and composite arch, though validated via theoretical derivations and engineering case studies, still has limitations due to research constraints and assumptions. During model development, the homogenization assumption was applied to the physical and mechanical properties of the rock mass, ignoring key geological features such as stratification development and non-uniform fracture distribution in deep roadway sections. Future research should focus on developing a coupled computational model for heterogeneous rock masses. By using geophysical radar and borehole imaging technologies to acquire 3D geological parameters (including fracture distribution and bedding orientation), the goal is to establish a coupled numerical model that integrates the Discrete Element Method (UDEC) and the Finite Element Method (FLAC3D), thus improving the model’s adaptability to complex geological conditions.
5 Conclusion
This study addresses the stability challenges in deep coal mine excavation by integrating the theory of rock strength enhancement with the principles of composite arch support. The key conclusions are as follows.
1. A theoretical model of support was established with cohesion as the coupling mechanism. This model reveals how pre-tightening force regulates the formation of composite arches and derives quantitative formulas for the load-bearing capacity of composite arches based on pre-tightening force parameters and bolt specifications (i.e., length and spacing). These results provide a theoretical basis for parameter design in mining engineering.
2. The influence patterns of key support parameters were identified. Bolt length positively enhances support strength by increasing the thickness of composite arches. Bolt spacing exhibits a negative correlation with support strength, as excessive spacing prevents the overlap of compressive stress zones. Pre-tightening force can monotonically improve the mechanical properties of rock masses.
3. A bolt spacing optimization method based on the coupling model was proposed. It is verified that there is a significant linear correlation between prestress and reasonable bolt spacing. Increasing pre-tightening force can significantly expand the reasonable bolt spacing, which provides a new approach to reducing support costs and improving construction efficiency.
4. Taking the auxiliary transport roadway of Shandong Xinjulong Coal Mine as a case study, the model’s calculation accuracy was improved by nearly 6 times. This fully verifies the model’s applicability and superiority in underground engineering under complex geological conditions.
Data availability statement
The raw data supporting the conclusions of this article will be made available by the authors, without undue reservation.
Author contributions
ZL: Validation, Methodology, Supervision, Resources, Formal Analysis, Writing – review and editing, Conceptualization. XL: Writing – original draft, Visualization, Data curation, Investigation.
Funding
The authors declare that no financial support was received for the research and/or publication of this article.
Conflict of interest
Author ZL was employed by CCTEG Coal Mining Research Institute and Tiandi Science and Technology Co., Ltd.
The remaining author declares that the research was conducted in the absence of any commercial or financial relationships that could be construed as a potential conflict of interest.
Generative AI statement
The authors declare that no Generative AI was used in the creation of this manuscript.
Any alternative text (alt text) provided alongside figures in this article has been generated by Frontiers with the support of artificial intelligence and reasonable efforts have been made to ensure accuracy, including review by the authors wherever possible. If you identify any issues, please contact us.
Publisher’s note
All claims expressed in this article are solely those of the authors and do not necessarily represent those of their affiliated organizations, or those of the publisher, the editors and the reviewers. Any product that may be evaluated in this article, or claim that may be made by its manufacturer, is not guaranteed or endorsed by the publisher.
References
Bednarek, Ł., Małkowski, P., Niedbalski, Z., and Mucha, K. (2024). Steel arch and rock bolt support in terms of the gateroad stability maintaining behind the longwall face. Appl. Sci. 14 (9), 3594. doi:10.3390/app14093594
Chen, W. Z., Wang, L. Y., Tan, X. G., Yang, D. S., Yuan, J. Q., and Yang, J. P. (2021). State-of-the-art and development tendency of the underground engineering stability of fractured rock mass. Chin. J. Rock Mech. Eng. 40 (10), 1945–1961. doi:10.13722/j.cnki.jrme.2020.1074
Cheng, P., Li, Z. W., Wang, Z. W., He, Y., and Zheng, Y. (2025). Mechanical analysis of combined bearing action of surrounding rock and prestressed anchor support and optimization of support parameters. Chin. J. Rock Mech. Eng., 1–9. Available online at: https://link.cnki.net/urlid/42.1397.O3.20250702.1649.001.
Chu, S. F., Chen, S. H., Liu, M. L., Huang, J., and Wei, H. X. (2023). The time-dependent deformation and damage constitutive model of rock based on dynamic disturbance tests. Open Geosci. 15 (1), 20220536–16. doi:10.1515/geo-2022-0536
Chunlin, L. C. (2006). Rock support design based on the concept of pressure arch. Int. J. Rock Mech. Min. Sci. 43 (7), 1083–1090. doi:10.1016/j.ijrmms.2006.02.007
Foote, P. (1964). An expanding-bolt seam-tester. Int. J. Rock Mech. Min. Sci. Geomechanics Abstr. 1 (2), 255–275. doi:10.1016/0148-9062(64)90030-0
Gale, W. J. (1991). “Strata control utilising rock reinforcement techniques and stress control methods,” in Australian coal mines (London), 150, 247–253. doi:10.1016/0148-9062(91)91039-t352
He, M. C., Wu, Y. Y., Gao, Y. B., and Tao, Z. G. (2024). Research progress of rock mechanics in deep mining. J. China Coal Soc. 49 (1), 75–99. doi:10.13225/j.cnki.jccs.2023.1400
Hou, Z. G., and Gou, P. F. (2000). Mechanism study on strength enhancement for the rocks surrounding roadway supported by bolt. Chin. J. Rock Mech. Eng. 19, 342–345. doi:10.3321/j.issn:1000-6915.2000.03.019
Hou, G. Y., Liang, J. P., and Li, X. R. (2022). Research on principles and methods of roadway support design under conventional conditions. Chin. J. Rock Mech. Eng. 41 (4), 691–711. doi:10.13722/j.cnki.jrme.2021.0250
Kang, H. P. (2021). Seventy years development and prospects of strata control technologies for coal mine roadways in China. Chin. J. Rock Mech. Eng. 40 (1), 1–30. doi:10.13722/j.cnki.jrme.2020.0072
Kang, H. P., Jiang, T. M., and Gao, F. Q. (2007). Effect of pretensioned stress to rock bolting. J. China Coal Soc. 32 (7), 680–685. doi:10.3321/j.issn:0253-9993.2007.07.002
Lang, T. A. (1961). Theory and practice of rock bolting, 220. Transactions of the American Institute of Mining and Metallurgical Engineers, 333–348.
Lei, X., Tao, Z. G., Liu, K. Y., Yang, H., Cai, M. J., and Fan, X. W. (2024). Deformation mechanism of rock mass and prestressed anchor cable support technology of haidong soft rock tunnel. J. Mt. Sci. 21 (12), 4299–4322. doi:10.1007/s11629-024-8705-x
Lu, S. L., Tang, L., and Yang, X. A. (1998). Rock bolt anchoring force and anchoring technology. Beijing: China Coal Industry Publishing House.
Oliveira, D., and Paramaguru, L. (2016). Laminated rock beam design for tunnel support. Aust. Geomechanics J. 51, 1–17. Available online at: https://geomechanics.org.au/admin/wp-content/uploads/2017/05/AGS_Journal-Vol51-03_01.pdf.
Panek, L. A. (1952). Centrifugal testing apparatus for mine-structure stress analysis. Washington, DC: US Department of the Interior, Bureau of Mines.
Ranjbarnia, M., Fahimifar, A., and Oreste, P. (2016). New analytical approaches for evaluating the performance of systematic pre-tensioned fully grouted rockbolts in tunnel stabilization. Archives Min. Sci. 61, 823–852. doi:10.1515/amsc-2016-0056
Ranjbarnia, M., Rashedi, M. M., and Dias, D. (2022). Analytical and numerical simulations to investigate effective parameters on pre-tensioned rockbolt behavior in rock slopes. Bull. Eng. Geol. Environ. 81 (2), 74–21. doi:10.1007/s10064-021-02563-1
Tao, Z. G., Mao, Y. T., Sun, J. H., Zhang, X. Y., Huo, S. S., and He, M. C. (2024). Research on energy-absorption active control method for large deformation of tunnel surrounding rock through multi-fault fracture zone. Can. Geotechnical J. 61 (9), 1977–1995. doi:10.1139/cgj-2023-0318
Wang, J. Y., Zheng, X. G., Guo, X. W., Xin, W., Wang, Y. H., Li, T., et al. (2024). Study on the anchorage mechanism and roof stability control technology of bolts in fractured or weak surrounding rock. Sci. Rep. 14, 22906. doi:10.1038/s41598-024-67811-2
Wang, Q., Wei, H. Y., Jiang, B., Wang, X. P., Sun, L. F., and He, M. C. (2024). High pre-tension reinforcing technology and design for ultra-shallow buried large-span urban tunnels. Int. J. Rock Mech. Min. Sci. 182, 105891. doi:10.1016/j.ijrmms.2024.105891
Wei, S. G., and Gou, P. F. (2012). Analogy simulation test on strengthening effect for pretention of bolts on anchorage body. J. China Coal Soc. 37 (12), 1987–1993. doi:10.13225/j.cnki.jccs.2012.12.026
Wei, S. J., and Li, B. F. (2013). Anchor bolt body formation and instability mode under the influence of anchoring pretension. J. China Coal Soc. 38, 2126–2132. doi:10.13225/j.cnki.jccs.2013.12.018
Wu, B. W., Chang, J. C., Wang, X. Y., Shi, W. B., Li, C. M., and Chen, D. C. (2024). Research on the mechanism and application of high pre-tension on the crack-arresting effect of rockbolt anchorage. Buildings 14 (8), 2584. doi:10.3390/buildings14082584
Xie, H. P. (2017). Research framework and anticipated results of deep rock mechanics and mining theory. Adv. Eng. Sci. 49 (2), 1–16. doi:10.15961/j.jsuese.201700025
Xie, Z. D., He, C., Chen, Z. Q., Zou, Y. L., Zhou, Y., and Gu, H. (2025). Time-dependent squeezing deformation mechanism and its active control method of deep soft-rock tunnels crossing thrust faults. Rock Mech. Rock Eng. 58, 2661–2687. doi:10.1007/s00603-024-04328-0
Yang, H. Y., Liu, Y. B., Li, Y., Pan, R. K., Wang, H., Luo, F., et al. (2020). Research on the support of larger broken gateway based on the combined arch theory. Geomechanics Eng. 23, 93–102. doi:10.12989/gae.2020.23.2.093
Zhang, Z., Lin, J., Ma, B., Chu, X. W., Ren, S., Li, Z. W., et al. (2024). Stress diffusion model of anchor bolts in rectangular tunnel roof and reinforcement mechanism of surrounding rock. Chin. J. Rock Mech. Eng. 43 (S2), 3681–3689. doi:10.13722/j.cnki.jrme.2023.1103
Zhao, X. D., Zeng, N., Deng, L., Zhu, Q. K., Zhao, Y. F., and Yang, S. H. (2022). Optimization drift support design based on engineering geological and geotechnical analysis in deep hard-rock mine: a case study. Appl. Sci. 12 (20), 10224. doi:10.3390/app122010224
Zhao, Y. M., Zhang, N., and Wang, J. (2024). Failure properties of roadway with extra-thick coal seams and its control techniques. Heliyon 10 (1), e23990. doi:10.1016/j.heliyon.2024.e23990
Keywords: bolt support, composite arch, pre-tightening force, surrounding rock stability, coupling support model
Citation: Li Z and Li X (2025) Research on surrounding rock-composite arch coupling support models considering pre-tightening force strengthening coefficients. Front. Earth Sci. 13:1719406. doi: 10.3389/feart.2025.1719406
Received: 06 October 2025; Accepted: 04 November 2025;
Published: 19 November 2025.
Edited by:
Faming Huang, Nanchang University, ChinaReviewed by:
Ziyi Yang, Anhui University of Science and Technology, ChinaFulu Shang, Qingdao Technological University, China
Copyright © 2025 Li and Li. This is an open-access article distributed under the terms of the Creative Commons Attribution License (CC BY). The use, distribution or reproduction in other forums is permitted, provided the original author(s) and the copyright owner(s) are credited and that the original publication in this journal is cited, in accordance with accepted academic practice. No use, distribution or reproduction is permitted which does not comply with these terms.
*Correspondence: Xiang Li, bGl4aWFuZzAxQHdodXQuZWR1LmNu