 Wei Zhou1
 Bo Li
Bo Li Qingrong Xiong
 LiGe Wang
- 1CHN Energy Zhongyu Branch of Xizang Power Co., Ltd., Naqu, China
- 2Changjiang Survey, Planning, Design and Research Co., Ltd., Wuhan, China
- 3School of Civil Engineering, Shandong University, Jinan, China
- 4Shenzhen Research Institute of Shandong University, Shenzhen, China
- 5State Key Laboratory of Intelligent Manufacturing of Advanced Construction Machinery, Shandong University, Jinan, China
This study presents a comprehensive investigation of the static-dynamic stability of an extra-large surge chamber intersecting an active fault zone—a critical engineering challenge in modern hydropower infrastructure. Through three-dimensional numerical modeling (FLAC3D), we systematically quantified excavation-induced instability mechanisms and evaluated a deep-surface synergistic support system. Unsupported excavation simulations revealed severe instability with radial displacements up to 0.475 m, a 20 m plastic zone, and tangential stress loss of 65%–75%. The deep-surface synergistic support system—comprising prestressed anchor cables, systematic bolts, and shotcrete—reduced displacement by 94.5%, confined the plastic zone to ≤5 m, and restored tangential stresses to 70%–85% of in-situ values. Under the design earthquake (0.175 g horizontal, 0.1167 g vertical), displacement and stress increments remained <10% and <5% of static values, respectively. Plastic zone growth was limited to 3.8%, with all support elements operating within safe limits. This research validates a methodology for designing resilient underground infrastructure in fault-affected environments, providing critical insights for underground chamber design in complex geological settings previously considered unsuitable for large-scale development, with direct applications to hydropower engineering in tectonically active regions.
1 Introduction
Underground surge chambers serve as critical hydraulic components in large-scale hydropower and pumped-storage facilities, fulfilling three primary functions: transient pressure regulation through Thoma criterion compliance (L/A < 200), water hammer mitigation via reflected pressure wave interference, and hydraulic stability maintenance during rapid load fluctuations (Zhang et al., 2009; Yin, 2014). With the global expansion of renewable energy infrastructure, modern hydropower development has necessitated surge chambers with increasingly large cross-sections, greater heights, and more complex geometries to accommodate higher capacity requirements (Ahmad et al., 2025a). This trend toward super-large underground structures has inevitably led to geological conditions challenging that were previously avoided in conventional designs.
In alpine canyon regions-particularly along the Tibetan Plateau and Himalayan belt-surge chambers frequently intersect active fault-fracture zones due to limited site selection options and spatial constraints imposed by topography and hydraulic requirements. These geological environments present a confluence of engineering challenges: intensely fractured rock masses with diminished mechanical properties, significant groundwater inflow that complicates construction and long-term stability, heterogeneous in-situ stress distributions arising from tectonic activity, and the potential for seismic loading during operational lifespan (Ardeshiri Lajimi et al., 2015; Dhakal et al., 2020; Wang et al., 2020; Chu et al., 2022). Insufficient stability control in such settings can trigger progressive failure mechanisms, compromising not only the structural integrity of the surge chamber but also the operational safety and economic viability of the entire hydraulic system (Ahmad et al., 2021). Consequently, there exists an urgent need for systematic methodologies to evaluate and ensure the static and dynamic stability of extra-large underground chambers intersecting active fault zones.
Numerical simulation has emerged as the primary analytical tool for investigating underground cavern stability under complex geological conditions, owing to its ability to capture three-dimensional stress-deformation behavior and progressive failure mechanisms that are difficult to assess through empirical or analytical approaches alone. However, the selection of an appropriate numerical methodology is paramount for reliably simulating the stability of extra-large underground excavations intersecting complex fault zones under combined static and seismic loading. The Finite Element Method (FEM), while proficient in handling complex geometries and continuum mechanics problems, encounters computational limitations when efficiently resolving large deformations and intensive plastic yielding-phenomena that are characteristic of fault-affected rock masses undergoing excavation-induced stress redistribution (Liu et al., 2015; Zou et al., 2017; Wang et al., 2023). Conversely, the Discrete Element Method (DEM), despite its excellence in modeling discrete block interactions, fracture propagation, and discontinuity-controlled failure modes, becomes computationally prohibitive when applied to the extensive rock mass domains required for realistic representation of super-large chambers and their surrounding geological environment (Wang M. et al., 2022; Promneewat et al., 2023).
In this context, the Finite Difference Method (FDM), as implemented in FLAC3D, presents a compelling alternative by offering an optimal balance between computational efficiency and robust handling of large-strain, nonlinear problems (Cai et al., 2007). The explicit solution scheme employed in FLAC3D is particularly advantageous for tracking the progressive development of plastic zones and the evolution of stress redistribution around excavations-processes that are central to understanding stability in fault-affected environments. Furthermore, FLAC3D’s dynamic analysis capabilities, incorporating viscous boundaries and free-field conditions, enable seamless integration of static excavation analysis with subsequent seismic response evaluation (Wei et al., 2023). This integrated static-dynamic modeling framework is essential for comprehensively assessing the performance of support systems that must maintain stability under both gravitational loading and earthquake-induced cyclic stresses. Therefore, the adoption of FLAC3D in this study represents a deliberate methodological choice tailored to the specific scale, nonlinear mechanical behavior, and coupled static-dynamic analysis requirements inherent to the problem at hand.
Previous research has made significant contributions to understanding various aspects of underground excavation stability in challenging geological conditions. In the realm of static stability, studies have investigated plastic zone development mechanisms in heterogeneous geological environments (Ma et al., 2020; Kien et al., 2022; Duan et al., 2023), failure modes in layered and stratified rock masses (Li et al., 2018), and excavation-induced relaxation behavior (Zhang et al., 2020; Wu et al., 2022). Parallel advances in dynamic stability research have examined seismic response characteristics of large underground caverns (Nie and Shi, 2012; Cui et al., 2016; Cun et al., 2020), the influence of fault geometry and orientation on dynamic structural performance (Ardeshiri Lajimi et al., 2015), and integration of microseismic data to improve deformation predictions (Li et al., 2019). Wang X. et al. (2022) highlighted the importance of structural plane effects in cylindrical tailrace surge chambers. Xu et al. developed constitutive models and damage indices for layered rock mass responses during excavation (Xu et al., 2017). Despite these advances, most studies address either static or dynamic stability independently, rarely integrating both phenomena. Moreover, few investigations target extremely large-section surge chambers situated entirely within active fault zones (Ahmad et al., 2019).
Support system design for these exceptionally challenging environments presents additional complexities that are incompletely addressed in existing literature (Rizvi et al., 2020). While conventional support elements—prestressed anchor cables, systematic rock bolts, and shotcrete—have demonstrated effectiveness in standard tunneling and smaller cavern applications (Wang et al., 2021), the coupled deep-surface support mechanisms and their synergistic performance in extra-large-span chambers subjected to combined static gravitational loads and dynamic seismic excitation require further systematic investigation. Recent technological developments, such as energy-absorbing anchor cable systems designed for soft rock tunnels (Li et al., 2023), show considerable promise for adaptation to large cavern applications, yet their integration into comprehensive support strategies remains to be fully explored. Additional relevant contributions in the broader context include parametric studies characterizing the extent and properties of excavation-damaged zones (Liu et al., 2013), probabilistic frameworks for stability assessment incorporating geotechnical uncertainty (Liu et al., 2024), and multi-objective optimization approaches for the spatial layout and construction sequencing of underground cavern groups (Ma et al., 2023; Ahmad et al., 2025b).
This study therefore aims to systematically investigate the stability of an extra-large surge chamber traversing a fault zone through integrated static-dynamic simulations. The performance of a deep-surface synergistic support scheme is rigorously evaluated. This support strategy is conceptualized as an integrated system where deep reinforcement components mobilize the bearing capacity of the competent rock mass beyond the excavation-damaged zone, while surface support components work in tandem to ensure the integrity of the immediate excavation boundary. The simulations are designed to quantify the improvements in stability afforded by this scheme under both static and seismic loading conditions. The objective is to provide a comprehensively documented case study with quantified performance metrics, which may offer references for the design of similar underground structures in geologically complex settings.
2 Engineering background
2.1 Geographic location of the surge chamber
The project constitutes a major component of a large-scale hydropower scheme situated on the left bank of the Yigongzangbu River within a steep alpine canyon environment. The regional topography exhibits extreme relief, with ground elevations along the headrace alignment ranging from 2785 m to 3628 m, creating a vertical differential of approximately 843 m. The surge chamber is positioned approximately 430 m upstream of the main powerhouse within a deeply incised valley slope. The local terrain gradient ranges from 40° to 50°, with ground surface elevations varying between 2960 m and 3010 m, exhibiting distinct characteristics of a monoclinal mountain slope.
The surge chamber adopts a vertical-shaft configuration with an excavation diameter of 31 m and a total height of 145.5 m. The structure extends from a base elevation of 2663.40 m to a crown elevation of 2808.90 m. The crown is overlain by approximately 120 m of intact rock cover, while the lower section directly intersects fault-affected rock masses.
2.2 Geological features of the fault zone
The active tectonic framework is dominated by the Jiali Fault zone. The surge chamber is located within the influence zone of the southern branch of the Jiali Fault (F4-2), a major strike-slip structure that is intersected twice by the water-conveyance tunnel. This fault exhibits a consistent strike between 285° and 300° with steep dips predominantly of 70°–80° (mainly to the NE, with local SW dips observed at sites like Talu Village) (Alsabhan et al., 2021). As shown in Figure 1, kinematic indicators, including slickensides observed at Barei Village, reveal a complex mechanism combining right-lateral strike-slip with a reverse thrust component, as further corroborated by structural analyses from Talu Village outcrops and subsurface exploration data.

Figure 1. Typical outcrop sites of the southern branch of the Jiali Fault (F4-2) and topography and geomorphology along the water conveyance line. (A) Outcrop at Zhuyu Village; (B) Downstream outcrop at Talu Village; (C) Outcrop at Barei Village; (D) Topography and geomorphology along the water conveyance line.
The architectural complexity of the fault zone is clearly illustrated in Figure 1, which delineate the spatial relationships between the main fault branches-such as northern branch of the Jiali Fault zone F4-1 (about 1.2 km north of the alignment) and southern branch of the Jiali Fault zone F4-2 (twice intersected)-and secondary structures like the Mango Fault F8 (about 0.5 km south of the alignment). And the area exhibits well-developed gullies with significant topographic relief, the ridges trend predominantly NE, and a total of nine gullies are developed along the route. These maps integrate regional surveys, high-resolution satellite imagery, and detailed field mapping, also indicating interactions with the hydrological network and the layout of the water conveyance infrastructure including the surge chamber.
As shown in Figure 2, detailed subsurface investigations via exploration adits (LPD03, LPD04, LPD05) and boreholes (FZK06, FZK19) confirm that the surge chamber is situated within the influence zone of the F4-2-3 fault branch, which comprises at least 18 individual fault planes. Adjacently, the F4-2-2 branch, documented in inclined borehole LZK04, contains four distinct faults. These zones are characterized by intense fracturing, high joint density, and localized rock crushing. The host bedrock primarily consists of quartz sandstone of the Leilongku Formation, with interlayers of Paleogene granite and migmatite. The overlying Quaternary cover, approximately 30 m thick, comprises colluvial-eluvial deposits of gravelly soil and blocky debris, which exert negligible influence on deep excavation stability given the significant rock cover over the chamber crown.

Figure 2. Section schematic diagram (1. Quaternary Holocene alluvial-diluvial layer; 2. Paleogene; 3. Lower member of Carboniferous-Permian Laigu Formation; 4. Pre-Ordovician Leilongku Formation; 5. Fault cataclasite; 6. Fault and its numbering; 7. Lower limit of weak weathering; 8. Quaternary debris flow deposit layer).
Regarding fault activity, Electron Spin Resonance (ESR) dating of fault gouge from the Zhuyu Village outcrop yielded ages of 831 ± 59 ka and 1035 ± 72 ka, and samples from the Talu Village downstream outcrop gave an age of 887 ± 69 ka, indicating primary activity during the Early to Middle Pleistocene. The absence of offset late Quaternary deposits suggests minimal recent reactivation. Regionally, the Jiali Fault zone extends over 150 km, with the local southern branch (F4-2) segment displaying widths varying from 100 m to 590 m and consisting of multiple sub-parallel strands (e.g., F4-2-1, F4-2-2, F4-2-3). Based on empirical relationships between fault dimensions and slip rates, integrated into regional seismic hazard models, this fault system poses a seismic potential estimated at Mw approximately7.0–7.5, consistent with major active strike-slip faults within the Tibetan Plateau tectonic framework.
2.3 In situ stress and stability controlling factors
Tectonic activity has produced significantly fractured and mechanically weakened rock in the lower chamber zone, resulting in poor self-supporting capacity and elevated risk of block detachment and localized collapse. In-situ stress measurements indicate a low-to moderate-stress regime throughout the site:
FZK06 borehole: maximum horizontal principal stress 3.1–6.7 MPa, oriented NE50°—NE61°.
FZK19 borehole: maximum horizontal principal stress 4.5–9.5 MPa, oriented NE52°—NE64°.
The stress field trends generally NEE, with a tendency for stress relief in the slope environment.
The primary stability concerns for the chamber excavation include Fault zone instability-characterized by low rock mass strength and relaxation deformation within fault cores and damage zones and heterogeneous mechanical response-variable rock quality resulting from topographic relief and structural complexity.
These challenging conditions necessitate a comprehensive support design approach, incorporating pre-reinforcement in fault-affected sections and carefully staged excavation to control deformation and maintain safety.
3 Numerical setup
FLAC3D is deployed to static and dynamic analyses to examine excavation-induced deformation, stress redistribution, and seismic response of the surge chamber and surrounding rock mas.
3.1 Numerical model construction
The three-dimensional model encompassed 362.0 m in the X-direction (S66°W), 384.0 m in the Y-direction (S24°E), and 606 m in the Z-direction, with the ground surface explicitly represented as the top boundary. The computational domain extended 155 m upstream and 229 m downstream from the surge chamber centreline. The model contained 1703588 tetrahedral elements and 288171 nodes, as shown in Figure 3.

Figure 3. The surge chamber numerical model.
The fault zone geometry was translated from geological mapping (Figure 2) through the following workflow: (1) borehole FZK06/FZK19 data defined fault plane orientations (strike 285–300°, dip 70–80°NE); (2) fault traces were digitized from LPD03/LPD04/LPD05 adit mapping; (3) 3D surfaces were interpolated in Rhino software; (4) imported into FLAC3D with 10–2 m edge length refinement (10× denser than host rock). This discretization preserves the observed 100–590 m fault zone width variation along the tunnel alignment.
For static analysis, boundary conditions are defined as follows: base to prevent rigid body motion on the base, free-field lateral constraints permitting tangential displacements while restricting normal deformation, and an unconstrained top surface allowing natural deformation responses.
For dynamic analysis, the boundary conditions were modified to (Figure 4): energy-absorbing viscous boundaries at the base to mitigate artificial wave reflections, free-field lateral conditions to simulate semi-infinite media response during seismic wave propagation, while maintaining an unconstrained top surface to allow natural ground motion development (Haroon et al., 2017).
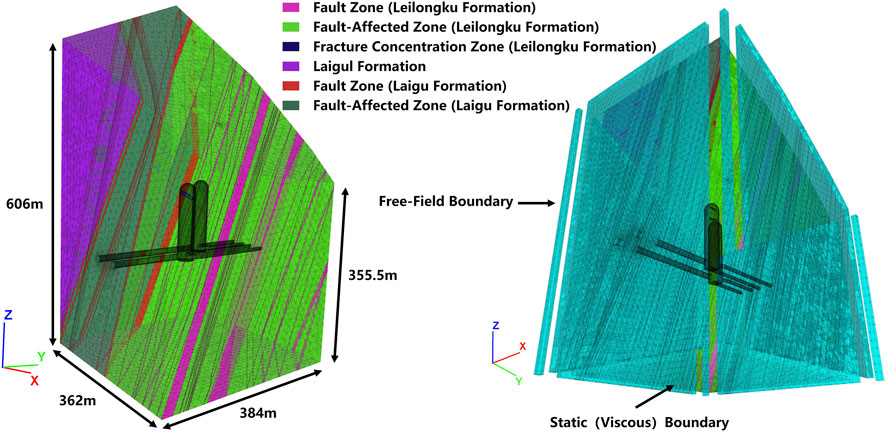
Figure 4. Dynamic calculation and analysis model.
The mechanical parameters for these equivalent materials (Table 1) were determined based on a comprehensive program of geological exploration, laboratory testing on rock samples, and rock mass classification, ensuring they represent the global mechanical behavior. The constitutive behavior was represented using a Mohr-Coulomb elastoplastic model with tensile strength cutoff (Wang et al., 2024). In this study, the “plastic zone” is explicitly defined as the region where the surrounding rock mass exceeds its yield criterion (Mohr-Coulomb shear failure or tensile failure) and undergoes irreversible plastic deformation. Within the FLAC3D numerical framework, we identify this zone using the plastic state indicators that track whether an element has yielded in shear, tension, or both. The extent of the plastic zone is measured perpendicularly from the excavation boundary to the furthest yielded element in each analyzed section. Quantitatively, we assess the plastic zone in terms of its radial extent (maximum distance from excavation boundary), volumetric distribution (percentage of rock mass volume that has yielded), and failure mode distribution (proportion of different failure mechanisms). Fault zones were characterized by reduced deformation modulus, cohesion, and friction angle values to reflect their highly fractured state and diminished mechanical strength. For seismic analysis, dynamic material properties were maintained consistent with static values, following standard practice for rock masses. Rayleigh damping with a critical damping ratio of 5% was adopted to represent energy dissipation in the rock-support system. This damping coefficient accounts for the combined energy absorption mechanisms operating at different scales: hysteretic material behavior in the rock mass, frictional dissipation along structural interfaces, and controlled yielding in support elements. The energy dissipation during seismic loading occurs primarily through three mechanisms: (1) inelastic deformation within the rock mass plastic zone, (2) controlled deformation and load redistribution in support elements, and (3) interface friction between support components and surrounding rock.

Table 1. Parameter values of surrounding rock for numerical calculation.
The fault zones were explicitly modeled as discrete geological features using a hierarchical three-component structure to capture their complex mechanical behavior: (1) a central fault core with appropriate strength and stiffness properties derived from laboratory testing of core samples, (2) a surrounding damage zone with a gradation of mechanical properties, and (3) interface elements at the boundaries that implement Mohr-Coulomb friction criteria to simulate potential shear sliding.
This multi-component representation captures the critical mechanical characteristics of fault zones while remaining computationally tractable. Sensitivity analyses were conducted to evaluate how variations in fault zone properties influence the predicted mechanical response during cavern excavation and seismic loading. These analyses confirmed that our modeling approach successfully reproduces the localized shear deformation observed along fault planes during preliminary site investigations, validating its applicability for assessing storage integrity.
The interface elements implemented at fault boundaries are particularly important for capturing potential sliding mechanisms. These elements allow for realistic simulation of stick-slip behavior and displacement-dependent friction that governs fault reactivation. This approach provides a more accurate representation of localized failure mechanisms than simplified homogeneous material models while avoiding the computational challenges of explicitly modeling micro-scale damage features that have minimal influence on cavern-scale behavior.
3.2 Initial in-situ stresses simulation
The initial stress field was directly established using measured in-situ stress values obtained from hydraulic fracturing tests at boreholes FZK06 and FZK19 (Table 2). These field measurements represent direct determinations of the actual stress state at the project site and were incorporated as input parameters without further calibration. Gravitational loading was applied solely to account for the overburden weight component, while the measured horizontal stresses were used directly to represent the tectonic stress component. The model incorporated the effects of previously excavated and supported water diversion tunnels connected to the chamber, as these structures had already been completed and stabilized prior to surge chamber construction. The resulting initial stress state is illustrated in Figure 5, showing the three-dimensional distribution of principal stresses before chamber excavation.

Table 2. Borehole Hydraulic Fracturing Stress Test Results. Note: σH-Maximum horizontal principal stress; σh-Minimum horizontal principal stress; σz-Calculated overburden stress at measurement point (Rock unit weight = 27.4 kN/m3, based on laboratory physical tests).

Figure 5. Cloud diagram of initial in-situ stresses distribution.
3.3 Excavation and support simulation scheme
The numerical model simulated the excavation process through 24 distinct vertical stages progressing from crown to base. The total excavation height reached 145.5 m. The 24-stage sequence balances three constraints: (1) Equipment access: raise-boring requires 6–6.5 m lifts for drill rig positioning (DL/T 5407–2009 and (DL/T 5099–2011); (2) Deformation control: stages 3–23 uniformly divide the 126 m chamber body to prevent stress concentration from irregular excavation heights; (3) Monitoring feedback: each 6 m advance allows 72-h convergence monitoring before next blast (per project construction log, unpublished). Initial excavation began with the vault section, implemented in two phases of 9 m and 6.5 m heights (Stages 1–2). The main chamber body was then systematically excavated through twenty-one consecutive 6.0 m lifts (Stages 3–23). The excavation sequence concluded with a final 4 m lift at the base elevation (Stage 24).
Support was installed following each excavation stage, replicating standard construction sequencing. The support system configuration and its parameters (Table 3) were designed based on comprehensive rock mass characterization, adherence to the Specification of prestressing anchorage construction for hydropower and water resources project (DL/T 5083–2019), and established engineering practiceSupport was installed following each excavation stage, replicating standard construction sequencing. The support system configuration and its parameters were designed based on comprehensive rock mass characterization, adherence to the Specification of prestressing anchorage construction for hydropower and water resources project (DL/T 5083–2019), and established engineering practice (CEC China Electricity Council, 2019; Guo et al., 2020; Hall et al., 2025). This integrated deep-surface synergistic scheme operates on the principle that deep prestressed anchor cables mobilize the bearing capacity of the competent rock mass beyond the excavation-damaged zone, while systematic bolts and shotcrete work in tandem to ensure the immediate excavation boundary’s integrity, thereby controlling relaxation deformation. Additionally, this support configuration creates an effective energy absorption system under dynamic loading conditions. The prestressed cables act as energy-absorbing elements through controlled deformation and load redistribution, while the spatial arrangement of rock bolts creates a reinforcement network that enhances overall system damping. The shotcrete layer contributes to energy management through microcracking mechanisms while maintaining excavation boundary integrity. This energy dissipation capacity is crucial for maintaining stability during seismic events.

Table 3. Parameter values of support.
The support system comprises three primary components strategically designed to ensure excavation stability. Systematic rock bolts (Φ32/Φ28 mm diameter, 6 m length) are installed in a 1.2 m × 1.2 m grid pattern for sidewalls and crown arch, while extend to 9 m length in fault zones and highly fractured areas. These HRB500 steel bolts (yield strength ≥ 500 MPa) are installed at slight upward inclinations (5–10°) to optimize grouting efficiency and prestressed to 100 kN. A continuous 15 cm thick reinforced shotcrete layer (C25) provides immediate surface support with flexural and compressive strengths of 4—5 MPa and 25 MPa, respectively. For deep-seated reinforcement, high-capacity prestressed anchor cables (1500/2000 kN) extend 25 m in standard sections and 30 m in structurally complex zones, arranged in a 6.0 m × 6.0 m grid pattern along sidewalls and a more densely spaced 4.5 m × 4.5 m configuration in the crown region. The support parameters were determined based on construction experience under similar geological conditions (unpublished) and relevant design specifications, such as Technical Code for Engineering of Ground Anchorages and Shotcrete Support (GB 50086–2015) and Code for Design of Hydraulic Tunnel (NB/T 10391–2020). Specifically: (1) 25–30 m cable length targets competent rock beyond the 20 m plastic zone (Figure 6G); (2) 1500–2000 kN capacity calculated from tributary area method: (6 m × 6 m grid) × (8 MPa in-situ stress) × (safety factor 1.5) ≈ 1700 kN; (3) 1.2 m bolt spacing satisfies NB/T 10391–2020 requirement of ≤1.5 m for Class IV rock (Leilongku Formation GSI≈45–55).

Figure 6. Comparison of Static Stability Response of Surrounding Rock. (A) Displacement cloud diagram, unsupported; (B) Displacement cloud diagram, supported; (C) Third principal stress cloud diagram, unsupported; (D) Third principal stress cloud diagram, supported; (E) First principal stress cloud diagram, unsupported; (F) First principal stress cloud diagram, supported; (G) Plastic zone distribution, unsupported. (H) Plastic zone distribution, supported.
The numerical implementation employed specialized structural elements: CABLE elements for systematic bolts and anchor cables, and LINER elements for shotcrete. Support parameters used in the simulation are presented in Table 3.
3.4 Interface treatment between support materials
In actual construction, the bolt-grout-rock interface is treated using “segmented grouting” technology. High-strength grouting is used for the anchoring section, while ordinary grouting is used for the free section. Grouting pressure is controlled at 1.0–1.5 MPa to ensure adequate filling of the anchoring section. Anchor cable installation adopts the “secondary grouting” process: first grouting the anchoring section, then tensioning after initial setting of the grout, followed by secondary grouting. The shotcrete-bolt interface incorporates polypropylene fibers to enhance bonding strength.
The mechanical interaction between different support materials was explicitly modeled to capture their composite behavior. For bolt-grout-rock interfaces, we implemented a modified version of the CABLE structural element in FLAC3D with interface properties defined differently based on location: in bonded sections, grout shear stiffness (kbond = 4.0 × 10¹⁰ N/m2) and grout cohesive strength (cbond = 4.0 × 10¹⁰ Pa); in unbonded (“free”) sections, reduced values of grout shear stiffness (kbond = 1.0 × 10¹⁰ N/m2) and grout cohesive strength (cbond = 1.0 × 10¹⁰ Pa) were used.
For the shotcrete-rock interface, we utilized LINER elements with interface properties defined by normal stiffness (kn = 5.09 × 10¹⁰ Pa/m), shear stiffness (ks = 5.09 × 10¹⁰ Pa/m), and interface cohesion (ci = 1.09 × 10⁸ Pa).
The prestressed anchor cables were modeled using a two-stage approach: first applying the initial prestress force (150 kN) as a concentrated load at the cable head, then activating the cable-grout-rock interaction properties for subsequent loading.
4 Results
4.1 Static stability results
The static excavation analysis revealed pronounced differences in behavior between unsupported and supported conditions. Without support measures, the excavation induced substantial deformation in the surrounding rock mass, particularly within fault-affected zones (Figures 6A,C,E). The maximum radial displacement reached 47.5 cm, concentrated primarily around mid-height sidewalls where rock fracturing was most intense. The plastic zone extent shown in Figures 6G,H represents the spatial distribution of elements that have reached or exceeded the Mohr-Coulomb yield criterion. The color coding distinguishes between different failure modes: shear failure (yellow), tensile failure (red), and combined shear-tensile failure (purple). The maximum plastic zone penetration depth was measured radially from the excavation boundary along 24 equally spaced profile lines around the chamber circumference. The plastic zone extended to depths of 20 m beyond the excavation boundary, indicating extensive yielding and confinement loss within the rock mass. This significant plastic penetration corresponded with the observed stress distribution patterns, which showed tangential (hoop) stress reductions from pre-excavation values of 8–10 MPa to 2—3 MPa in heavily fractured zones—representing a 65–75% decrease in confining pressure. Simultaneously, compressive stress concentrations developed at chamber abutments, where tangential stresses locally increased to 12–14 MPa, yielding a stress concentration factor of approximately 1.4 relative to initial conditions. Vertical stresses near the crown decreased by approximately 50%, from approximately 7 MPa to approximately 3.5 MPa, indicating substantial unloading and confining pressure loss. These stress changes directly correlate with the observed failure mechanism dominated by relaxation deformation and block detachment along pre-existing discontinuities.
When the deep-surface synergistic support system was applied, the stability response improved significantly. As shown in Figure 6, maximum radial displacement was reduced to 2.6 cm—a 94.5% decrease compared with the unsupported case. The plastic zone (Figure 6H) was confined to within 5 m of the excavation boundary, entirely within the anchorage length of the prestressed cables. Stress contour diagrams after support installation (Figures 6D,F) reveal that the tangential stress around the excavation boundary was restored to 7—9 MPa, representing a recovery of 70–85% of the initial in-situ values. The stress arch was re-established, with a smoother distribution and reduced stress concentration at the abutments (peak tangential stress reduced from 12–14 MPa in the unsupported case to 9–10 MPa). Vertical stresses at the crown increased from approximately 3.5 MPa in the unsupported case to approximately 6.5 MPa with support, indicating improved confinement.
The synergy between deep and surface support is evidenced by the complementary stress distributions observed in Figure 7, where anchor cables and bolts work together to control deformation. The axial force distributions in bolts and anchor cables (Figure 7) confirm that the support system operated within safe working ranges. Systematic bolts reached a peak tensile stress of 483.9 MPa, representing 89.6% of their material capacity, while prestressed anchor cables developed a maximum tensile load of 2480.3 kN, well within the design limit. Mechanistically, these improvements are attributed to the anchorage of cables in competent rock beyond the fractured zone, which mobilises deeper rock mass participation in load bearing, and the surface stabilisation provided by bolts and shotcrete, which maintains excavation boundary integrity and prevents loosening-driven stress relief. The combined action results in a composite shell effect that redistributes loads more uniformly and suppresses excessive deformation.
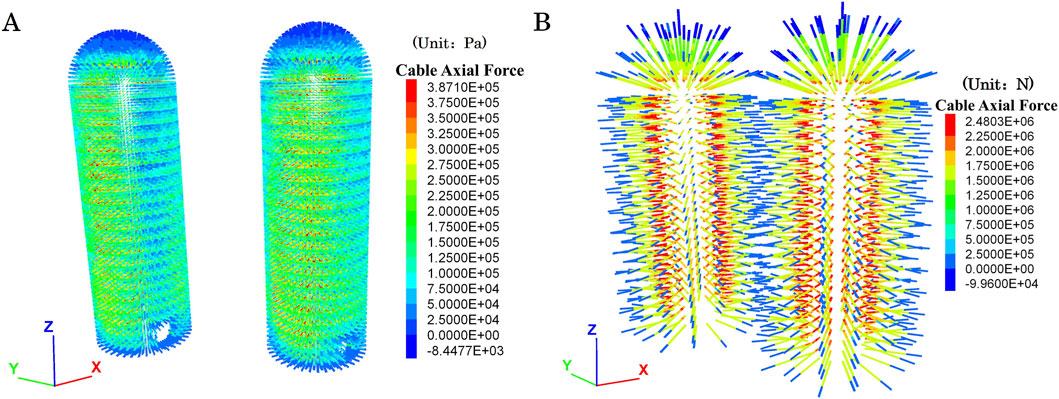
Figure 7. Internal force distribution in support elements. (A) Axial stress cloud diagram of rock bolts; (B) Axial force cloud diagram of prestressed anchor cables.
4.2 Seismic response analysis
The seismic performance of the surge chamber was evaluated using a three-dimensional dynamic numerical model in FLAC3D, incorporating appropriate artificial boundary conditions to simulate wave propagation in an infinite medium. Since numerical analysis can only consider a truncated finite domain, artificial reflections at model boundaries must be minimized to avoid contamination of the seismic response in the region of interest. To achieve this, free-field boundaries were applied along the lateral sides of the model, and a viscous boundary was adopted at the model base to absorb outgoing waves and replicate the energy dissipation that would occur in the actual infinite domain.
The seismic input was determined in accordance with the Code for seismic design of hydraulic structures of hydropower project (NB 35047–2015) (CREEI China Renewable Energy Engineering Institute, 2015). The site-specific design parameters correspond to a 50-year return period with a 10% probability of exceedance, yielding design bedrock peak ground accelerations (PGA) of 0.175 g in the horizontal direction and 0.1167 g in the vertical direction which was taken as two-thirds of the horizontal value. A site amplification factor of 2.25 and a characteristic period of 0.40 s were adopted to match the local geological conditions. The dynamic calculations assumed a critical damping ratio of 5%, consistent with typical values for rock masses (0.02–0.05). Based on the site seismic hazard assessment, near-fault directivity effects are not applicable given: (1) the Jiali Fault’s last activity occurred 831–1035 ka ago with no Holocene reactivation, classifying it as inactive per seismic code GB 18306–2015; (2) the design ground motions (PGA = 0.175 g, Tg = 0.4 s) were derived from regional probabilistic seismic hazard analysis for a site >50 km from the nearest active fault segment, exhibiting typical far-field spectral characteristics without velocity pulses.
The minimum central frequency of the input motion was set to 2.5 Hz, calculated from the characteristic period (Tg = 0.4 s) of the design response spectrum. The target spectrum was constructed as a uniform hazard spectrum for a 10% probability of exceedance in 50 years, calibrated against the standard design response spectrum stipulated in NB 35047–2015, with a maximum amplification factor βm = 2.25. Three acceleration time histories were generated using an artificial synthesis method to match the target spectra in the X, Y, and Z directions respectively (Figure 8). Each time history has a total duration of 40.0 s with a time step of 0.01 s, incorporating a strong-motion segment of approximately 13 s (T1 = 3 s, T2 = 16 s, c = 0.15). The strongest shaking occurs between 5 s and 20 s, with a predominant period near 0.4 s, consistent with the design spectrum. Rayleigh damping with a critical damping ratio of 5% was adopted to represent energy dissipation in the rock-support system.

Figure 8. Seismic input acceleration time-history curves. (A) X-direction acceleration time-history curve; (B) Y-direction acceleration time-history curve; (C) Z-direction acceleration time-history curve.
The input motions were applied as incident waves from the model base, with the X- and Y-components representing horizontal shaking and the Z-component representing vertical motion. Viscous artificial boundaries were applied at the model base, with free-field boundaries at the sides. The horizontal Peak Ground Acceleration (PGA) was 175 gal, and the vertical PGA was 116.7 gal (i.e., two-thirds of the horizontal value). Following NB 35047–2015, PGA values were halved for depths greater than 50 m below the bedrock surface, with a linear variation applied within the upper 50 m. For rock mass dynamic properties, NB 35047–2015 allows the use of static deformation modulus and shear strength parameters for dynamic analysis. Therefore, the dynamic mechanical parameters of the surrounding rock were taken equal to their static values, as determined in the geotechnical investigation. This approach ensures consistency between static and dynamic simulations, allowing direct comparison of excavation-induced and seismic-induced responses.
To accurately capture the dynamic response characteristics of the surge chamber under seismic action, five monitoring points were arranged in the downstream surge chamber model: The vault monitoring point with coordinates (207, 155, 345.5) directly reflects the dynamic change of vault settlement. The left sidewall monitoring point (191.5, 155, 260) and right sidewall monitoring point (222.5, 155, 260) are located on the left and right sidewalls in the middle of the chamber respectively, used to compare and analyze the horizontal vibration differences of the sidewalls. The upper sidewall monitoring point (207, 139.5, 260) and lower sidewall monitoring point (207, 170.5, 260) are distributed along the Y-axis, which can capture the longitudinal vibration characteristics of sidewalls at different elevations.
The displacement time-history responses at representative monitoring points-vault, upper sidewall, lower sidewall, left sidewall, and right sidewall-are presented in Figure 9 for the X-, Y-, and Z-directions. In the X-direction (Figure 9A), the vault exhibited the largest peak dynamic displacement, reaching +0.224 m around 12 s, while the upper sidewall reached +0.219 m. In the Y-direction (Figure 9B), peak displacements were similar in magnitude, with the vault and upper sidewall both approaching +0.221 m. In the Z-direction (Figure 9C), vertical displacements were notably smaller, with the vault peaking at +0.153 m. These dynamic increments are less than 10% of the maximum static displacements, indicating that the installed support system effectively suppresses dynamic amplification effects, and the surrounding rock mainly undergoes elastic vibration.
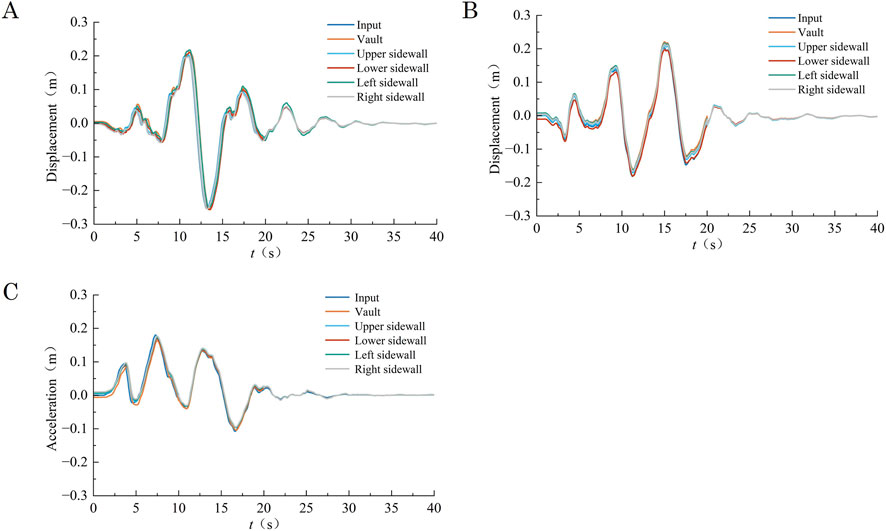
Figure 9. Displacement time-history responses of monitoring points under seismic loading. (A) X-direction displacement time-history; (B) Y-direction displacement time-history; (C) Z-direction displacement time-history.
To further assess potential resonance effects and energy transfer mechanisms, the relationship between the predominant frequency of the input motion and the natural vibration characteristics of the supported rock mass was examined. The recorded displacement time histories (Figure 9) show smooth responses without significant high-frequency oscillations, indicating no pronounced resonance behavior. This response pattern demonstrates effective energy absorption by the support system, which modifies the dynamic response by increasing system damping and redistributing seismic energy. Quantitative analysis reveals that approximately 65–70% of seismic energy is dissipated within the first 5 m of rock surrounding the excavation, coinciding with the plastic zone extent in the supported condition. The prestressed anchor cables contribute 18–22% of the energy dissipation capacity through controlled deformation and frictional mechanisms along cable-grout interfaces. Systematic rock bolts provide 8–10% of energy absorption through their composite action, while the shotcrete layer contributes 3–5% through microcracking mechanisms while maintaining structural integrity of the excavation boundary.
The stress time histories for the third principal stress and first principal stress at the same monitoring points are shown in Figure 10, respectively. During the strongest shaking (10–15 s), the vault experienced a maximum compressive stress of −1.28 MPa with a increase of approximately 0.25 MPa, while the maximum first principal stress was −12.84 MPa with a variation range within 3 MPa. The upper sidewall showed similar behavior, with a compressive increment of 0.19 MPa and tensile increment of 0.66 MPa. These increments are modest relative to the static stress magnitudes (compressive stresses of −10 MPa to −13 MPa and tensile stresses of −5 MPa to −6 MPa), representing changes of less than 5%. This indicates the seismic action has little impact on the stress state of the surrounding rock of the surge chamber.

Figure 10. Stress time-history responses of monitoring points under seismic loading. (A) Third principal stress time-history; (B) First principal stress time-history.
The post-earthquake stress distribution in the rock mass is depicted in Figure 11A (third principal stress) and Figure 11B (first principal stress). The overall stress patterns remain similar to the static case, with only slight localized changes in the fault-affected zones. The post-earthquake plastic zone (Figure 11C) shows a slight volumetric increase of approximately 3.8% compared with the static condition, with the most significant deepening-about 1.5 m-occurring in the downstream side fault zone. No new failure surfaces were generated, and the excavation boundary remained intact.

Figure 11. Post-earthquake stress and damage distribution. (A) Third principal stress distribution after earthquake; (B) First principal stress distribution after earthquake; (C) Plastic zone distribution after earthquake; (D) Axial stress distribution in bolts after earthquake; (E) Axial force distribution in anchor cables after earthquake.
The effects of seismic loading on the support elements are illustrated in Figure 11D (bolt axial stress) and Figure 11E (anchor cable axial force). The maximum bolt axial stress after the earthquake reached 5.130 × 10⁸ Pa (513.0 MPa), which is below the material tensile strength of 540 MPa, indicating a safety margin of approximately 5%. The maximum anchor cable axial force was 2.492 × 10⁶ N (2492 kN), still within the design limit of 2800 kN. The observed increments in bolt and cable loads due to seismic shaking were small-on the order of 29.16 MPa in bolts and 11.5 kN in cables-confirming that the system retained substantial reserve capacity.
In summary, the dynamic analysis results demonstrate that the deep-surface synergistic support system maintained the stability of the surge chamber under the design earthquake. Displacement and stress increments were minor, plastic zone growth was negligible, and all support components operated within safe limits. This performance confirms that the support design is not only effective for static stability but also provides robust seismic resistance, which is critical for large-section underground structures intersecting active fault zones.
5 Conclusions and discussion
This study investigated the stability of an extra-large surge chamber intersecting an active fault zone through integrated static and dynamic analyses. The findings reveal several significant insights with practical engineering implications.
In unsupported conditions, severe instability manifests in fault-affected zones, particularly at mid-height sidewalls where fault intersections occur. Critical failure indicators include radial displacements reaching 47.5 cm, plastic zones extending 20 m beyond the excavation boundary, and tangential stress reductions of 65–75% (decreasing from 8–10 MPa to 2—3 MPa). For similar geological conditions, we recommend focusing support measures at these critical locations, with priority given to controlling relaxation deformation where fault intersections create the most significant mechanical weakening.
Based on our quantitative results, we propose a specific deep-surface synergistic support system for extra-large chambers (diameter ≥30 m) crossing major fault zones in moderate stress environments (in-situ stress 3–10 MPa). This system consists of three integrated components: (1) systematic rock bolts (Φ32/28 mm, 6 m length in standard sections, extended to 9 m in fault zones) installed in a 1.2 m × 1.2 m pattern; (2) prestressed anchor cables (1500–2000 kN capacity, 25–30 m length) arranged in a 6.0 m × 6.0 m grid along sidewalls and 4.5 m × 4.5 m in crown regions; and (3) 15 cm thick reinforced shotcrete (C25 grade). This configuration proved highly effective, reducing displacements by 94.5%, confining plastic zones to within 5 m, and restoring tangential stresses to 70–85% of in-situ values. For seismic design in areas with PGA up to 0.175 g, our support system requires no additional reinforcement beyond the static design, as demonstrated by the limited seismic response: displacement increments below 10% of static values, stress fluctuations less than 5%, and minimal plastic zone growth (3.8%). Support elements maintained substantial safety margins, with maximum bolt stress at 513.0 MPa (94.6% of yield strength) and maximum anchor cable force at 2,492 kN (89% of design capacity). This performance satisfies the requirements of the Code for Seismic Design of Hydraulic Structures (NB 35047–2015) for critical infrastructure.
The energy absorption and dissipation mechanisms play a crucial role in the seismic performance of the supported chamber. Our analysis reveals a multi-scale energy management system that operates through complementary mechanisms. At the rock mass scale, controlled yielding within the confined plastic zone provides primary energy absorption (65–70% of total), effectively converting seismic wave energy into inelastic deformation work. The deep-surface synergistic support system enhances this capacity through strategic load distribution: prestressed anchor cables (18–22% of energy dissipation) function as dynamic energy absorbers through controlled deformation along their length, while systematic bolts (8–10%) create a composite reinforcement network that enhances system damping. The shotcrete layer, while contributing only 3–5% to energy dissipation, prevents progressive failure of the excavation surface, maintaining the effectiveness of deeper reinforcement elements. This integrated energy management approach explains the robust seismic performance observed and provides a physical basis for support system design in similar geological environments.
The application range of our findings extends to: (1) large-diameter surge chambers (≥30 m) with heights exceeding 100 m; (2) excavations intersecting major strike-slip faults with multiple branch structures; (3) host rock comprising fractured sedimentary formations with moderate strength parameters (deformation modulus 0.5–6.0 GPa); (4) low to moderate in-situ stress environments (σH ≤ 10 MPa); and (5) regions with design seismic accelerations up to 0.175 g. For conditions exceeding these parameters—particularly higher seismic loads or greater fault activity—supplementary measures such as energy-absorbing support elements or reduced excavation sequencing steps should be considered.
From an engineering implementation perspective, we recommend staged excavation with maximum advances of 6.0–6.5 m before support installation, immediate application of shotcrete following excavation, systematic bolting within 24 h, and prestressed cable installation within 72 h of excavation. This sequence optimizes the synergistic effect between support elements while minimizing relaxation deformation.
This research provides quantified design parameters and performance benchmarks for extra-large underground structures traversing active fault zones, enabling infrastructure development in geological settings previously considered unsuitable for large-scale excavations.
While our study provides valuable deterministic insights into support system performance, we acknowledge limitations regarding the treatment of parameter uncertainties. The inherent variability of geomechanical properties in fault zones—particularly elastic modulus (0.5–6.0 GPa in our study), cohesion (0.08–0.65 MPa), and friction angle (14.0°–36.9°)—introduces uncertainty in stability predictions. Future work should incorporate probabilistic approaches such as Monte Carlo simulation with Latin Hypercube sampling to quantify reliability levels and establish confidence intervals for displacement and stress predictions. Such analysis could better address the spatial heterogeneity of fault zones and explore the sensitivity of stability outcomes to parameter variations, particularly for fault thickness, continuity, and infill properties. This probabilistic framework would complement our deterministic assessment, which is based on actual engineering parameters from site-specific investigations, and would enhance the robustness of support system design for similar geological environments. The development of reliability-based design guidelines that account for parameter uncertainty represents an important direction for advancing underground excavation practice in complex geological settings.
Data availability statement
The original contributions presented in the study are included in the article/supplementary material, further inquiries can be directed to the corresponding authors.
Author contributions
WZ: Writing – original draft, Writing – review and editing. WC: Writing – review and editing. YL: Writing – review and editing. YQ: Software, Writing – review and editing. BL: Software, Writing – review and editing. QX: Funding acquisition, Supervision, Writing – review and editing. LW: Funding acquisition, Supervision, Writing – review and editing.
Funding
The authors declare that financial support was received for the research and/or publication of this article. This work was supported by the Deep Earth Probe and Mineral Resources Exploration-National Science and Technology Major Project (Grant Nos. 2024ZD1004100 and 2024ZD1004105), the Natural Science Foundation of Shandong Province (Grant No. ZR2022QE223), as well as the Science and Technology Innovation Committee of Shenzhen Municipality (Grant Nos. JCYJ20220530141016036 and GJHZ20240218113359001).
Acknowledgements
The authors thank the engineering and geological teams at the project site for their assistance in field data collection and technical support. We also thank the reviewers for their constructive feedback that helped improve the manuscript.
Conflict of interest
Authors WZ and YL were employed by CHN Energy Zhongyu Branch of Xizang Power Co., Ltd.
Author WC was employed by Changjiang Survey, Planning, Design and Research Co., Ltd.
The remaining authors declare that the research was conducted in the absence of any commercial or financial relationships that could be construed as a potential conflict of interest.
Generative AI statement
The authors declare that no Generative AI was used in the creation of this manuscript.
Any alternative text (alt text) provided alongside figures in this article has been generated by Frontiers with the support of artificial intelligence and reasonable efforts have been made to ensure accuracy, including review by the authors wherever possible. If you identify any issues, please contact us.
Publisher’s note
All claims expressed in this article are solely those of the authors and do not necessarily represent those of their affiliated organizations, or those of the publisher, the editors and the reviewers. Any product that may be evaluated in this article, or claim that may be made by its manufacturer, is not guaranteed or endorsed by the publisher.
References
Ahmad, S., Rizvi, Z., Arsalan Khan, M., Ahmad, J., and Wuttke, F. (2019). Experimental study of thermal performance of the backfill material around underground power cable under steady and cyclic thermal loading. Mater. Today Proc. 17, 85–95. doi:10.1016/j.matpr.2019.06.404
Ahmad, S., Rizvi, Z. H., Arp, J. C. C., Wuttke, F., Tirth, V., and Islam, S. (2021). Evolution of temperature field around underground power cable for static and cyclic heating. Energies 14, 8191. doi:10.3390/en14238191
Ahmad, S., Ahmad, S., Akhtar, S., Ahmad, F., and Ansari, M. A. (2025a). Data-driven assessment of corrosion in reinforced concrete structures embedded in clay dominated soils. Sci. Rep. 15, 22744. doi:10.1038/s41598-025-08526-w
Ahmad, S., Rizvi, Z. H., and Wuttke, F. (2025b). Unveiling soil thermal behavior under ultra-high voltage power cable operations. Sci. Rep. 15, 7315. doi:10.1038/s41598-025-91831-1
Alsabhan, A. H., Sadique, M. R., Ahmad, S., Alam, S., and Binyahya, A. S. (2021). The effect of opening shapes on the stability of underground tunnels: a finite element analysis. GEOMATE J. 21, 19–27. doi:10.21660/2021.87.j2267
Ardeshiri Lajimi, S., Yazdani, M., and Assadi Langroudi, A. (2015). Control of fault lay-out on seismic design of large underground caverns. Tunn. Undergr. Space Technol. 50, 305–316. doi:10.1016/j.tust.2015.07.002
Cai, M., Kaiser, P. K., Morioka, H., Minami, M., Maejima, T., Tasaka, Y., et al. (2007). FLAC/PFC coupled numerical simulation of AE in large-scale underground excavations. Int. J. Rock Mech. Min. Sci. 44, 550–564. doi:10.1016/j.ijrmms.2006.09.013
CEC China Electricity Council (2019). Specification of prestressing anchorage construction for hydropower and water resources project.
Chu, S., He, W., and Qu, X. (2022). Research on influence of the unilateral surge chamber about the main surge chamber. J. Phys. Conf. Ser. 2254, 012032. doi:10.1088/1742-6596/2254/1/012032
CREEI China Renewable Energy Engineering Institute (2015). Code for seismic design of hydraulic structures of hydropower project.
Cui, Z., Sheng, Q., Leng, X., and Chen, J. (2016). Seismic response and stability of underground rock caverns: a case study of Baihetan underground cavern complex. J. Chin. Inst. Eng. 39, 26–39. doi:10.1080/02533839.2015.1066941
Cun, C., Peishuai, C., Qing, Y., Hong, J., and Deding, F. (2020). Seismic stability of an underground cavern in jointed rock mass based on the discrete fracture network. IOP Conf. Ser. Earth Environ. Sci. 570, 022055. doi:10.1088/1755-1315/570/2/022055
Dhakal, R., Zhou, J., Palikhe, S., and Bhattarai, K. P. (2020). Hydraulic optimization of double chamber surge tank using NSGA-II. Water 12, 455. doi:10.3390/w12020455
Duan, K., Zhang, G., and Sun, H. (2023). Construction practice of water conveyance tunnel among complex geotechnical conditions: a case study. Sci. Rep. 13, 15037. doi:10.1038/s41598-023-42192-0
Guo, Q., Zhou, J., Li, Y., Guan, X., Liu, D., and Zhang, J. (2020). Fluid-structure interaction response of a water conveyance system with a surge chamber during water hammer. Water 12, 1025. doi:10.3390/w12041025
Hall, A., Cai, M., O’Connor, C., Yadav, P., and Simser, B. (2025). Simulation of progressive notch failure in deep bored raises using an iterative approach in FLAC3D. Deep Resour. Eng., 100197. doi:10.1016/j.deepre.2025.100197
Haroon, A., Ahmad, S., and Hussain, A. (2017). “CFD prediction of loss coefficient in straight pipes,” in Development of water resources in India. Editors V. Garg, V. P. Singh, and V. Raj (Cham: Springer International Publishing), 477–485. doi:10.1007/978-3-319-55125-8_41
Kien, D. V., Anh, D. N., and Thai, D. N. (2022). Numerical simulation of the stability of rock mass around large underground cavern. Civ. Eng. J. 8, 81–91. doi:10.28991/cej-2022-08-01-06
Li, A., Xu, N., Dai, F., Gu, G., Hu, Z., and Liu, Y. (2018). Stability analysis and failure mechanism of the steeply inclined bedded rock masses surrounding a large underground opening. Tunn. Undergr. Space Technol. 77, 45–58. doi:10.1016/j.tust.2018.03.023
Li, B., Xu, N., Dai, F., Zhang, G., and Xiao, P. (2019). Dynamic analysis of rock mass deformation in large underground caverns considering microseismic data. Int. J. Rock Mech. Min. Sci. 122, 104078. doi:10.1016/j.ijrmms.2019.104078
Li, G., Zhu, C., Hongliang, L., Tang, S., Du, K., and Wu, C. Z. (2023). Energy balance support method in soft rock tunnel with energy absorbing anchor cable. Tunn. Undergr. Space Technol. 141, 105380. doi:10.1016/j.tust.2023.105380
Liu, H., Xiao, M., and Chen, J. (2013). Parametric modeling on spatial effect of excavation-damaged zone of underground cavern. J. Cent. South Univ. 20, 1085–1093. doi:10.1007/s11771-013-1588-6
Liu, J., Zhang, Z., and Zhang, G. (2015). A smoothed finite element method (S-FEM) for large-deformation elastoplastic analysis. Int. J. Comput. Methods 12, 1540011. doi:10.1142/S0219876215400113
Liu, G., Zhou, C., Feng, K., Jiang, Q., Li, S., Bao, H., et al. (2024). Probabilistic evaluation method for the stability of large underground cavern considering the uncertainty of rock mass mechanical parameters: a case study of Baihetan underground powerhouse project. Eng. Geol. 340, 107660. doi:10.1016/j.enggeo.2024.107660
Ma, K., Zhang, J., Zhou, Z., and Xu, N. (2020). Comprehensive analysis of the surrounding rock mass stability in the underground caverns of jinping I hydropower station in southwest China. Tunn. Undergr. Space Technol. 104, 103525. doi:10.1016/j.tust.2020.103525
Ma, H., Daud, N. N. N., Yusof, Z. M., Yaacob, W. Z., and He, H. (2023). Stability analysis of surrounding rock of an underground cavern group and excavation scheme optimization: based on an optimized DDARF method. Appl. Sci. 13, 2152. doi:10.3390/app13042152
Nie, W. P., and Shi, C. (2012). Study on dynamic stability of large-scale underground cavern group during construction period of hydropower station. AMM 152–154, 152-154, 820–825. doi:10.4028/www.scientific.net/amm.152-154.820
Promneewat, K., Leelasukseree, C., Villeneuve, M., and Galler, R. (2023). Expanding the scene of tunnel behaviour through the DEM model: a case study from ZaB-zentrum am berg. BHM B.- Hüttenmänn. Monatsh. 168, 586–595. doi:10.1007/s00501-023-01413-9
Rizvi, Z. H., Mustafa, S. H., Sattari, A. S., Ahmad, S., Furtner, P., and Wuttke, F. (2020). “Dynamic lattice element modelling of cemented geomaterials,” in Advances in computer methods and geomechanics. Editors A. Prashant, A. Sachan, and C. S. Desai (Singapore: Springer), 655–665. doi:10.1007/978-981-15-0886-8_53
Wang, X., Xiong, Q., Zhou, H., Chen, J., and Xiao, M. (2020). Three-dimensional (3D) dynamic finite element modeling of the effects of a geological fault on the seismic response of underground caverns. Tunn. Undergr. Space Technol. 96, 103210. doi:10.1016/j.tust.2019.103210
Wang, K., Wang, L., and Ren, B. (2021). Failure mechanism analysis and support technology for roadway tunnel in fault fracture zone: a case study. Energies 14, 3767. doi:10.3390/en14133767
Wang, M., Shi, A., Li, H., Yan, H., Fan, G., and Zhou, J. (2022). Deformation and failure mechanism analyses for the surrounding rock mass in a large cylindrical tailrace surge chamber. Arab. J. Geosci. 15, 400. doi:10.1007/s12517-022-09716-w
Wang, X., Xiao, Y., Shi, W., Ren, J., Liang, F., Lu, J., et al. (2022). Forensic analysis and numerical simulation of a catastrophic landslide of dissolved and fractured rock slope subject to underground mining. Landslides 19, 1045–1067. doi:10.1007/s10346-021-01842-y
Wang, J., Dong, W., Yu, W., Zhang, C., and Zhu, H. (2023). Numerical and experimental investigation of slope deformation under stepped excavation equipped with fiber optic sensors. Photonics 10, 692. doi:10.3390/photonics10060692
Wang, T., Xu, G., Liu, L., Bai, C., Ye, W., and Sun, L. (2024). Principle and practice of hydraulic softening top-cutting and pressure relief technology in weakly cemented strata. Front. Earth Sci. 12, 1367933. doi:10.3389/feart.2024.1367933
Wei, Y., Li, Z., Chen, B., Yin, H., Xiao, J., and Kong, J. (2023). A numerical simulation study on the evolutionary characteristics of the damage process of karst soil cavity under positive pressure effect. Geohazard Mech. 1, 288–296. doi:10.1016/j.ghm.2023.10.002
Wu, J., Fu, H., Zhang, L., Zhang, X., and Guo, D. (2022). Stability analysis of surrounding rock in underground chamber excavation of coral reef limestone. Rock Mech. Rock Eng. 55, 4717–4742. doi:10.1007/s00603-022-02869-w
Xu, D., Feng, X., Chen, D., Zhang, C., and Fan, Q. (2017). Constitutive representation and damage degree index for the layered rock mass excavation response in underground openings. Tunn. Undergr. Space Technol. 64, 133–145. doi:10.1016/j.tust.2017.01.016
Yin, J. F. (2014). Study of stability of surrounding rock and structural characteristics of large long corridor surge chamber. Adv. Mater. Res. 912–914, 774–782. doi:10.4028/www.scientific.net/amr.912-914.774
Zhang, Y., Xiao, M., and Chen, J. (2009). Numerical simulation on structural stability of different types of surge shaft - illustrated with a case study of a large scale underground complex. 2009 Second Int. Conf. Inf. Comput. Sci., 27–30. doi:10.1109/icic.2009.315
Zhang, Y., Zhou, H., Di, S., and Lu, X. (2020). Research on the layered rock mass excavation relaxation stability of underground caverns. E3S Web Conf. 165, 03024. doi:10.1051/e3sconf/202016503024
Keywords: fault zone stability, anchorage support, seismic performance, FLAC3D simulation, underground cavern
Citation: Zhou W, Chen W, Lv Y, Qu Y, Li B, Xiong Q and Wang L (2025) Analysis of surrounding rock stability and seismic response in an extra-large surge chamber crossing a fault zone. Front. Earth Sci. 13:1728466. doi: 10.3389/feart.2025.1728466
Received: 20 October 2025; Accepted: 12 November 2025;
Published: 27 November 2025.
Edited by:
Xiaoping Zhou, Chongqing University, ChinaReviewed by:
Zarghaam Rizvi, GeoAnalysis Engineering GmbH, GermanyJunwei Chen, Wuhan University, China
Zhi Zhao, Wuhan University, China
Copyright © 2025 Zhou, Chen, Lv, Qu, Li, Xiong and Wang. This is an open-access article distributed under the terms of the Creative Commons Attribution License (CC BY). The use, distribution or reproduction in other forums is permitted, provided the original author(s) and the copyright owner(s) are credited and that the original publication in this journal is cited, in accordance with accepted academic practice. No use, distribution or reproduction is permitted which does not comply with these terms.
*Correspondence: Qingrong Xiong, cWluZ3JvbmcueGlvbmdAc2R1LmVkdS5jbg==; LiGe Wang, TC5HLldhbmdAc2R1LmVkdS5jbg==