Abstract
Landslides cause severe ecological, human, and economic losses globally, with Fuyuan County in Yunnan Province, China, being a typical case. Accurate landslide susceptibility mapping (LSM) is crucial for disaster prevention and mitigation. Traditional methods struggle to meet contemporary needs, so this study employs advanced integrated machine learning models (LightGBM and XGBoost) to assess landslide susceptibility in the county, comparing them with traditional models. The LightGBM model performed best, achieving an AUC of 0.89, accuracy of 84.10%, and F1-score of 83.17%. It also demonstrated excellent stability—characterized by low uncertainty, narrow confidence intervals, and consistent discriminative ability across multiple resamplings—with outstanding reliability. Frequency ratio analysis identified key factors facilitating landslides: weak mudstone lithology, proximity to rivers (<200 m), and high mining density (0.098–0.149). Dense vegetation and hard limestone, however, reduce landslide risks. SHAP analysis further revealed that mining density is the most significant influencing factor, with a synergistic effect with river proximity that jointly exacerbates landslide susceptibility. The generated susceptibility zoning map identifies most areas of Dahe Town, Yingshang Town, and Zhuyuan Town as very high susceptibility zones, which highly aligns with historical landslide records and field survey results. The study emphasizes the need to strictly restrict mining activities in very high susceptibility zones and riparian areas, while comprehensively implementing slope reinforcement, vegetation restoration, and mine reclamation measures. These findings provide a scientific theoretical framework for global landslide research.
1 Introduction
Earth functions as a complex dynamical system governed by continuous geological processes that manifest as diverse natural hazards (Zhang et al., 2024). Among these phenomena, landslides represent one of the most pervasive and destructive geomorphic events, formally characterized as gravitationally driven mass movements of rock, soil, or debris along pre-existing or nascent failure surfaces (Hungr et al., 2014). Globally, these events cause >4,000 fatalities annually and incur economic losses exceeding US$4 billion, with disproportionate impacts on mountainous and hillslope communities (Gariano and Guzzetti, 2016). Southwestern China’s tectonically active convergence zone—encompassing Yunnan and Guizhou provinces—experiences elevated landslide susceptibility due to neotectonic forcing, extreme topographic gradients, heterogeneous lithologies, and high-intensity monsoonal precipitation (Ye et al., 2024; Zhang et al., 2023). According to an official report from China’s Ministry of Emergency Management, in the first half of 2025, geological disasters occurred frequently in the southwestern region. A total of 74 dead and missing persons were reported due to geological disasters in the four provinces (autonomous regions) of Yunnan, Sichuan, Guizhou, and Tibet, accounting for 88.1% of the national total. Nearly 200 houses collapsed, over 900 houses were damaged, and the direct economic losses amounted to 280 million yuan.
Fuyuan County epitomizes this hazardous environment, where rugged terrain and extreme rainfall events interact with anthropogenic perturbations from mining operations, infrastructure development, and land-cover modifications to chronically destabilize slopes (Liu et al., 2023). On 2 July 2013, a landslide occurred near Xinshuzhu Village, Jiuhé Village Committee and Mohong Town in Fuyuan County, Yunnan Province, which collapsed three staff dormitories of the local Xinxin Coal Mine. The disaster resulted in ten workers being buried, with six fatalities (Yang et al., 2015).
Landslide susceptibility mapping (LSM) constitutes a valuable methodology for addressing such geohazard challenges (Reichenbach et al., 2018). Through the integration of topographic, geological, hydrological, and land cover data within a Geographic Information System (GIS) environment, LSM delivers critical guidance for regional geological hazard prevention and mitigation (Guzzetti et al., 1999; Chung and Fabbri, 2003). Since the 1960s, researchers globally have investigated diverse LSM methodologies, broadly classifiable into three primary categories: 1) knowledge-driven models, 2) traditional data-driven models, and 3) data-driven models employing machine learning techniques (Manan et al., 2022).
Knowledge-driven models principally encompass the Analytic Hierarchy Process (AHP), fuzzy comprehensive evaluation, expert scoring, and fuzzy logic methodologies (Hamedi et al., 2025; Li et al., 2025; Razavizadeh et al., 2017; Ali et al., 2025; Zighmi et al., 2025; Nanehkaran et al., 2021). These approaches offer advantages in implementation simplicity and interpretability, yet are susceptible to subjectivity due to heavy reliance on expert knowledge for assigning relative weights to causal factors. Illustratively, Liu et al. implemented AHP for LSM in China’s Greater Xi’an region, validating its efficacy for regional-scale hazard assessment (Liu et al., 2024). Wang et al. applied fuzzy logic with 13 contributing factors to evaluate coastal landslide susceptibility in the Asaluyeh Anticline (Zagros, Persian Gulf), yielding insights for global coastal hazard mitigation (Wang and Nanehkaran, 2024). However, these models feature relatively subjective interpretation and lack robust validation methods, making authenticity verification challenging. Consequently, their results have limited evaluation metrics and fail to meet current accuracy requirements.
Traditional data-driven models include the Information Value Method (IVM), Frequency Ratio (FR), and Weight of Evidence (WoE) (Yan et al., 2020; Peng et al., 2023; Asmare, 2023). These techniques typically quantify landslide susceptibility by calculating the spatial co-occurrence frequency between categorized influencing factors and historical landslide inventories. While avoiding complex mathematical formalization, they often neglect variable interactions. Biswas et al. employed an FR-GIS integrated approach for LSM in Gangtok subdivision, Sikkim, India, and proposed associated risk mitigation strategies (Biswas et al., 2023). Ahmad et al. conducted a comparative LSM analysis in Pakistan’s northwestern Reshun region using GIS-integrated AHP and FR models, with results showing FR’s superior predictive accuracy over AHP (Ahmad and Khan, 2023). Tesfa also performed LSM in Central Ethiopia’s Abbay Gorge near Dejen via GIS combined with AHP and FR methods (Tesfa, 2022). Nevertheless, traditional data-driven models face limitations in handling outliers and complex data structures, exhibit high dependency on data source accuracy, and are highly sensitive to evaluation factor classification schemes—divergent categorization can substantially influence outcomes.
In the field of geology and geotechnical engineering, accurately assessing the stability of underground structures and the mechanical behavior of rock and soil masses has always been a critical challenge. To address this issue, researchers often employ numerical simulation methods based on physical mechanisms (Alsabhan et al., 2021; Rizvi et al., 2020; Ahmad et al., 2021; Ahmad et al., 2019). With advancements in modern society and the rapid development of very high-resolution remote sensing (VHRRS) and geographic information systems (GIS), data acquisition and processing capabilities have been significantly enhanced (Ghayur Sadigh et al., 2024). In previous studies, machine learning (ML) has played a significant role in geological and geotechnical fields (Sahin, 2022; Mandal and Mandal, 2018; Ahmad et al., 2025a; Ahmad et al., 2025b). Concurrently, escalating demands for high-precision LSM have driven the widespread adoption of quantitative ML methods within landslide susceptibility research (Sahin, 2022). Representative algorithms include logistic regression, Naïve Bayes (NB), random forest (RF), support vector machines (SVM), ensemble learning techniques (RF/XGBoost/LightGBM), and deep learning neural networks (Mandal and Mandal, 2018; Ahmad et al., 2025a; Ahmad et al., 2025b; Shang et al., 2025; Kalantar et al., 2018; Badapalli et al., 2025; Zhao et al., 2021; Van Westen et al., 2008; Le et al., 2024; Moayedi et al., 2019; Ahadi and Rosta, 2024; Abgrami et al., 2025; Guo et al., 2023). These ML models excel at capturing complex nonlinear relationships among multiple predisposing factors, operate without stringent parametric assumptions when processing extensive datasets, and deliver significantly enhanced predictive accuracy compared to conventional approaches.
Yu et al. successfully implemented 4 ML algorithms—Adaptive Boosting (AdaBoost), Gradient Boosting Decision Tree (GBDT), Multi-Layer Perceptron (MLP), and RF—to predict landslide susceptibility in a susceptible region, leveraging 13 key influencing factors (Yu et al., 2023). Sahin conducted LSM in Ayancık District, Sinop Province (Turkey’s Black Sea region) using three ensemble tree methods: XGBoost, Gradient Boosting Machine (GBM), and RF, employing 15 causative factors and 105 landslide locations (70% training, 30% testing), results demonstrated the XGBoost optimal model’s superior predictive capability (Overall Accuracy = 0.8501, AUC = 0.8976), with statistical validation confirming its significant outperformance over optimized RF and GBM models (Sahin, 2020). Wang et al. performed an LSM study in the Chongqing section of China’s Three Gorges Reservoir area, classifying landslides into four magnitude categories (giant, large, medium, small) and selecting 13 influencing factors. Utilizing 7,777 historical landslide events, they developed a coupled ANN-NFR model within a GIS platform (Wang et al., 2024). However, inherent limitations in machine learning interpretability (Khan et al., 2025)—where internal operations function analogously to a “black box”—motivated the introduction of SHAP (SHapley Additive exPlanations) interpretability analysis to address this deficiency. Recently, SHAP interpretability analysis has emerged as a focal research domain within LSM, garnering significant scholarly attention globally (Al-Najjar et al., 2025). SHAP addresses the shortcomings of machine learning in qualitative analysis, functioning similarly to knowledge-driven approaches, thereby making the entire modeling process more scientific and comprehensive.
The Chinese government attaches great importance to the prevention and control of geological hazards in mountainous areas of Southwest China, investing substantial human, material, and financial resources annually in disaster mitigation efforts. However, many current landslide susceptibility models in certain southwestern mountainous regions remain overly simplified, lacking comparative analysis and quantitative uncertainty assessment, constrained by limited evaluation factors, and exhibiting weak interpretability (Zhu et al., 2025). This study conducts a comprehensive assessment and modeling of landslide susceptibility in Fuyuan County, Yunnan Province, systematically selecting 15 influencing factors, including geological structure, geomorphology, hydrometeorological conditions, and human activities. The objectives and innovations are as follows: 1) Establish a multi-model comparison framework through systematic evaluation of performance metrics such as ROC curves and precision-recall, and identify the most optimal and robust machine learning model via hyperparameter optimization for high-precision spatial mapping of landslide susceptibility; 2) Quantify uncertainty analysis using the bootstrap method to further verify the stability of model predictions and enhance research credibility; 3) Employ SHAP (SHapley Additive exPlanations) for interpretable analysis to quantitatively assess the contributions and interactions of environmental factors in the optimal model, revealing key triggering factors and their nonlinear mechanisms; 4) Generate high-resolution landslide susceptibility maps to provide data support and decision-making basis for regional geological disaster prevention, quantitative risk assessment, and land-use planning; 5) Develop a transferable and replicable framework for landslide susceptibility assessment, offering a paradigm reference and technical pathway for early warning systems in geologically similar regions globally. This study provides a novel perspective for understanding the coupling mechanisms of multiple factors in complex geological systems.
2 Study area and data resources
2.1 Study area
Fuyuan County is located in the eastern part of Yunnan Province, China, between 103°58′and 104°49′E longitude and 25°00′to 25°58′N latitude. It covers a total land area of approximately 3,348 square kilometers and has a population of around 675,200. The region’s climate transitions from a south temperate semi-humid zone in the south to a north subtropical mountain monsoon climate zone in the north. It experiences an average annual temperature of 13.8 °C, annual precipitation of approximately 1,421.1 mm, and approximately 1,773.9 h of sunshine per year. Fuyuan County is one of the most severely affected areas by landslides in Yunnan Province, characterized by their frequency, wide distribution, sudden onset, and destructive nature. According to historical data, approximately 239 landslides have occurred in the study area, with their spatial distribution shown in Figure 1.
FIGURE 1

Overview of the study area in Fuyuan County, China.
Fuyuan County lies at the boundary between the Eastern Yunnan Fold Belt of the Yangzi Paraplatform and the Southeastern Yunnan Fold Belt of the South China Fold System, delineated by the Neocathaysian Fuyuan-Mile Fault Zone. The northwest pertains to the Eastern Yunnan Fold Belt, and the southeast to the Southeastern Yunnan Fold Belt. This fault zone, a regional controlling structure, exhibits compressional-torsional characteristics with significant displacement and extensive length. Dominant tectonic systems include Shan-shaped, lotus-shaped, northeast-trending, northwest-trending, and arcuate structures. Fuyuan County displays diverse geomorphological types, including karst, erosional-tectonic, tectonic-erosional, denudational-tectonic, and planation-terrace landforms. Karst landforms, covering approximately one-third of the study area, are distributed from eastern Mohong to Laochang Heike, with intense karstification. Erosional-tectonic landforms (820 km2) occur along the Mohong-Dahe corridor. Tectonic-erosional landforms (740 km2), located in areas like Zhuyuan-Yingshang, are heavily incised by rivers and tectonic activity. Denudational-tectonic landforms (18 km2) are found in Zhong’an-Housuo. Planation-terrace landforms (85 km2), distributed along Xiaoyangchang-Yidehe, exhibit gentle topography.
2.2 Landslide inventory
The landslide disaster inventory is a critical component of Landslide Susceptibility Mapping, providing essential data support for model training and prediction. Through field surveys and historical data analysis, it was found that landslides in Fuyuan County predominantly occur in rock masses, Quaternary soil layers, and residual slope deposits, controlled by weak surfaces or joint fractures, exhibiting characteristics of “numerous points, wide coverage, and uneven distribution.” As shown in Figure 2, among the 12 townships in the county, Zhongan Township, Shengjing Township, and Gudan Township have fewer disaster points, while the other townships show more concentrated distributions. Landslides mostly occurred between 2000 and 2023, with June to September being the peak period. Approximately 50% of landslides are located in or near fault zones or stratigraphic contact zones, influenced by tectonic activities, resulting in poor rock mass integrity, fragmented rocks, well-developed joints, and thick weathered soil layers, which provide favorable conditions for landslide formation. Fuyuan County is rich in coal resources, with about one-quarter of its land area being coal-rich zones. A total of 186 coal mine shafts with a history of mining or still in production were documented, and mining activities have further exacerbated landslide risks.
FIGURE 2

Townships in Fuyuan county: (a) Landslide distribution, (b) Non-landslide distribution.
This study focuses on investigating the geological conditions of historical landslides and potential geological hazard points, combined with GF-1 (Gaofen-1) remote sensing imagery for county-wide geological disaster and environmental geology interpretation. In key areas, higher-precision QuickBird data was used to supplement the analysis, providing detailed baseline data for LSM. Ultimately, by integrating official records from the Yunnan Geological Survey Bureau (https://ynddj.org.cn/), optical remote sensing analysis, and field verification, a total of 239 historical landslide events across the 12 townships of Fuyuan County from 2000 to 2023 were compiled. Each event includes precise geographic coordinates, landslide scale, and movement type. Typical landslide site photos are shown in Figure 3.
FIGURE 3

Characteristics of landslides in the study area: (a) Shishanjiao landslide, (b) Fudi road landslide, (c) Abainuo landslide, (d) Nazuo landslide.
To effectively address the issues of class imbalance and spatial autocorrelation, this study employed a constrained random sampling method based on a GIS platform to systematically construct a balanced training dataset. Following established practices in landslide susceptibility mapping (Zhao et al., 2021; Guo et al., 2023), 239 non-landslide points were selected from geologically stable units in the ArcGIS environment to match the quantity of landslide points. The specific sampling constraints included: 1) spatial distribution uniformity constraint, ensuring sufficient dispersion of sample points in geographical space to reduce spatial autocorrelation effects; 2) geological environment matching constraint, maintaining comparability between non-landslide and landslide points in the distribution of key environmental factors (e.g., elevation, slope, lithology); and 3) stability verification constraint, confirming through remote sensing time-series monitoring and verification with geological reports that all selected areas have remained stable with no landslide records since official documentation began. This systematic sampling strategy not only effectively balanced the class distribution but also significantly reduced spatial dependency interference during model training, establishing a solid data foundation for developing a robust landslide susceptibility model. The spatial distribution of the ultimately adopted landslide and non-landslide points is shown in Figure 4.
FIGURE 4

The distribution of landslides and non-landslides in the study area.
2.3 Landslide causal factors
2.3.1 Database sources
In landslide susceptibility assessment, the selection of input factors directly determines the variable types and predictive accuracy of the model. Based on an in-depth analysis of landslide mechanisms and previous studies (Shang et al., 2025; Kalantar et al., 2018), this study systematically selects 15 variables across five categories: topographic (elevation, slope, aspect, plan curvature, profile curvature), geological (lithology, distance to faults), hydrological (distance to rivers, precipitation, TWI), environmental (FVC, land use), and anthropogenic (mine density, population density, distance to roads). These factors comprehensively cover the primary controls and triggering mechanisms of landslides, ensuring the model’s scientific rigor and completeness. Categorical variables are classified based on their original data sources, while continuous variables are retained in their raw form to meet the requirements of machine learning algorithms. Data sources are detailed in Table 1.
TABLE 1
| Data | Source | Resolution/Scale | Data type | Purpose |
|---|---|---|---|---|
| DEM | https://www.gscloud.cn/ | 30 m | Raster | Used for topographic factor extraction |
| Landslide points | Yunnan bureau of geological survey | 1:100,000 | Vector | Landslide inventory mapping |
| Roads and rivers | https://www.webmap.cn/ | 1:250,000 | Shapefile | Used for road and river factor extraction |
| Mean annual precipitation | National science & technology infrastructure (https://nesdc.org.cn/) | 500 m | Raster | Used for precipitation |
| Land use map | https://www.globeland30.org/ | 30 m | Raster | Used for land use factor extraction |
| Landsat 8 OLI images | https://www.gscloud.cn/ | 30 m | Raster | Used for FVC calculation |
| Geological map | Yunnan bureau of geological survey | 1:250,000 | Raster | Used for lithology factor extraction |
| Regional zoning report | Yunnan bureau of geological survey | 1:100,000 | Document | Used for mine density |
| Population density (2010–2020) | https://landscan.ornl.gov/ | 1 km | Raster | Used for population density factor extraction |
The data sources used in this study and their detailed information.
2.3.2 Topographic factors
The topographic variables selected for this study, as visualized in Figure 5, comprise elevation (a), slope (b), aspect (c), plan curvature (g), and profile curvature (h). Elevation determines terrain relief and climatic conditions, showing a positive correlation with landslide distribution, where steeper terrains at higher elevations generally correspond to increased susceptibility. Slope serves as a primary triggering factor, since steeper gradients promote higher shear stress and reduced slope stability. Aspect influences microclimatic conditions on slopes, with north-facing orientations often retaining greater moisture, thereby elevating landslide risk. Plan curvature and profile curvature respectively govern water convergence patterns and slope morphology changes, playing critical roles in landslide initiation and spatial propagation.
FIGURE 5
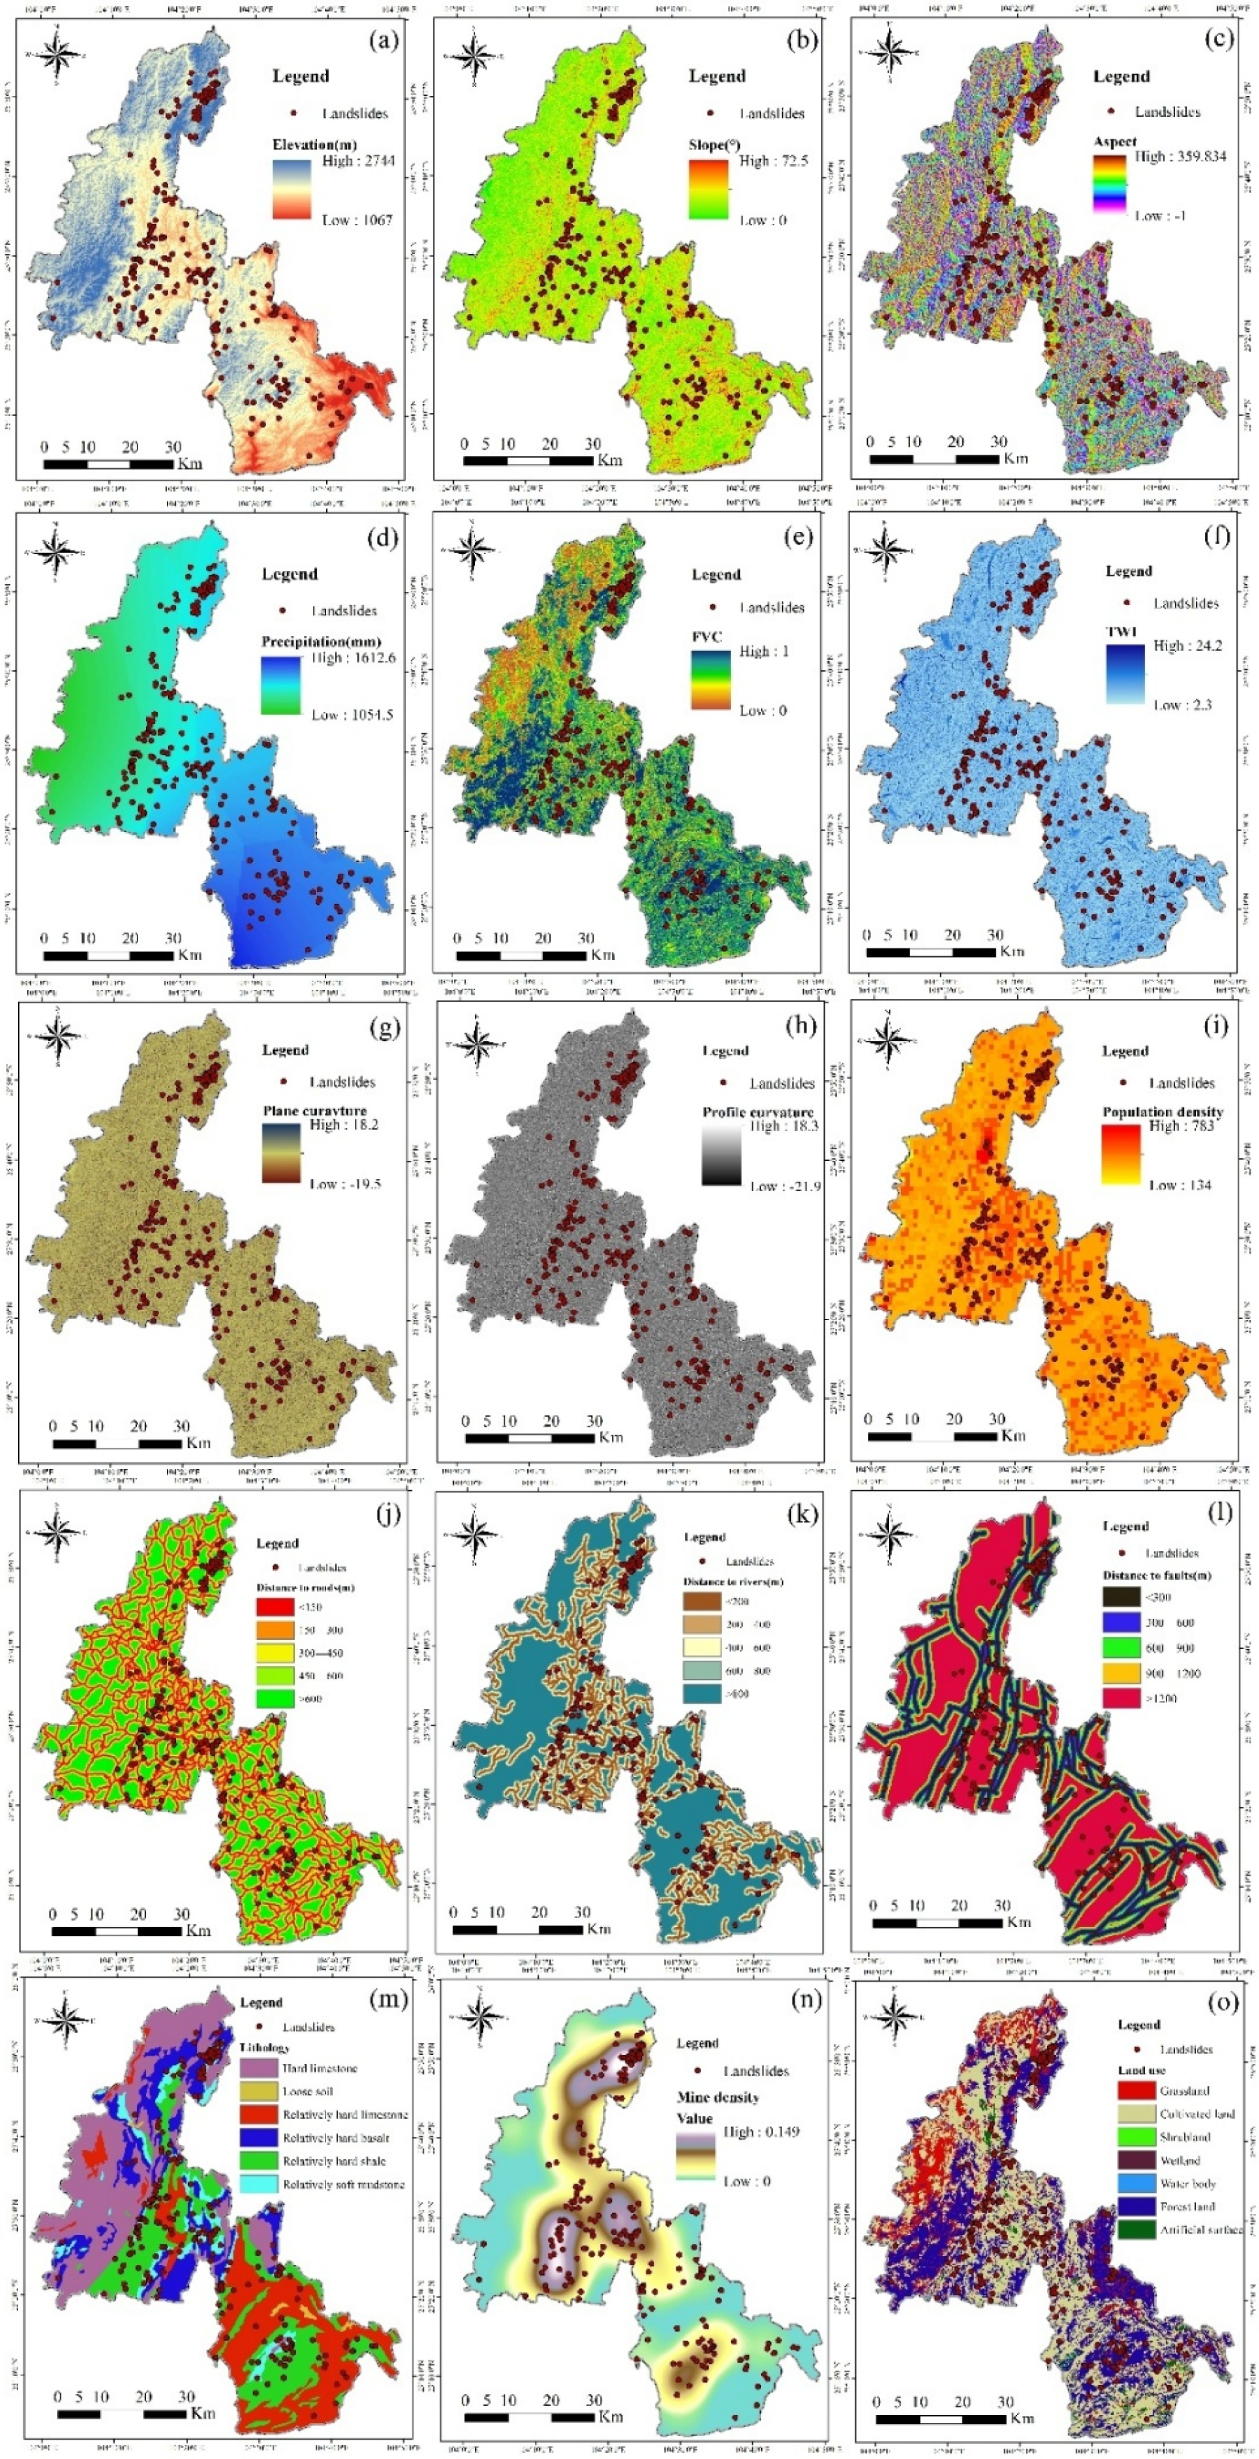
Landslide causal factors: (a) Elevation, (b) Slope, (c) Aspect, (d) Precipitation, (e) FVC, (f) TWI, (g) Plane curvature, (h) Profile curvature, (i) Population density, (j) Distance to roads, (k) Distance to rivers, (l) Distance to faults, (m) Lithology, (n) Mine density, (o) Land use.
2.3.3 Geological factors
Geological factors form the intrinsic basis for landslide occurrence by determining the mechanical properties and structural characteristics of rock and soil masses. This study adopts lithology (Figure 5m) and distance to faults (Figure 5i) as key geological variables. Lithology directly governs slope shear strength, with landslides predominantly developing in weak rock formations such as mudstone or Quaternary loose deposits due to their fragmented structure and well-developed joints. Distance to faults reflects the degree of tectonic disturbance, as areas proximate to fault zones exhibit intense fracturing and weathering, concentrating approximately 50% of recorded landslide events.
2.3.4 Hydrological factors
Hydrological factors directly trigger or exacerbate landslides by altering the subsurface water regime. This study incorporates three key variables—distance to rivers (Figure 5k), precipitation (Figure 5d), and the Topographic Wetness Index (TWI, Figure 5f)—to represent hydrological controls. Proximity to rivers elevates landslide susceptibility through continuous bank erosion that undermines slope toe integrity. Precipitation acts as a primary trigger, with intense rainfall during the June–September rainy season increasing pore-water pressure and reducing soil shear strength, corresponding to the historical peak in landslide occurrence. The TWI quantifies terrain-controlled moisture accumulation, where higher values indicate a greater propensity for soil saturation and slope failure. Supported by advances in big data analytics, the precipitation data (2000–2020) used in this study were obtained from the China National Meteorological Data Service Center and processed through the following standardized procedures:
The meteorological data from national weather stations, preprocessed in FoxPro, were georeferenced as point coverages in Arc/Info. Spatial interpolation of annual mean precipitation (Pa) was performed using Inverse Distance Weighting (IDW), implemented through the following Equation 1:
Where Wi represents the distance-decay weighting coefficient for the ith observation point. Here, (s0) represents the predicted precipitation at location s0, P (si) denotes observed precipitation at station, i,d (s0,si) is the Euclidean distance between s0 and si, and p = 2 was used as the power parameter. The interpolation generated a continuous precipitation surface across China at 500 m × 500 m resolution, with search parameters constrained to incorporate a minimum of five neighboring stations within a 15 km radius to ensure data reliability while accounting for spatial autocorrelation.
2.3.5 Environmental factors
Environmental factors indirectly regulate landslide probability by influencing surface protection and soil integrity. This study examines fractional vegetation cover (FVC, Figure 5e) and land use types (Figure 5o) as critical environmental determinants. FVC directly reflects vegetation’s slope-stabilizing capacity through root reinforcement and erosion mitigation, with exposed low-FVC areas demonstrating significantly higher landslide susceptibility—a correlation clearly established through remote sensing analysis. Land use patterns further modulate slope stability, where anthropogenic modifications in farmland and built-up areas frequently disrupt natural terrain integrity, substantially elevating landslide hazards.
2.3.6 Anthropogenic factors
Anthropogenic activities significantly amplify landslide susceptibility by modifying topographic, geological, and hydrological conditions. This study incorporates three key anthropogenic variables: mine density (Figure 5n), population density (Figure 5l), and distance to roads (Figure 5j). Mining operations induce surface disturbance and rock mass fragmentation, with areas of high mining density demonstrating markedly elevated landslide risk—a pattern substantiated by spatial correlation analysis across 186 documented coal mines. Population density serves as a proxy for human activity intensity, where concentrated engineering interventions such as construction projects frequently compromise slope integrity. Similarly, road development through slope excavation generates permanent terrain alterations, significantly elevating failure propensity in adjacent zones through cut-slope destabilization and drainage disruption.
3 Methodology
3.1 LSM construction
3.1.1 Data extraction and preprocessing
Landslide conditioning factors were screened via variance inflation factor (VIF) diagnostics to eliminate redundancy and improve model efficiency. Optimal factors were spatially extracted to 239 landslide and 239 non-landslide points using ArcGIS Pro’s Extract Multi Values to Points tool. The 478-sample dataset was randomly shuffled and split in Python (80% training, 20% validation) to ensure unbiased distribution. All analyses adopted a 30-m spatial resolution, and geospatial data layers were standardized to the WGS_1984_UTM_Zone_48N coordinate system, guaranteeing methodological consistency and geographical accuracy.
3.1.2 Model development and implementation
The framework was built with Python 3.9 and scikit-learn, including ensemble methods (XGBoost, LightGBM) and comparative benchmarks (LR, NB, KNN, SVM, RF, ANN). Features were preprocessed via z-score normalization, with hyperparameter optimization conducted through 5-fold random search (targeting regularization, tree parameters, kernel settings, and ANN layer configurations). Model robustness was enhanced by early stopping and stratified sampling, with final evaluation using standard performance metrics.
3.1.3 Model verification
Model performance was assessed by its ability to distinguish outcome categories, identify positive/negative instances, minimize classification errors, and align with reference standards. This comprehensive evaluation provided a solid basis for cross-model comparison.
3.1.4 Model uncertainty quantification
To evaluate the reliability of landslide susceptibility predictions in complex geographical environments, this study used a 500-iteration bootstrap resampling approach to generate multiple resampled training sets, train corresponding ensemble learning models, and quantify prediction uncertainty via the distribution (central tendency and dispersion) of the models’ performance metrics on an independent test set.
3.1.5 Landslide Susceptibility Mapping
The optimal model was selected based on core metrics. The study area (over 3.59 million grid cells) was converted to CSV format, and susceptibility values were assigned to each cell using the trained model. ArcGIS Pro generated and classified the Fuyuan County susceptibility map into five levels (very high, high, moderate, low, very low), validated against historical landslide inventories. SHAP analysis evaluated factor importance to reveal landslide causal mechanisms (Figure 6).
FIGURE 6
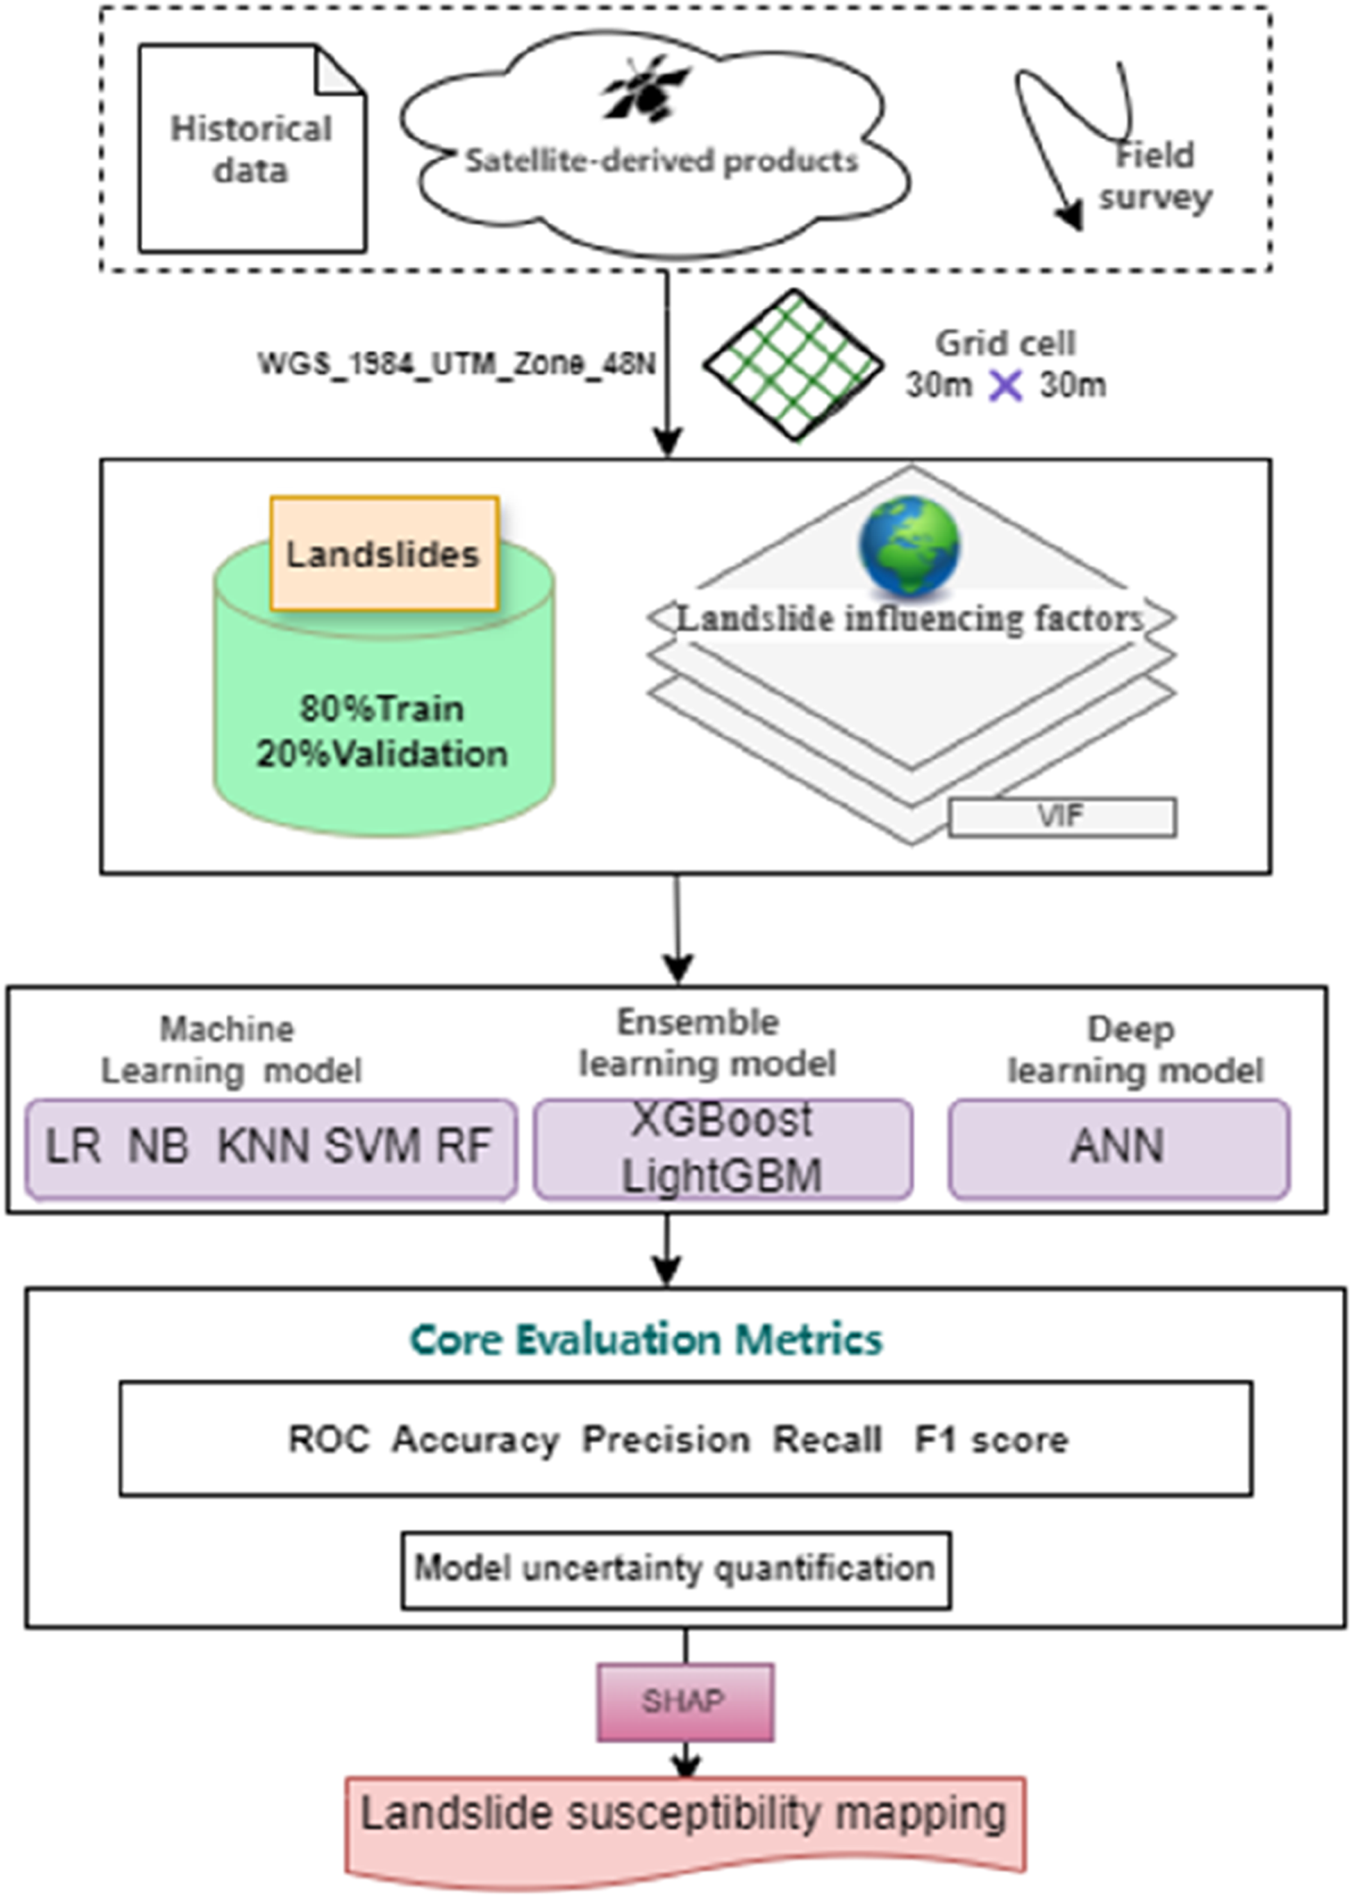
Research flowchart.
3.2 Factor diagnosis
Modern machine learning algorithms (e.g., decision trees, neural networks, kernel methods) inherently capture nonlinear feature interactions, with L1/L2 regularization and Dropout effectively suppressing linearly redundant feature adverse effects. Since Pearson correlation coefficients only detect linear associations, this study uses VIF detection instead. In applications like landslide susceptibility mapping, VIF is a critical diagnostic tool for model robustness and interpretability (Guoliang et al., 2021). In our modeling, this approach ensured parsimonious geomorphological variable selection while maintaining computational efficiency when integrating multi-source topographic, geological, and hydrological data. The VIF <5 threshold was adopted based on empirical machine learning studies and geohazard modeling domain considerations.
Figure 7 shows the model features’ multicollinearity analysis results. VIF analysis indicates all features have values below the critical threshold of 5 (significantly lower than 10), meaning no severe multicollinearity exists. This ensures subsequent model training stability and reliability by avoiding redundant feature interactions, making the feature set suitable for input into the machine learning framework.
FIGURE 7
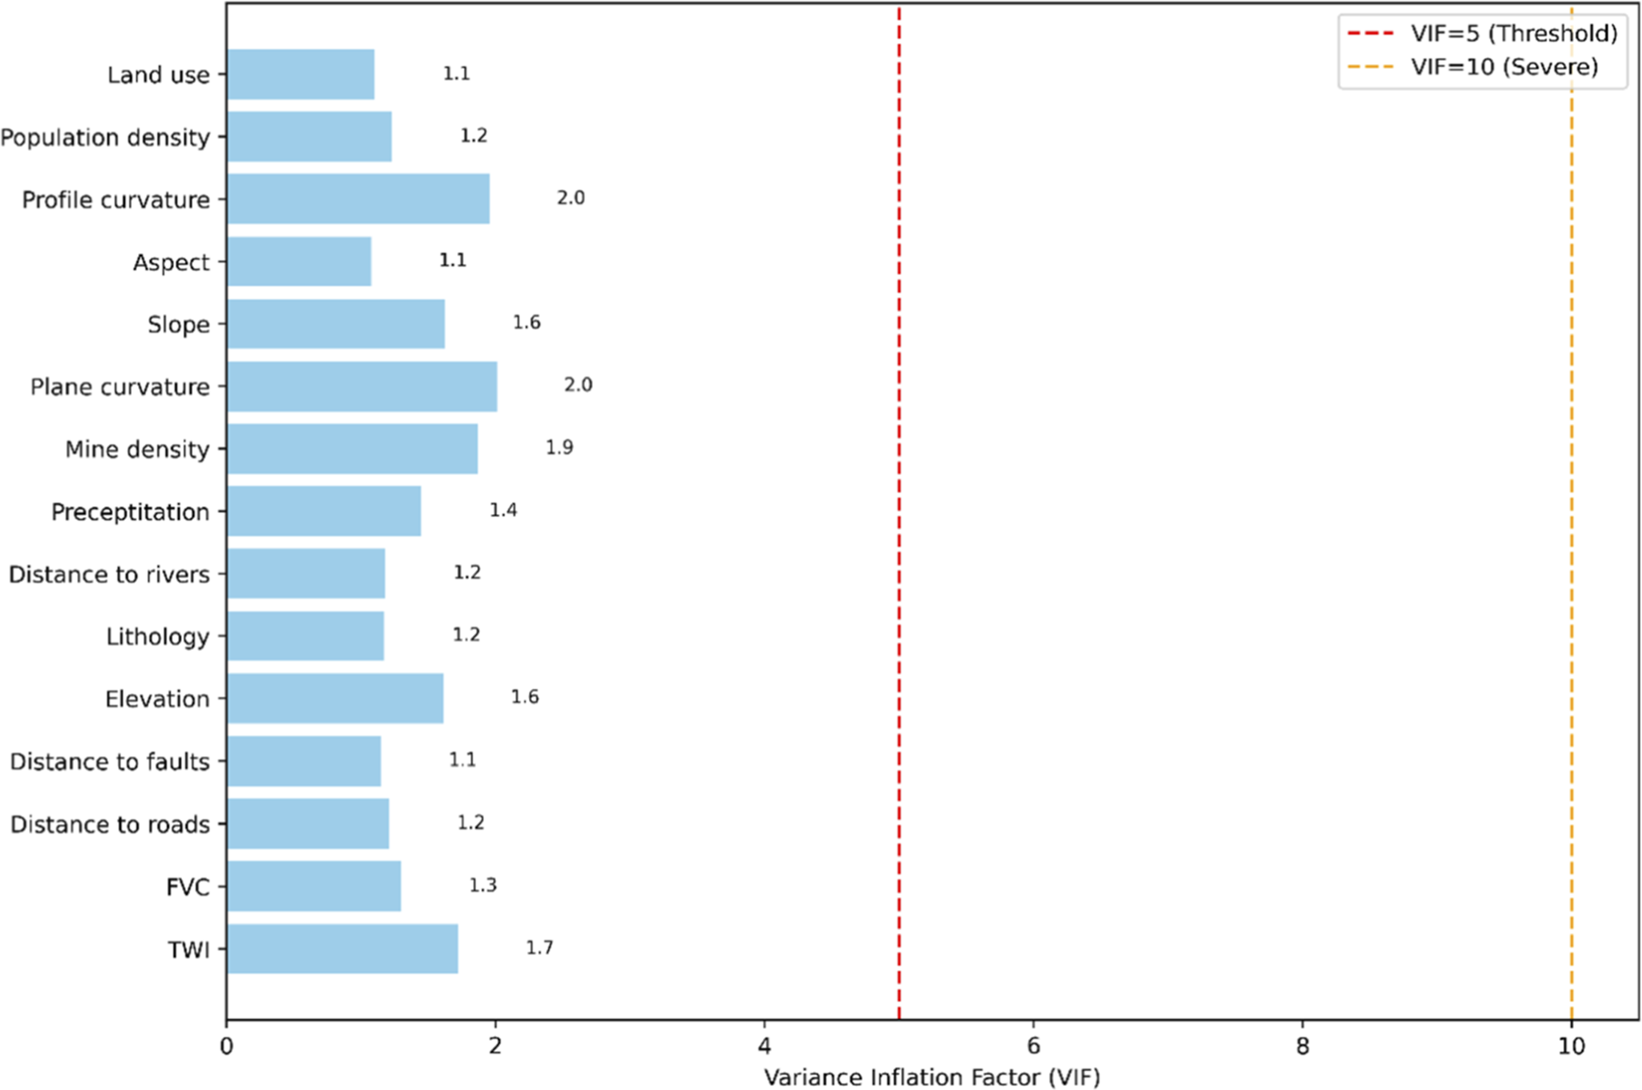
VIF for multicollinearity analysis.
3.3 Frequency ratio method
The FR results provide an intuitive and physically meaningful explanation of the landslide occurrence mechanisms in the study area. This establishes a geoscientifically grounded expectation and reference point for subsequent machine learning model predictions. Before conducting model training, we already knew which factors were considered important in traditional analysis. As a pre-modeling analysis, FR provides prior knowledge for feature selection and plausibility assessment of model results.
The FR method was employed to evaluate the statistical relationship between landslide occurrence and contributing factors (Lee and Pradhan, 2007). This technique computes the ratio of landslide density within each factor class (e.g., slope intervals or lithology types) to the overall landslide density across the study area. FR values >1 indicate elevated landslide propensity, while values <1 suggest reduced susceptibility. The method effectively processes both continuous variables (e.g., slope angle) and categorical variables (e.g., land use), making it particularly suitable for preliminary susceptibility assessment in our study region. Prior to FR calculation, all factor classes were discretized using natural breaks classification (Jenks optimization). The derived ratios were subsequently aggregated to generate a composite susceptibility index. This robust analytical approach has been extensively validated in geohazard research.
3.4 Ensemble learning model
This study developed two ensemble learning methods (utilizing XGboost and LightGBM) for landslide susceptibility prediction, while also selecting several traditionally used evaluation models for comparison. The selected models encompass diverse paradigms to capture different data patterns. The characteristics of these models are presented in Table 2.
TABLE 2
| Model | Category | Subcategory |
|---|---|---|
| LR | Linear models | Generalized linear models |
| NB | Probabilistic models | Generative models |
| KNN | Instance-based learning | Lazy learning |
| SVM | Kernel methods | Discriminative models |
| RF | Ensemble learning | Bagging-type |
| XGBoost | Ensemble learning | Boosting-type (gradient boosting) |
| LightGBM | Ensemble learning | Boosting-type (histogram-based) |
| ANN | Neural networks | Deep learning |
Machine learning model categorization.
XGBoost is an efficient ensemble algorithm that models complex nonlinear relationships, handles missing data, and minimizes prediction errors through boosted trees in landslide susceptibility assessment (Matougui et al., 2025), as formalized in Equation 2:where is the loss function (e.g., logistic loss), and are observed and predicted values, denotes the kth regression tree, and is a regularization term defined by:where is the number of leaf nodes, is the score on leaf j, and are regularization parameters, as given in Equation 3. Compared to traditional methods, XGBoost offers higher accuracy, reduces overfitting, and provides insights into feature importance, making it a valuable tool for landslide risk prediction.
The study used Randomized Search instead of Grid Search for hyperparameter optimization, as Randomized Search is more efficient in high-dimensional parameter spaces and can explore a broader range of parameter combinations with limited computational resources. We adopted a 5-fold stratified cross-validation approach to ensure the ratio of positive to negative samples in each fold is consistent with that of the original dataset. Through this randomized search hyperparameter optimization, the optimal configuration was determined with the following parameters: colsample_bytree = 0.721, gamma = 0.041, learning_rate = 0.0045, max_depth = 10, n_estimators = 552, reg_alpha = 0.065, reg_lambda = 7.866, and subsample = 0.783. This parameter combination effectively controls model complexity while maintaining strong predictive capability for landslide susceptibility assessment.
This study employs LightGBM, a fast and accurate GBDT-based algorithm, to model landslide susceptibility using standardized environmental factors as input features for large-scale, high-dimensional, and imbalanced data (Danlu et al., 2023), as formulated in Equation 4:where is the loss function, and are the true and predicted values, is the new tree, and is the regularization term.
LightGBM uses a leaf-wise tree growth strategy that prioritizes splits with the highest loss reduction, with the gain of a split computed as Equation 5:where G and H are the sum of first- and second-order gradients, and are regularization parameters. Its histogram-based decision tree construction improves training speed and memory efficiency, while embedded feature selection enhances interpretability and generalization.
A similar strategy was adopted for the LightGBM model. The LightGBM model was optimized using histogram-based algorithms for efficient training. The hyperparameter optimization yielded the following optimal configuration: colsample_bytree = 0.704, learning_rate = 0.0098, max_depth = 7, min_child_samples = 49, n_estimators = 274, num_leaves = 48, reg_alpha = 0.013, reg_lambda = 0.179, and subsample = 0.987. This parameter set ensures model robustness while preventing overfitting, making it suitable for landslide susceptibility prediction applications.
The ANN, originally for handwritten digit recognition, is a specialized neural network architecture particularly suited for processing grid-structured data (Haykin, 1994). In this study, we directly employ the ANN model as a classifier for landslide susceptibility prediction. The implementation involves three main steps: 1) transforming raw landslide data into three-dimensional data structures; 2) constructing corresponding ANN architectures tailored to different data dimensions; and 3) conducting susceptibility analysis based on these dimension-specific data and ANN structures. For clarity, we illustrate the analysis process using a 1D-ANN architecture (Figure 8). The 1D-ANN takes 15 × 1 factor vectors as input. Through convolutional and pooling operations in the hidden layers, it extracts high-dimensional landslide features. These features are then mapped to a lower-dimensional space via fully connected layers and finally transformed into the sample label space through nonlinear activation functions, outputting both landslide/non-landslide classifications and their corresponding probability values (Landslide Susceptibility Index, LSI). By applying this 1D-ANN model to predict susceptibility indices for each grid cell, we generate the final landslide susceptibility map.
FIGURE 8

One-dimensional ANN architecture.
3.5 SHAP interpretability analysis
SHAP (SHapley Additive exPlanations) is an interpretability analysis method grounded in game theory, designed to explain the predictions of any machine learning model (Li and Tian, 2025). Its core principle involves calculating the contribution of each feature to an individual prediction (i.e., the SHAP value), thereby quantitatively revealing how that feature influences the model’s final decision. For instance, in a landslide prediction model, SHAP analysis can explicitly indicate which factors contribute most to a specific high-risk prediction. This approach transforms the “black box” decision-making process of the model into a transparent one, enhancing trust in the model, clarifying the basis of its decisions, and identifying key driving factors. SHAP (SHapley Additive exPlanations) not only explains machine learning model predictions but also effectively conducts feature contribution analysis, quantifying the relative importance of each evaluation factor in landslide susceptibility prediction. Therefore, in landslide susceptibility assessment, there is no need to eliminate any evaluation factors, as SHAP can clearly reveal their contribution to model outputs through calculated SHAP values. This approach retains all factors (e.g., topographic, geological, hydrological, environmental, and anthropogenic) and identifies key drivers while avoiding information loss from subjective elimination, thereby enhancing the scientific rigor and predictive accuracy of the model.
3.6 Model assessment
In this study, model performance was assessed through multiple complementary metrics. The Receiver Operating Characteristic (ROC) curve and Area Under the Curve (AUC) served as primary evaluation measures, with AUC values closer to one indicating superior discrimination ability between landslide and non-landslide areas (Fawcett, 2006). For comprehensive assessment, four additional key metrics were employed: Accuracy (%), Precision (%), Recall (%), and F1 score (%). Accuracy quantifies the overall proportion of correct classifications, while Precision reflects the model’s capability to minimize false positives in predicted susceptibility zones. Recall (Sensitivity) evaluates the detection rate of actual landslide locations, particularly crucial for risk mitigation purposes. The F1 score provides a harmonic mean of Precision and Recall, offering a balanced performance measure especially valuable for landslide studies where class imbalance between landslide and stable areas is typically observed. Together, this multi-metric approach (AUC-ROC plus Accuracy/Precision/Recall/F1) ensures robust evaluation of both the model’s predictive power and its operational reliability for landslide risk management applications.
3.7 Model uncertainty quantification
To evaluate the reliability of landslide susceptibility predictions in complex geographical environments, this study employed a bootstrap resampling approach to quantify prediction uncertainty. The bootstrap method generates a large number (500 iterations in this study) of resampled training sets by randomly sampling the original training dataset with replacement (Hesterberg, 2011). For each bootstrap sample, an ensemble learning model was independently trained, resulting in a model ensemble. This process involved two key steps: Model Stability Assessment: The distribution of performance metrics (e.g., AUC values) of this model ensemble on an independent test set was calculated. The central tendency (e.g., mean) of this distribution reflects the model’s average performance, while its dispersion (e.g., standard deviation or confidence interval) directly quantifies the stability uncertainty of the model arising from training data variability.
4 Results
4.1 Frequency ratio of landslide influencing factors
Figure 9 presents the FR analysis results of 15 landslide-influencing factors, quantifying the correlation between each factor’s categories and landslide occurrence through three key metrics: landslide proportion, area percentage, and FR value. Among all factors, lithology exhibits the most pronounced discriminative power, with relatively soft mudstone (Figure 9g) showing the highest FR value of 4.56, accompanied by a 31.38% landslide proportion despite accounting for only 6.88% of the total area, indicating a strong positive correlation with landslide susceptibility. Proximity to rivers (Figure 9e) emerges as a critical topographic factor, where the <200 m category displays an FR of 2.44, with 37.24% of landslides concentrated in this zone—more than twice its proportional area (15.26%). Mine density (Figure 9j) also demonstrates a significant influence, with the highest density category (0.098–0.149) yielding an FR of 3.48, reflecting enhanced landslide risk in areas with intensive mining activities. In contrast, hard limestone (Figure 9g) and high-elevation zones (>2,260 m, Figure 9a) exhibit FR values of 0.16 and 0.03, respectively, indicating their inhibitory effects on landslide occurrence due to their stable geological properties or limited human activity. For topographic factors, mid-slope gradients (15.39°–22.79°, Figure 9b) and moderate precipitation ranges (13,322–14,447 mm, Figure 9i) show moderate positive correlations (FR = 1.34 and 2.33, respectively), while flat terrain (Aspect: Plane, Figure 9c) and high vegetation coverage (>0.869, Figure 9k) display low FR values (<0.65), consistent with their role in reducing slope instability. These quantitative results provide a robust basis for identifying high-risk zones and understanding the multi-factor synergistic effects on landslide occurrence.
FIGURE 9
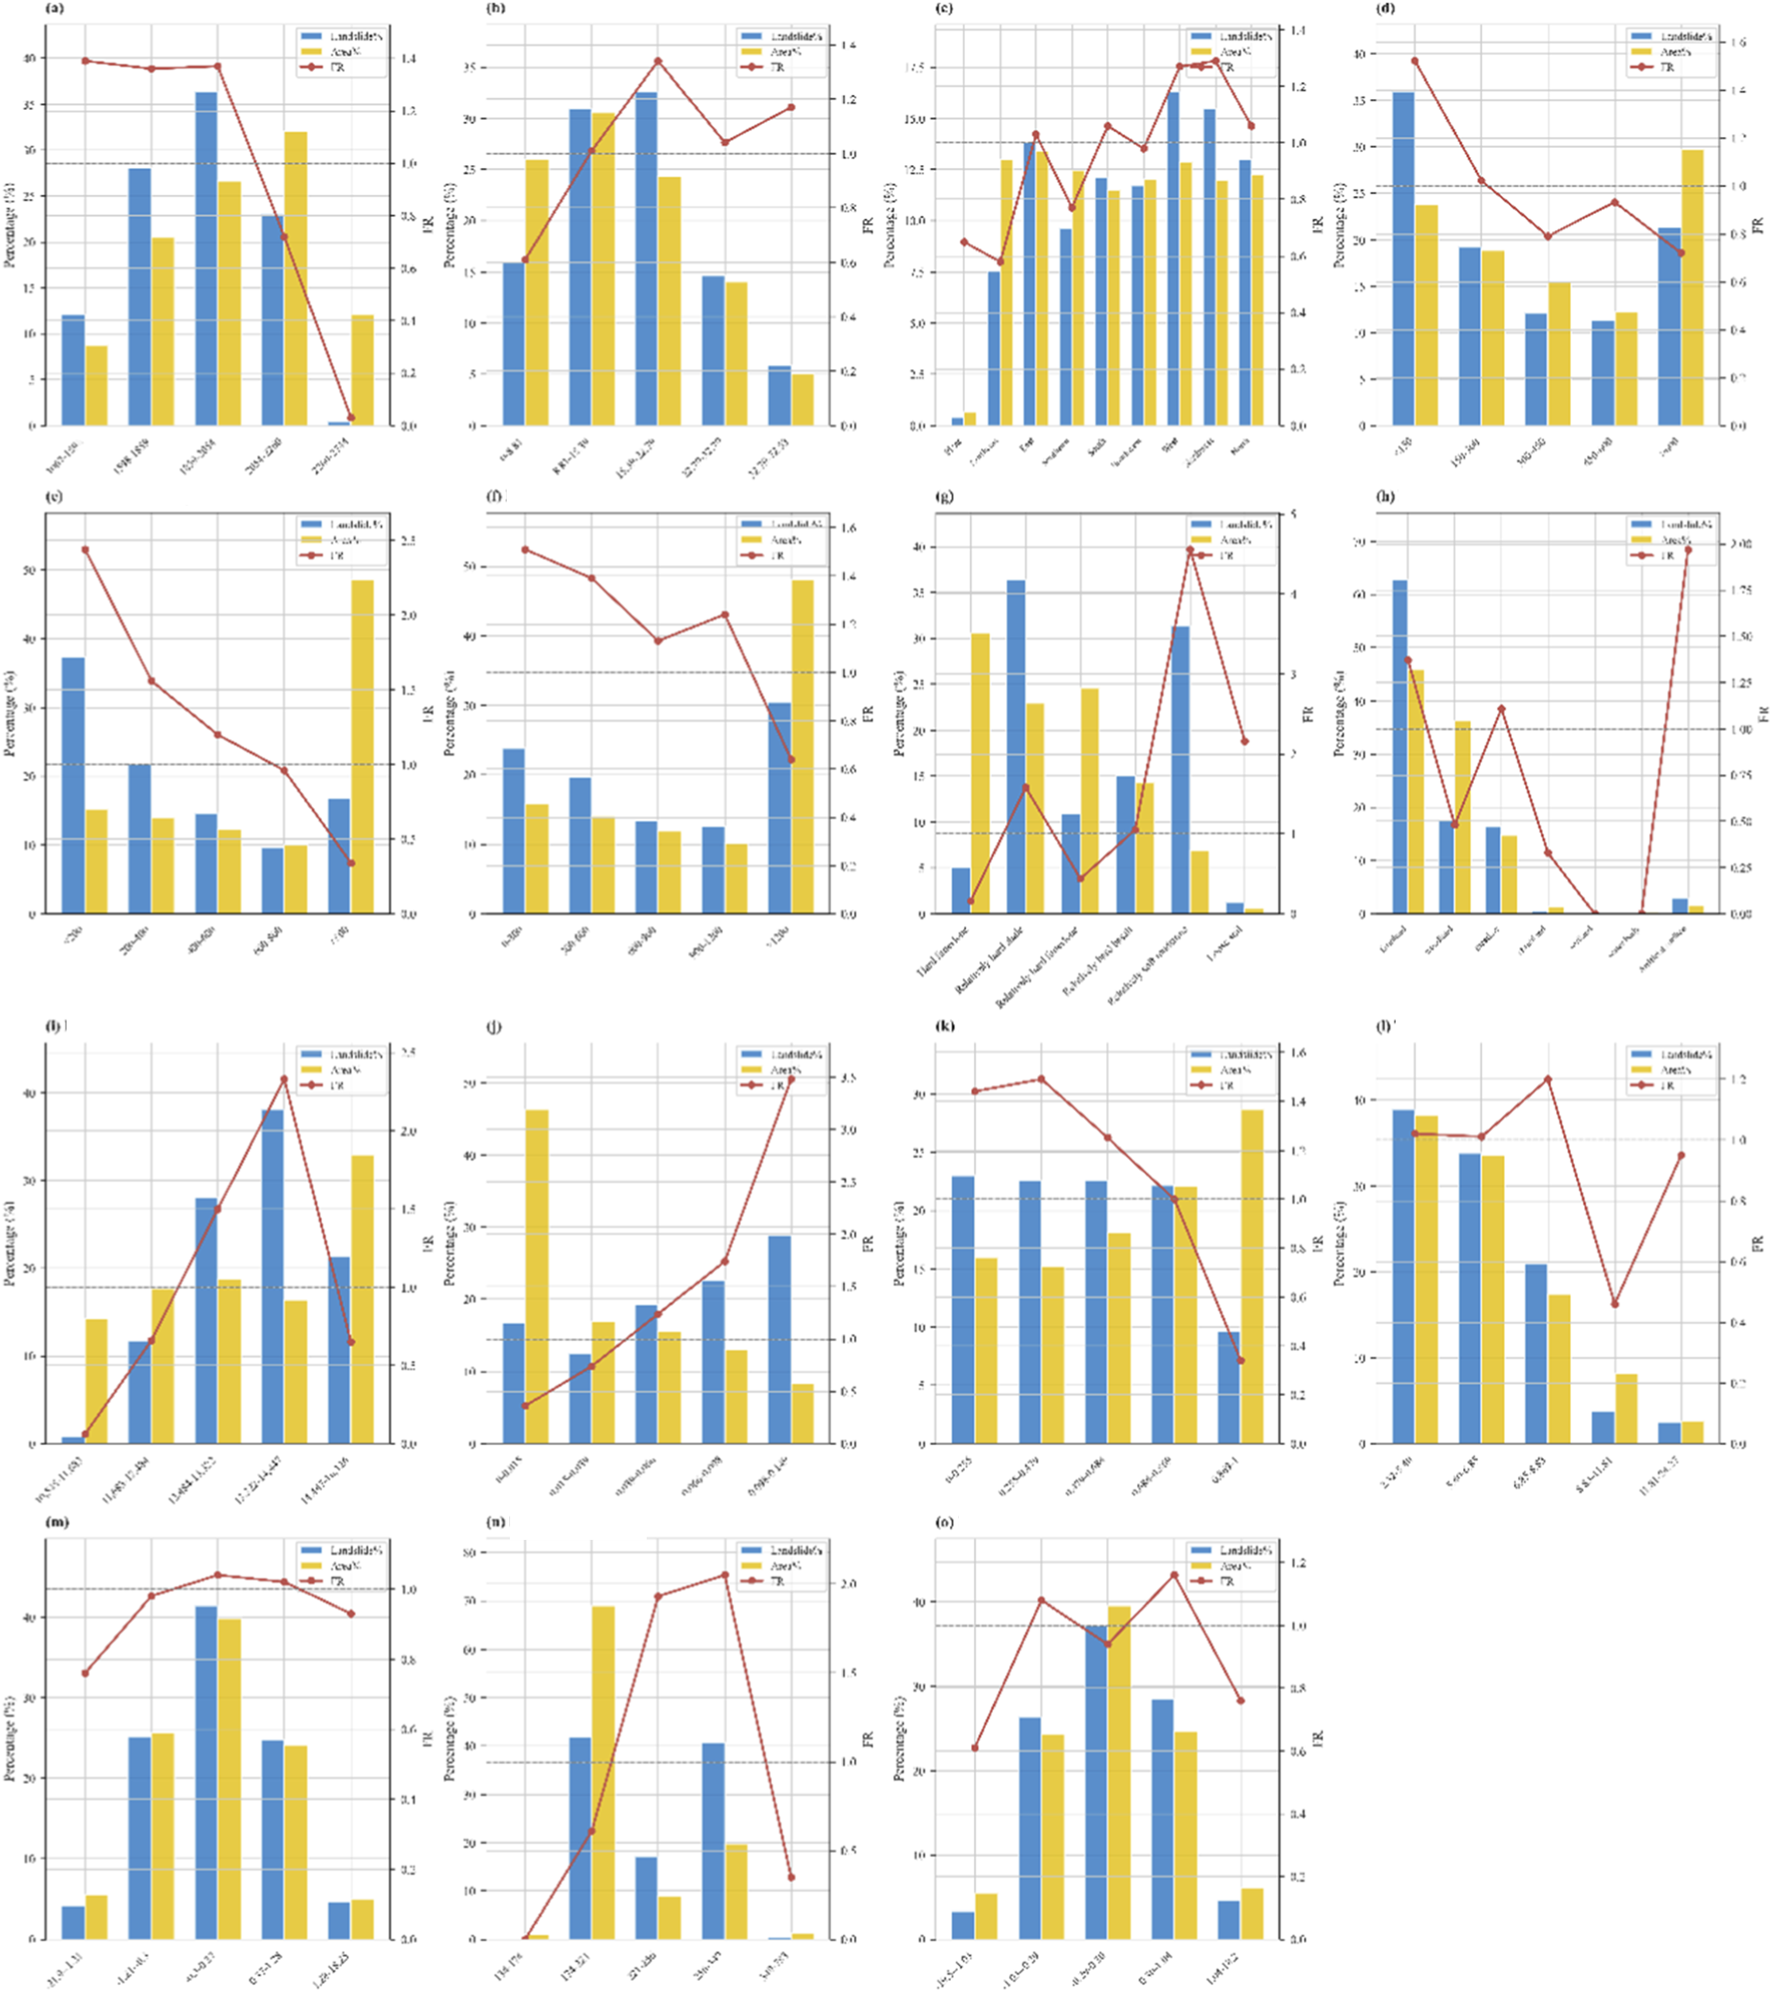
FR analysis of landslide-influencing factors: (a) Elevation, (b) Slope, (c) Aspect, (d) Distance to roads, (e) Distance to rivers, (f) Distance to faults, (g) Lithology, (h) Land use, (i) Precipitation, (j) Mine density, (k) FVC, (l) TWI, (m) Profile curvature, (n) Population density, (o) Plane curvature.
4.2 Model assessment
Table 3 presents performance metrics (accuracy, precision, recall, F1 - score) of ML models. LightGBM achieved the highest accuracy (84.10%) and precision (80.25%), with recall at 90.50% and F1 at 83.17%. XGBoost followed, with accuracy of 82.30%, recall reaching 91.67%, and F1 at 83.81%. RF (81.70% accuracy) and KNN (81.25% accuracy) showed competitive results. Conversely, SVM, LR, NB, and ANN exhibited lower performance across metrics. Overall, gradient - boosting (LightGBM, XGBoost) and ensemble (RF) models outperformed traditional (SVM, LR) and ANN approaches, with LightGBM demonstrating the most balanced predictive capability.
TABLE 3
| Model | Accuracy (%) | Precision (%) | Recall (%) | F1 (%) |
|---|---|---|---|---|
| RF | 81.70 | 78.18 | 89.58 | 83.50 |
| XGBoost | 82.30 | 77.19 | 91.67 | 83.81 |
| LightGBM | 84.10 | 80.25 | 90.50 | 83.17 |
| SVM | 75.00 | 73.90 | 79.70 | 76.00 |
| LR | 74.00 | 72.70 | 80.16 | 78.00 |
| ANN | 76.92 | 75.07 | 81.12 | 73.47 |
| NB | 75.79 | 74.31 | 77.08 | 75.51 |
| KNN | 81.25 | 77.77 | 87.5 | 82.35 |
Performance metrics of various machine learning models.
Figure 10 illustrates the ROC curves of different models for landslide susceptibility assessment on the test set. The LightGBM achieves the highest AUC of 0.89, outperforming other models, while RF, XGBoost, and KNN show comparable performance with an AUC of 0.87. SVM, ANN, and NB have AUC values of 0.85, 0.85, and 0.83, respectively. These results indicate that ensemble learning models, particularly LightGBM, are more effective for landslide susceptibility assessment.
FIGURE 10
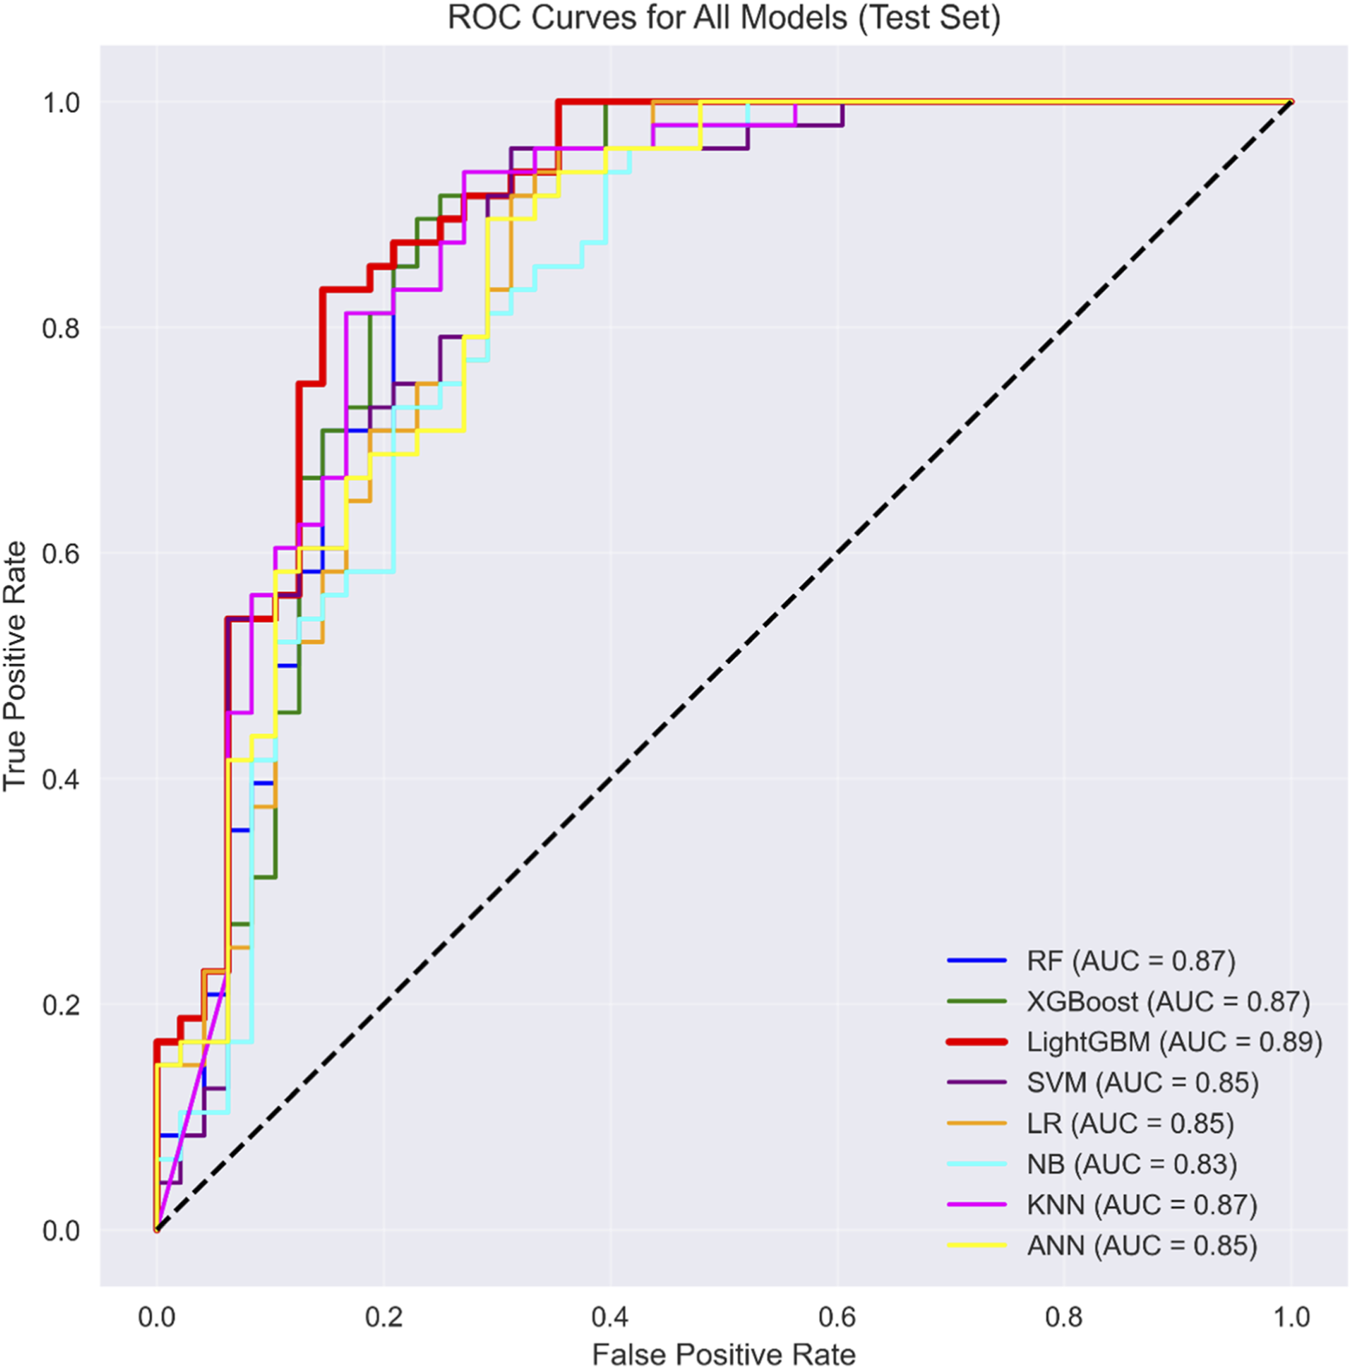
ROC curves of different models for landslide susceptibility assessment.
4.3 Model uncertainty quantification
The bootstrap method is used for quantifying the LightGBM model uncertainty, and the results are shown in Figure 11.
FIGURE 11

Uncertainty Quantification Results: (a) Prediction Uncertainty Distribution; (b) Confidence Interval Width Distribution; (c) Probability vs. Uncertainty; (d) Model Stability (Bootstrap AUC).
Figure 11a illustrates the distribution of prediction standard deviation (used as a quantitative indicator of uncertainty). The results show that the mean value of prediction uncertainty is 0.141, and the overall distribution exhibits a left-skewed pattern—most samples have low prediction uncertainty (with standard deviations concentrated in the 0.0–0.1 range), while only a small number of samples have uncertainty higher than 0.2. This indicates that the model has high certainty in predicting most samples, with significant prediction fluctuations observed only in a few cases.
Figure 11b presents the distribution characteristics of the 95% confidence interval width, with a mean value of 0.361. Similar to the prediction uncertainty distribution, the confidence interval width also shows a bimodal feature: on the one hand, a large number of samples have narrow confidence intervals (concentrated in the 0.0–0.2 range); on the other hand, some samples have confidence interval widths close to 1.0. This distribution suggests that the model provides narrow credible intervals for the prediction results of most samples, with a wide range of uncertainty only for a small number of samples.
Figure 11c displays the relationship between the average prediction probability and prediction standard deviation (uncertainty) in the form of a scatter plot, where the color of the scatter points represents the true label (0/1) of the samples. An obvious “U-shaped” trend can be observed: when the prediction probability is close to 0 or one (i.e., the model is highly certain about the class prediction), the prediction uncertainty (standard deviation) is low; when the prediction probability is close to 0.5 (i.e., the model is ambiguous about the class judgment), the uncertainty increases significantly. This pattern holds for samples of both labels, indicating that the model’s uncertainty quantification can effectively reflect its “degree of confidence” in the prediction results.
Figure 11d evaluates the model’s stability using the Bootstrap method, with AUC (Area Under the Curve) as the indicator. The results show that the mean value of Bootstrap AUC is 0.964, and the distribution is concentrated in the range of 0.955–0.975. This demonstrates that the model maintains high discriminative ability in multiple resampling validations, featuring good stability and further supporting the reliability of the model’s prediction results.
In summary, the LightGBM model demonstrates overall excellent performance and stability. Its prediction results are reliable and stable in most scenarios, with high uncertainty observed only in a small number of samples, indicating outstanding overall performance.
4.4 Landslide susceptibility mapping
The landslide susceptibility map generated by the LightGBM model (Figure 12) illustrates the spatial distribution of landslide potential across the study area, which covers 11 townships within Fuyuan county. The map, categorized into five susceptibility levels (Very low, Low, Moderate, High, Very high), reveals a non - uniform distribution of landslide risks.
FIGURE 12

Mapping of susceptibility using LightGBM models.
High and Very high susceptibility zones (depicted in red and dark red) are concentrated in certain townships, such as Yingshang Town and parts of Dahe Town and Zhuyuan Town. These zones coincide with a significant number of recorded landslides (marked as red dots), indicating the model’s ability to identify areas prone to landslide occurrences. In contrast, the southern and some western townships (e.g., Mohong Town, Zhongan town, Shibalian mountain Town) are dominated by Low and Very low susceptibility zones (shown in green), where fewer landslides are observed.
Table 4 presents the landslide susceptibility zoning results generated by the LightGBM model, which classified the study area into five susceptibility levels: Very low, low, Moderate, High, and Very high. The distribution characteristics of landslides across these zones revealed a clear positive correlation between susceptibility levels and actual landslide occurrence. Specifically, the Very high susceptibility zone, accounting for 16.55% of the total area (535.59 km2), contained the largest proportion of landslides, comprising 60.67% (145 landslides) of the total landslide count, with a landslide density of 0.271 number/km2. The High susceptibility zone, occupying 13.28% of the area (429.53 km2), hosted 26.36% of the landslides (63 landslides) and had a relatively high density of 0.147 number/km2. In contrast, the lower susceptibility zones showed significantly fewer landslides: the Moderate, low, and Very low zones accounted for 7.53% (18 landslides), 5.02% (12 landslides), and 0.42% (1 landslide) of the total landslides, respectively, with corresponding densities of 0.039, 0.020, and 0.001 number/km2. These results indicate that the LightGBM model effectively concentrated most landslides in higher susceptibility zones, where the landslide density increased progressively with rising susceptibility levels, demonstrating the model’s ability to capture the spatial association between susceptibility and actual landslide distribution.
TABLE 4
| Model | Landslide susceptibility zoning | Landslide count | Area (km2) | Proportion of landslides (%) | Percentage of area (%) | Landslide density (number/km2) |
|---|---|---|---|---|---|---|
| LightGBM | Very low | 1 | 1,200.2499 | 0.42% | 37.10% | 0.001 |
| Low | 12 | 611.766 | 5.02% | 18.91% | 0.020 | |
| Moderate | 18 | 458.2854 | 7.53% | 14.16% | 0.039 | |
| High | 63 | 429.5331 | 26.36% | 13.28% | 0.147 | |
| Very high | 145 | 535.5855 | 60.67% | 16.55% | 0.271 |
Landslide susceptibility zoning results of the LightGBM model.
Figure 13 shows landslide density rises with higher susceptibility zones in (a). In (b), very high - susceptibility zones have a far larger proportion of landslides than their area percentage, highlighting high landslide - prone characteristics.
FIGURE 13
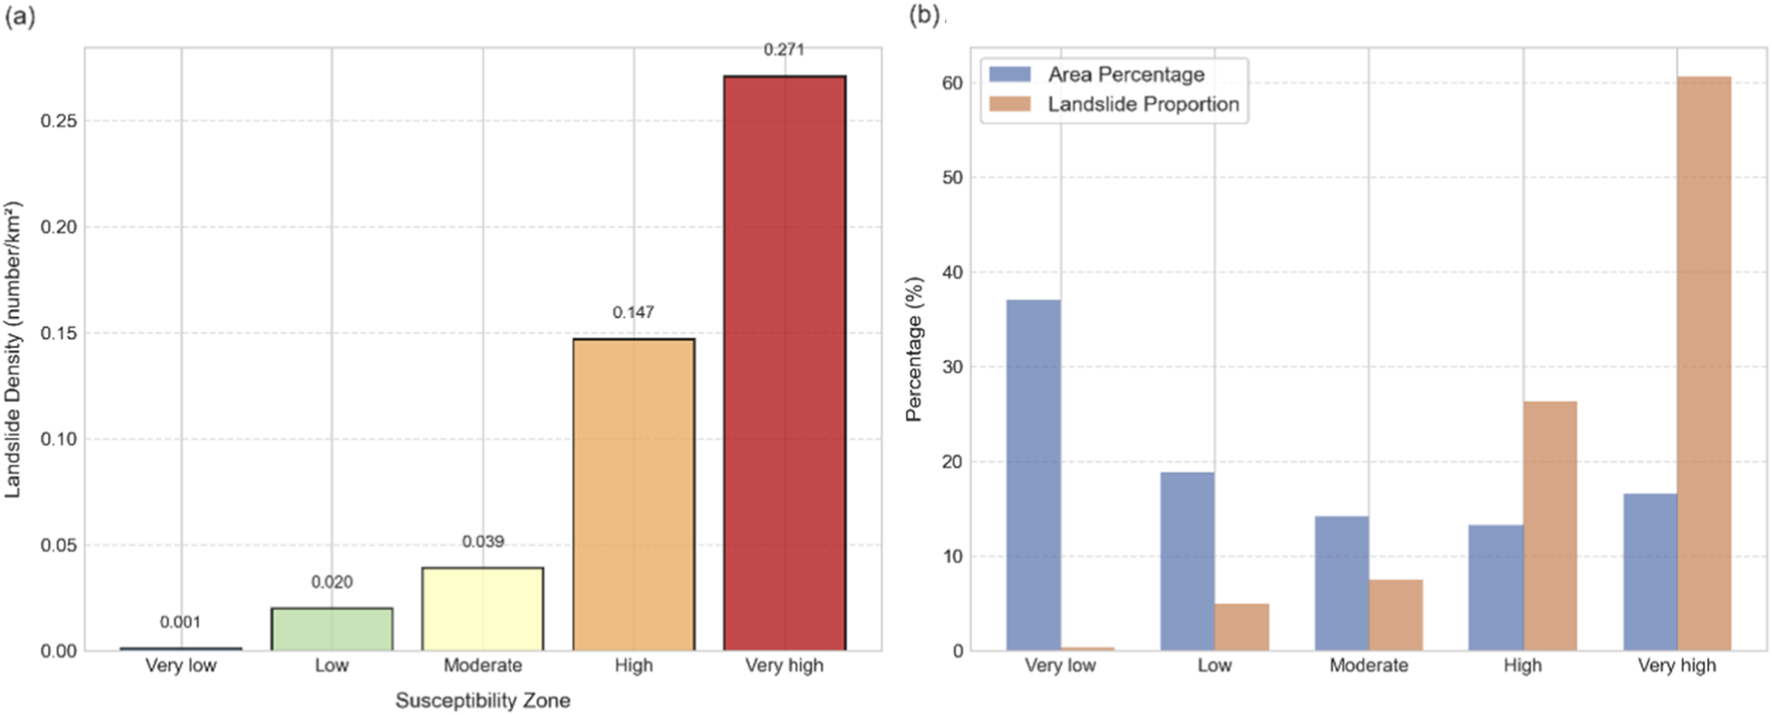
Spatial distribution characteristics of landslides across susceptibility zones: (a) Landslide density by zone; (b) Area vs. landslide Proportion.
The SHAP beeswarm plot for the LightGBM model (Figure 14) visualizes feature impacts on predictions. Each dot represents a feature’s SHAP value in one instance, with the x-axis for SHAP values and color gradient (blue - red) for feature values (low - high).
FIGURE 14
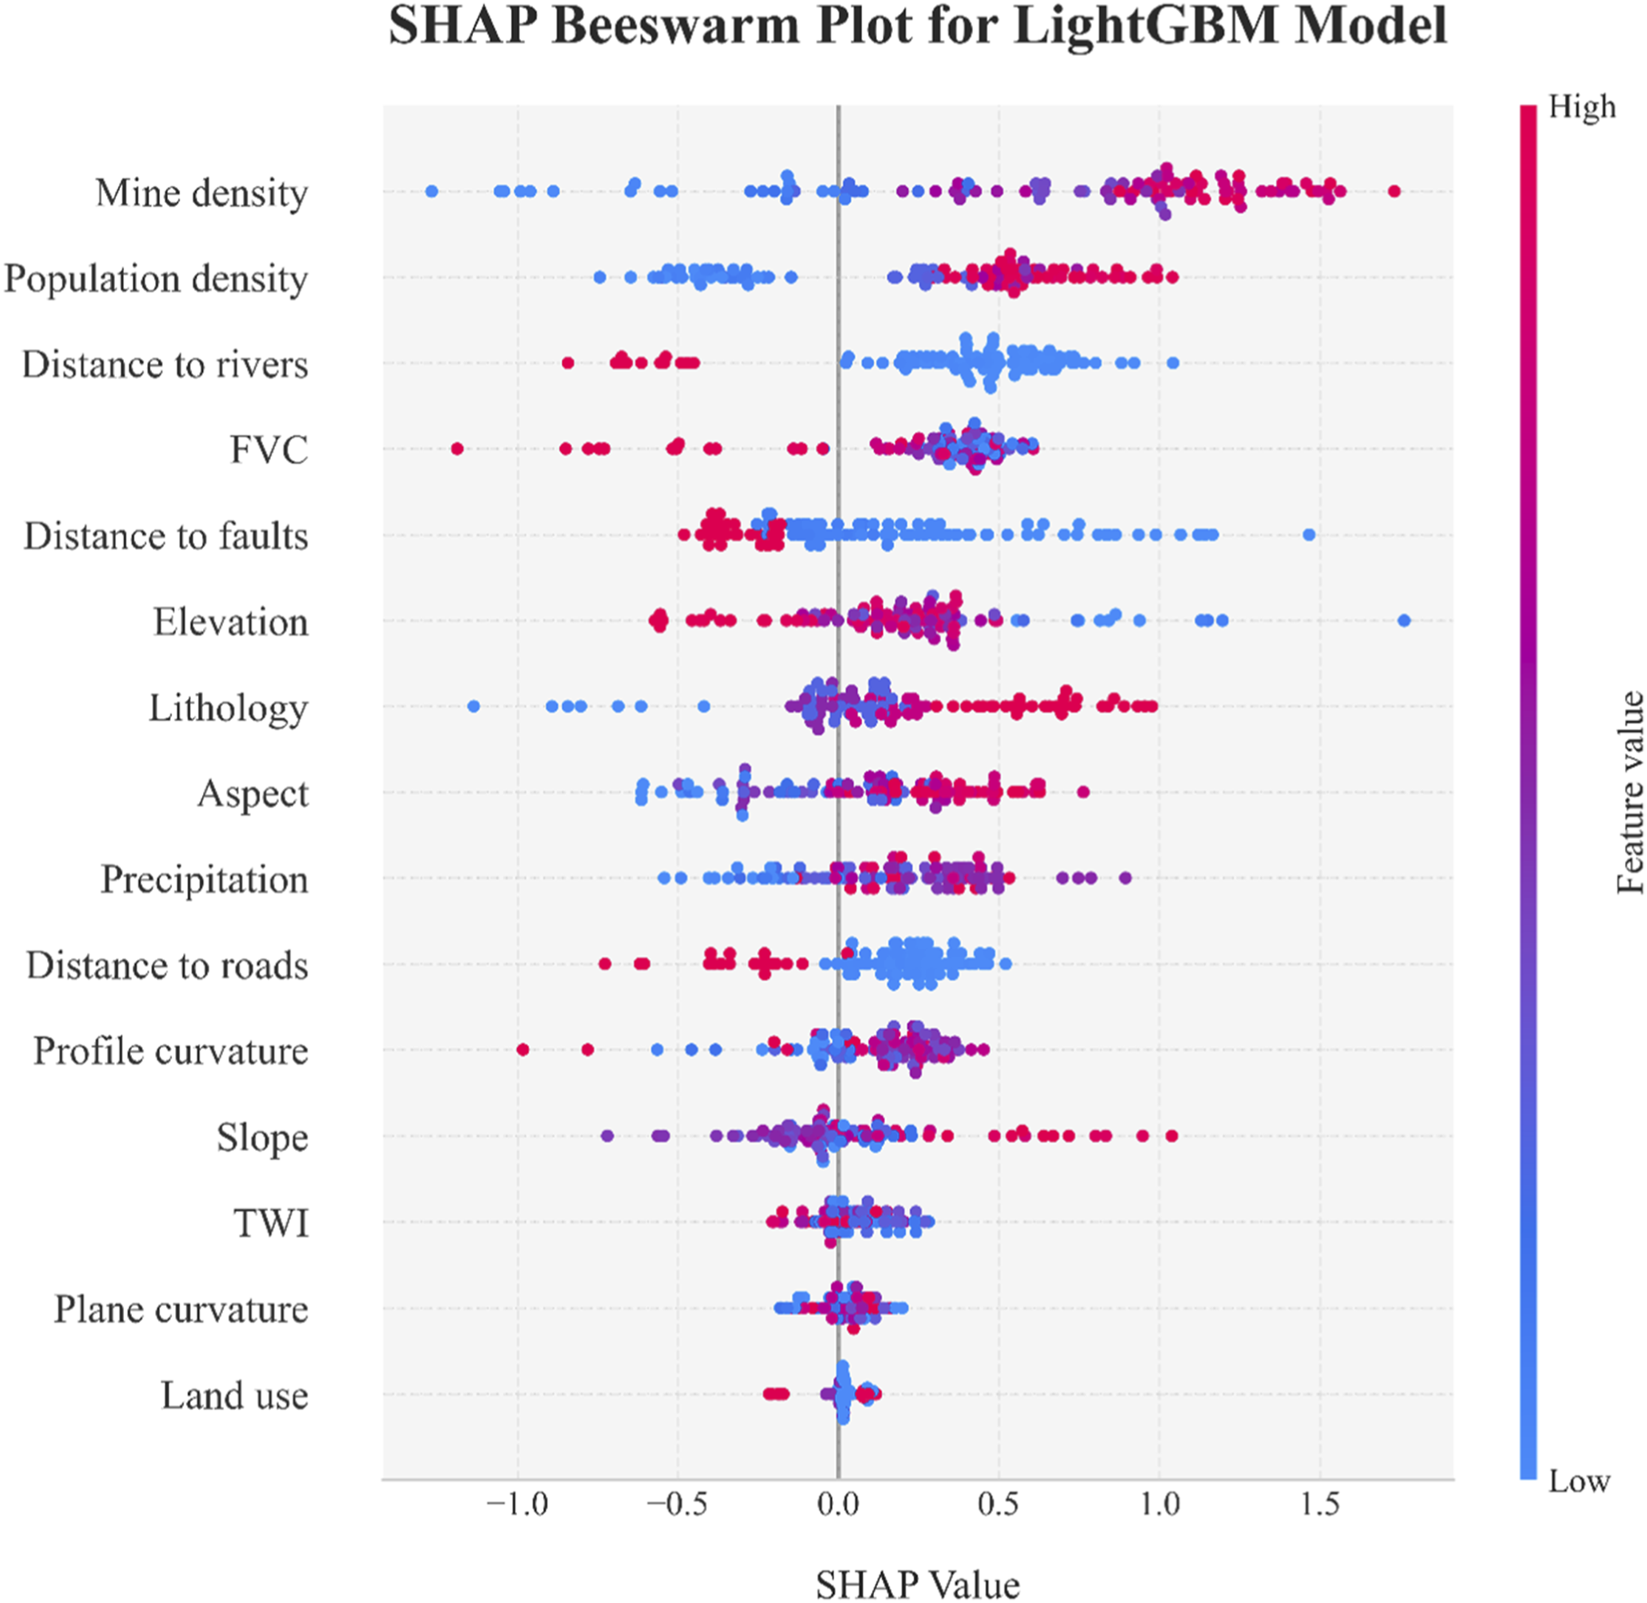
Shap beeswarm plot for LightGBM model.
Mine density shows a wide SHAP value spread, indicating a critical role. Population density and distance to rivers also have notable influences, seen from their SHAP value ranges. Features like FVC, distance to faults, and elevation contribute variably, per their distinct SHAP distributions. Overall, the plot reveals how mine-related and geospatial factors (e.g., mine density, population density) drive the LightGBM model’s susceptibility assessments, clarifying key feature-prediction relationships.
The SHAP dependence plot for mine density in the LightGBM model (Figure 15) illustrates the relationship between standardized mine density, SHAP values, and the interacting feature of distance to rivers (color - coded). As standardized mine density increases, SHAP values generally show an upward trend, indicating a positive influence on the model’s prediction of landslide susceptibility. Notably, at higher mine density values (especially >0.5), SHAP values are predominantly positive and exhibit greater variability, suggesting a stronger and more complex impact on predictions. The color gradient reveals that instances with shorter distances to rivers (warmer colors, e.g., yellow) often coincide with higher SHAP values at given mine densities, implying a synergistic effect: areas with both high mine density and proximity to rivers may face elevated hazard potential, as captured by the LightGBM model. This interaction highlights the importance of considering combined feature effects in interpreting the model’s output.
FIGURE 15

SHAP Dependence for Mine density (LightGBM).
The SHAP feature importance plot for the LightGBM model (Figure 16) quantifies the contribution of each feature to the model’s predictions using the mean absolute SHAP value. Among the evaluated features, mine density emerges as the most influential, exhibiting the highest mean absolute SHAP value. This indicates that variations in mine density have a substantial impact on predicting landslide susceptibility. Population density and distance to rivers follow, with relatively high mean absolute SHAP values, signifying their considerable roles in shaping the model’s output. In contrast, features such as land use, plane curvature, and TWI show lower mean absolute SHAP values, suggesting a lesser influence on the model’s predictions. Overall, the plot highlights the dominance of anthropogenic and proximity-related factors (mine density, population density, distance to rivers) in driving the LightGBM model’s landslide susceptibility assessments, while terrain and land cover features (e.g., slope, land use) have a more muted impact.
FIGURE 16
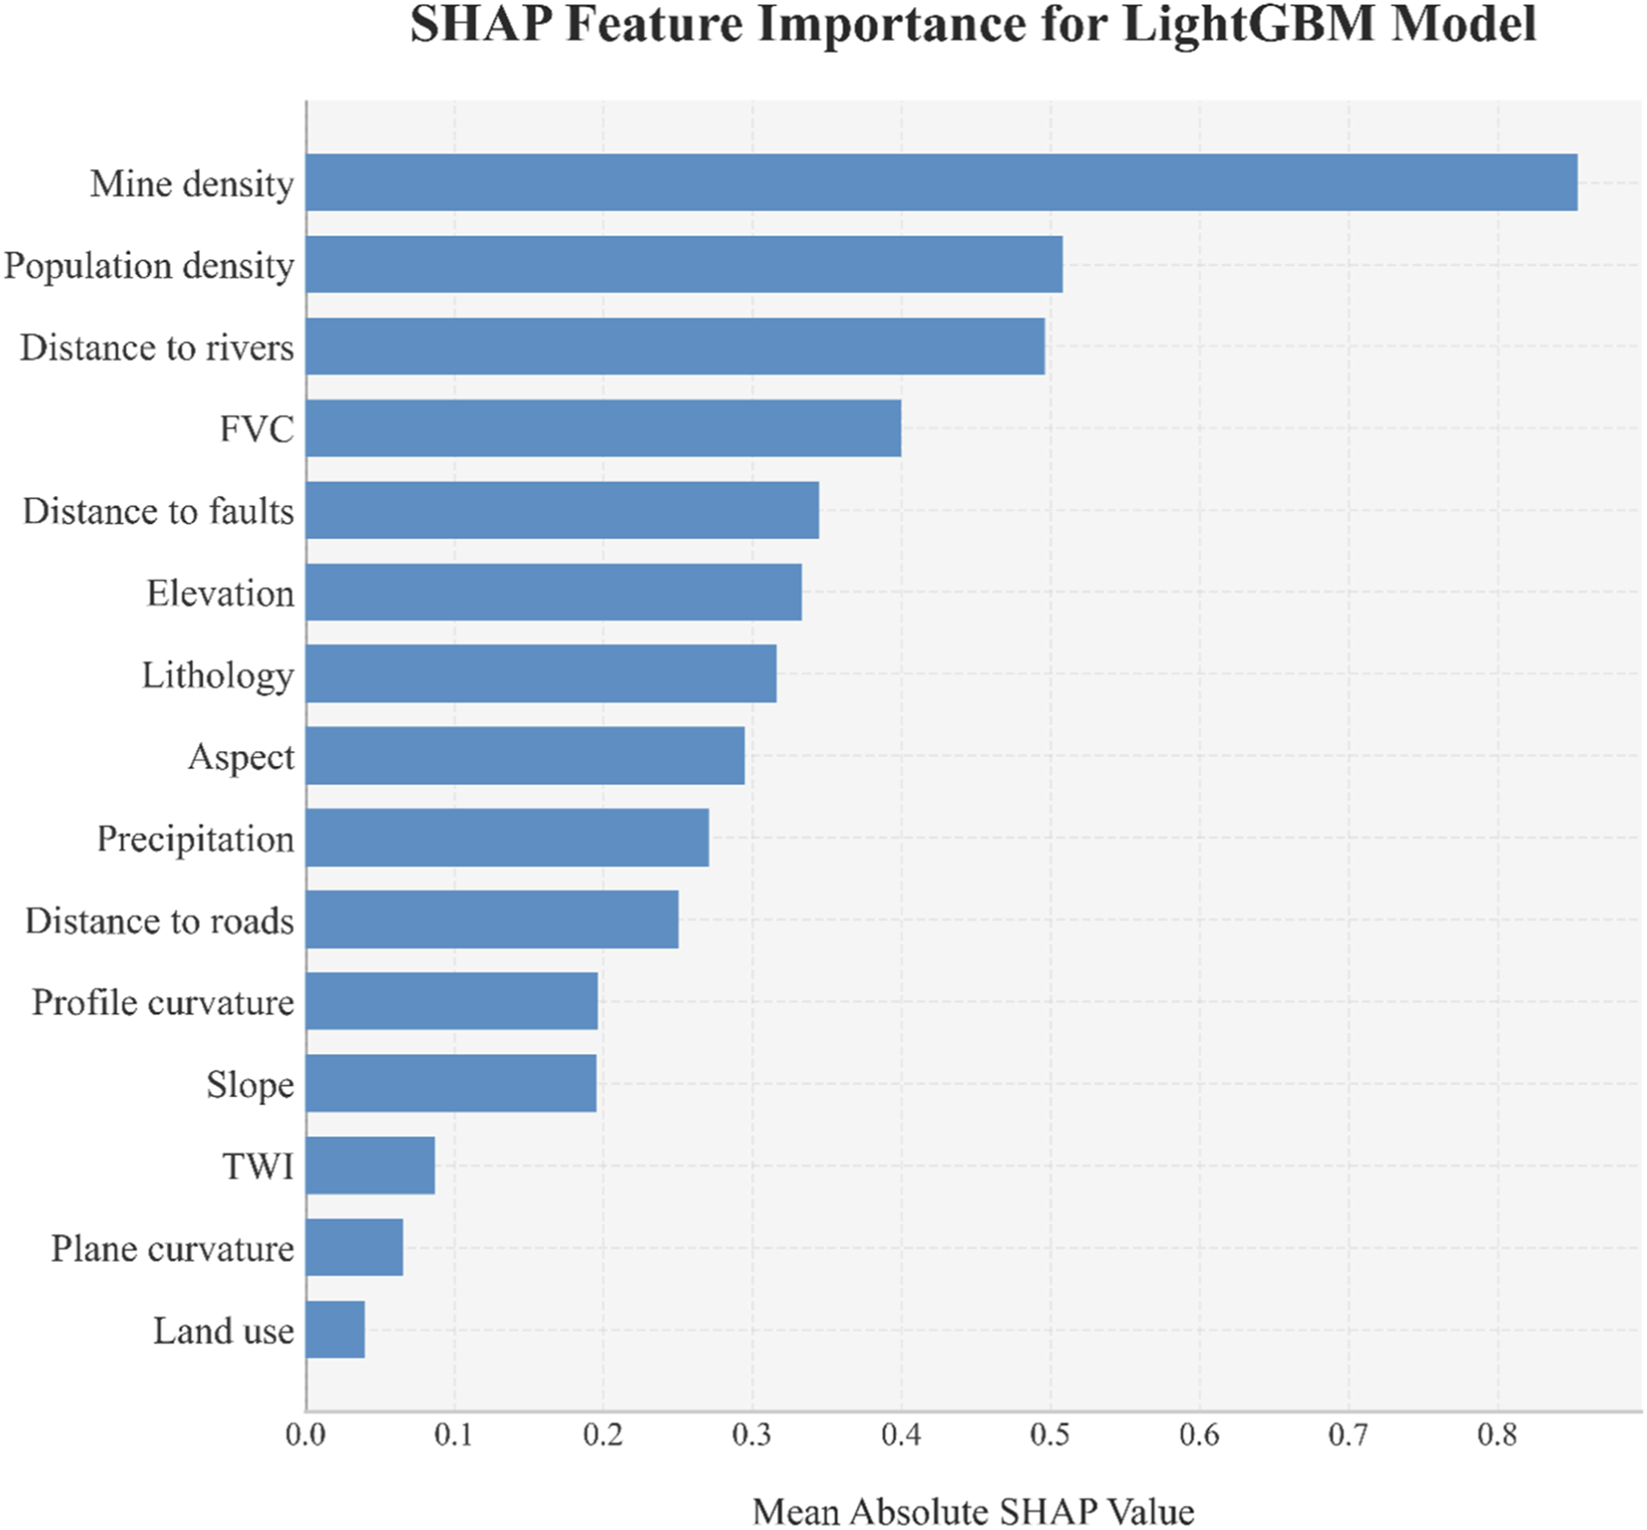
Shap feature importance for LightGBM model.
5 Discussion
5.1 Analysis of landslide factors with FR
The FR analysis revealed significant patterns in the influence of geological, topographic, and anthropogenic factors on landslide susceptibility. Soft mudstone in lithology exhibited a notably high FR value of 4.56, attributed to its tendency to soften and argillize upon water contact, poor permeability, rapid reduction in rock strength, susceptibility to weathering, low shear strength, and well-developed bedding planes and fractures that facilitate sliding. This aligns with the observation that mudstone areas account for 31.38% of landslides despite occupying only 6.88% of the spatial distribution, consistent with previous findings in Yunnan Province (Liu et al., 2023; Liu et al., 2025). Proximity to rivers (<200 m) showed a strong positive correlation (FR = 2.44), as lateral river erosion continuously undercuts slope toes, disrupting mechanical equilibrium and triggering instability. The FR gradually decreased with increasing distance from rivers. High mine density (0.098–0.149) elevated risk (FR = 3.48) through slope disturbance and hydrological damage caused by mining activities. In contrast, stable factors such as hard limestone (FR = 0.16) and dense vegetation cover (>0.869, FR < 0.65) mitigated instability. Field surveys in Fuyuan County confirmed that areas with high vegetation coverage, characterized by tall trees and deep-rooted plants, effectively inhibited landslide occurrence. Their well-developed root systems penetrated weak layers and anchored deep rock and soil, significantly enhancing shear strength and overall slope stability, creating a “biological anchor” reinforcement effect.
5.2 Validating model performance, interpreting uncertainty, and analyzing stability
The comparative evaluation of machine learning models highlighted the superiority of gradient boosting methods, among which the LightGBM model achieved the highest accuracy (84.10%) and balanced performance (F1 score = 83.17%), outperforming traditional statistical methods (SVM, LR) and artificial neural networks (ANN) — a finding consistent with previous studies (Danlu et al., 2023). This advantage stems from LightGBM’s ability to capture nonlinear relationships and higher-order interactions, as evidenced by its effectiveness in concentrating 60.67% of landslide points within 16.55% of the “very high” susceptibility zones. Although deep learning methods such as ANN are suitable for large-scale assessments, their potential is difficult to be fully realized in regions like Fuyuan County. The uncertainty quantification and stability results of the LightGBM model reflect the synergistic effect of data features, algorithm characteristics, and quantification methods: most samples exhibit low prediction standard deviation and narrow confidence intervals, benefiting from the strong discriminative power of the mainstream features in the dataset and the model’s effective capture of nonlinear relationships; the “U-shaped” correlation between average prediction probability and uncertainty reflects the consistency between the model’s decision-making logic and quantification indicators; the high AUC mean (0.964) and concentrated distribution (0.955–0.975) in Bootstrap validation are attributed to the reasonable data distribution and the model’s strong generalization ability. SHAP analysis clearly elucidated the model’s interpretability, showing that each influencing factor contributes to landslide occurrence but to varying degrees, with mining density identified as the most critical factor. The color gradient in Figure 15 indicates that, at a given mining density, areas closer to rivers typically correspond to higher SHAP values — a result of the combined effect of geomorphic factors (e.g., steep slopes and eroded landforms) that exacerbate slope instability, and geophysical processes (e.g., water-induced soil saturation and reduced shear strength near rivers) that amplify risks. Additionally, anthropogenic factors, particularly intensive mining activities, exacerbate surface disruption and weaken slope cohesion, forming a synergistic effect with natural factors to significantly increase landslide risk.
5.3 Practical impacts of LSM on regional development and recommendations
The high-resolution LSM exerts a profound practical impact on regional development, with its core value lying in transforming geological hazard prevention and control from passive post-disaster response to proactive pre-disaster prevention. Classifying regions into five susceptibility levels (very low, low, moderate, high, very high), the LSM serves as a key guideline for land-use planning, addressing local governments’ critical needs in urban development (Mandal and Mandal, 2018; Yeganeh et al., 2025; Cemiloglu et al., 2023). Specifically, governments can achieve dynamic zoning updates by integrating LSM results into mandatory planning revisions (e.g., designating ecological red lines in very high-risk areas to prohibit large-scale infrastructure and urban expansion, and setting differentiated construction standards involving anti-slide piles or drainage facilities in moderate-risk areas) and regularly updating zones using dynamic data such as seasonal precipitation and geological changes. Additionally, the model can be linked with GIS technology and real-time monitoring devices to build a full-process intelligent early warning system, generating multi-level alerts and supporting targeted disaster response plans. For mining regulation, the LSM acts as a core tool for license approval (rejecting applications in very high-risk areas and restricting mining scope in moderate-risk areas) and dynamic supervision via remote sensing, forming a “warning-inspection-penalty” closed-loop management system to enforce slope reinforcement and vegetation restoration.
Furthermore, if end-users (e.g., civil defense departments) have limited time or financial resources, they may prioritize focusing on truly critical influencing factors while temporarily setting aside secondary ones—a strategy supported by existing research findings in the region.
5.4 Limitations and future directions
This study still has certain limitations. Due to constraints of surveying and mapping conditions as well as regional accessibility, the landslide inventory may have missed a small number of small-scale or hidden landslides. The 30 m spatial resolution makes it difficult to accurately characterize fine-grained features such as microtopography, imposing certain restrictions on the representation of local small-scale landslides. Precipitation and population density data are obtained through interpolation methods, whose accuracy depends on the distribution of original observation stations and interpolation algorithms, potentially leading to slight errors in areas with complex terrain or sparse data.
These limitations have a limited impact on the overall evaluation results. Future research can be further improved by optimizing data collection methods, enhancing spatial resolution, and refining interpolation techniques.
6 Conclusion
This study employs advanced ensemble machine learning models (LightGBM and XGBoost) to assess landslide susceptibility in Fuyuan County and compares their performance with conventional models. The LightGBM model demonstrated superior performance in capturing complex nonlinear relationships and feature interactions, achieving a ROC of 0.89, 84.10% accuracy, and an F1 score of 83.17%.Uncertainty quantification results indicate that LightGBM performs excellently and stably, with low uncertainty, a narrow confidence interval, consistent discriminative ability under multiple resampling, and high reliability. Frequency ratio analysis identified key risk factors, including weak mudstone lithology (FR = 4.56), proximity to rivers (<200 m, FR = 2.44), and high mining density (0.098–0.149, FR = 3.48), while dense vegetation and hard limestone exhibited protective effects. SHAP analysis revealed mining density as the most influential factor, with a synergistic effect when combined with river proximity, significantly elevating landslide risk. The generated high-resolution susceptibility map accurately identified most areas of Dahe, Yingfeng, and Zhuyuan towns as very high-risk zones, consistent with historical landslide occurrences and field observations, thus validating the model’s reliability. These findings provide critical insights for land-use planning, strongly recommending restrictions on development in high-risk mining and riparian areas while acknowledging practical challenges posed by existing settlements. The study underscores the importance of integrating technical solutions, such as slope stabilization and vegetation restoration, with policy measures like mine reclamation and relocation planning, offering a science-based framework for balancing safety and socioeconomic needs in vulnerable regions worldwide.
Statements
Data availability statement
The original contributions presented in the study are included in the article/supplementary material, further inquiries can be directed to the corresponding author.
Author contributions
HG: Writing – original draft, Writing – review and editing. WW: Writing – review and editing. JL: Methodology, Formal analysis, Writing – review and editing. DB: Conceptualization, Supervision, Writing – review and editing.
Funding
The authors declare that financial support was received for the research and/or publication of this article. This research was financially supported by the Yunnan Provincial Technological Innovation Talent Training Program (Grant No. 202105AD160003) and the Yunnan Provincial Applied Basic Research Program (Grant No. 2018FB080).
Conflict of interest
Author WW was employed by Yellow River Water Conservancy and Hydropower Development Group Co., Ltd.
The remaining authors declare that the research was conducted in the absence of any commercial or financial relationships that could be construed as a potential conflict of interest.
Generative AI statement
The authors declare that no Generative AI was used in the creation of this manuscript.
Any alternative text (alt text) provided alongside figures in this article has been generated by Frontiers with the support of artificial intelligence and reasonable efforts have been made to ensure accuracy, including review by the authors wherever possible. If you identify any issues, please contact us.
Publisher’s note
All claims expressed in this article are solely those of the authors and do not necessarily represent those of their affiliated organizations, or those of the publisher, the editors and the reviewers. Any product that may be evaluated in this article, or claim that may be made by its manufacturer, is not guaranteed or endorsed by the publisher.
Author disclaimer
The authors are solely responsible for the content of this publication.
References
1
Abgrami A. Zhang W. Mao H. Wang L. (2025). GIS-Based comparative landslide susceptibility mapping for Kelardasht county with ANN, SVM and RF models. Civ. Geoengin. Lett., 2(1), e100028. 10.22034/CGEL.2.1.e100028
2
Ahadi E. Rosta D. A. (2024). Landslide susceptibility analysis for Azershahr region using SVM and logistic regression methods. Civ. Geoengin. Lett.1 (2), e100022. 10.22034/CGEL.1.2.e100022
3
Ahmad M. S. Khan S. (2023). Comparative analysis of analytical hierarchy process (AHP) and frequency ratio (FR) models for landslide susceptibility mapping in Reshun, NW Pakistan. Kuwait J. Sci.50 (3), 387–398. 10.1016/j.kjs.2023.01.004
4
Ahmad S. Rizvi Z. Khan M. A. Ahmad J. Wuttke F. (2019). Experimental study of thermal performance of the backfill material around underground power cable under steady and cyclic thermal loading. Mater. today Proc.17, 85–95. 10.1016/j.matpr.2019.06.404
5
Ahmad S. Rizvi Z. H. Arp J. C. C. Wuttke F. Tirth V. Islam S. (2021). Evolution of temperature field around underground power cable for static and cyclic heating. Energies14 (23), 8191. 10.3390/en14238191
6
Ahmad S. Rizvi Z. H. Wuttke F. (2025a). Unveiling soil thermal behavior under ultra-high voltage power cable operations. Sci. Rep.15 (1), 7315. 10.1038/s41598-025-91831-1
7
Ahmad S. Ahmad S. Akhtar S. Ahmad F. Ansari M. A. (2025b). Data-driven assessment of corrosion in reinforced concrete structures embedded in clay dominated soils. Sci. Rep.15 (1), 22744. 10.1038/s41598-025-08526-w
8
Al-Najjar H. Kalantar B. Pradhan B. Beydoun G. Ueda N. (2025). SHapley additive exPlanations (SHAP) for landslide susceptibility models: shedding light on explainable AI. ISPRS Ann. Photogrammetry, Remote Sens. Spatial Inf. Sci.X-G-2025, 81–85. 10.5194/isprs-annals-X-G-2025-81-2025
9
Ali A. Teku D. Sisay T. Mihret B. (2025). A combined analysis of frequency ratio and analytical hierarchy process for landslide susceptibility assessment in Tenta, South Wollo, Ethiopia. Sci. Rep.15 (15), 17899. 10.1038/s41598-025-94611-z
10
Alsabhan A. H. Sadique M. R. Ahmad S. Alam S. Binyahya A. S. (2021). The effect of opening shapes on the stability of underground tunnels: a finite element analysis. Geomate J.21 (87), 19–27. 10.21660/2021.87.j2267
11
Asmare D. (2023). Application and validation of AHP and FR methods for landslide susceptibility mapping around choke mountain, northwestern Ethiopia. Sci. Afr.19, e01470. 10.1016/j.sciaf.2022.e01470
12
Badapalli P. K. Nakkala A. B. Kottala R. B. Gugulothu S. Hasher F. F. B. Mishra V. N. et al (2025). Landslide susceptibility level mapping in Kozhikode, Kerala, using machine learning-based random forest, remote sensing, and GIS techniques. Land14 (7), 1453. 10.3390/land14071453
13
Biswas B. Rahaman A. Barman J. (2023). Comparative assessment of FR and AHP models for landslide susceptibility mapping for Sikkim, India and preparation of suitable mitigation techniques. J. Geol. Soc. India99 (6), 791–801. 10.1007/s12594-023-2386-x
14
Cemiloglu A. Zhu L. Mohammednour A. B. Azarafza M. Nanehkaran Y. A. (2023). Landslide susceptibility assessment for Maragheh County, Iran, using the logistic regression algorithm. Land12 (7), 1397. 10.3390/land12071397
15
Chung C. J. F. Fabbri A. G. (2003). Validation of spatial prediction models for landslide hazard mapping. Nat. hazards30 (3), 451–472. 10.1023/A:1026181114302
16
Danlu C. H. E. N. Deliang S. U. N. Haijia W. E. N. Qingyu G. U. (2023). LightGBM-SHAP landslide susceptibility by different factor screening methods. J. Beijing Normal Univ. Nat. Sci.60 (1), 148–158. 10.12202/j.0476-0301.2023098
17
Fawcett T. (2006). An introduction to ROC analysis. Pattern Recognit. Lett.27 (8), 861–874. 10.1016/j.patrec.2005.10.010
18
Gariano S. L. Guzzetti F. (2016). Landslides in a changing climate. Earth-science Rev.162, 227–252. 10.1016/j.earscirev.2016.08.011
19
Ghayur Sadigh A. Alesheikh A. A. Bateni S. M. Jun C. Lee S. Nielson J. R. et al (2024). Comparison of optimized data-driven models for landslide susceptibility mapping. Environ. Dev. and Sustain.26 (6), 14665–14692. 10.1007/s10668-023-03212-1
20
Guo Z. Tian B. Li G. Huang D. Zeng T. He J. et al (2023). Landslide susceptibility mapping in the Loess Plateau of northwest China using three data-driven techniques-a case study from middle Yellow river catchment. Front. Earth Sci.10, 1033085. 10.3389/feart.2022.1033085
21
Guoliang D. U. Zhihua Y. A. N. G. Ying Y. U. A. N. Sanshao R. Tao R. (2021). Landslide susceptibility mapping in the sichuan-tibet traffic corridor using logistic regression-information value method. Hydrogeology and Eng. Geol.48 (5), 102–111. 10.16030/j.cnki.issn.1000-3665.202104009
22
Guzzetti F. Carrara A. Cardinali M. Reichenbach P. (1999). Landslide hazard evaluation: a review of current techniques and their application in a multi-scale study, Central Italy. Geomorphology31 (1-4), 181–216. 10.1016/S0169-555X(99)00078-1
23
Hamedi A. Nejhad S. M. Mofrad H. H. (2025). AHP-based susceptibility Analyais for Landslides in FumanfCounty, northwestern Iran. Civ. Geoengineering Lett.2 (1), e100030. 10.22034/CGEL.2.1.e100030
24
Haykin S. (1994). Neural networks: a comprehensive foundation. Upper Saddle River, NJ: Prentice hall PTR.
25
Hesterberg T. (2011). Bootstrap. Wiley Interdiscip. Rev. Comput. Stat.3 (6), 497–526. 10.1002/wics.182
26
Hungr O. Leroueil S. Picarelli L. (2014). The Varnes classification of landslide types, an update. Landslides11 (2), 167–194. 10.1007/s10346-013-0436-y
27
Kalantar B. Pradhan B. Naghibi S. A. Motevalli A. Mansor S. (2018). Assessment of the effects of training data selection on the landslide susceptibility mapping: a comparison between support vector machine (SVM), logistic regression (LR) and artificial neural networks (ANN). Geomatics, Nat. Hazards Risk9 (1), 49–69. 10.1080/19475705.2017.1407368
28
Khan D. Akram W. Ullah S. (2025). Enhancing landslide susceptibility predictions with XGBoost and SHAP: a data-driven explainable AI method. Geocarto Int.40 (1), 2514725. 10.1080/10106049.2025.2514725
29
Le X. H. Choi C. Eu S. Yeon M. Lee G. (2024). Quantitative evaluation of uncertainty and interpretability in machine learning-based landslide susceptibility mapping through feature selection and explainable AI. Front. Environ. Sci.12, 1424988. 10.3389/fenvs.2024.1424988
30
Lee S. Pradhan B. (2007). Landslide hazard mapping at Selangor, Malaysia using frequency ratio and logistic regression models. Landslides4 (1), 33–41. 10.1007/s10346-006-0047-y
31
Li M. Tian H. (2025). Insights from optimized non-landslide sampling and SHAP explainability for landslide susceptibility prediction. Appl. Sci.15 (3), 1163. 10.3390/app15031163
32
Li Y. Lei Y. Chen B. Chen J. (2025). Evaluation of geological hazard susceptibility based on the multi-kernel density information method. Sci. Rep.15 (1), 7892. 10.1038/s41598-025-91713-6
33
Liu M. Xu B. Li Z. Mao W. Zhu Y. Hou J. et al (2023). Landslide susceptibility zoning in Yunnan Province based on SBAS-InSAR technology and a random forest model. Remote Sens.15 (11), 2864. 10.3390/rs15112864
34
Liu X. Shao S. Shao S. (2024). Landslide susceptibility zonation using the analytical hierarchy process (AHP) in the great Xi’an Region, China. Sci. Rep.14 (1), 2941. 10.1038/s41598-024-53630-y
35
Liu L. Wang P. Su L. Li F. (2025). Landslide data sample augmentation and landslide susceptibility analysis in Nyingchi City based on the MCMC model. Sci. Rep.15 (1), 25624. 10.1038/s41598-025-10651-5
36
Manan W. A. A. Rashid A. S. A. Rahman M. A. Khanan M. F. A. (2022). “Assessment on recent landslide susceptibility mapping methods: a review,” 971. Bristol: IOP Publishing. 10.1088/1755-1315/971/1/012032
37
Mandal S. Mandal K. (2018). Modeling and mapping landslide susceptibility zones using GIS based multivariate binary logistic regression (LR) model in the Rorachu river basin of eastern Sikkim Himalaya, India. Model. Earth Syst. Environ.4 (1), 69–88. 10.1007/s40808-018-0426-0
38
Matougui Z. Daksi Y. M. Dib M. Benabbas C. (2025). Decoupling urban and non-urban landslides for susceptibility mapping in transitional landscapes, 2025. Göttingen: EGUsphere, 1–33. 10.5194/egusphere-2025-1623
39
Moayedi H. Mehrabi M. Mosallanezhad M. Rashid A. S. A. Pradhan B. (2019). Modification of landslide susceptibility mapping using optimized PSO-ANN technique. Eng. Comput.35 (3), 967–984. 10.1007/s00366-018-0644-0
40
Nanehkaran Y. A. Mao Y. Azarafza M. Kockar M. K. Zhu H. H. (2021). Fuzzy-based multiple decision method for landslide susceptibility and hazard assessment: a case study of Tabriz, Iran. Geomechanics Eng.24 (5), 407–418. 10.12989/gae.2021.24.5.407
41
Peng L. Sun Y. Zhan Z. Shi W. Zhang M. (2023). FR-weighted GeoDetector for landslide susceptibility and driving factors analysis. Geomatics, Nat. Hazards Risk14 (1), 2205001. 10.1080/19475705.2023.2205001
42
Razavizadeh S. Solaimani K. Massironi M. Kavian A. (2017). Mapping landslide susceptibility with frequency ratio, statistical index, and weights of evidence models: a case study in northern Iran. Environ. Earth Sci.76 (14), 499. 10.1007/s12665-017-6839-7
43
Reichenbach P. Rossi M. Malamud B. D. Mihir M. Guzzetti F. (2018). A review of statistically-based landslide susceptibility models. Earth-science Rev.180, 60–91. 10.1016/j.earscirev.2018.03.001
44
Rizvi Z. H. Mustafa S. H. Sattari A. S. Ahmad S. Furtner P. Wuttke F. (2020). “Dynamic lattice element modelling of cemented geomaterials,” in Advances in computer methods and geomechanics. Lecture notes in civil engineering. Editors PrashantA.SachanA.DesaiC. (Singapore: Springer), 55, 655–665. 10.1007/978-981-15-0886-8_53
45
Sahin E. K. (2020). Assessing the predictive capability of ensemble tree methods for landslide susceptibility mapping using XGBoost, gradient boosting machine, and random forest. SN Appl. Sci.2 (7), 1308. 10.1007/s42452-020-3060-1
46
Sahin E. K. (2022). Comparative analysis of gradient boosting algorithms for landslide susceptibility mapping. Geocarto Int.37 (9), 2441–2465. 10.1080/10106049.2020.1831623
47
Shang H. Su L. Liu Y. Tsangaratos P. Ilia I. Chen W. et al (2025). Assessment of the effects of characterization methods selection on the landslide susceptibility: a comparison between logistic regression (LR), naive bayes (NB) and radial basis function network (RBF Network). Bull. Eng. Geol. Environ.84 (3), 134. 10.1007/s10064-025-04097-2
48
Tesfa C. (2022). GIS-based AHP and FR methods for landslide susceptibility mapping in the Abay gorge, dejen–renaissance bridge, central, Ethiopia. Geotechnical Geol. Eng.40 (10), 5029–5043. 10.1007/s10706-022-02197-4
49
Van Westen C. J. Castellanos E. Kuriakose S. L. (2008). Spatial data for landslide susceptibility, hazard, and vulnerability assessment: an overview. Eng. Geol.102 (3-4), 112–131. 10.1016/j.enggeo.2008.03.010
50
Wang Y. Nanehkaran Y. A. (2024). GIS-based fuzzy logic technique for mapping landslide susceptibility analyzing in a coastal soft rock zone. Nat. Hazards120 (12), 10889–10921. 10.1007/s11069-024-06649-3
51
Wang J. Wang Y. Li C. Li Y. Qi H. (2024). Landslide susceptibility evaluation based on landslide classification and ANN-NFR modelling in the Three Gorges Reservoir area, China. Ecol. Indic.160, 111920. 10.1016/j.ecolind.2024.111920
52
Yan Z. Zhang B. Guo J. Chen J. Cao Z. (2020). “Study of landslide susceptibility prediction based on information value model: a case study of Ningdu area,”, 440. Bristol: IOP Publishing. 10.1088/1755-1315/440/5/052029IOP Conf. Ser. Earth Environ. Sci.5052029
53
Yang Y. Y. Xu Y. S. Shen S. L. Yuan Y. Yin Z. Y. (2015). Mining-induced geo-hazards with environmental protection measures in Yunnan, China: an overview. Bull. Eng. Geol. Environ.74 (1), 141–150. 10.1007/s10064-014-0608-6
54
Ye P. Yu B. Chen W. Feng Y. Zhou H. Luo X. et al (2024). Risk assessment of landslide and rockfall hazards in hilly region of southwestern China: a case study of Qijiang, Wuxi and Chishui. Environ. Earth Sci.83 (13), 398. 10.1007/s12665-024-11698-9
55
Yeganeh A. Nazari R. Zhu D. Tagizadeh P. Chen Z. (2025). Landslide Inveniory Database for Hazard Assessment in the Alborz Mountains, Iran. Civ. Geoengineering Lett.2 (1), e100035. 10.22034/CGEL.2.1.e100035
56
Yu H. Pei W. Zhang J. Chen G. (2023). Landslide susceptibility mapping and driving mechanisms in a vulnerable region based on multiple machine learning models. Remote Sens.15 (7), 1886. 10.3390/rs15071886
57
Zhang H. Zhang R. Ju Q. Kong G. Xie Y. He J. et al (2023). Analysis of extreme precipitation variation characteristics and the influencing factors in the Yunnan-Guizhou Plateau Region, China. Sustainability15 (20), 14735. 10.3390/su152014735
58
Zhang X. Zhang M. Liu X. Terfa B. K. Nam W. H. Gu X. et al (2024). Review on the progress and future prospects of geological disasters prediction in the era of artificial intelligence. Nat. Hazards120, 11485–11525. 10.1007/s11069-024-06673-3
59
Zhao Z. Liu Z. Y. Xu C. (2021). Slope unit-based landslide susceptibility mapping using certainty factor, support vector machine, random forest, CF-SVM and CF-RF models. Front. Earth Sci.9, 589630. 10.3389/feart.2021.589630
60
Zhu Y. Peng S. Lin Z. Huang B. Li T. Zhang R. et al (2025). Landslide susceptibility assessment and attribution analysis in Yunnan Province based on weighted information value-logistic regression model. Geomatics, Nat. Hazards Risk16 (1), 2525428. 10.1080/19475705.2025.2525428
61
Zighmi K. Zahri F. Faqeih K. Al Amri A. Riheb H. Alamri S. M. et al (2025). AHP multi criteria analysis for landslide susceptibility mapping in the Tellian Atlas chain. Sci. Rep.15 (1), 25747. 10.1038/s41598-025-10819-z
Summary
Keywords
landslide susceptibility, ensemble learning, shap, ROC, Fuyuan county
Citation
Geng H, Wang W, Liu J and Benson D (2025) Landslide susceptibility modeling based on SHAP interpretability and ensemble learning: a case study in Fuyuan County, Southwest China. Front. Earth Sci. 13:1731872. doi: 10.3389/feart.2025.1731872
Received
24 October 2025
Revised
06 November 2025
Accepted
10 November 2025
Published
27 November 2025
Volume
13 - 2025
Edited by
Erhan Sener, Süleyman Demirel University, Türkiye
Reviewed by
Zarghaam Rizvi, GeoAnalysis Engineering GmbH, Germany
Mohammad Azarafza, University of Tabriz, Iran
Updates
Copyright
© 2025 Geng, Wang, Liu and Benson.
This is an open-access article distributed under the terms of the Creative Commons Attribution License (CC BY). The use, distribution or reproduction in other forums is permitted, provided the original author(s) and the copyright owner(s) are credited and that the original publication in this journal is cited, in accordance with accepted academic practice. No use, distribution or reproduction is permitted which does not comply with these terms.
*Correspondence: Wei Wang, w.wei@exeter.ac.uk
Disclaimer
All claims expressed in this article are solely those of the authors and do not necessarily represent those of their affiliated organizations, or those of the publisher, the editors and the reviewers. Any product that may be evaluated in this article or claim that may be made by its manufacturer is not guaranteed or endorsed by the publisher.