 Michelle M. Casey
 Leigh M. Fall
 Gregory P. Dietl
- 1Geosciences Department, Murray State University, Murray, KY, USA
- 2Earth and Atmospheric Sciences, State University of New York Oneonta, Oneonta, NY, USA
- 3Paleontological Research Institution, Ithaca, NY, USA
- 4Department of Earth and Atmospheric Sciences, Cornell University, Ithaca, NY, USA
Species belonging to the family Naticidae (commonly called moon snails) are important infaunal gastropod predators found in soft-bottom marine communities worldwide that traditionally have been thought to prey on other mollusks, giving them the expected trophic position of a predator (trophic position = 3). Realized trophic position estimates of the naticid Neverita duplicata from Long Island Sound, however, range between 2.3 and 2.5, indicating omnivory or an anomalously low nitrogen (N) fractionation factor. To evaluate the likelihood of omnivory, this study presents whole body stable isotopic analysis of nitrogen and carbon from the soft tissues of laboratory-reared and field-collected N. duplicata. Experimental organisms were maintained on a diet of the bivalve prey Mercenaria mercenaria for 1 year. The median N fractionation factor derived from the experimental moon snails was 3.58‰ thus precluding the presence of an atypical fractionation factor (substantially lower than 3.4‰). Numerous molluscan taxa were collected from Long Island Sound in order to evaluate the trophic ecology of N. duplicata in the context of a natural food web. Evidence from the carbon (C) signatures of field-collected N. duplicata indicate a reliance on littoral food sources that is inconsistent with a diet of filter-feeding M. mercenaria, even when calculated using the species-specific C fractionation factor derived from the laboratory experiment. Field-collected N. duplicata also show considerable isotopic overlap (N and C) with grazing Littorina littorea. For these reasons, we hypothesize that N. duplicata feeds on some combination of benthic primary producers (most likely macroalgae and/or epiphytic diatoms), carrion, and bivalve/gastropod tissue and discuss the possible identity of plants consumed.
Introduction
Species belonging to the globally distributed marine gastropod family Naticidae—commonly referred to as moon snails—have traditionally been considered to be predators that drill distinctive, circular holes in the shells of their bivalve and gastropod prey to gain access to the soft tissues inside (Carriker, 1981; Kitchell et al., 1981). Laboratory experiments confirm that moon snails drill using a combination of radular scraping and the application of weak acid produced by an accessory boring organ (Kabat, 1990), and consume all or most prey tissue (Carriker, 1981; De Angelis et al., 1985; Kitchell et al., 1986; Visaggi et al., 2013). However, recent stable isotopic analyses—a powerful tool for determining dietary sources and complex trophic interactions (Post, 2002; Layman et al., 2012)—yielded realized trophic positions1 for the polinicine naticid Neverita duplicata between 2.3 and 2.5 in Long Island Sound (Casey et al., 2014). The lower than expected trophic positions reported by Casey et al. (2014) resulted from a combination of unexpectedly high carbon signatures and lower than expected nitrogen signatures (Casey and Post, 2011; Casey et al., 2014). The high C signatures indicate that N. duplicata relies heavily on littoral C sources (those that grow along the surface of the seashore). Casey and Post (2011) reported that between 42 and 100% of the diet of N. duplicata from Long Island Sound was derived from littoral sources. These values are inconsistent with a diet of primarily filter-feeding bivalve prey, which show pelagic (more negative) C signatures due to their consumption of phytoplankton. In the absence of factors that can be accounted for methodologically (e.g., isotopic routing, differential lipid concentration, baseline effects; Casey and Post, 2011 and references therein) the discrepancy in N and C signatures may be attributed to trophic omnivory, or feeding from multiple trophic levels (sensu Pimm and Lawton, 1978). In this case, N. duplicata may be feeding on some combination of mollusks and littoral primary producers, making them true omnivores.
Conversely, if N. duplicata is an obligate predator, their low N signatures and high C signatures might be the result of taxonomic differences in discrimination factor, or the difference between the isotopic signatures of source and consumer. Casey and Post (2011) and Casey et al. (2014) employed average discrimination factors for N and C. These average fractionation factors (3.4‰ for N and 0.0‰ for C) were derived experimentally from multiple taxonomic groups (Minagawa and Wada, 1984; Post, 2002) and universally applied to all taxa in food web analyses. Early compilations of discrimination factors targeted diverse organisms from insects to mammals and yielded average discrimination factors showing a ~3.0‰ enrichment in N signature per trophic level increase (Deniro and Epstein, 1981; Minagawa and Wada, 1984) and a 0–1‰ enrichment in C per trophic level increase (Deniro and Epstein, 1978). Increased taxonomic sampling has revealed greater interspecific variation in discrimination factors (Vander Zanden and Rasmussen, 2001; Post, 2002; McCutchan et al., 2003; Vanderklift and Ponsard, 2003; Caut et al., 2009), but provided very little information on the N discrimination factors (Δ15N) and C discrimination factors (Δ13C) of marine gastropods. To our knowledge, there are only eight published estimates of marine gastropod Δ15N and Δ13C derived from the assimineid species Assiminea japonica and Angustassiminea castanea (Kurata et al., 2001). These estimates vary dramatically with food source, from Δ15N = −0.76‰ when fed marsh litter to Δ15N = 5.73‰ when fed diatoms and from Δ13C = −0.10‰ when fed deposited seston to Δ13C = 5.55‰ when fed soil. No data have been published on the Δ15N or Δ13C of naticids.
This study uses stable isotopic data to evaluate the possible causes of the observed discrepancy in the N and C signatures of N. duplicata in Long Island Sound. Stable isotopic evidence from a controlled laboratory feeding experiment and the soft tissue isotopic signature of several mollusk species, including N. duplicata, collected within the context of a natural food web will be incorporated to test the following hypotheses: (1) N. duplicata possesses a N discrimination factor significantly lower than 3.4‰; (2) N. duplicata engages in trophic omnivory in the wild; and (3) N. duplicata possesses a high C discrimination factor that artificially inflates its apparent reliance on littoral C sources in the wild.
These hypotheses will be evaluated based on the following predictions: (1) if N. duplicata feeds predominantly on mollusks in the wild, but has a low N discrimination factor (hypothesis 1), we expect experimental moon snails to have N signatures statistically indistinguishable from wild-caught moon snails sacrificed before the start of the experiment (pre-experiment individuals); (2) if instead N. duplicata is an omnivore in nature (hypothesis 2), we expect a bivalve-only diet of Mercenaria mercenaria will result in a 1‰ or more increase in the average N signature of experimental moon snails relative to pre-experiment individuals; (3) if N. duplicata's high C discrimination factor is responsible for its apparent reliance on littoral C (hypothesis 3), we expect field-collected N. duplicata to yield dietary proportion estimates that are predominately pelagic when calculated using the taxon-specific C discrimination factor derived from the laboratory experiment; (4) if instead N. duplicata feeds on littoral primary producers or their secondary consumers (i.e., hypothesis 3 is incorrect), we expect field-collected N. duplicata to continue to yield predominantly littoral estimates of dietary proportion, even when calculated using the taxon-specific C discrimination factor derived from the laboratory experiment.
Materials and Methods
Laboratory Experiment
To evaluate hypothesis 1, moon snails from Long Island Sound (LIS) were collected and fed individuals from one of their common bivalve prey species to examine the N and C discrimination factors recorded in their tissue under controlled feeding conditions. The laboratory food chain was controlled at all levels from primary producer through primary consumer to secondary consumer, therefore, N and C signatures were not used to calculate tropic position in the same manner employed in food web analyses (see Food Web Analysis Section below).
Forty moon snails (N. duplicata) were collected from Milford, Connecticut (CT) (41.209660°, −73.052572°, ± 250 m) on 15 August 2013 during low tide and transported to the Paleontological Research Institution (PRI) in Ithaca, New York (NY). Neverita duplicata represents the secondary consumer in the experiment. Fifteen of the moon snails were randomly selected to include a wide size range and to provide a sufficient number of individuals to capture variation in N signature. Moon snail specimens ranged in whorl diameter (width) from 21.1 to 36.1 mm (Table 1). Moon snails were not sexed and represent a mixture of males and females. On 16 August 2013, 15 moon snails were placed in separate 37.9 liter, closed-recirculating tanks to avoid competition among predators for prey resources. Tanks were filled with LIS sand to a depth of 10 cm, sufficient for both predator and prey to burrow. Sand was previously sieved, rinsed with freshwater, and stored dry before use. The remaining 25 moon snails (pre-experiment individuals) were frozen to provide starting N and C signatures of the experiment. Every 2 weeks the water in the 15 experimental tanks was changed out with seawater made from Instant Ocean®. Temperature and salinity in the tanks was maintained between ~21–23°C and ~32–34‰, respectively.
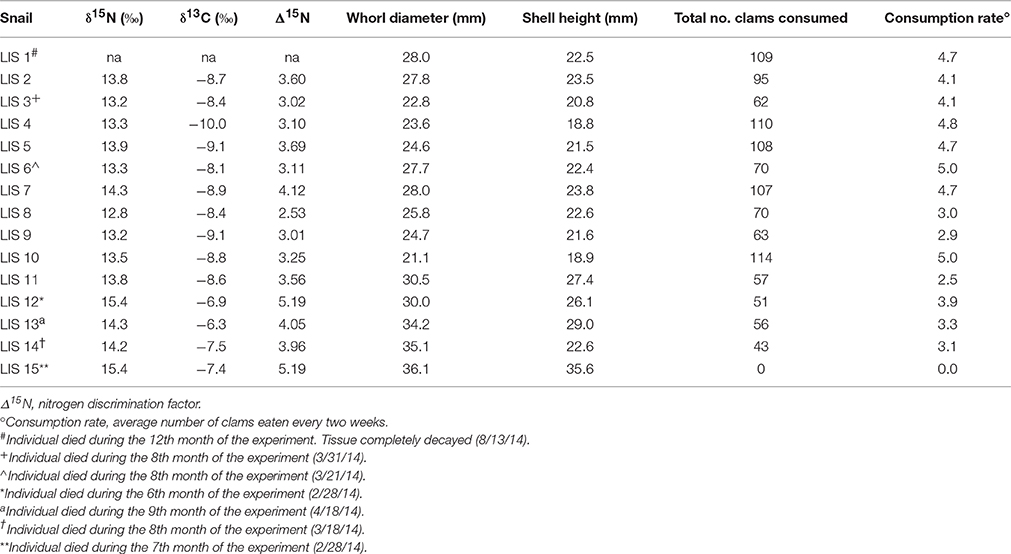
Table 1. Isotopic signatures, discrimination factors, body size, and consumption rate for experimental Neverita duplicata.
Infaunal bivalves are a common prey for moon snails. The hard clam Mercenaria mercenaria was chosen as the experimental prey item because this primary consumer is widely known to be included in the diet of N. duplicata (Edwards, 1974; Kitchell et al., 1981; Visaggi et al., 2013) and is easily accessible. The filter-feeding diet of M. mercenaria is reflected in their pelagic (more negative) C signatures (Casey and Post, 2011). Approximately 2000 individuals (antero-posterior width = 8.1 ± 0.4 mm, and height = 7.2 ± 0.4mm; mean ± SD) were obtained from the Aquaculture Program at the Cornell Cooperative Extension of Suffolk County, NY. Fifteen were frozen to provide starting N and C signatures, and the remaining hard clams were kept in six 37.9 liter bivalve stock tanks filled with 10 cm of LIS sand. At the start of the experiment, hard clams were approximately evenly divided among the tanks, with about 330 individuals in each. This number of individuals corresponds to 232 clams/m2, which is well below the densities typically found in aquacultural nurseries (Hadley and Manzi, 1984). When the water was changed out every 2 weeks, hard clams were fed 250 ml of a prepared algae (Micro Algae Grow™), which serves as the primary producer at the base of our food chain. The exclusion of littoral primary producers from the laboratory setup precluded experimental organisms from having mixed diets (e.g., feeding on multiple C sources).
Moon snails were fed five hard clams from alternating bivalve stock tanks every 2 weeks when the water was changed out. For example, a snail was fed five randomly selected hard clams from stock tank 1 and then hard clams from stock tank 2 the following change out. Before new hard clams were added, the number of drilled hard clams was recorded and any uneaten hard clams were removed, placed in a holding tank, and not used again. The number of hard clams consumed by each moon snail during each 2-week period was recorded. Any snail found dead was immediately frozen for stable isotopic analysis in order to minimize the effects of decay on isotopic signature.
To ensure that N and C from the experimental diet had ample time to be incorporated into the tissue of N. duplicata, the experiment was run for 1 year, exceeding durations of other invertebrate experiments reported in the literature. For marine invertebrates, the duration of experiments performing N and C analyses have ranged from 60 days to 6 months (e.g., Doering et al., 1986; Rudnick and Resh, 2005; Piola et al., 2006). On 13 August 2014, at the end of the year-long experiment, all remaining moon snails were frozen for isotopic analysis.
Potential biasing factors were assessed to insure that they were not influencing the isotopic signatures of post-experiment moon snails, including: starvation or stress of experimental moon snails, differences in body size, and isotopic variability of the laboratory food source. In order to test for any effects consumption rate may have had on N signature, consumption (measured as total number of consumed hard clams and average bi-weekly consumption rate) was plotted against N signature. A negative correlation between hard clam consumption and N signature may indicate that high N signatures resulted from protein catabolism in starving animals rather than from feeding on hard clam prey. In addition, moon snails were checked daily for signs of stress that might indicate insufficient nutrition and possible protein catabolism (e.g., lack of burrowing, retraction of soft tissues into the shell, discoloration of soft tissue). To ensure that the largest individuals were not maintaining pre-experiment isotopic signatures due to slow tissue turnover (indicated by a negative correlation between body size and N signature; (Sweeting et al., 2005), whorl diameter (as a proxy for body size) was regressed against N signature. At the time of each water change out, one randomly selected hard clam from each hard clam holding tank was frozen to evaluate the isotopic baseline and homogeneity of the food source, in terms of both N and C, over the course of the experiment. These data were used to rule out shifts in the isotopic signatures of the hard clam food sources as a potential driver of any observed changes in the N or C signature of post-experiment moon snails.
Food Web Analysis
To evaluate hypothesis 2, that N. duplicata engages in omnivory in the wild, the isotopic signatures of a variety of bivalve and gastropod taxa collected by Casey et al. (2014) from Milford, CT in 2007 and multiple locations within LIS during the summer of 2008 were reanalyzed. Taxa collected include: filter-feeding mussels (Mytilus edulis and Geukensia demissa), grazing periwinkles (Littorina littorea), deposit feeding mud snails (Tritia obsoleta, formerly Ilyanassa obsoleta), filter-feeding hard clams (M. mercenaria), filter-feeding slipper limpets (Crepidula fornicata), predatory naticids (N. duplicata), predatory muricids (Urosalpinx cinerea and Nucella lapillus), and predatory channeled whelks (Busycotypus canaliculatus). This food web incorporates all of the common shallow water N. duplicata prey taxa identified in accumulations of dead mollusk shells from sediments in LIS by Casey et al. (2014). From west to east, the 2008 sites include: Rye, NY, Bridgeport, CT, Milford, CT, Guilford, CT, and Westerly, Rhode Island (Figure 1). When comparing organisms from multiple sites, isotopic baselines, or the isotopic signatures at the base of the food web, can vary widely and bias diet or trophic position estimates. Therefore, we followed Casey et al. (2014) and used baseline proxies to account for differences in the C and N signatures of plants at the base of the food web (Post, 2002; Casey and Post, 2011). Carbon and N signatures of field-collected N. duplicata and their relative position within the greater LIS food web were used to identify or exclude potential plant food sources. Published isotopic values were obtained from the literature for LIS upland land plants and marsh grass detritus (Peterson et al., 1985)2 and compared to the C signatures of field-collected moon snails. In the context of the present study, the isotopic data were used to evaluate the trophic position of N. duplicata within a natural food web.
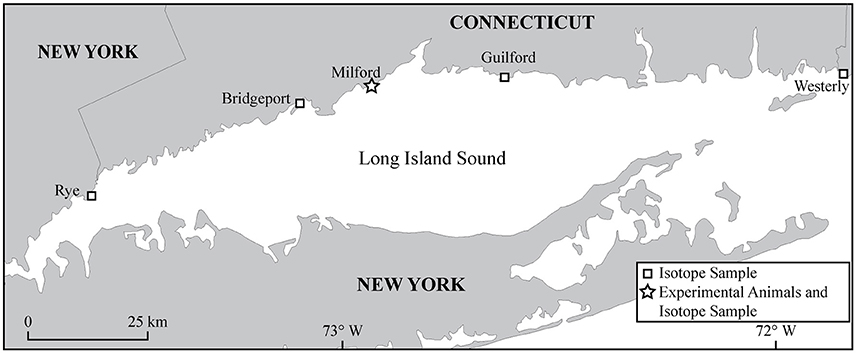
Figure 1. Map of Long Island Sound. Symbols show sample locations of field-collected (from Casey et al., 2014) and experimental specimens.
Analytical Methods
Isotopic signatures of C and N from experimental specimens were analyzed in the same manner used by Casey et al. (2014) to allow direct comparisons to be made. Whole-body samples were analyzed to preclude any differences in isotopic signatures due to compositional differences between tissues or isotopic routing, which complicate stable isotope studies where whole-body analysis is impractical or impossible (Schwarcz, 1991, 2002), and allow direct comparison with previously published isotopic values of drilling gastropods (e.g., Casey and Post, 2011; Casey et al., 2014). Isotopic routing, or the routing of dietary components with different isotopic signatures to separate body compartments such that isotopic signatures of individual tissues do not reflect the bulk diet of the organism, is particularly prevalent when dealing with potential omnivores (Layman et al., 2012 and references therein).
Mollusk soft tissue was removed from the shell, cleaned of the digestive tract, dried at 40°C, and ground to a powder using a porcelain mortar and pestle or cryogenic grinder. Laboratory samples were analyzed on a ThermoFinnigan MAT 253 Continuous Flow System with Elemental Analyzer at the University of Kansas' W. M. Keck Paleoenvironmental and Environmental Stable Isotope Laboratory (K-PESIL). The standard deviation of replicated standards was 0.14‰ for δ13C and 0.40‰ for δ15N (K-PESIL). All isotopic signatures are expressed in standard per mil notation. The standard reference for C is Pee Dee Belemnite and for N is the atmosphere.
Because lipids tend to be depleted in 13C relative to whole body or bulk diet compositions, the C isotopic signatures of experimental and field-collected specimens were lipid corrected using the C:N ratio method of Post et al. (2007). Trophic position of field-collected specimens was calculated using the equations and baseline proxies of Casey and Post (2011). Two end-member mixing models accounted for the baseline by using the C signatures of baseline proxy taxa and target taxa to calculate the proportion of dietary C derived from pelagic primary producers (α), which was then incorporated into the calculation of trophic position (Post, 2002; Casey and Post, 2011). The effect of N discrimination factor on the trophic position estimates was assessed by comparing trophic position calculated using the 3.4‰ published estimate of average N discrimination factor (Minagawa and Wada, 1984; Post, 2002) and the N discrimination factor observed in the laboratory experiment. Estimates of α were used to evaluate mixing of C sources in field-collected specimens. To evaluate hypothesis 3, estimates of ɑ were calculated twice, first assuming that Δ13C = 0, and a second time using the average value of Δ13C measured in the laboratory experiment.
Statistical Methods
To test for significant differences in central tendency of isotopic signatures and estimates of discrimination factors, the Mann-Whitney U (Wilcoxon) test, a non-parametric test of difference in median, was performed. The non-parametric Kruskal-Wallis H test for multiple comparisons was applied when comparing medians of more than two groups. Non-parametric tests were used because the distributions of isotopic signatures and estimates of discrimination factors each failed a Shapiro-Wilk test for normality making parametric tests for difference in mean unsuitable. The relationships between N isotopic signature and prey consumption (total number consumed and average number consumed in a 2-week period) and N signature and body size were evaluated using Pearson Product Moment Correlation tests. Use of the less powerful, non-parametric, rank-based Spearman correlation test did not change any patterns of significance. All statistical analyses were run using PAST (Hammer et al., 2001).
Results
Laboratory Experiment
Nitrogen
Nitrogen discrimination factors of post-experiment moon snails ranged between 2.53 and 5.19‰ (Table 1) with a median of 3.58‰ (Figure 2A). The Δ15N estimates of pre-experiment individuals ranged between 2.57 and 3.75‰ with a median of 2.89‰ (Figure 2A). The post-experiment median Δ15N represented a statistically significant increase of 24% (Mann-Whitney U = −2.30, n1 = 9, n2 = 14, p = 0.02) relative to the median Δ15N of wild-caught moon snails sacrificed before the experiment. This result was robust in spite of the removal of the two post-experiment moon snails expressing the highest Δ15N (Table 1) that died before the conclusion of the experiment (Mann-Whitney U = −1.95, n1 = 9, n2 = 14, p = 0.05). Nitrogen signatures of moon snails sacrificed before the experiment ranged between 12.8 and 14.0‰ with a median value of 13.1‰ (Figure 2B), whereas the N signatures of post-experiment moon snails ranged between 12.8 and 15.4‰ (Table 1) with a median value of 13.8‰ (Figure 2B).
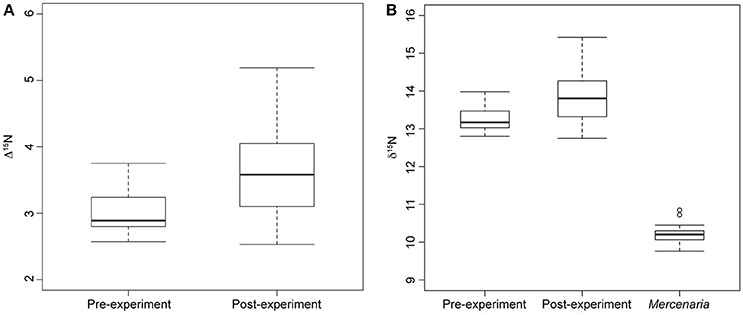
Figure 2. Box plots showing median, standard deviation, minimum, and maximum nitrogen discrimination factors and nitrogen signatures. (A) Median nitrogen discrimination factor of moon snails sacrificed before the start of the experiment (Pre-experiment) and moon snails sacrificed after the year-long experiment (Post-experiment). Discrimination factor calculated as nitrogen signature of moon snails minus average M. mercenaria nitrogen signature. (B) Nitrogen signatures of experimental M. mercenaria including two outliers, pre-experiment moon snails, and post-experiment moon snails.
Carbon
Carbon signatures of experimental N. duplicata varied between −6.3 and −10.0‰ (Table 1). The difference in median C signature between pre- and post-experiment moon snails was not significant (Mann-Whitney U = −1.73, n1 = 9, n2 = 14, p = 0.08). The median C discrimination factor (the difference in δ13C between post-experiment moon snails and the mean bivalve signature) was 1.90‰.
Check for Laboratory Artifacts
None of the potential biasing factors evaluated could account for the N pattern we found in the experiment. Experimental moon snails exhibited no signs of stress (e.g., retraction into shell, discoloration, discharge of fluids, abnormal burrowing behavior). The N signature of post-experiment moon snails was not significantly correlated with the total number of hard clams consumed (r2 = 0.00, n = 14, p = 0.99) or the bi-weekly consumption rate (r2 = 0.00, n = 14, p = 0.99). Baseline-corrected N signature of post-experiment moon snails was significantly, positively correlated with body size, measured as whorl diameter of the shell in mm (Supplementary Image 1; r2 = 0.48, n = 14 p = 0.01).
Minimal variation was evident in the isotopic signatures of the hard clam food source used in the laboratory experiment throughout the duration of the year-long study. There was no significant difference in median δ15N among hard clams sacrificed during the first half of the experiment (August 2013–January 2014, median = 10.26‰, n = 9) and those sacrificed during the second half of the experiment (February 2014–August 2014, median = 10.11‰, n = 8) (Mann-Whitney U = −0.24, n1 = 9, n2 = 8, p = 0.81). There was, however, a small, significant difference in the median δ13C between hard clams sacrificed during the first half of the experiment (median = −10.64‰) and hard clams sacrificed during the second half of the experiment (median = −10.13‰) (Mann-Whitney U = −2.84, n1 = 9, n2 = 8, p = 0.005). There were no significant differences between hard clams from different holding tanks in terms of median N signature (Kruskal-Wallis, H = 1.71, n1 = n2 = 3, n3 = 11, p = 0.43) or median C signature (Kruskal-Wallis, H = 0.10, n1 = n2 = 3, n3 = 11, p = 0.95). Carbon and N signatures of hard clams in the laboratory were very similar to field-collected M. mercenaria from Westerly (Supplementary Image 2).
Isotopic Food Web Analysis
Nitrogen
In spite of an east to west increase in the isotopic baseline for N, the relative position of N. duplicata within the food web remained relatively constant across localities (Figure 3) and sampling years (Figure 4). No N. duplicata were found at the Westerly locality. The range of N. duplicata N signatures (measured as the difference between site-specific maximum and minimum) was low: 1.2‰ at Rye, 3.0‰ at Bridgeport, 1.5‰ and 2.5‰ at Milford (years 2007 and 2008, respectively), and 0.5‰ at Guilford. Overlap was evident in the N signatures of N. duplicata and those of epiphytic grazers (L. littorea), deposit-feeders (T. obsoleta), and to a lesser extent, their inferred filter-feeding hard clam prey (M. mercenaria) (Figures 3, 4). Published N signatures for upland land plants (δ15N = 0‰) and marsh grass detritus (δ15N = 4‰) from New England (Peterson et al., 1985), were much lower than those of N. duplicata.
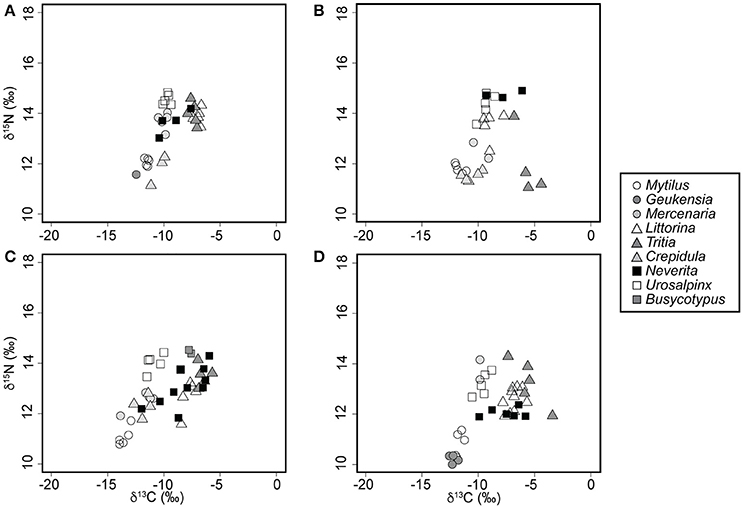
Figure 3. Whole-body nitrogen and carbon signatures of field-collected mollusks sampled during the summer of 2008. (A) Rye, NY. (B) Bridgeport, CT. (C) Milford, CT. (D) Guilford, CT.
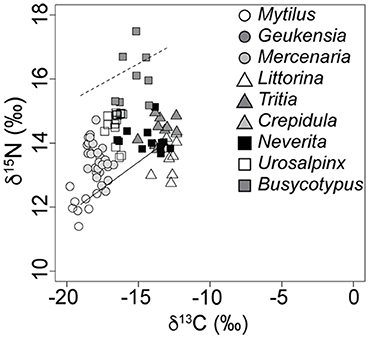
Figure 4. The Milford, CT, food web as sampled during the summer of 2007. Dashed line indicates expected N. duplicata nitrogen signatures if they are predators (average baseline proxy value + 3.4‰). Inclination of the dashed line follows the inclination of the isotopic baseline as measured by proxy taxa (solid line).
Using a N discrimination factor of 3.4‰ (Minagawa and Wada, 1984; Post, 2002), median trophic position of N. duplicata ranged from 1.9 at the Guilford locality to 2.3 at the Milford locality in 2007; individual trophic positions ranged from a minimum of 1.8 to a maximum of 2.5. Median trophic position for the Guilford site was significantly different than all other sites (Kruskal-Wallis H test, H = 13.67, nRye = 4, nBridgeport = 17, nMilford′07 = 12, nMilford′08 = 10, nGuilford = 6, p = 0.01), which were not significantly different from one another (Kruskal-Wallis H test, H = 0.52, nRye = 4, nBridgeport = 17, nMilford′07 = 12, nMilford′08 = 10, p = 0.91). Baseline-corrected N signature of N. duplicata showed a weak but significant, positive correlation with whorl diameter, as a proxy for body size (Supplementary Image 1, r2 = 0.28, n = 45, p = 0.008). Maximum baseline-corrected N signatures occurred in the middle of the body size range.
Carbon
Neverita duplicata collected from LIS had the largest range of C values of any taxon analyzed (Figures 3, 4). The range of N. duplicata C signatures (measured as the difference between site-specific maximum and minimum) was large: 2.8‰ at Rye, 5.7‰ at Bridgeport, 3.7‰ and 4.5‰ at Milford (years 2007 and 2008, respectively), and 4.1‰ at Guilford. The maximum N. duplicata δ13C recorded was −5.8‰ (Guilford); the minimum N. duplicata δ13C recorded was −16.5‰ (Milford in 2007). The C signatures of N. duplicata frequently overlapped with those of epiphytic grazers (L. littorea), omnivorous deposit-feeders (T. obsoleta), and the inferred naticid prey (M. mercenaria) (Figures 3, 4). The percentage of N. duplicata diet derived from pelagic C sources (α) varied between 0% (total reliance on littoral C sources) and 100% (total reliance on pelagic C sources). The published C signatures of upland land plant detritus from New England (Peterson et al., 1985) was δ13C = −28.6‰, far more negative than the range of C signatures of field-collected N. duplicata. The median value of α calculated using the C discrimination factor from the experimental results (1.90‰) was α = 0.40, or 60% littoral, with 40.8% of moon snails (n = 20) deriving more than two thirds of their diet from littoral sources (α ≤ 0.33).
Discussion
The significant increase in the median N signature of post-experiment moon snails relative to pre-experiment moon snails (Figure 2) indicates that preying exclusively on M. mercenaria for 1 year represented a change in diet relative to that consumed in the wild. This result supports hypothesis 2 that N. duplicata from LIS feeds as an omnivore under natural conditions. There is no evidence that N. duplicata has a N discrimination factor lower than the 3.4‰ average used in previous studies of drilling gastropod stable isotope ecology (Casey and Post, 2011; Casey et al., 2014). In fact, the median difference in N signature between post-experiment moon snails and the average value of hard clam prey was 3.58 ± 0.79‰ (median ± standard deviation), higher than the 3.4‰ average of Post (2002), thus refuting hypothesis 1 that N. duplicata has a below average N discrimination factor when feeding on M. mercenaria.
Field evidence further supports omnivory based on the littoral nature of N. duplicata's C signatures. The nearshore, molluscan food web from LIS (Figures 3, 4) shows an inclined isotopic baseline, typical of both marine and lacustrine ecosystems (Post, 2002; Casey et al., 2014), in which pelagic primary producers display substantially lower (more negative) δ13C and slightly lower δ15N signatures than littoral primary producers (inclined solid line, Figure 4). The inclined isotopic baseline accentuates the pattern of lower-than-expected trophic positions. The difference in N signatures between littoral and pelagic primary producers at the base of the food web means that a N. duplicata with a more negative C signature (greater reliance on pelagic C sources) has a higher trophic position than a N. duplicata with a less negative C signature (greater reliance on littoral C sources), even if both individuals have the same δ15N value. In addition to lower-than-expected δ15N values, N. duplicata has surprisingly high (more littoral) C signatures, which is inconsistent with a diet dominated by filter-feeding hard clams (e.g., M. mercenaria, Figures 3, 4). This pattern persists when dietary proportion is calculated using the taxon-specific Δ13C obtained from the laboratory feeding experiment, thus refuting hypothesis 3.
Finally, the high variability of moon snail isotopic signatures supports an omnivorous diet. Although not necessarily true of all omnivores, high intra-specific variability in diet (in terms of both N and C signature) is consistent with omnivory as individual diets of omnivores are often highly variable due to differences in foraging behaviors, prey preferences, handling capabilities, or the spatial heterogeneity of food sources to which they are exposed (Griffen and Griffen, 2014).
Taken together, these results are surprising—given the extensive body of research that has been conducted on the predatory behavior and prey preferences of N. duplicata (Kitchell et al., 1981)—and likely have broad ecological implications (see Appendix 1). However, multiple alternative explanations for the observed pattern—artifacts related to stress or food source abnormalities and explanations provided by the biology or behavior of naticids—must first be ruled out before accepting a revision of N. duplicata's trophic ecology.
Alternative Explanations
Laboratory Artifacts
Several factors that affect isotopic signatures were controlled for methodologically in our experiment (e.g., lipid corrections to C signatures and the use of whole body tissue analysis to prevent impacts from tissue-specific effects or isotopic routing). Several other factors known to influence isotopic signatures—tissue decay of dead experimental organisms, predator starvation and protein catabolism, abnormalities or temporal variation in the isotopic signature of the experimental prey, reproductive output, and size-dependent differences in rates of tissue turnover—were not controlled for in our experimental design. However, each of these factors can largely be eliminated as a source of potential bias.
The highest N discrimination factor estimates were observed in two moon snails that died before the conclusion of the experiment (Table 1; both individual's Δ15N = 5.19‰). One of the moon snails (LIS 12) had been feeding but died before the conclusion of the experiment and was frozen within 36 h after death to prevent decay of tissues. It is unclear whether short periods of decay (less than 36 h) would lead to significantly enriched N signatures (Payo-Payo et al., 2013). LIS 15 was the other high N discrimination factor moon snail. This individual was the largest moon snail in the study and did not feed (likely because the prey were too small). Tissues of starving animals show steady enrichment in 15N as lean body mass decreases due to catabolism of the body's own proteins and preferential excretion of light N (Gannes et al., 1997 and references therein). It is worth noting, however, that omission of these two moon snails does not change the significance of the observed increase in median Δ15N. It is unlikely that the other experimental moon snails were starving or experiencing stress that would cause any unexpected alterations of the N signature as they consumed large numbers of prey (Table 1). The N signature of post-experiment moon snails showed no correlation with either the number of hard clams consumed or the average biweekly rate of hard clam consumption, which indicates that the high N signatures are not the result of the number of prey consumed. Furthermore, experimental hard clam prey yielded N and C signatures similar to field-collected con-specifics from LIS (Supplementary Image 2), and did not change or exhibit any abnormalities through the course of the experiment in a way that would explain the observed increase in average N or C signature of experimental moon snails.
One potential limitation of this study is the fact that the sex of each post-experiment moon snail is not known. This precludes the evaluation of differences in δ15N signatures between the sexes due to isotopic routing during the allocation of resources toward reproduction (del Rio et al., 2009). However, because fertilization of eggs occurs internally in N. duplicata (Hanks, 1960) the only way that the estimated N signatures could have been biased by reproductive output was if egg collars were produced by females. As no egg collars were observed in the experimental tanks during the course of the experiment, all reproductive tissues likely remained within the body of experimental moon snails. The whole body tissue analysis employed in this study captured the bulk isotopic signatures of both male and female moon snails, including their internally stored reproductive tissues. Thus, whole body isotopic analysis precluded any isotopic routing in reproductive tissues from substantially biasing the isotopic signatures measured during this experiment.
The differential rates at which tissues are built or maintained with constituents from a new diet, or tissue turnover rates, can result in lingering effects of the previous diet's isotope ratio (McCutchan et al., 2003; Sweeting et al., 2005). Fast-growing juveniles incorporate new nutrients into their body more quickly than slower growing adults (Hentschel, 1998), meaning that isotopic differences between individuals of varying sizes may be an artifact of nutrient turnover rates (Rossi et al., 2004). In the absence of data on rates of tissue turnover in marine gastropods, experimental moon snails were maintained on a hard clam diet for a full year as a precaution, longer than many marine invertebrate diet-switching studies that typically last weeks to 6 months (e.g., Doering et al., 1986; Rudnick and Resh, 2005; Piola et al., 2006). A slow tissue turnover rate would bias against seeing a shift in isotopic signatures even if the natural diet of N. duplicata was different from their experimental diet. Whereas, slight differences in tissue turnover rates may account for the variability of N and C signatures recorded, the fact that a significant increase in N signature was observed largely negates the role of turnover rates as a source of experimental bias. In the absence of viable alternative explanations for the observed increase in median N signature of post-experiment moon snails, the experimental results refute hypothesis 1, that moon snails have a below average Δ15N, and support hypothesis 2, that N. duplicata feeds on some type of plant material in the wild.
Isotopic Food Web Analysis
Several factors may affect the N and C signatures of field-collected moon snails, including cannibalism, changes in diet with growth (ontogenetic niche shifts), some physiologic or metabolic process unique to predatory marine gastropods, or higher than expected C fractionation factor. As was the case for laboratory artifacts, each of these factors can be largely eliminated from this study. Neverita duplicata is known to be a frequent con-specific or con-familial cannibal (Carriker, 1951; Kitchell et al., 1981; Dietl and Alexander, 1995). If cannibalism was prevalent among the LIS specimens sampled, cannibalistic moon snails would have increased N signatures relative to those of other N. duplicata, rather than lower than expected N signatures, and trophic position greater than 3. According to Chattopadhyay et al. (2014) cannibalism is more common in large-bodied individuals than small-bodied individuals. Although there is a weak but significant, positive correlation between body size and baseline-corrected N signature for field specimens (Supplementary Image 1), none of the N. duplicata sampled has a trophic position greater than 3 that would indicate cannibalism.
Life-history omnivory, or switching between plant and animal food sources at different life stages, is likely to affect isotopic signature. Neverita duplicata has a pelagic larval stage that feeds on microalgae (Hanks, 1960). As all specimens of N. duplicata sampled from the field were 17 mm in whorl diameter or larger (Supplementary Image 1), or approximately 9 months to 1 year in age (Hanks, 1960; Edwards and Huebner, 1977), it is very unlikely that any individuals retained veliger stage isotopic signatures that could explain the omnivorous δ15N values measured in this study. It is important, however, to distinguish between discrete post-metamorphosis or larval diet changes and the more gradual ontogenetic niche shifts documenting changes in preferred bivalve and gastropod prey with increasing naticid size. Many naticids alter their prey preferences as they increase in body size to favor larger individuals and larger taxa (Kabat, 1990; Clements and Rawlings, 2014). The weak, positive correlation between field-collected N. duplicata baseline-corrected N signature and body size (Supplementary Image 1) may suggest that changes in bivalve and gastropod prey preference affect N signature (i.e., represent a gradual ontogenetic niche shift). As discussed above (see Laboratory Artifacts Section), a positive correlation between body size and N signature may be explained by the size-dependent nature of isotopic turnover in tissues (McCutchan et al., 2003; Rossi et al., 2004; Sweeting et al., 2005). The isotopic signature of prey items (be they bivalves or plants) change seasonally, therefore isotopic differences in moon snails of varying sizes may reflect the variable rates at which large and small moon snails incorporate this seasonally variable prey into their tissues rather than a difference in diet. Therefore, more evidence will be necessary to tease apart the effects of size-dependent differences in nutrient incorporation rate from those of ontogenetic changes in prey preference. Even if gradual ontogenetic niche shifts do occur in N. duplicata, they do not explain why trophic position is not greater than 2.5 in the field-collected moon snails presumably feeding on bivalve and gastropod prey. Nor are gradual ontogenetic niche shifts consistent with the fact that the highest trophic position estimates do not correspond to the largest individuals.
The presence of a physiologic or metabolic process that may bias the N signature of marine predatory gastropods was evaluated by comparing N. duplicata with other field-collected marine gastropod predators. The channeled whelk, Busycotypus canaliculatus, is a gastropod predator that preys on bivalves by wedging its prey's shell open using the lip of its own shell. The channeled whelk shows congruence between its potential trophic position (3) and realized trophic position (2.9) (Supplementary Table 1; Figure 4). The realized trophic position of the channeled whelk thus confirms that lower than expected trophic positions of N. duplicata are not characteristic of all gastropod predators (although they may be present within another family of drilling gastropods; see Appendix 2).
To evaluate the possibility that a higher than expected C fractionation factor biased results (hypothesis 3), field-collected samples were evaluated using the estimates of Δ13C derived in our laboratory experiment. The pattern of higher-than-expected (more littoral) C signatures may be partially explained by the laboratory C discrimination factor of + 1.90 ± 0.99‰ (median ± SD). This +1.90‰ C discrimination factor is in contrast to the 0.0 to + 1.0‰ difference between source and consumer cited in most compilations of average C discrimination factor (Vander Zanden and Rasmussen, 2001; Post, 2002; McCutchan et al., 2003; Vanderklift and Ponsard, 2003; Caut et al., 2009). Incorporation of the laboratory C discrimination factor (1.9‰) into calculations of α for moon snails from the field yielded a distribution of α that is not consistent with a diet of predominately filter-feeding (pelagic-sourced) prey or assimilation of undigested phytoplankton present in the gut of filter-feeding prey, thus refuting hypothesis 3. The littoral nature of these C signatures is surprising and cannot be explained by the unintentional inclusion of detritus or undigested food from the gut in the processed isotopic samples, given the extremely small digestive tract of N. duplicata (Strong, 2003). Nor are the N signatures of N. duplicata high enough to be consistent with a diet that includes prey that derive C from littoral sources, e.g., littoral grazers such as the periwinkle, L. littorea, or omnivorous deposit-feeders such as the mud snail, T. obsoleta (see dashed line in Figure 4). In the absence of viable alternative explanations for the observed trophic position and littoral C signatures, the field data support hypothesis 2, that N. duplicata feeds as an omnivore in nature. For this reason, we hypothesize that N. duplicata feeds on some combination of benthic primary producers, carrion, and bivalve/gastropod tissue.
Possible Identity of Plants Consumed
Our hypothesis that N. duplicata includes plant material in its diet is not unprecedented within the Naticidae. Using microscopic gut content analysis, Bernard (1967) noted that post-settlement juveniles of the polinicine naticid Euspira lewisii from Vancouver Island, British Columbia ate plant material both in the wild and under experimental conditions (but see Pedersen and Page, 2000). At first, juvenile E. lewisii consumed epiphytic diatoms living on the macroalgae Ulva sp., and eventually grazed on the macroalgae itself (Bernard, 1967). Consumption of both epiphytic diatoms and Ulva sp. is consistent with the isotopic signatures of field-collected N. duplicata discussed above. Bernard (1967) further observed that E. lewisii transitioned to a drilling habit during their 5th or 6th month of life, likely coinciding with the seasonal disappearance of Ulva sp. during the late winter to early spring. By contrast, Pedersen and Page (2000) found that the presence of the algae Ulva sp. was not sufficient to induce metamorphosis in E. lewisii and did not observe juveniles consuming algae in the laboratory. Similarly, Hanks (1960) found that juveniles (4–6 weeks post-metamorphosis) of N. duplicata collected from Barnstable Harbor, Massachusetts, did not consume an unidentified macroalgae under laboratory conditions. The observations of Hanks (1960) and Pedersen and ? are inconsistent with our isotopic data and the observations of Bernard (1967). These conflicting results highlight the need for additional, careful feeding observations and experiments (both field and laboratory based) with N. duplicata.
One way to identify potential plant species suitable for future N. duplicata feeding experiments is to examine the diets of other marine snails with similar C and N signatures in the food web analyzed herein3. The isotopic signature of N. duplicata shows considerable overlap with mud snails and periwinkles, both of which have well-documented diets. Mud snails are opportunistic scavengers that primarily eat benthic diatoms through deposit-feeding (Wetzel, 1977; Connor and Edgar, 1982) but have been known to consume fish and crab carrion (Scheltema, 1964; Curtis and Hurd, 1979; Feller, 1984), the sea lettuce Ulva lactuca (Giannotti and McGlathery, 2001), detritus-associated bacteria (Wetzel, 1977; Curtis and Hurd, 1979), and even the egg cases and recently hatched juveniles of its competitor Cerithidea californica (Race, 1982). Although the diet of T. obsoleta appears to be analogous to that of N. duplicata because both feed from multiple trophic levels, N. duplicata shows no signs of detritus within the digestive tract (pers. obs.) making it highly unlikely that they act as deposit-feeders.
The periwinkle L. littorea, also isotopically similar to N. duplicata, is a grazer that feeds primarily on ephemeral, foliose green algae, such as U. lactuca and Enteromorpha intestinalis (Watson and Norton, 1985), and epiphytic diatoms, including Melosira nummuloides, Ulothrix implexa, and the ciliate Vorticella spp. (Sommer, 1999). Whereas, some members of the genus Littoraria farm fungus on the stalks of the cordgrass Spartina alterniflora in salt marsh habitats (Silliman and Newell, 2003), the periwinkles analyzed herein belong to the genus Littorina and were collected exclusively from cobbles located in sand flat habitats. Littorina littorea and N. duplicata both possess taenioglossan (rake-like) radulae (Carriker, 1981; Steneck and Watling, 1982) suitable for feeding on meat and a wide variety of algae, including tough, leathery, or coralline forms (Steneck and Watling, 1982) and epiphytic diatoms (those living on the surface of other plants). It thus seems likely that N. duplicata may also feed on epiphytic diatoms or macroalgae for which its radula is well-suited. For these reasons, epiphytic diatom and macroalgal species eaten by L. littorea make compelling candidates for future dietary experiments or natural history observations on N. duplicata.
Recommendations
The results from this study can be used to generate recommendations for future research on the ecology of N. duplicata. The plants incorporated into the diet of N. duplicata could be taxonomically identified using additional methods: (1) Immunoassays of N. duplicata and potential food items could be conducted to assess the presence of very broad or very narrow categories of diet items in the gut depending on the antisera developed, e.g., benthic diatoms vs. the benthic diatom Melosira nummuloides (see Feller, 1984). (2) Radiometric C labeling experiments are another promising means of detecting the presence of specific littoral primary producers in the diet of N. duplicata (see Wetzel, 1977). (3) Genetic methods, including DNA barcoding, could be used to identify aquatic plant species present in gut contents (see Saunders and McDevit, 2012). (4) Laboratory experiments measuring growth and survival of organisms maintained on herbivorous vs. carnivorous vs. mixed diets could be used to differentiate facultative from obligate omnivory (see Curtis and Hurd, 1979). The individuals from these feeding experiments could also be used to evaluate the potential decrease in N. duplicata's N discrimination factor associated with a change in diet quality (specifically the effect of decreased diet quality—lower C:N ratios—associated with consuming plants (Bearhop et al., 2004; del Rio et al., 2009), although the application of the average Δ15N value (3.4‰) is likely appropriate for future trophic studies of moon snails where the identification of omnivory, rather than the high resolution estimation of trophic position, is the goal.
Conclusions
Stable isotopic evidence from a laboratory experiment and field collections indicate that the naticid N. duplicata is an omnivore. This new stable isotopic evidence indicates that N. duplicata likely feeds on benthic diatoms or littoral marcoalgae in addition to molluscan prey and scavenged carcasses. Neverita duplicata shows a wide range of N discrimination factors when fed a diet of known composition, the median of which is 3.58‰. Increases in δ15N signature of N. duplicata fed exclusively M. mercenaria for 1 year cannot be explained by lab effects, predator starvation, differential reproduction, or peculiarities in the hard clam food source. The heavy reliance of field-collected N. duplicata on littoral C sources supports the omnivory interpretation. Lower-than-expected N signatures in field-collected moon snails cannot be explained by cannibalism, taxonomic prey preference, or the presence of ontogenetic niche shifts. Whereas preliminary results from other predatory gastropod taxa (e.g., B. canaliculatus) indicate that omnivory is not ubiquitous among predatory marine gastropods, the spatial and taxonomic extent of this pattern is not yet known. The prevalence of omnivory among drilling gastropods will be key to exploring potential ecological implications of omnivorous behavior.
Author Contributions
MC, GD, and LF conceived and designed the experiment. GD and LF performed the experiment. MC analyzed the isotopic samples and resultant data. All authors contributed to the writing of the manuscript. MC drafted Figure 1. LF drafted all other figures.
Funding
This project was funded by the Geological Society of America Graduate Student Research Grant, the Paleontological Society Richard Osgood Student Research Award, the SUNY Oneonta Faculty Research Grant Program, and the SUNY Oneonta Individual Development Awards Program.
Conflict of Interest Statement
The authors declare that the research was conducted in the absence of any commercial or financial relationships that could be construed as a potential conflict of interest.
The reviewer EA and handling Editor declared their shared affiliation, and the handling Editor states that the process nevertheless met the standards of a fair and objective review.
Acknowledgments
We would like to thank the following: Tom Butler, Annalee Tweitmann and Steve Durham (Cornell) for help running the laboratory experiment; Gerry Olack (Yale), Greg Cane (K-PESIL), and John Pollak (Cornell) for laboratory assistance; Gregg Rivara (Cornell Cooperative Extension) for supplying M. mercenaria prey; Daniel Casey, Joanna Wolfe, Úna Farrell, and Emily Einstein, for help with field collections; and EA, FR, and JS for thoughtful reviews.
Supplementary Material
The Supplementary Material for this article can be found online at: http://journal.frontiersin.org/article/10.3389/fevo.2016.00125/full#supplementary-material
Footnotes
1. ^The potential trophic position of predatory moon snails, or the value expected based on the list of possible trophic interactions for the group (Kling et al., 1992), is 3.0, though it may be as high as 3.5 in situations where confamilial predation is common (Carriker, 1951; Kitchell et al., 1981; Chattopadhyay et al., 2014). Realized trophic position, calculated using both N and C signatures (Post, 2002) often deviates from potential trophic position as it reflects the identity and proportion of resources actually used (Kling et al., 1992) given that animals do not consume every possible food item at all times or in equal proportions.
2. ^Although these values were not collected at the same time as our study organisms, given the extreme isotopic dissimilarity between upland land plants or marsh grass and the rest of the food web under study, they are likely reasonable approximations.
3. ^Due to the diffusion resistance of CO2 in water, littoral plants are unable to fully express their fractionation factor as they are essentially utilizing a finite pool of C. Because their C isotopic signature is driven primarily by this boundary layer effect and not taxon-specific differences, it is impossible to distinguish between different species of littoral primary producers in N. duplicata's diet using isotopes because their C signatures would be too similar.
References
Anderson, L. C., Geary, D. H., Nehm, R. H., and Allmon, W. D. (1991). A comparative study of naticid gastropod predation on Varicorbula caloosae and Chione cancellata, Plio-Pleistocene of Florida, USA. Palaeogeogr. Palaeoclimatol. Palaeoecol. 85, 29–46. doi: 10.1016/0031-0182(91)90024-L
Bearhop, S., Adams, C. E., Waldron, S., Fuller, R. A., and Macleod, H. (2004). Determining trophic niche width: a novel approach using stable isotope analysis. J. Animal Ecol. 73, 1007–1012. doi: 10.1111/j.0021-8790.2004.00861.x
Behrens, M. D., and Lafferty, K. D. (2007). Temperature and diet effects on omnivorous fish performance: implications for the latitudinal diversity gradient in herbivorous fishes. Can. J. Fish. Aquat. Sci. 64, 867–873. doi: 10.1139/f07-063
Bernard, F. R. (1967). Studies on the Biology of the Naticid Clam Drill Polinices lewisii (Gould) (Gastropoda Prosobranchiata). Nanaimo, BC: Fisheries Research Board of Canada.
Boersma, M., Mathew, K. A., Niehoff, B., Schoo, K. L., Franco-Santos, R. M., and Meunier, C. L. (2016). Temperature driven changes in the diet preference of omnivorous copepods: no more meat when it's hot? Ecol. Lett. 19, 45–53. doi: 10.1111/ele.12541
Carriker, M. R. (1951). Observations on the penetration of tightly closing bivalves by Busycon and other predators. Ecology 32, 73–83. doi: 10.2307/1930973
Carriker, M. R. (1981). Shell penetration and feeding by Naticacean and Muricacean predatory gastropods: a synthesis. Malacologia 20, 403–422.
Casey, M. M., Dietl, G. P., Post, D. M., and Briggs, D. E. G. (2014). The impact of eutrophication and commercial fishing on molluscan communities in Long Island Sound, USA. Biol. Conserv. 170, 137–144. doi: 10.1016/j.biocon.2013.12.037
Casey, M. M., and Post, D. M. (2011). The problem of isotopic baseline: reconstructing the diet and trophic position of fossil animals. Earth Sci. Rev. 106, 131–148. doi: 10.1016/j.earscirev.2011.02.001
Caut, S., Angulo, E., and Courchamp, F. (2009). Variation in discrimination factors (delta N-15 and delta C-13): The effect of diet isotopic values and applications for diet reconstruction. J. Appl. Ecol. 46, 443–453. doi: 10.1111/j.1365-2664.2009.01620.x
Chattopadhyay, D., Sarkar, D., Dutta, S., Prasanjit, S. R., Chattopadhyay, D., Sarkar, D., et al. (2014). What controls cannibalism in drilling gastropods? A case study on Natica tigrina. Palaeogeogr. Palaeoclimatol. Palaeoecol. 410, 126–133. doi: 10.1016/j.palaeo.2014.05.037
Clements, J. C., and Rawlings, T. A. (2014). Ontogenetic shifts in the predatory habits of the Northern Moonsnail (Lunatia heros) on the northwestern Atlantic coast. J. Shellfish Res. 33, 755–768. doi: 10.2983/035.033.0310
Coll, M., and Guershon, M. (2002). Omnivory in terrestrial arthropods: mixing plant and prey diets. Annu. Rev. Entomol. 47, 267–297. doi: 10.1146/annurev.ento.47.091201.145209
Connor, M. S., and Edgar, R. K. (1982). Selective grazing by the mud snail Ilyanassa obsoleta. Oecologia 53, 271–275. doi: 10.1007/BF00545676
Cottrell, T. E., and Yeargan, K. V. (1998). Effect of pollen on Coleomegilla maculata (Coleoptera: Coccinellidae) population density, predation, and cannibalism in sweet corn. Environ. Entomol. 27, 1402–1410. doi: 10.1093/ee/27.6.1402
Curtis, L. A., and Hurd, L. E. (1979). On the broad nutritional requirements of the mud snail, Ilyanassa (Nassarius) obsoleta (Say), and its polytrophic role in the food web. J. Exp. Mar. Biol. Ecol. 41, 289–297. doi: 10.1016/0022-0981(79)90137-0
De Angelis, D. L., Kitchell, J. A., and Post, W. M. (1985). The influence of naticid predation on evolutionary strategies of bivalve prey - Conclusions from a model. Am. Naturalist 126, 817–842. doi: 10.1086/284455
del Rio, C. M., Wolf, N., Carleton, S. A., and Gannes, L. Z. (2009). Isotopic ecology ten years after a call for more laboratory experiments. Biol. Rev. 84, 91–111. doi: 10.1111/j.1469-185X.2008.00064.x
Deniro, M. J., and Epstein, S. (1978). Influence of diet on distribution of carbon isotopes in animals. Geochim. Cosmochim. Acta 42, 495–506. doi: 10.1016/0016-7037(78)90199-0
Deniro, M. J., and Epstein, S. (1981). Influence of diet on the distribution of nitrogen isotopes in animals. Geochim. Cosmochim. Acta 45, 341–351. doi: 10.1016/0016-7037(81)90244-1
Dietl, G. P., and Alexander, R. R. (1995). Borehole site and prey size stereotypy in naticid predation on Euspira (Lunatia) heros Say and Neverita (Polinices) duplicata Say from the southern New Jersey coast. J. Shellfish Res. 14, 307–314.
Doering, P. H., Oviatt, C. A., and Kelly, J. R. (1986). The effects of the filter-feeding clam Mercenaria mercenaria on carbon cycling in experimental marine mesocosms. J. Mar. Res. 44, 839–861. doi: 10.1357/002224086788401611
Edwards, D. C. (1974). Preferred prey of Polinices duplicatus in Cape Cod inlets. Bull. Am. Malacol. Union 40, 17–20.
Edwards, D. C., and Huebner, J. D. (1977). Feeding and growth rates of Polinices duplicatus preying on Mya arenaria at Barnstable Harbor, Massachusetts. Ecology 58, 1218–1236. doi: 10.2307/1935077
Eubanks, M. D. (2005). “Predaceous herbivores and herbivorous predators,” in Ecology of Predator-Prey Interactions, eds P. Barbosa and I. Castellanos (Oxford: Oxford University Press), 3–16.
Eubanks, M. D., and Denno, R. F. (1999). The ecological consequences of variation in plants and prey for an omnivorous insect. Ecology 80, 1253–1266. doi: 10.1890/0012-9658(1999)080[1253:TECOVI]2.0.CO;2
Fall, L. M., Flessa, K. W., Dettman, D. L., Dietz, R. D., and Rowell, K. (2011). Nitrogen isotopes in preservable hard parts indicate trophic level: a case study from the Gulf of California. Geol. Soc. Am. Abstr. Programs 43, 379. Available online at: https://gsa.confex.com/gsa/2011AM/finalprogram/abstract_196587.htm
Feller, R. J. (1984). Dietary immunoassay of Ilyanassa obsoleta, the Eastern Mud Snail. Biol. Bull. 166, 96–102. doi: 10.2307/1541433
Gannes, L. Z., O'Brien, D. M., and Martinez del Rio, C. (1997). Stable isotopes in animal ecology: assumptions, caveats, and a call for more laboratory experiments. Ecology 78, 1271–1276. doi: 10.1890/0012-9658(1997)078[1271:SIIAEA]2.0.CO;2
Giannotti, A. L., and McGlathery, K. J. (2001). Consumption of Ulva lactuca (Chlorophyta) by the omnivorous mud snail Ilyanassa obsoleta (Say). J. Phycol. 37, 209–215. doi: 10.1046/j.1529-8817.2001.037002209.x
Griffen, B., and Griffen, B. (2014). Linking individual diet variation and fecundity in an omnivorous marine consumer. Oecologia 174, 121–130. doi: 10.1007/s00442-013-2751-3
Hadley, N. H., and Manzi, J. J. (1984). Growth of seed clams, Mercenaria mercenaria, at various densities in a commercial scale nursery system. Aquaculture 36, 369–378. doi: 10.1016/0044-8486(84)90329-6
Hammer, Ø., Harper, D. A. T., and Ryan, P. D. (2001). PAST: Paleontological statistics software package for education and data analysis. Palaeontologica Electronica 4, 9. Available online at: http://palaeo-electronica.org/2001_1/past/past.pdf
Hanks, J. E. (1960). The Early Life History of the New England Clam Drills, Polinices duplicatus (Say), Polinices heros (Say), and Polinices triseriata (Say) (Naticidae: Gastropoda). PhD, University of New Hampshire.
Harmon, J., Ives, A., Losey, J., Olson, A., and Rauwald, K. (2000). Coleomegilla maculata (Coleoptera: Coccinellidae) predation on pea aphids promoted by proximity to dandelions. Oecologia 125, 543–548. doi: 10.1007/s004420000476
Hentschel, B. T. (1998). Intraspecific variations in δ13C indicate ontogenetic diet changes in deposit-feeding polychaetes. Ecology 79, 1357–1370. doi: 10.1890/0012-9658(1998)079[1357:IVICIO]2.0.CO;2
Kabat, A. R. (1990). Predatory ecology of naticid gastropods with a review of shell boring predation. Malacologia 32, 155–193.
Kelley, P. H., and Hansen, T. A. (2007). “Latitudinal patterns in naticid gastropod predation along the east coast of the United States: a modern baseline for interpreting temporal patterns in the fossil record,” in Sediment-Organism Interactions: A Multifaceted Ichnology, Vol. 88, eds R. G. Bromely, L. A. Buatois, M. G. Mangano, J. F. Genise, and R. N. Melchor (Special Publication-SEPM), 287–299.
Kelley, P. H., and Hansen, T. A. (2003). “The fossil record of drilling predation on bivalves and gastropods,” in Predator-Prey Interactions in the Fossil Record, eds P. H. Kelley, M. Kowalewski, and T. A. Hansen (New York, NY: Kluwer Academic/Plenum Publishers), 113–140.
Kitchell, J. A., Boggs, C. H., Kitchell, J. F., and Rice, J. A. (1981). Prey selection by naticid gastropods: experimental tests and application to the fossil record. Paleobiology 7, 533–552. doi: 10.1017/S0094837300025574
Kitchell, J. A., Boggs, C. H., Rice, J. A., Kitchell, J. F., Hoffman, A., and Martinell, J. (1986). Anomalies in naticid predatory behavior: a critique and experimental observations. Malacologia 27, 291–298.
Kling, G. W., Fry, B., and O'Brien, W. J. (1992). Stable isotopes and planktonic trophic structure in arctic lakes. Ecology 73, 561–566. doi: 10.2307/1940762
Kowalewski, M. (1990). A hermeneutic analysis of the shell-drilling gastropod predation on mollusks in the Korytnica Clays (Middle Miocene; Holy Cross Mountains, Central Poland). Acta Geol. Polonica 40, 183–213.
Kurata, K., Minami, H., and Kikuchi, E. (2001). Stable Isotope Analysis of Food Sources for Salt Marsh Snails. Oldendorf: Inter-Research.
Layman, C. A., Araujo, M. S., Boucek, R., Hammerschlag-Peyer, C. M., Harrison, E., Jud, Z. R., et al. (2012). Applying stable isotopes to examine food web structure: an overview of analytical tools. Biol. Rev. 87, 545–562. doi: 10.1111/j.1469-185X.2011.00208.x
Long, Z. T., Bruno, J. F., Duffy, J. E., Long, Z. T., Bruno, J. F., and Duffy, J. E. (2011). Food chain length and omnivory determine the stability of a marine subtidal food web. J. Anim. Ecol. 80, 586–594. doi: 10.1111/j.1365-2656.2010.01800.x
McCutchan, J. H., Lewis, W. M., Kendall, C., and McGrath, C. C. (2003). Variation in trophic shift for stable isotope ratios of carbon, nitrogen, and sulfur. Oikos 102, 378–390. doi: 10.1034/j.1600-0706.2003.12098.x
Minagawa, M., and Wada, E. (1984). Stepwise enrichment of 15N along food chains: further evidence and the relation between δ15N and animal age. Geochim. Cosmochim. Acta 48, 1135–1140. doi: 10.1016/0016-7037(84)90204-7
Payo-Payo, A., Ruiz, B., Cardona, L., and Borrell, A. (2013). Effect of tissue decomposition on stable isotope signatures of striped dolphins Stenella coeruleoalba and loggerhead sea turtles Caretta caretta. Aquat. Biol. 18, 141–147. doi: 10.3354/ab00497
Pedersen R. V. K. Page L. R. (2000). Development and metamorphosis of the planktotrophic larvae of the moon snail, Polinices lewisii (Gould, 1847) (Caenogastropoda: Naticoidea). Veliger 43, 58–63. Available online at: http://www.biodiversitylibrary.org/item/134363#page/64/mode/1up
Peterson, B. J., Howarth, R. W., and Garritt, R. H. (1985). Multiple stable isotopes used to trace the flow of organic-matter in estuarine food webs. Science 227, 1361–1363. doi: 10.1126/science.227.4692.1361
Pimm, S. L., and Lawton, J. H. (1978). On feeding on more than one trophic level. Nature 275, 542–544. doi: 10.1038/275542a0
Piola, R. F., Moore, S. K., and Suthers, I. M. (2006). Carbon and nitrogen stable isotope analysis of three types of oyster tissue in an impacted estuary. Estuarine Coast. Shelf Sci. 66, 255–266. doi: 10.1016/j.ecss.2005.08.013
Post, D. M. (2002). Using stable isotopes to estimate trophic position: models, methods, and assumptions. Ecology 83, 703–718. doi: 10.1890/0012-9658(2002)083[0703:USITET]2.0.CO;2
Post, D. M., Layman, C. A., Arrington, D. A., Takimoto, G., Quattrochi, J., and Montana, C. G. (2007). Getting to the fat of the matter: Models, methods and assumptions for dealing with lipids in stable isotope analyses. Oecologia 152, 179–189. doi: 10.1007/s00442-006-0630-x
Race, M. S. (1982). Competitive displacement and predation between introduced and native mud snails. Oecologia 54, 337–347. doi: 10.1007/BF00380002
Rossi, F., Herman, P. M. J., and Middelburg, J. J. (2004). Interspecific and intraspecific variation of δC and δN in deposit- and suspension-feeding bivalves (Macoma balthica and Cerastoderma edule): evidence of ontogenetic changes in feeding mode of Macoma balthica. Limnol. Oceanogr. 49, 408–414. doi: 10.4319/lo.2004.49.2.0408
Rudnick, D., and Resh, V. (2005). Stable isotopes, mesocosms and gut content analysis demonstrate trophic differences in two invasive decapod crustacea. Freshw. Biol. 50, 1323–1336. doi: 10.1111/j.1365-2427.2005.01398.x
Saunders, G. W., and McDevit, D. C. (2012). Methods for DNA barcoding photosynthetic protists emphasizing the macroalgae and diatoms. DNA Barcode 858, 207–222. doi: 10.1007/978-1-61779-591-6_10
Scheltema, R. S. (1964). Feeding habits and growth in the mud-snail Nassarius obsoletus. Chesapeake Sci. 5, 161–166. doi: 10.2307/1350560
Schwarcz, H. P. (1991). Some theoretical aspects of isotope paleodiet studies. J. Archaeol. Sci. 18, 261–275. doi: 10.1016/0305-4403(91)90065-W
Schwarcz, H. P. (2002). “Some biochemical aspects of carbon isotopic paleodiet studies,” in Biogeochemical Approaches to Paleodietary Analysis, eds S. H. Ambrose and M. A. Katzenberg (New York, NY: Kluwer Academic/Plenum Publishers), 189–209.
Silliman, B. R., and Newell, S. Y. (2003). Fungal farming in a snail. Proc. Natl. Acad. Sci. U.S.A. 100, 15643–15648. doi: 10.1073/pnas.2535227100
Sommer, U. (1999). The susceptibility of benthic microalgae to periwinkle (Littorina littorea, Gastropoda) grazing in laboratory experiments. Aquat. Bot. 63, 11–21. doi: 10.1016/S0304-3770(98)00108-9
Steneck, R. S., and Watling, L. (1982). Feeding capabilities and limitation of herbivorous molluscs: a functional group approach. Mar. Biol. 68, 299–319. doi: 10.1007/BF00409596
Strong, E. E. (2003). Refining molluscan characters: morphology, character coding and a phylogeny of the Caenogastropoda. Zool. J. Linn. Soc. 137, 447–554. doi: 10.1046/j.1096-3642.2003.00058.x
Sweeting, C. J., Jennings, S., and Polunin, N. V. C. (2005). Variance in isotopic signatures as a descriptor of tissue turnover and degree of omnivory. Funct. Ecol. 19, 777–784. doi: 10.1111/j.1365-2435.2005.01019.x
Thompson, R. M., Hemberg, M., Starzomski, B. M., and Shurin, J. B. (2007). Trophic levels and trophic tangles: the prevalence of omnivory in real food webs. Ecology 88, 612–617. doi: 10.1890/05-1454
Vanderklift, M. A., and Ponsard, S. (2003). Sources of variation in consumer-diet delta N-15 enrichment: a meta-analysis. Oecologia 136, 169–182. doi: 10.1007/s00442-003-1270-z
Vander Zanden, M. J., and Rasmussen, J. B. (2001). Variation in delta N-15 and delta C-13 trophic fractionation: implications for aquatic food web studies. Limnol. Oceanogr. 46, 2061–2066. doi: 10.4319/lo.2001.46.8.2061
Visaggi, C. C., Dietl, G. P., and Kelley, P. H. (2013). Testing the influence of sediment depth on drilling behaviour of Neverita duplicata (Gastropoda: Naticidae), with a review of alternative modes of predation by naticids. J. Molluscan Stud. 79, 310–322. doi: 10.1093/mollus/eyt023
Watson, D. C., and Norton, T. A. (1985). Dietary preferences of the common periwinkle, Littorina littorea (L.). J. Exp. Mar. Biol. Ecol. 88, 193–211. doi: 10.1016/0022-0981(85)90230-8
Wetzel, R. L. (1977). “Carbon resources of a benthic salt marsh invertebrate, Nassarius obeoletus Say (Mollusca: Nassariidae),” in Estuarine Processes: Circulation, sediments and transfer of material in the estuary, ed M. Wiley. (New York, Ny: New York Academic Press), 293–308.
Appendix 1: Ecological Implications
The previously undocumented omnivory of N. duplicata likely has broad ecological implications at both local (individual and population level) and regional scales. Although no study has previously investigated the implications of omnivory in moon snails, analogy with other omnivorous organisms may serve as a useful guide for future research. For example, at the individual level, the benefits that many predominately carnivorous insect taxa gain by eating plants is known to be highly context-specific. Consuming a particular species of plant may be detrimental, slightly beneficial, or very beneficial to an omnivore depending on the amounts and identities of other foods recently consumed (Eubanks and Denno, 1999; Coll and Guershon, 2002). In an analogous way, we hypothesize that the benefits of plant consumption experienced by N. duplicata may include: the ability to persist in habitats after prey have become scarce or habitat quality has decreased; a reduction in search time when prey are scarce; a reduction in interspecific competition; and a reduction in cannibalism. It is impossible to know which of these benefits may come into play for N. duplicata without more data on the environmental context of and the exact plant resources in the diets of omnivorous moon snails.
At the level of the population, N. duplicata omnivory could decouple predator-prey dynamics. We know that populations of omnivorous insects frequently reach higher densities when plant resources are available (Coll and Guershon, 2002; Eubanks, 2005), which leads to increased predation intensity and smaller prey populations in some cases (e.g., Eubanks and Denno, 1999; Harmon et al., 2000). However, the degree of prey suppression can vary based on differences in the persistence of omnivores at low or no prey abundance, the effects of plant feeding on per capita prey consumption and the food preferences of omnivores, and the effect of plant feeding on the dispersal and distribution of omnivores (Eubanks, 2005). For example, Cottrell and Yeargan (1998) found that predation by the lady beetle Colemegilla maculata on the eggs of Helicoverpa zea decreased in the presence of corn pollen, leading to a reduction in predation intensity in spite of an increase in predator density. In contrast, Harmon et al. (2000) found that the effects of C. maculata's decreased per capita consumption of H. zea eggs in the presence of dandelion pollen was out-weighed by the concurrent increase in predator density, leading to an overall increase in predation pressure where supplemental plant food was present. It is thus premature to generalize from these observations what might happen to the intensity of predation, commonly indexed by the frequency of drill-holes in prey shells (Kelley and Hansen, 2003), if N. duplicata is an omnivore. Prevalent omnivory could increase drilling frequency in some situations and decrease it in others. In addition to changes in prey suppression, the nutritional quality of one food type may be altered by the ingestion of another food type, causing the prey preferences of omnivores to appear suboptimal (Eubanks, 2005). If omnivory proves to be true for N. duplicata, the subsequent alteration of bivalve nutritional quality could be a factor in explaining the occasional deviation of naticid prey preferences from predictions based on cost-benefit analysis (e.g., Kowalewski, 1990; Anderson et al., 1991).
Lastly, temperature has been demonstrated to shift the diet preference of omnivores toward the increased consumption of plants when temperatures are high and toward the increased consumption of meat when temperatures are low for both copepods (Boersma et al., 2016) and fish (Behrens and Lafferty, 2007). This pattern is expressed seasonally as well as latitudinally (Boersma et al., 2016) and is likely driven by the increase in performance derived from eating meat that only manifests at low temperatures (Behrens and Lafferty, 2007). If this pattern holds true for N. duplicata, one would predict lower trophic positions during the summer months than other times during the year, and lower trophic positions in the warmer environments experienced by individuals in Florida—the southernmost part of N. duplicata's geographic range along the Atlantic coast of the United States—than cooler environments experienced further north, such as the Long Island Sound sites examined in this study. Additional research on the seasonal and latitudinal patterns of trophic position within N. duplicata is needed, but if the degree of omnivory is found to be temperature dependent, an increased reliance of N. duplicata on plants in the southern part of its range may at least partially explain Kelley and Hansen's (2007) unexpected latitudinal pattern of low drilling frequencies for low-latitude molluscan assemblages from Florida.
Appendix 2: Trophic Position of the Muricidae
The trophic positions of muricid drilling gastropods, U. cinerea and N. lapillus, ranged between 2.3 and 2.5 in LIS (Supplementary Table 1; Figures 3, 4). Though unforeseen, frequent omnivory among predators should not be surprising given the high prevalence of omnivory in marine environments (Long et al., 2011 and references therein) and the lack of empirical evidence for defined trophic levels among predatory taxa (Thompson et al., 2007). In fact, Thompson et al. (2007) characterized the portion of food webs above the level of herbivores as a “tangled web of omnivores.” Data on the trophic position of muricids is limited, however, N signatures derived from the organic residue of Muricanthus sp. shells from the Gulf of California indicate that not all muricid taxa show lower than expected N values (Fall et al., 2011). As suggested in this study on N. duplicata, an unusual fractionation factor could explain the low N signatures present in some muricid species. Additional analyses, such as the laboratory feeding experiment discussed herein, will be necessary to rigorously evaluate alternative explanations for the observed low trophic positions of U. cinerea and N. lapillus. Due to their dissimilar C signatures (Figures 3, 4), it is unlikely that U. cinerea and N. lapillus consume the same epiphytic diatoms or benthic macroalgae thought to be eaten by N. duplicata even if these muricids turn out to be omnivores.
Keywords: carbon, diet, drilling predation, realized trophic position
Citation: Casey MM, Fall LM and Dietl GP (2016) You Are What You Eat: Stable Isotopic Evidence Indicates That the Naticid Gastropod Neverita duplicata Is an Omnivore. Front. Ecol. Evol. 4:125. doi: 10.3389/fevo.2016.00125
Received: 03 May 2016; Accepted: 10 October 2016;
Published: 03 November 2016.
Edited by:
Jordi Figuerola, Estacion Biologica de Doñana - CSIC, SpainReviewed by:
Juan Carlos Senar, Natural History Museum of Barcelona, SpainFrancesca Rossi, Centre National de la Recherche Scientifique, France
Elena Angulo, Estacion Biologica de Doñana - CSIC, Spain
Copyright © 2016 Casey, Fall and Dietl. This is an open-access article distributed under the terms of the Creative Commons Attribution License (CC BY). The use, distribution or reproduction in other forums is permitted, provided the original author(s) or licensor are credited and that the original publication in this journal is cited, in accordance with accepted academic practice. No use, distribution or reproduction is permitted which does not comply with these terms.
*Correspondence: Michelle M. Casey, bWNhc2V5NUBtdXJyYXlzdGF0ZS5lZHU=
†These authors have contributed equally to this work.