 Teja P. Muha
 Marta Rodríguez-Rey
 Matteo Rolla
 Elena Tricarico
- 1Bioscience Department, Swansea University, Swansea, United Kingdom
- 2Department of Biology, University of Florence, Florence, Italy
Species Distribution Models (SDMs) have been reported as a useful tool for the risk assessment and modeling of the pathways of dispersal of freshwater invasive alien species (IAS). Environmental DNA (eDNA) is a novel tool that can help detect IAS at their early stage of introduction and additionally improve the data available for a more efficient management. SDMs rely on presence and absence of the species in the study area to infer the predictors affecting species distributions. Presence is verified once a species is detected, but confirmation of absence can be problematic because this depends both on the detectability of the species and the sampling strategy. eDNA is a technique that presents higher detectability and accuracy in comparison to conventional sampling techniques, and can effectively differentiate between presence or absence of specific species or entire communities by using a barcoding or metabarcoding approach. However, a number of potential bias can be introduced during (i) sampling, (ii) amplification, (iii) sequencing, or (iv) through the usage of bioinformatics pipelines. Therefore, it is important to report and conduct the field and laboratory procedures in a consistent way, by (i) introducing eDNA independent observations, (ii) amplifying and sequencing control samples, (iii) achieving quality sequence reads by appropriate clean-up steps, (iv) controlling primer amplification preferences, (v) introducing PCR-free sequence capturing, (vi) estimating primer detection capabilities through controlled experiments and/or (vii) post-hoc introduction of “site occupancy-detection models.” With eDNA methodology becoming increasingly routine, its use is strongly recommended to retrieve species distributional data for SDMs.
Introduction
Current policies on invasive alien species (IAS) depend on the availability and quality of data used for their risk assessment (Groom et al., 2017). Species Distribution Models (SDMs) use available data of invasive species and are one of the most widely used tools for risk assessment, predicting species distribution and pathways of dispersal (Jiménez-Valverde et al., 2011).
This methodology relates the distribution data of the IAS (e.g., presence and absence records) in the study area with a set of independent spatially explicit variables to explain and predict the range expansion of the species. However, there are limitations on these approaches because of two main reasons: (i) confirmed absences are desirable but scarce in available databases, and (ii) independent data for evaluation is normally not available. The consideration of absences has been reported to provide more accurate predictions of the actual distribution of IAS (Václavík and Meentemeyer, 2009). Therefore, there is a need for tools that allow the recording of presence and absence and a faster compilation of independent data to test spatially explicit models. Efficient spatial monitoring of invasive species vectors of introduction, further dispersal as well as initial detection of newly present species, are crucial for species management as are prevention, control and eradication.
In the recent years, a new environmental molecular tool has been developed- environmental DNA (eDNA). eDNA refers to DNA which can be extracted from environmental samples without separation of specific organisms from the environment (Taberlet et al., 2012). eDNA contains both cellular as well as extracellular DNA from all kinds of organisms. It is subject to high levels of degradation but can be preserved in nature from few weeks up to hundreds of thousands of years (Thomsen and Willerslev, 2015). The ability to detect species through eDNA water samples is relatively novel and has proved as a useful tool for the detection of aquatic IAS (Dejean et al., 2012; Goldberg et al., 2013; Nathan et al., 2014). It can be applied for the detection of a number of specific IAS (barcoding), or detecting multiple IAS as part of whole communities (metabarcoding). New revolutionary techniques for eDNA are being developed on a daily basis with the aim to provide a number of useful information such as, presence or absence of the species (Ficetola et al., 2008), density assessments (Moyer et al., 2014), population dynamics (Sigsgaard et al., 2016), sex (Nichols and Spong, 2017), hybridization process between subspecies, (Uchii et al., 2016; Goricki et al., 2017), spatial representativeness (Civade et al., 2016; Bista et al., 2017) and ability to amplify whole mitochondrial genome (Deiner et al., 2017b). A wide range of eDNA detection possibilities is currently limited. Knowing what are the limitations of eDNA methods is key to successful estimation of species presence (or absence) and estimations of their biological characteristics.
Approach
Nowadays, useful information on IAS within SDMs is in the detection of presence and absence of the species (Ficetola et al., 2008). In this article, we discuss the range of possibilities and limitations with regard to reporting IAS presence or absence using eDNA in freshwater ecosystems in order to obtain additional and more accurate distribution data to be used in the SDMs.
Potential Applications
eDNA has thus far been mainly used in the early detection and monitoring of invasive species, contributing to the increase of IAS presence records. The use of eDNA techniques could facilitate a more effective method for recording IAS absence than do regular monitoring surveys or possibly may aid in the compilation of independent data similar to the approach used for proving (non)successful eradications (Dejean et al., 2012). Currently, eDNA research is focusing its effort on the species detection efficiencies based on the competence of sampling, amplification and sequencing techniques. A detailed review has been conducted based on the potential for the future application of eDNA tool by identifying the proportion of positive detections of IAS within individual research (Table 1). The review proves how useful the tool can be dealing with IAS detection. A recent increase in presented eDNA research conducted on invasive species is only the tip of the iceberg of what can be achieved for conservation and IAS management. There is however a number of limitations that should be remembered before applying eDNA data to retrieve distribution data for SDMs.
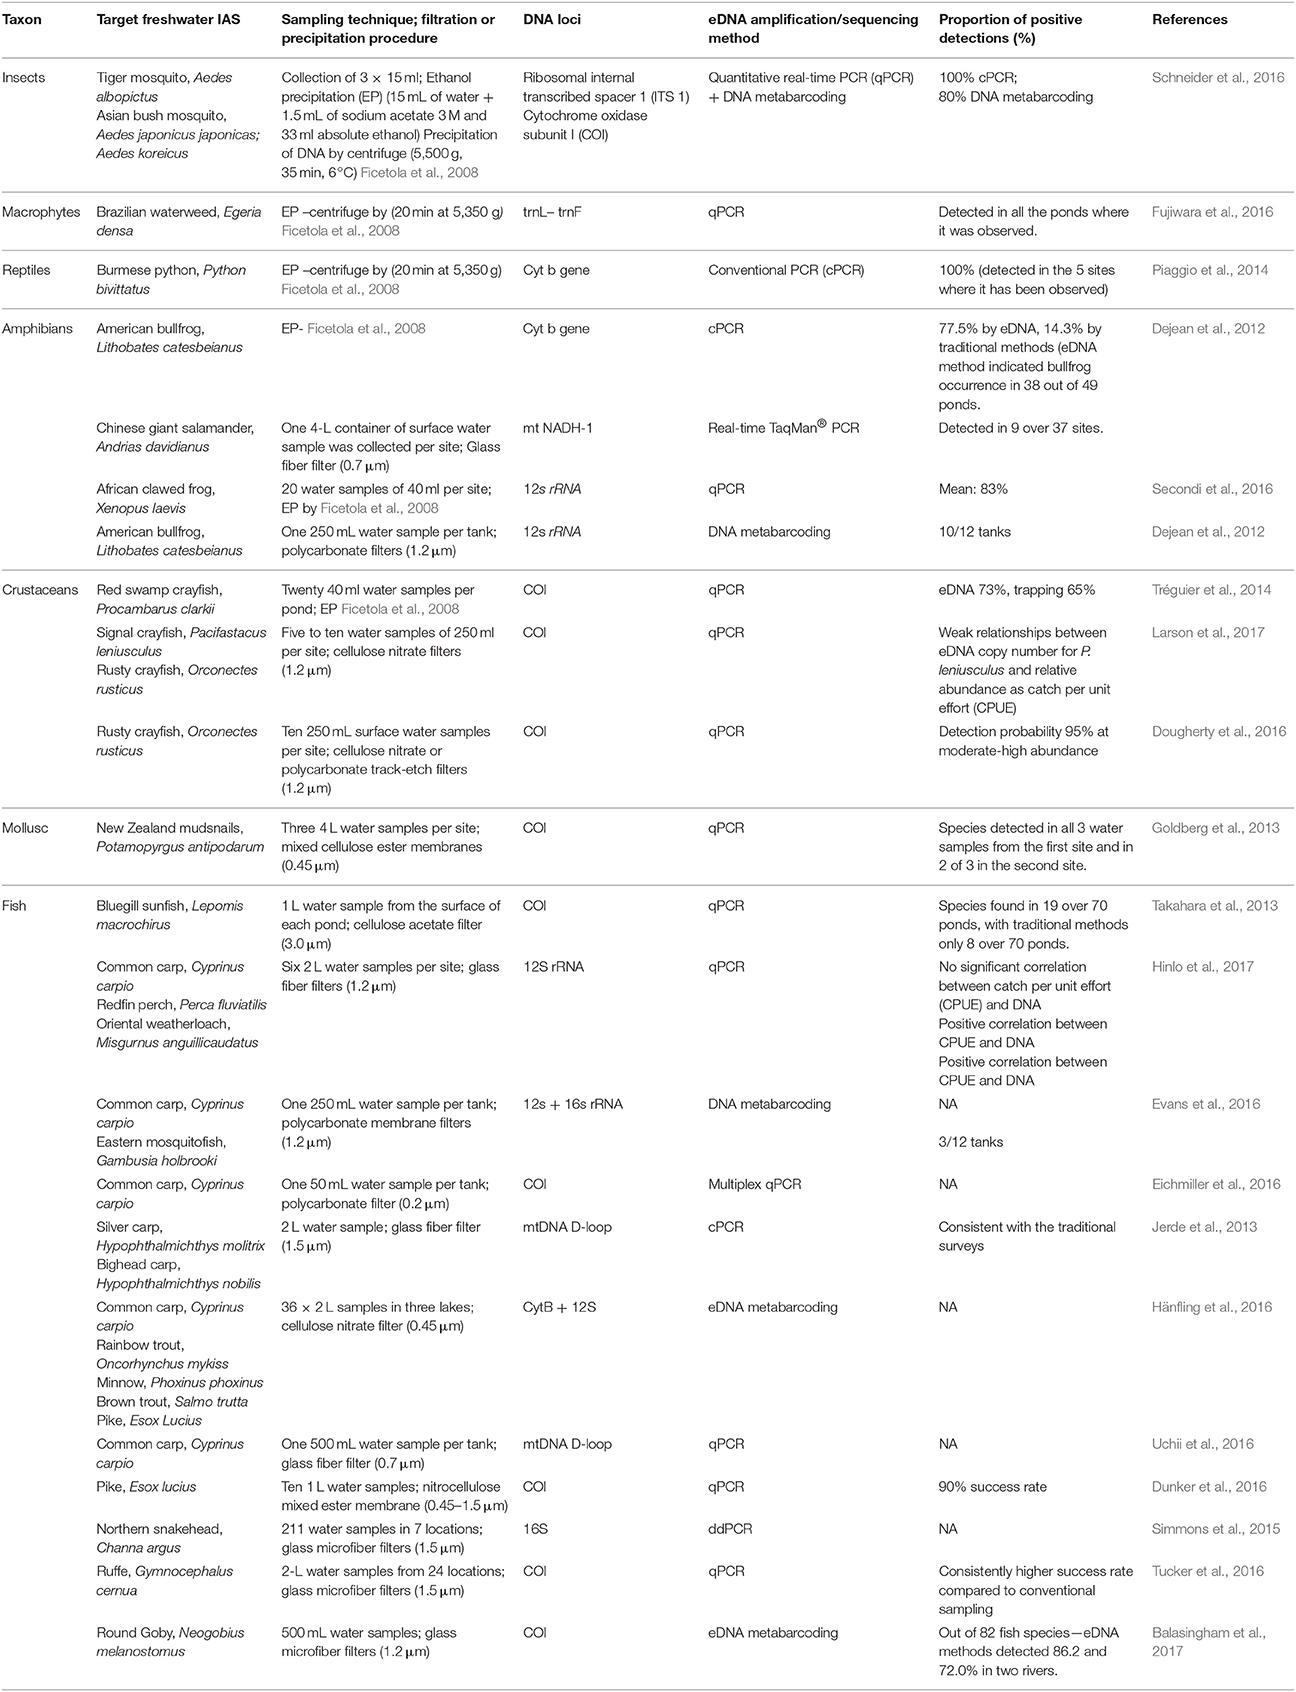
Table 1. eDNA studies targeting freshwater invasive alien species, including description of water sampling and filtration techniques, DNA loci, barcoding or metabarcoding as well as the proportion of positive detections.
Current Limitations
Freshwater ecosystems, lentic, and lotic, provide excellent study area for defining the wide range of detection possibilities of eDNA techniques as well as the limitations. Small-scale freshwater lentic bodies provide an excellent opportunity to study eDNA characteristics related to degradation, which can affect successful detectability of species. Recent studies have tried to underline degradation rates in correlation to abiotic factors, such as, (i) most effective water stratum for eDNA detection (Moyer et al., 2014), (ii) pH, UV-B (Strickler et al., 2015), (iii) effects of temperature on eDNA degradation (Strickler et al., 2015; Eichmiller et al., 2016), and (iv) temporal effects (Dejean et al., 2011). Freshwater lotic bodies can provide important information due to their longitudinal downstream dynamics, such as, (i) eDNA persistence in the environment (Jerde et al., 2016; Wilcox et al., 2016), (ii) residence time of eDNA (Jerde et al., 2016), and (iii) the ecology of eDNA (Barnes and Turner, 2016). In case of newly introduced IAS, measures of low abundances present another limitation (Jerde et al., 2011) which is highly important when discerning between presence and absence records. Some of the reported examples are applied to non-invasive species, but the reason why we focus on IAS is that time, i.e., rapid response, is key to management, so that an identified IAS can be eradicated/controlled before any negative ecosystem impact occurs. Since eDNA can assist in more rapid detection and early response to IAS invasions than traditional sampling, this technology most greatly benefits identification of invasive species.
All the limitations of eDNA that are currently being studied are crucial for IAS assessment. When monitoring, especially in a new environment, it is fundamental to detect it at extremely low abundances and report negative or positive presence. False positives and negatives are essentially relevant for their use within SDM and cannot be misjudged, whether they are products of sampling bias or metabarcoding bioinformatics pipeline. The distribution patterns and biology of the eDNA is another important factor influencing the accuracy of information which is relevant for the distribution of IAS within the models. The accuracy that we can obtain through eDNA highly depends on the strategies followed during the fieldwork and through laboratory protocols. In order to more accurately state the proportion of the positive (or negative) detections, independent observations (Steel et al., 2013) would need to become an essential part of eDNA studies to overcome the bias of false positives or negatives. An increased eDNA sampling effort based on a temporary scale would provide a more accurate proportion of positive (negative) detections and should be replaced by research proposed on a single sampling events (Simmons et al., 2015; Fujiwara et al., 2016; Hänfling et al., 2016). Independent observations would need to become a necessary procedure especially when dealing with estimations of newly introduced species (Jerde et al., 2011) or dealing with the estimations of successful eradication measures (Dunker et al., 2016).
To avoid bias due to inconsistent use of eDNA tools a minimum information based on field and laboratory procedures should always be reported and presented in a consistent manner as presented by (Goldberg et al., 2016). Pioneers in eDNA research (Ficetola et al., 2016) highly recommend following general requirements such as, precautionary approach to avoid contamination, respecting a general practice of obtaining control samples, extraction blanks, as well as incorporating PCR positive and negative controls. In cases of individual species assessment, parallel mesocom experiments are highly recommended in order to be able to estimate the limitations of detectability for each individual primer set. Another method to assess limitations of primer detections is assessing detectability of the species “in time” after its removal from the controlled environment. When working on multiple species assessment using a metabarcoding approach, it is recommended, to sequence the control samples, compare the sequencing control outputs with the actual samples, and if none of the last achieve high quality sequence reads by appropriate clean up steps; removal of singletons, chimeras, as well as including a record of removed sequences (Deiner et al., 2017a). Bias due to universal primer preferential amplifications of species can alter the relative abundance of individual species eDNA (Deiner et al., 2017a). A PCR-free method, namely sequence capturing offers promising solutions in order to avoid amplification bias (Shokralla et al., 2016).
In terms of IAS certainty of existence in a non-native environment, false- positive and false- negative are crucial points for management and environmental policies (Moyer et al., 2014; Lahoz-Monfort et al., 2016). Even low rate false- positives pose a bias toward species specific occupancy (Lahoz-Monfort et al., 2016). Errors produced during PCR and sequencing are main source of bias for false- positives whereas false- negatives normally appear due to bias during sampling. Sampling and PCR replicates are key to avoid obtaining false presence and absence and should be routinely corrected with the appropriate statistical tools referred to “site occupancy-detection modeling” (SODM) (Lahoz-Monfort et al., 2016). The SODM model shows precise estimation of the probability for the site occupancy, including overall probability of detection at sites where the species is present. The model provides unbiased estimation of occupancy when properly applied using large amount of initial data, even with a smaller amount of replications. Researchers (Ficetola et al., 2016) adopting SODM as part of their eDNA pipeline, give advice to avoid referring to single occurrences within one sample as reliable ones. Precautionary measures should be taken up before coming to conclusions that non-detection of species corresponds to species absence, and in converse that detections directly relies to species presence (Roussel et al., 2015) simply due to eDNA characteristics, such as potential longevity. In order to overcome the frontiers of eDNA techniques and to make it generally applicable within the SDM the above consistency is pivotal within the immense growing body of eDNA literature.
Combination of eDNA and SDMs
The method appears to be highly efficient on bony fish and amphibians with successful spatial representativeness in lotic and lentic systems (Civade et al., 2016). It has been shown that the eDNA samples are able to overcome spatial autocorrelation biases (Deiner et al., 2016) which are normally a result of conventional biodiversity assessments. eDNA seasonal diversity at the ecosystem scales (Bista et al., 2017) are key for more holistic understanding of the successful invasions of species within SDMs.
There are many possibilities of using eDNA for SDMs but currently one of the most important novel uses is a more precise sampling of absences which is sometimes difficult or impossible to obtain (Nezer et al., 2017). As commented, the information regarding species existence in certain system measured through eDNA can be susceptible to certain bias, due to eDNA characteristics. However, there exist approaches within the spatial modeling that might be applied to deal with the uncertainties from eDNA results. For instance, Dudík et al. (2006) presented the di-bias approach, which gives a higher weight in the models to those localities where presences or absences are more reliable. In the same way, those localities where eDNA is less reliable can receive a lower weight in the models, such weighting might correspond with the reported detection rates (Table 1). Therefore, there are possibilities from the SDMs to deal with the potential bias arising from using eDNA as a sampling technique which encourage its use despite current relative limitations. The ability to cope with the limitations and strength of the combination of these distinct research fields will benefit from the collaboration between molecular ecologists and modelers contributing to the evolution of two scientific disciplines (Coccia and Wang, 2016). Other disciplines apart from invasion ecology (e.g., biogeography or spatial ecology) might also benefit from future development of molecular ecology tools as a sampling technique. Thus, we highly recommend involving eDNA analysis into spatial models to predict future invasions and many other ecological processes. For example, targeting IAS hot spots and vectors of introduction, is a perfect starting point for detection of IAS and estimation of their future dispersal within the SDMs. Spatial representativeness of IAS within the SDMs is key to understanding the ecology behind their successful dispersal and the management of invasions.
Conclusion
Collaboration between modelers and molecular ecologists has a high potential to overcome the flaws of spatial distribution patterns due to difficulties or inconsistency in the information obtained through conventional surveys. The strength of the information that eDNA can provide is crucial as it fulfills the previously unidentified absences within the SDMs. The eDNA method is currently rapidly evolving and in the near future a mass of information related to IAS presence, absence as well as other species specific biological characteristic can be obtained and applied to, for example, mechanistic SDMs. Thus, its use is highly recommended with the aim of obtaining species distribution data for spatial models combining two scientific fields, useful as a helpful tool for IAS management and relevant policy requirements.
Author Contributions
TM and MR-R compiled the knowledge based on their individual research and proposed the idea of eDNA methods usefulness within SDMs. They had both contributed to the written part of MS. MR was responsible for the table design and its content as well as a contribution to the overall MS. ET proposed the idea of eDNA and IAS, and revised the first draft of the paper.
Conflict of Interest Statement
The authors declare that the research was conducted in the absence of any commercial or financial relationships that could be construed as a potential conflict of interest.
The handling Editor declared a past co-authorship with one of the authors ET.
Acknowledgments
TM, MR-R, and MR are all Early Stage Researchers as part of Aquainvad- ED. We would like to thank for the full support to our supervisor Prof. Dr. Sonia Consuegra del Olmo. We would like to thank Prof. Frances E. Lucy for her generous contribution toward the English grammar correction. This work is a product of the Aquainvad-ED project and had received funding from the European Union's Horizon 2020 research and innovation programme under the Marie Skłodowska-Curie grant agreement No 642197 (http://www.aquainvad-ed.com/).
References
Balasingham, K. D., Walter, R. P., Mandrak, N. E., and Heath, D. D. (2017). Environmental DNA detection of rare and invasive fish species in two great lakes tributaries. Mol. Ecol. 26, 14395. doi: 10.1111/mec.14395
Barnes, M. A., and Turner, C. R. (2016). The ecology of environmental DNA and implications for conservation genetics. Conserv. Genet. 17, 1–17. doi: 10.1007/s10592-015-0775-4
Bista, I., Carvalho, G. R., Walsh, K., Seymour, M., Hajibabaei, M., Lallias, D., et al. (2017). Annual time-series analysis of aqueous eDNA reveals ecologically relevant dynamics of lake ecosystem biodiversity. Nat. Commun. 8:14087. doi: 10.1038/ncomms14087
Civade, R., Dejean, T., Valentini, A., Roset, N., Raymond, J.-C., Bonin, A., et al. (2016). Spatial representativeness of environmental DNA metabarcoding signal for fish biodiversity assessment in a natural freshwater system. PLoS ONE 11:e0157366. doi: 10.1371/journal.pone.0157366
Coccia, M., and Wang, L. (2016). Evolution and convergence of the patterns of international scientific collaboration. Proc. Natl. Acad. Sci. U.S.A. 113, 2057–2061. doi: 10.1073/pnas.1510820113
Deiner, K., Bik, H. M., Mächler, E., Seymour, M., Lacoursière-Roussel, A., Altermatt, F., et al. (2017a). Environmental DNA metabarcoding: transforming how we survey animal and plant communities. Mol. Ecol. 26, 5872–5895. doi: 10.1111/mec.14350
Deiner, K., Fronhofer, E. A., Mächler, E., Walser, J.-C., and Altermatt, F. (2016). Environmental DNA reveals that rivers are conveyer belts of biodiversity information. Nat. Commun. 7:12544. doi: 10.1038/ncomms12544
Deiner, K., Renshaw, M. A., Li, Y., Olds, B. P., Lodge, D. M., and Pfrender, M. E. (2017b). Long-range PCR allows sequencing of mitochondrial genomes from environmental DNA. Methods Ecol. Evol. doi: 10.1111/2041-210X.12836. [Epub ahead of print].
Dejean, T., Valentini, A., Duparc, A., Pellier-Cuit, S., Pompanon, F., Taberlet, P., et al. (2011). Persistence of environmental DNA in freshwater ecosystems. PLoS ONE 6:e23398. doi: 10.1371/journal.pone.0023398
Dejean, T., Valentini, A., Miquel, C., Taberlet, P., Bellemain, E., and Miaud, C. (2012). Improved detection of an alien invasive species through environmental DNA barcoding: the example of the American bullfrog Lithobates catesbeianus. J. Appl. Ecol. 49, 953–959. doi: 10.1111/j.1365-2664.2012.02171.x
Dougherty, M. M., Larson, E. R., Renshaw, M. A., Gantz, C. A., Egan, S. P., Erickson, D. M., et al. (2016). Environmental DNA (eDNA) detects the invasive rusty crayfish Orconectes rusticus at low abundances. J. Appl. Ecol. 53, 722–732. doi: 10.1111/1365-2664.12621
Dudík, M., Phillips, S. J., and Schapire, R. E. (2006). “Correcting sample selection bias in maximum entropy density estimation,” in Advances Neural Information Process Systems (Vancouver), 323–330.
Dunker, K. J., Sepulveda, A. J., Massengill, R. L., Olsen, J. B., Russ, O. L., Wenburg, J. K., et al. (2016). Potential of environmental DNA to evaluate Northern pike (Esox lucius) eradication efforts: an experimental test and case study. PLoS ONE 11:e0162277. doi: 10.1371/journal.pone.0162277
Eichmiller, J. J., Best, S. E., and Sorensen, P. W. (2016). Effects of temperature and trophic state on degradation of environmental DNA in lake water. Environ. Sci. Technol. 50, 1859–1867. doi: 10.1021/acs.est.5b05672
Evans, N. T., Olds, B. P., Renshaw, M. A., Turner, C. R., Li, Y., Jerde, C. L., et al. (2016). Quantification of mesocosm fish and amphibian species diversity via environmental DNA metabarcoding. Mol. Ecol. Resour. 16, 29–41. doi: 10.1111/1755-0998.12433
Ficetola, G. F., Miaud, C., Pompanon, F., and Taberlet, P. (2008). Species detection using environmental DNA from water samples. Biol. Lett. 4, 423–425. doi: 10.1098/rsbl.2008.0118
Ficetola, G. F., Taberlet, P., and Coissac, E. (2016). How to limit false positives in environmental DNA and metabarcoding? Mol. Ecol. Resour. 16, 604–607. doi: 10.1111/1755-0998.12508
Fujiwara, A., Matsuhashi, S., Doi, H., Yamamoto, S., and Minamoto, T. (2016). Use of environmental DNA to survey the distribution of an invasive submerged plant in ponds. Freshw. Sci. 35, 748–754. doi: 10.1086/685882
Goldberg, C. S., Sepulveda, A., Ray, A., Baumgardt, J., and Waits, L. P. (2013). Environmental DNA as a new method for early detection of New Zealand mudsnails (Potamopyrgus antipodarum). Freshw. Sci. 32, 792–800. doi: 10.1899/13-046.1
Goldberg, C. S., Turner, C. R., Deiner, K., Klymus, K. E., Thomsen, P. F., Murphy, M. A., et al. (2016). Critical considerations for the application of environmental DNA methods to detect aquatic species. Methods Ecol. Evol. 7, 1299–1307. doi: 10.1111/2041-210X.12595
Goricki, Š., Stanković, D., Snoj, A., Kuntner, M., Jeffery, W. R., Trontelj, P., et al. (2017). Environmental DNA in subterranean biology: range extension and taxonomic implications for Proteus. Sci. Rep. 7:45054. doi: 10.1038/srep45054
Groom, Q. J., Adriaens, T., Desmet, P., Simpson, A., De Wever, A., Bazos, I., et al. (2017). Seven recommendations to make your invasive alien species data more useful. Front. Appl. Mathemat. Stat. 3:13. doi: 10.3389/fams.2017.00013
Hänfling, B., Lawson Handley, L., Read, D. S., Hahn, C., Li, J., Nichols, P., et al. (2016). Environmental DNA metabarcoding of lake fish communities reflects long-term data from established survey methods. Mol. Ecol. 25, 3101–3119. doi: 10.1111/mec.13660
Hinlo, R., Furlan, E., Suitor, L., and Gleeson, D. (2017). Environmental DNA monitoring and management of invasive fish: comparison of eDNA and fyke netting. Management 8, 89–100. doi: 10.3391/mbi.2017.8.1.09
Jerde, C. L., Chadderton, W. L., Mahon, A. R., Renshaw, M. A., Corush, J., Budny, M. L., et al. (2013). Detection of Asian carp DNA as part of a great lakes basin-wide surveillance program. Can. J. Fish. Aquat. Sci. 70, 522–526. doi: 10.1139/cjfas-2012-0478
Jerde, C. L., Mahon, A. R., Chadderton, W. L., and Lodge, D. M. (2011). “Sight-unseen” detection of rare aquatic species using environmental DNA. Conserv. Lett. 4, 150–157. doi: 10.1111/j.1755-263X.2010.00158.x
Jerde, C. L., Olds, B. P., Shogren, A. J., Andruszkiewicz, E. A., Mahon, A. R., Bolster, D., et al. (2016). Influence of stream bottom substrate on retention and transport of vertebrate environmental DNA. Environ. Sci. Technol. 50, 8770–8779. doi: 10.1021/acs.est.6b01761
Jiménez-Valverde, A., Peterson, A. T., Soberón, J., Overton, J. M., Aragón, P., and Lobo, J. M. (2011). Use of niche models in invasive species risk assessments. Biol. Invasions 13, 2785–2797. doi: 10.1007/s10530-011-9963-4
Lahoz-Monfort, J. J., Guillera-Arroita, G., and Tingley, R. (2016). Statistical approaches to account for false-positive errors in environmental DNA samples. Mol. Ecol. Resour. 16, 673–685. doi: 10.1111/1755-0998.12486
Larson, E. R., Renshaw, M. A., Gantz, C. A., Umek, J., Chandra, S., Lodge, D. M., et al. (2017). Environmental DNA (eDNA) detects the invasive crayfishes Orconectes rusticus and Pacifastacus leniusculus in large lakes of North America. Hydrobiologia 800, 173–185. doi: 10.1007/s10750-017-3210-7
Moyer, G. R., Díaz-Ferguson, E., Hill, J. E., and Shea, C. (2014). Assessing environmental DNA detection in controlled lentic systems. PLoS ONE 9:e103767. doi: 10.1371/journal.pone.0103767
Nathan, L. M., Simmons, M., Wegleitner, B. J., Jerde, C. L., and Mahon, A. R. (2014). Quantifying environmental DNA signals for aquatic invasive species across multiple detection platforms. Environ. Sci. Technol. 48, 12800–12806. doi: 10.1021/es5034052
Nezer, O., Bar-David, S., Gueta, T., and Carmel, Y. (2017). High-resolution species-distribution model based on systematic sampling and indirect observations. Biodivers. Conserv. 26, 421–437. doi: 10.1007/s10531-016-1251-2
Nichols, R. V., and Spong, G. (2017). An eDNA based SNP assay for ungulate species and sex identification. Diversity 9:33. doi: 10.3390/d9030033
Piaggio, A. J., Engeman, R. M., Hopken, M. W., Humphrey, J. S., Keacher, K. L., Bruce, W. E., et al. (2014). Detecting an elusive invasive species: a diagnostic PCR to detect Burmese python in Florida waters and an assessment of persistence of environmental DNA. Mol. Ecol. Resour. 14, 374–380. doi: 10.1111/1755-0998.12180
Roussel, J. M., Paillisson, J. M., Treguier, A., and Petit, E. (2015). The downside of eDNA as a survey tool in water bodies. J. Appl. Ecol. 52, 823–826. doi: 10.1111/1365-2664.12428
Schneider, J., Valentini, A., Dejean, T., Montarsi, F., Taberlet, P., Glaizot, O., et al. (2016). Detection of invasive mosquito vectors using environmental DNA (eDNA) from water samples. PLoS ONE 11:e0162493. doi: 10.1371/journal.pone.0162493
Secondi, J., Dejean, T., Valentini, A., Audebaud, B., and Miaud, C. (2016). Detection of a global aquatic invasive amphibian, Xenopus laevis, using environmental DNA. Amphib. Reptil. 37, 131–136. doi: 10.1163/15685381-00003036
Shokralla, S., Gibson, J., King, I., Baird, D., Janzen, D., Hallwachs, W., et al. (2016). Environmental DNA barcode sequence capture: targeted, PCR-free sequence capture for biodiversity analysis from bulk environmental samples. BioRxiv doi: 10.1101/087437
Sigsgaard, E. E., Nielsen, I. B., Bach, S. S., Lorenzen, E. D., Robinson, D. P., Knudsen, S. W., et al. (2016). Population characteristics of a large whale shark aggregation inferred from seawater environmental DNA. Nat. Ecol. Evol. 1:0004. doi: 10.1038/s41559-016-0004
Simmons, M., Tucker, A., Chadderton, W. L., Jerde, C. L., and Mahon, A. R. (2015). Active and passive environmental DNA surveillance of aquatic invasive species. Can. J. Fish. Aquat. Sci. 73, 76–83. doi: 10.1139/cjfas-2015-0262
Steel, E. A., Kennedy, M. C., Cunningham, P. G., and Stanovick, J. S. (2013). Applied statistics in ecology: common pitfalls and simple solutions. Ecosphere 4, 1–13. doi: 10.1890/ES13-00160.1
Strickler, K. M., Fremier, A. K., and Goldberg, C. S. (2015). Quantifying effects of UV-B, temperature, and pH on eDNA degradation in aquatic microcosms. Biol. Conserv. 183, 85–92. doi: 10.1016/j.biocon.2014.11.038
Taberlet, P., Coissac, E., Hajibabaei, M., and Rieseberg, L. H. (2012). Environmental DNA. Mol. Ecol. 21, 1789–1793. doi: 10.1111/j.1365-294X.2012.05542.x
Takahara, T., Minamoto, T., and Doi, H. (2013). Using environmental DNA to estimate the distribution of an invasive fish species in ponds. PLoS ONE 8:e56584. doi: 10.1371/journal.pone.0056584
Thomsen, P. F., and Willerslev, E. (2015). Environmental DNA–an emerging tool in conservation for monitoring past and present biodiversity. Biol. Conserv. 183, 4–18. doi: 10.1016/j.biocon.2014.11.019
Tréguier, A., Paillisson, J. M., Dejean, T., Valentini, A., Schlaepfer, M. A., and Roussel, J. M. (2014). Environmental DNA surveillance for invertebrate species: advantages and technical limitations to detect invasive crayfish Procambarus clarkii in freshwater ponds. J. Appl. Ecol. 51, 871–879. doi: 10.1111/1365-2664.12262
Tucker, A. J., Chadderton, W. L., Jerde, C. L., Renshaw, M. A., Uy, K., Gantz, C., et al. (2016). A sensitive environmental DNA (eDNA) assay leads to new insights on ruffe (Gymnocephalus cernua) spread in North America. Biol. Invasions 18, 3205–3222. doi: 10.1007/s10530-016-1209-z
Uchii, K., Doi, H., and Minamoto, T. (2016). A novel environmental DNA approach to quantify the cryptic invasion of non-native genotypes. Mol. Ecol. Resour. 16, 415–422. doi: 10.1111/1755-0998.12460
Václavík, T., and Meentemeyer, R. K. (2009). Invasive species distribution modeling (iSDM): are absence data and dispersal constraints needed to predict actual distributions? Ecol. Modell. 220, 3248–3258. doi: 10.1016/j.ecolmodel.2009.08.013
Keywords: aquatic freshwater invasive species, barcoding, metabarcoding, environmental DNA, environmental sampling, independent evaluation
Citation: Muha TP, Rodríguez-Rey M, Rolla M and Tricarico E (2017) Using Environmental DNA to Improve Species Distribution Models for Freshwater Invaders. Front. Ecol. Evol. 5:158. doi: 10.3389/fevo.2017.00158
Received: 29 September 2017; Accepted: 24 November 2017;
Published: 07 December 2017.
Edited by:
Stelios Katsanevakis, University of the Aegean, GreeceReviewed by:
Emre Keskin, Ankara University, TurkeyMikkel Winther Pedersen, University of Cambridge, United Kingdom
Copyright © 2017 Muha, Rodríguez-Rey, Rolla and Tricarico. This is an open-access article distributed under the terms of the Creative Commons Attribution License (CC BY). The use, distribution or reproduction in other forums is permitted, provided the original author(s) or licensor are credited and that the original publication in this journal is cited, in accordance with accepted academic practice. No use, distribution or reproduction is permitted which does not comply with these terms.
*Correspondence: Teja P. Muha, dC5wLm11aGFAc3dhbnNlYS5hYy51aw==
Marta Rodríguez-Rey, bS5yb2RyaWd1ZXotcmV5Z29tZXpAc3dhbnNlYS5hYy51aw==