 Michael N. Githaiga
 Anna M. Frouws
 James G. Kairo4
 Mark Huxham
- 1Department of Biological Sciences, University of Embu, Embu, Kenya
- 2School of Applied Sciences, Edinburgh Napier University, Edinburgh, United Kingdom
- 3Centre for Marine Ecosystem Research, Edith Cowan University, Perth, WA, Australia
- 4Kenya Marine and Fisheries Research Institute, Mombasa, Kenya
Seagrass habitats are important natural carbon sinks, with an average of ~14 kg C m−2 buried in their sediments. The fate of this carbon following seagrass removal or damage has major environmental implications but is poorly understood. Using a removal experiment lasting 18 months at Gazi Bay, Kenya, we investigated the impacts of seagrass loss on sediment topography, hydrodynamics, faunal community structure and carbon dynamics. Sediment pins were used to monitor surface elevation. The effects of seagrass removal on water velocity was investigated using Plaster of Paris dissolution. Sediment carbon concentration was measured at the surface and down to 50 cm. Rates of litter decay at three depths in harvested and control treatments were measured using litter bags. Drop samples, cores, and visual counts of faunal mounds and burrows were used to monitor the impact of seagrass removal on the epifaunal and infaunal communities. Whilst control plots showed sediment elevation, harvested plots were eroded (7.6 ± 0.4 and −15.8 ± 0.5 mm yr−1 respectively, mean ± 95% CI). Carbon concentration in the surface sediments was significantly reduced with a mean carbon loss of 2.21 Mg C ha−1 in the top 5 cm. Because sediment was lost from harvested plots, with a mean difference in elevation of 3 cm, an additional carbon loss of up to 2.54 Mg C ha−1 may have occurred over the 18 months. Seagrass removal had rapid and dramatic impacts on infauna and epifauna. There was a loss of diversity in harvested plots and a shift toward larger bodied, bioturbating species, with a significant increase in mounds and burrows. Buried seagrass litter decomposed significantly faster in the harvested compared with the control plots. Loss of seagrass therefore led to rapid changes in sediment dynamics and chemistry driven in part by significant alterations in the faunal community.
Introduction
Seagrass beds are critical marine habitats with a wide global distribution. Their dense canopies and organically enriched sediment are habitat and refuge for a large community of resident and transient fauna including commercially important fish species, crustaceans and molluscs (Howard et al., 2014). Seagrass meadows can influence hydrodynamics by reducing current velocity, dissipating wave energy and stabilizing the sediment, leading to local sediment accretion (Potouroglou et al., 2017) and contributing to the protection of whole shorelines as well as facilitating the health of other ecosystems (Guannel et al., 2016). In common with the other “blue carbon” habitats (mangroves and tidal marshes), seagrasses are increasingly recognized as making an important contribution to climate change mitigation because of their ability to sequester carbon in the sediment (Duarte et al., 2005; Mcleod et al., 2011; Githaiga et al., 2017b; Huxham et al., 2018).
Seagrasses are estimated to have the greatest spatial extent of the three blue carbon ecosystems (ranging between 164,000 and 500,000 km2, with a best approximation of 177,000 km−2; Green and Short, 2003). However, they also probably suffer the fastest rates of destruction; indeed one estimate of 7% area lost yr−1 may be the worst trend for any global habitat (Waycott et al., 2009). Whilst natural events, including outbreaks of disease and eruptions of grazing urchins, can result in significant local seagrass decline (Short and Wyllie-Echeverria, 1996; Herkül and Kotta, 2009), the major drivers of seagrass loss are anthropogenic: eutrophication, land erosion (leading to enhanced sedimentation), mechanical damage due to dredging, seining, boat mooring, and anchoring (Short and Wyllie-Echeverria, 1996; Orth et al., 2006). The loss of seagrass implies the removal or diminution of the ecosystem services they provide, but much uncertainty remains over how quickly this might happen. In particular, the impacts of seagrass loss on carbon sequestration remains poorly understood. In their study of the global impacts and costs of carbon (C) emissions from the degradation of blue carbon habitats, Pendleton et al. (2012) assumed that between 25 and 100% of C in the top meter of sediment or soil is oxidized following habitat destruction. This large range, and the concomitant uncertainty in climate change impacts, underlines the need for further research on the temporal dynamics of sediment C following habitat loss.
One approach to the understanding of sediment and C dynamics following habitat destruction is to compare intact and damaged sites. Macreadie et al. (2015) provide an example from Australia, where seismic testing in the 1960s damaged a series of Posidonia australis beds, leading to a loss of 72% of sediment C. Such “natural experiments” have the advantages of temporal and spatial scale, but do not allow the controlled understanding of causal drivers that a manipulative experiment permits. There are few experimental studies that explore the impacts of seagrass loss on C; the two most relevant (Macreadie et al., 2014; Dahl et al., 2016) found no C losses following small scale disturbances, which is in contrast to the findings of the natural experiment in Macreadie et al. (2015). This suggests that disturbance may need to be large scale (in time and/or space) before an effect is found, or that there are site-specific factors not yet understood. The present study complements this recent work, using artificial removal of seagrass canopy cover in harvested plots and comparisons with intact controls to explore the impacts of seagrass canopy removal on surface elevation, sediment dynamics and C storage, with a novel focus on the role of fauna in mediating any changes. We test the null hypotheses that removal of intertidal seagrass has no effects on sediment C concentration, surface elevation, hydrodynamics and faunal community composition.
Materials and Methods
Study Site
This study was carried out at Gazi Bay (4° 25 ′S, and 39°30′E), in Kwale County, Kenya, in an intertidal area between the western and the eastern creeks (Figure 1). There are 12 seagrass species recognized in the bay, 6 of which are dominant: Cymodocea rotundata Ascherson, Cymodocea serrulata (R. Braun) Aschers. & Magnus, Enhalus acoroides (L.f.) Royle, Syringodium isoetifolium (Aschers.) Dandy, Thalassodendron ciliatum (Forssk.) den Hartog, and Thalassia hemprichii (Enhrenberg) Aschers. These occur either as monospecific stands or mixed with other seagrass species with their coverage extending from low intertidal to 7 or 8 m depth below chart datum (Harcourt et al., 2018). The other six species are: Halodule uninervis (Forssk.) Aschers., Halodule wrightii (Aschers.), Halophila minor (Zoll.) den Hartog, Halophila ovalis (Braun) Hooker, Halophila stipulacea (Forssk.) Aschers, and Zostera capensis (Setch). Macroalgae are also abundant in the seagrass meadows; these include: Caulerpa spp., Cystoseira trinoids, Dictyota spp., Gracilaria cortica, Gracilaria saloicornia, Halimeda spp., Hyponea cornata, Sargassum spp., Turinaria decudrens, Ulva partusa, and Ulva reticulate (Coppejans et al., 1992). The intertidal and shallow subtidal areas are further characterized by obvious mounds, typically 10–20 cm high above the sediment, produced by a large population of Callianassa spp. burrowing shrimp. The current study was confined to areas of monospecific stands of Thalassia hemprichii and Enhalus acoroides since these seagrass species are most abundant in the accessible intertidal regions. These stands have mean (± 95% CI) shoot densities of 996 ± 94 and 248 ± 28 m−2 for T. hemprichii and E. acoroides, respectively (Githaiga et al., 2017b).
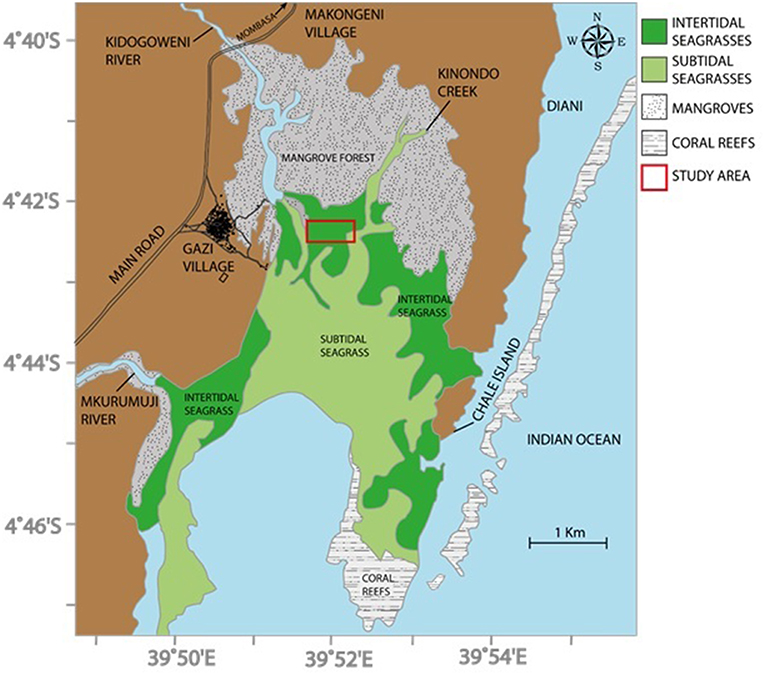
Figure 1. Seagrass experimental area, Gazi Bay, Kenya (after Troch et al., 2001; Bouillon et al., 2007).
Eight 3 × 2 m plots were delineated using 2.5 cm diameter, 60 cm long PVC pipes pushed 50 cm into the sediment at each corner. Plots were placed in monospecific stands of E. acoroides and T. hemprichii (four each), at a minimum distance of 30 m apart, and four were each randomly assigned to removal and control treatments. The harvested treatment involved clipping, and removing, all the seagrass within the plots down to the sediment surface level (Figure 2). A timber platform, resting on supports outside the plots, was used every time during clipping, and when collecting samples and data, to avoid disturbing the sediment and belowground seagrass biomass. Any regrowth of shoots was clipped every 30 days within the 18-month duration of the experiment.
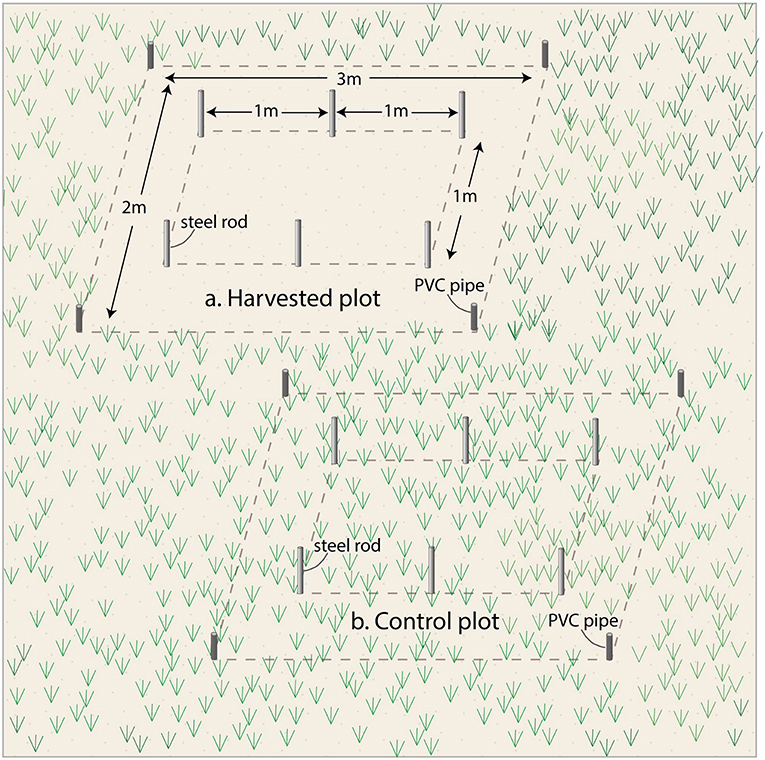
Figure 2. Layout of the (A) Seagrass harvested and (B) control plots.
Sediment Corg Density
Measurements of carbon density in the harvested and control treatments were made 18 months after the experimental initiation. Five shallow (5 cm depth by 2.7 cm diameter, using plastic pipe) and two deep (50 cm depth by 5 cm diameter, using a Russian peat corer) cores were taken per plot, for surface and deeper sediment analysis. Deep cores were sliced into 5 cm sub-sections and all samples were oven dried for 72 h at 60°C to obtain a constant weight. Dry Bulk density (DBD) (the dry weight of sediment per unit volume) was calculated for each sample as follows: DBD (g/cm3) = Dry weight/Original volume of the sediment. Organic matter was measured in each sample by Loss On Ignition (LOI), using a muffle furnace at 450°C for 6 h. The weight loss was used to calculate the % LOI and hence the organic matter (OM) and the organic carbon density; % LOI = [(Initial dry weight–Weight remaining after ignition)/Initial dry weight] × 100). Corg values were derived using the relations: % LOI < 0.2: % Corg = 0.40*% LOI-0.21; % LOI > 0.2: % Corg = 0.43*% LOI-0.33 taken from the Blue Carbon Manual (IPCC, 2013; Howard et al., 2014). The data from the five surface cores and the equivalent depth for the deep cores were combined, given n = 7 per plot for surface samples and n = 2 per plot for deeper samples.
Litter Decomposition
Prior to the start of the experiment, seagrass leaves of E. acoroides and T. hemprichii were harvested from areas adjacent to the experimental plots, washed and dried in the oven for 48 h at 80°C to a constant weight. Three grams of dried litter from each species was placed in 5 cm by 3 cm nylon bags of 1 mm2 mesh size and sealed. In each plot, at the start of the experiment, four litter depths 5 cm, 10 cm, and 15 cm giving a total of 12 bags in each plot. One bag from each depth profile was retrieved every 15 days at spring tides and taken to the laboratory where they were washed over a 1 mm sieve to remove sediments. The resulting litter after washing was oven dried at 80°C for 48 h to obtain the dry weight. The decay rates along the depth profiles were then calculated and compared. Dried seagrass leaves do not reflect the chemical complexity of sedimentary organic C, with its mix of sources, ages and susceptibility to mineralisation. Hence the litter bags were used to provide a simple measure of possible changes between treatments in biogeochemical processes that manifest in decay rates (such as oxygen availability) rather than simulations of ambient, unaltered sedimentary processes.
Surface Elevation Pins
Surface Elevation Pin arrays (SEPs) were established within each plot. Six 1 m long, 5 mm diameter stainless steel rods were hammered to the bedrock at a spacing of 1 × 2m. A spirit level was used to ensure that the rods were inserted vertically, and a hack saw was used to cut the tops of the rods leaving a projection of 20 cm above the sediment surface. Measurements of surface elevation change were taken monthly during low spring tides. The height of the projection of each steel rod above the sediment surface was recorded after lowering a thin, plastic horizontal disc (<1 mm thick and diameter 40 mm) with a central hole over the top and down to the sediment surface to avoid taking measurements affected by local scouring immediately adjacent to the pin.
Speed of Water Movement
The effect of seagrass removal on the speed of water movement was measured indirectly by use of plaster of Paris “clod cards” (gypsum blocks) following Jokiell and Janice (1993). Measurements were taken 5 times in different spring tides in the months of February, March, August and December of 2015 and June of 2016. The clods were prepared by mixing 100 ml of fresh water with 80 g plaster of Paris powder manufactured by Hobby Craft Trading limited, Dorset UK, poured in ice cube trays (4 × 2 × 1.5 cm per cube) and dried to form the clod cubes. They were then sanded at the bottom to attain a uniform weight of 12.5 ± 1.5 g within a batch. Each of the plaster cubes was glued to a plastic plate measuring 3 × 8 cm with silicone cement (No Nonsense Ltd.BA 228RT) and the combined weights recorded. Four plaster clod cards facing the four cardinal directions were fixed to straight poles at heights of 0, 15, and at 80 cm from the sediment surface and one pole placed at the center of each of the 8 plots (Figures 3,4). They remained in the field for 24 h after which they were removed and taken to the laboratory for oven drying at 40°C for 48 hours and dry weight was recorded.
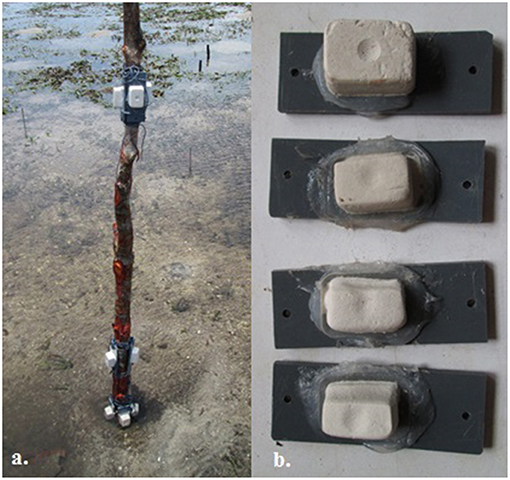
Figure 3. Plaster of Paris clods for the current speed monitoring. (a) Clod cards mounted to a stick in field (b) Clod card drying after removal from the field, showing clear differences in dissolution.
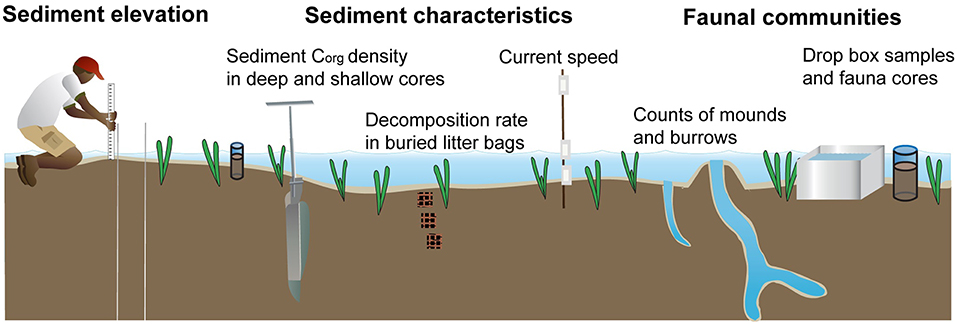
Figure 4. Combined layout of the experimental set up (Images adjusted from: ian.umces.edu/symbols).
Infaunal and Epifaunal Communities
Two cores (10.5 cm diameter by 10 cm depth) were randomly collected per plot at 1 month after the start of the experiment, and three cores per plot at 13 months after the start of the experiment. Cores were gently washed over a 500 μm mesh sieve to collect infauna and seagrass biomass. To study epifauna communities, two drop box samples were randomly taken per plot at 13 months after the start of the experiment (Figure 4). A bottomless square metal box (50 × 50 × 50 cm) was rapidly pushed into the sediment at low tide (<50 cm depth). Fauna present within the box was collected with a 500 μm mesh sieve. Sieving stopped when two consecutive sieves were retrieved without fauna present. Fauna from cores and drop box samples was fixed in 10% formalin between 2 and 7 days before being washed and stored in 70% ethanol (Bowden et al., 2001; Berkenbusch et al., 2007). Organisms were identified to family level when feasible using a Leica Stereo Zoom S6E microscope with 40× magnification. Identification was performed using a variety of guides and webpages and occasional expert advice (Day, 1967; Smith and Heemstra, 1999; Hayward and Ryland, 2000; Ngoc-Ho, 2003; Campbell, 2007; Sida and WIOMSA, 2011; Odido et al., 2015; WoRMS Editorial Board, 2015). Fauna were also assigned to functional groups (FG). The numbers of visible burrows and mounds in the sediment in all the plots were counted in each of nine successive months, starting 156 days after the start of the experiment, as an indicator of bioturbating activity. Counts only included burrows with a diameter > 0.5 cm and the seagrass in the control plots carefully pushed aside if necessary, to facilitate accurate counting of burrows.
Data Analyses
When appropriate the assumptions of normality and homogeneity of variances were checked by inspecting residuals, and where necessary the data were log10 or square root transformed to improve statistical fit. Repeated measures ANOVA, with treatment and time factors, was used to compare surface elevation between the harvested and control treatments. Carbon density between treatments was compared using separate nested ANOVAs for surface (top 5 cm) and whole core profiles. Rates of litter decay at each depth and within each plot were calculated by fitting exponential curves to derive decay constants (k) for each plot × depth combination. These were used as replicates in a two-way ANOVA with depth and treatment as factors. The effects of the factors treatment (harvested vs. control), height and time on the percentage weight loss of gypsum clods over a 24 h period, repeated 5 times, were examined using repeated measures ANOVA. Abundance and taxon counts of fauna were compared between removal and control treatments at 1 and 13 months. Differences in key functional groups between treatments were explored by examining the percentage contributions of each group to total abundance in treatments, and visible evidence of bioturbation (burrows and mounds) was compared between treatments using repeated measures ANOVA. Statistical analyses were performed using Minitab 17 and SPSS 23 software.
Results
Corg Density
The Corg density differed significantly between treatments in the surface sediment (top 5 cm) after 18 months [nested ANOVA, F(1, 6) = 9.98, p = 0.02]. The mean (± 95% CI) C densities in the top 5 cm of sediment were 0.0085 (± 0.0027) and 0.004 (± 0.0005) gC/cm3, translating to a mean difference between treatments of 2.21 Mg C ha−1 in the top 5 cm. However, this difference was limited to the surface, with no significant differences found over the whole depth profiles.
Litter Decay at Three Depths
The seagrass litter showed exponential decay throughout the 2-month period of monitoring across all the depths in all cases (Figure 5). Significantly faster litter decay rates were recorded in harvested compared to control plots [F(1, 2) = 22.50, p = 0.042] while depth did not have significant effects on litter decay rates (Supplementary Material).
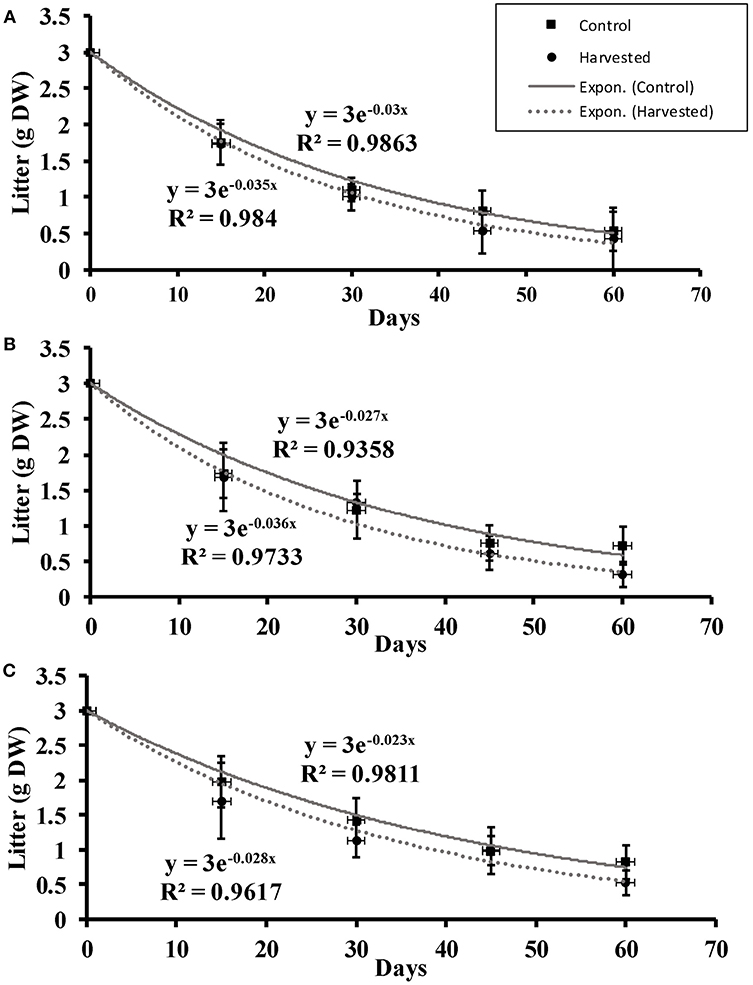
Figure 5. Litter decomposition (mean ± 95% CI) over a two-month period at (A) 5 cm, (B) 10 cm, and (C) 15 cm depths in the harvested and control plots.
Surface Elevation
Harvested plots showed a trend of sediment loss over the course of the experiment, compared with periods of stability and accretion in controls (Figure 6). Clear differences between treatments appeared 8 months from the start of the experiment (Figure 7), perhaps implying a loss of belowground, as well as aboveground, biomass was important; roots and rhizomes persisted for many months before beginning to die off. The mean (± 95% CI) sediment elevation over the eighteen-month period in the control treatment was 7.6 ± 0.4 mm yr−1 compared with −15.8 ± 0.5 mm yr−1 in harvested plots. There was a significant interaction effect between treatment and time in the repeated measure ANOVA on sediment elevation change [F(17, 102) = 3.59, p < 0.01; Figure 6]; the non-overlapping confidence intervals show significant differences at multiple individual time points (Supplementary Material).
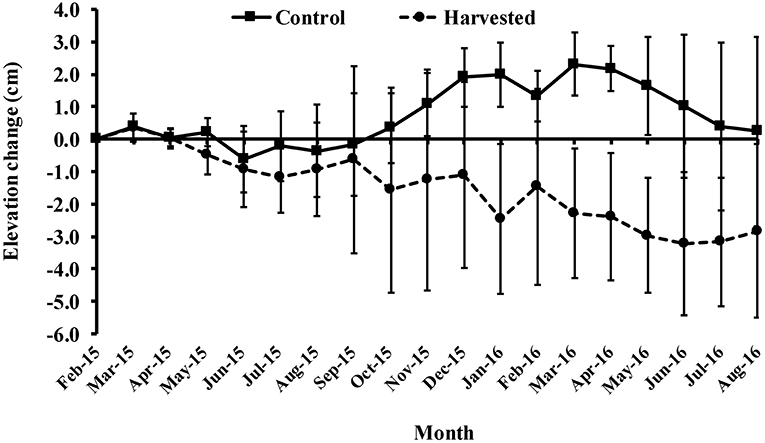
Figure 6. Mean surface elevation change (±95% CI) in the seagrass beds of Gazi Bay relative to the initial height of each pin in February 2015.
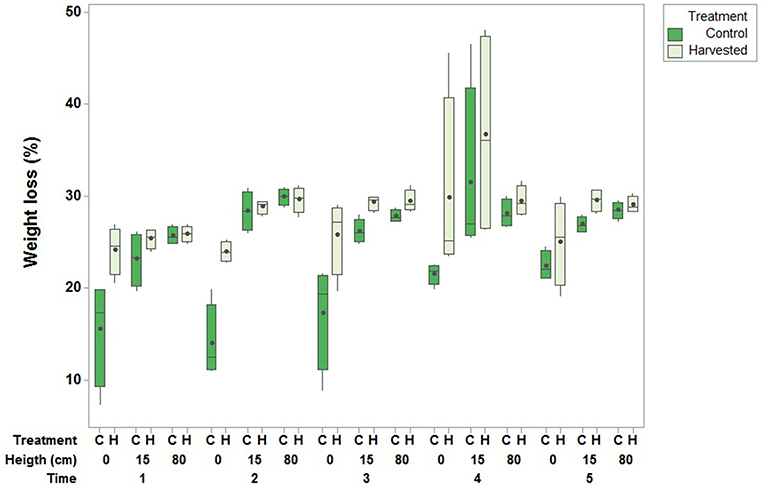
Figure 7. Effect of seagrass removal treatment on % loss of gypsum clod cards (central lines are medians, boxes interquartile ranges and the dots are means) over a 24-h exposure period. Boxplots are based on one measurement per plot (N = 4 per treatment) with three heights (0, 15, and 80 cm from the sediment) and five measurement times [February (1), March (2), August (3) and December (4) 2015 and June 2016 (5)].
Speed of Water Movement
The percentage weight loss of clod cards was used as an indicator for current speed, with a higher percentage weight loss indicating a larger current speed. Clod cards placed close to the sediment in the seagrass removal plots lost more weight than those in the controls within the 24-h exposure period, suggesting higher current speed in the harvested plots. Weight loss was higher at 15 and 80 cm above the sediment surface, with little differences here between treatments (Supplementary Material). Hence there was a significant interaction effect between height and treatment [F(2, 12) = 6.102, p = 0.015; Figure 7].
Infaunal and Epifaunal Communities
A total of 33,092 organisms were processed at the two sampling moments in 2015 and 2016, with almost 27,000 from control and around 6,000 individuals from harvested plots. There was a total of 57 taxa, 52 from control, and 38 from harvested plots. Across all the samples the crustacean taxa of Amphipoda and Ostracoda and the Polychaete families Orbiniidae/Paraoniidae (grouped together for convenience within this study) were most abundant. Control plots were dominated by small crustaceans with a high abundance of Amphipoda, Apseudomorpha, and Ostracoda while harvested plots were also dominated by Amphipoda but the polychaete families of Orbiniidae/Paraonidae and Cirratulidae were the second and third most abundant taxa. When comparing treatments, the polychaetes Cirratulidae and Lumbrineridae/Oenonidae and the Leptocardii (lancelet) stand out in their higher abundance in harvested than control plots.
There was a larger average biomass of fauna in control [2.240 (±1.854 (95% CI)) g/m2 dry weight] compared with harvested plots [0.684 (±1.862 (95% CI)) g/m2 dry weight]. Crustacea formed the heaviest taxon when biomass for both treatments was combined. The taxa with the largest contribution to biomass in control plots were Chordata, dominated by Scorpaenidae and Apogonidae, and Mollusca. Within harvested plots Crustacea formed the largest contribution in biomass, especially due to the biomass of Decapoda in harvested plots which surpassed the Decapoda biomass in control plots.
One month after the start of the experiment the abundance of infauna in harvested plots was only ~ one quarter that of controls (Figure 8), suggesting a rapid loss of fauna that persisted to 13 months. Taxon richness was also reduced in the harvested plots, with mean [±standard error (SE)] taxon counts for control and harvested treatments of 36 (±2) and 28 (±3), and 47 (± 2), and 28 (±1), respectively, for 1 and 13 months.
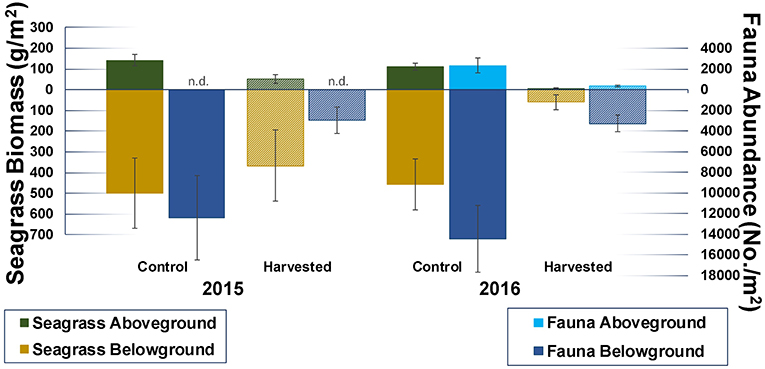
Figure 8. Mean (±SE) faunal abundance in control and harvested plots one and 13 months after the start of the experiment (2015 and 2016, respectively). Aboveground fauna was sampled using drop samples (2016 only), belowground fauna and seagrass biomass were sampled using cores. Seagrass aboveground biomass contains shoots, belowground biomass roots and rhizomes. Harvested plots appear in a raster pattern.
The collected taxa were grouped based on their body type [soft, rigid (exoskeleton), vertebrate, calcified (mollusc)], body size (1: <1 mm, 2: 1–5 mm, 3: >5 mm), diet (predator, deposit feeder/scavenger, suspension or filter feeder, grazer, mixed feeding methods) and interaction with the sediment (sediment surface (reside at the sediment surface or in the top few cm), tube building, mobile (mobile between sediment layers), pelagic, attached to substrate or flora or commensal). Eight functional groups (FG) were created based on the distribution of fauna over these categories: (1) Large molluscs, (2) Small crustaceans, (3) Small polychaetes and other worms, (4) Large polychaetes at the sediment surface, (5) Large crustaceans at the sediment surface, (6) Large burrowing and tube dwelling polychaetes, (7) Pelagic fish, and (8) Large burrowing crustaceans (Supplementary Material).
As well as impacting total abundance and taxon richness, seagrass removal caused a large change in the proportional importance of different functional groups (FG). Large molluscs and small crustaceans and worms were particularly vulnerable to seagrass removal (1–3 in Figure 9). Simultaneously large burrowing and tube dwelling polychaetes, large burrowing crustaceans and pelagic fish were groups that increased in proportional importance in removal plots (6–8 in Figure 9), indicating a shift toward larger, bioturbating fauna as a result of seagrass disturbance.
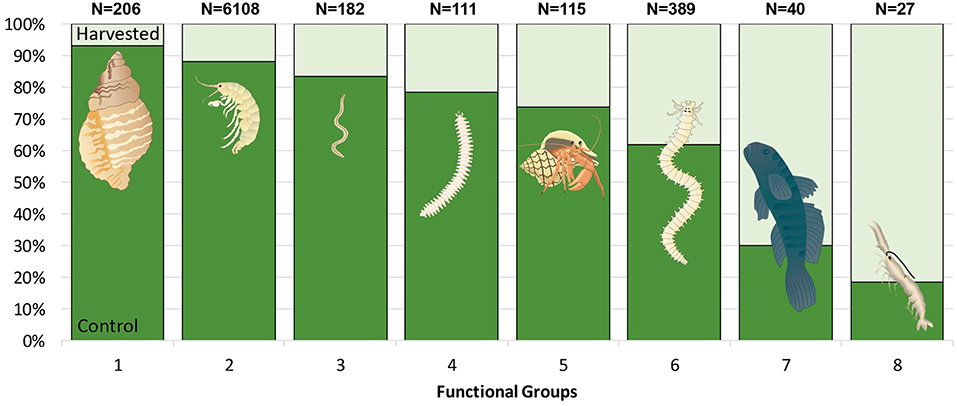
Figure 9. The proportional distribution of all fauna categorized into 8 (FG) collected in control (dark green) and harvested (light green) treatments. Data are pooled from core and drop samples, collected 13 months after the start of the experiment. Bars represent the percentage of individuals within each FG that was found in each treatment. The total number of individuals per FG is given above each bar. (Images: ian.umces.edu/symbols).
Evidence of bioturbating activity at the surface of the plots, in the form of burrows and mounds, was monitored from day 156 to 397 of the experiment, following the results of cores and drop samples which suggested a potential difference in abundance of bioturbating fauna between treatments. There were clear and consistent differences, with higher numbers of mounds and burrows in the harvested treatment (Figure 10). Repeated measures ANOVA showed significant effects of treatment [F(1, 6) = 20,872, p = 0.004] and time on the number of mounds, and a significant interaction [F(8.48) = 4.452, p < 0.001] between time and treatment for burrow counts, caused by the low count of burrows in the removal treatment at day 367 (Figure 10) following a storm event in the bay causing extensive resuspension of sediment.
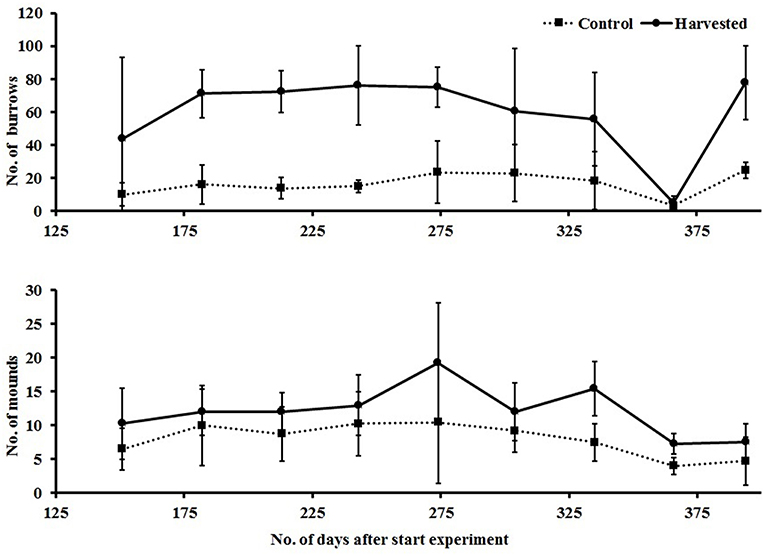
Figure 10. Mean (±95% CI) counts of burrows (top) and mounds (bottom) visible in plots, recorded as evidence of bioturbation by large bodied epi and infauna.
Discussion
We found significant differences in Corg in the surface sediment between harvested and control plots, although these differences did not extend to the full sediment profile. Hence our results lend support to those of Macreadie et al. (2015), in their comparisons of historical sites of disturbance, in suggesting carbon losses following seagrass removal. They do not concur with the experiments reported in Macreadie et al. (2014) and Dahl et al. (2016); in contrast to these studies, we found significant losses of Corg despite the relatively small temporal and spatial scales of our work.
These changes in C concentration and the vulnerability of sequestered C that they imply arise from a combination of physical and biological factors. Seagrass is very effective in damping waves, slowing currents and trapping sediment. As a result, seagrass contributes to coastal protection and to the healthy functioning of contiguous ecosystems, such as mangroves (Guannel et al., 2016) and acts synergistically with other blue carbon habitats to sequester more C together than any of these ecosystems are likely to trap on their own (Huxham et al., 2018). Over a period of 500 days, the sediment surface within intertidal seagrass plots (dominated by E. acoroides and T. hemprichii) at Gazi showed elevation rates of 25 mm yr−1, compared with erosion of 34 mm yr−1 in adjacent un-vegetated control plots (Potouroglou et al., 2017). The present results, this time using an experimental rather than survey approach, complement these findings in showing a similar ability of the intertidal seagrass to trap and stabilize sediment.
The significant differences in gypsum dissolution recorded at the sediment surface suggest that impacts on water movement are a causal mechanism for this enhanced sediment trapping. Many other studies have demonstrated that even low or sparse canopy seagrass beds are capable of attenuating wave energy (e.g., Christianen et al., 2013; Potouroglou et al., 2017), and here we show these effects can be significant, even at spatial scales of only 6 m2 in patches surrounded by lush seagrass. Hence the bottom-up, physical effects of these foundation species on hydrodynamics partly explain the vulnerability of sediment Corg following seagrass removal. However, the large and rapid changes we show in faunal communities following seagrass removal suggest an important role for top-down biological processes as well.
The presence and density of fauna, especially large bioturbators, can be used as an indicator and predictor of the functional status of benthic environments (Eyre, 2011). Faunal impacts on C storage have been documented in many blue carbon habitats, including seagrass (Papaspyrou et al., 2004; Thomson, 2018). Herbivory can have direct impacts on cover and production through consumption, for example green turtles (Heithaus et al., 2014) and urchins (Rose et al., 1999) can remove most aboveground biomass. However, indirect effects may be at least as important, although they are harder to document. Bioturbators can have dramatic impacts on C storage and even on ecosystem persistence, especially when trophic control by predators is relaxed (Atwood et al., 2015). For example, salt marsh at Cape Cod, USA is retreating rapidly because of enhanced burrowing by the crab Sesarma reticulatum, which has been released from predator control by overfishing (Coverdale et al., 2014). Callianassid shrimp in Indonesia have burrows extending down to a meter below the surface and can cause sediment turnover of 3.4 kg m−2 day−1. Their activities may determine the spatial extent of seagrass beds (Kneer et al., 2013). The seascape at our experimental site is characterized by a trough and hummock appearance, in which un-vegetated areas with shrimp mounds are found outside of shallow depressions full of seagrass. This distribution could originate from the small tidal pools remaining in the depressions during low tide, which can protect seagrass against desiccation (Curran and Martin, 2003; Kneer et al., 2013). The significantly enhanced number of mounds and burrows in removal plots suggests that shrimp were able to colonize when seagrass was removed, and their vigorous bioturbation would have contributed to the exposure, loss and oxidation of buried carbon. Although seagrass roots release oxygen during the day, this creates an oxic microzone around the rhizosphere of only several hundred micrometers in diameter in otherwise typically anoxic sediment (Sand-Jensen et al., 2005; Brodersen et al., 2015). In these anoxic conditions, bioturbation by callianassid shrimp can provide a substantial input of oxygen into the sediment, particularly through processes of bio-irrigation, which is predominantly used in biogeochemical processes and microbial respiration (Webb and Eyre, 2004). The remineralization processes promoted by callianassid burrowing activity can result in a 2 to 5 times increase in CO2 emission (Thomson, 2018). Whilst callianassid shrimp are the most obvious bioturbators, seagrass removal resulted in a general shift in community structure toward larger bodied, more active taxa; perhaps as the physical barriers of dense seagrass canopy and rhizomes were removed, facilitating predation, or as the sediment chemistry changed, permitting higher sedimentary oxygen levels. Patches dominated by seagrass or by shrimp and other bioturbators may represent different stable states in the seascape mosaic here. Clear differences in the characteristics (including C density) of sediment taken from seagrass and bioturbator patches, which extend to 50 cm depth, suggest these small scale structures are surprisingly persistent (Githaiga et al., 2017b), and that there is mutual inhibition between seagrass and shrimp, hence relatively small-scale disturbances, such as those imposed experimentally here, may result in long-term shifts in community composition and biogeochemical state, driven by a switch in the dominance of functional groups.
Evidence for changes in sediment chemistry as a result of seagrass removal comes from the significantly enhanced rate of decomposition we found in the harvested plots, which was consistent down to 15 cm depth, below the level we detected changes in Corg. Seagrass sediments are characterized by low levels of oxygen and slow rates of organic decomposition, a key feature contributing to their ability to sequester C. Seventy years after the date of disturbances in their study, Macreadie et al. (2015) found clearly distinct microbial communities in sediment where seagrass had been lost compared with intact control areas; the former was characterized by a higher abundance of aerobic heterotrophs, the latter by sulfate reducing and anaerobic bacteria. Although litter decomposition rates do not provide a direct measure of microbial densities, they can be used as an indirect measure of microbial activity. The rapid (first 60 days) emergence of differences in decay rates between seagrass and removal treatments here suggests that changes in microbial communities might be very fast, particularly when mediated as here by macrofaunal shifts.
We recorded a mean reduction in Corg density in the top 5 cm of sediment equivalent to a loss of 2.21 Mg After 18 months there was also a mean difference in elevation of 3 cm between treatments. Because Corg density does not differ with depth in control plots [that is, there was no effect of depth on Corg density down 50 cm cores taken here or in Githaiga et al. (2017a)], this difference does not arise from comparing surface sediment in controls with sediment that was previously buried in harvested plots. Measuring only surface Corg density underestimates the total impact of seagrass removal on C loss, since it does not include the aboveground biomass or the sediment that was lost from harvested plots. We do not know the fate of the C found in the sediment that was lost; it could simply move elsewhere, or it could be oxidized. This is true for most studies of coastal sediment carbon. Indeed, there is a lively debate about the multiple uncertainties involved in estimating C stocks and flows in seagrasses at local and global levels. If C (especially allochthonous C) trapped in seagrass sediment would be stored elsewhere, for example in coastal basin sediments, were it not intercepted by seagrass then estimates of total sequestration by seagrass beds are exaggerated (Johannessen and Macdonald, 2016). Taking the mean C densities for our control plots as representative, another 2.54 Mg C ha−1 could have been lost within the 18 months of this study if all the C contained in this eroded sediment was oxidized.
Seagrass is a globally threatened habitat. Across the Kenyan coast, total coverage of seagrass is declining at 1.59% yr−1, and in Gazi losses are faster at 1.68% yr−1; decline here is likely to be caused mostly by small-scale but persistent damage from fishing activities (Harcourt et al., 2018). There are many reasons for concern about these losses, since they may undermine the livelihoods of local fishers, enhance erosion and diminish the natural beauty of these coasts. In addition, as demonstrated here, seagrass removal may lead to the loss of stored C and future sequestration potential, and faunal changes can act to speed up this process and perhaps prevent or slow seagrass recovery.
Ethics Statement
Permit for this study was issued by the National Commission for Science, Technology & Innovation (NACOSTI): Permit no NACOSTI/P/14/2443/769 on 17th February 2014. We took the necessary care ensuring minimum effects on the plant and animal life during the study.
Author Contributions
MG conceived and developed the sampling design, collected analyzed the data, wrote the manuscript, prepared figures, tables, submitted the manuscript, and reviewed the manuscript. AF Conceived and designed the sampling work, was involved in data collection, data analysis, drawing of figures, writing and reviewing the draft manuscript before submission. JK Conceived and designed the sampling work, provided the technical support and reviewed the manuscript. MH Conceived and designed the sampling work, was involved in data analysis, led on raising and administering the funds, was involved in writing, provided the guidance and reviewed the draft manuscript before submission.
Conflict of Interest Statement
The authors declare that the research was conducted in the absence of any commercial or financial relationships that could be construed as a potential conflict of interest.
Acknowledgments
This article is based on work that was part of the Coastal Ecosystem Services in East Africa (CESEA) NE/L001535/1 research project and was funded with support from the Ecosystem Services for Poverty Alleviation (ESPA) programme. The ESPA programme is funded by the Department for International Development (DFID), the Economic and Social Research Council (ESRC) and the Natural Environment Research Council (NERC) through collaboration by Edinburgh Napier University, Kenya Marine and Fisheries Research Institute and the University of Embu. Additional support, particularly for Ankje Frouws (AF), came from the British Council Newton Fund, grant no. 275670159. We would like to thank the KMFRI, Gazi station team: Laitani Suleiman, Tom Peter Kisiengo and Derrick Omollo for their assistance both in the field and in the laboratory, and Donna Ridland for assistance with taxonomy.
Supplementary Material
The Supplementary Material for this article can be found online at: https://www.frontiersin.org/articles/10.3389/fevo.2019.00062/full#supplementary-material
References
Atwood, T. B., Connolly, R. M., Ritchie, E. G., Lovelock, C. E., Heithaus, M. R., Hays, G. C., et al. (2015). Predators help protect carbon stocks in blue carbon ecosystems. Nat. Clim. Chang. 5, 1038–45. doi: 10.1038/nclimate2763
Berkenbusch, K., Rowden, A. A., and Myers, T. E. (2007). Interactions between seagrasses and burrowing ghost shrimps and their influence on infaunal assemblages. J. Exp. Mar. Bio. Ecol. 341, 70–84. doi: 10.1016/j.jembe.2006.10.026
Bouillon, S., Dehairs, F., and Velimirov, B. (2007). Dynamics of organic and inorganic carbon across contiguous mangrove and seagrass systems (Gazi Bay, Kenya). J. Geophy. Res. 112, 1–14. doi: 10.1029/2006JG000325
Bowden, D. A., Rowden, A. A., and Attrill, M. J. (2001). Effect of patch size and in-patch location on the infaunal macroinvertebrate assemblages of Zostera marina seagrass beds. J. Exp. Mar. Bio. Ecol. 259, 133–54. doi: 10.1016/S0022-0981(01)00236-2
Brodersen, K. E., Nielsen, D. A., Ralph, P. J., and Kühl, M. (2015). Oxic microshield and local pH enhancement protects Zostera muelleri from sediment derived hydrogen sulphide. New Phytol. 205, 1264–76. doi: 10.1111/nph.13124
Christianen, M. J., van Belzen, J., Herman, P. M., van Katwijk, M. M., Lamers, L. P., van Leent, P. J., et al. (2013). Low-canopy seagrass beds still provide important coastal protection services. PLoS ONE 8:e62413. doi: 10.1371/journal.pone.0062413
Coppejans, E. H., Beeckman, H., and De Witt, M. (1992). The seagrass and associated macroalgae vegetation of Gazi Bay (Kenya). Hydrobiologia 247, 59–75. doi: 10.1007/BF00008205
Coverdale, T. C., Brisson, C. P., Young, E. W., Yin, S. F., Donnelly, J. P., and Bertness, M. D. (2014). Indirect human impacts reverse centuries of carbon sequestration and salt marsh accretion. PLoS ONE 9:e93296. doi: 10.1371/journal.pone.0093296
Curran, H. A., and Martin, A. J. (2003). Complex decapod burrows and ecological relationships in modern and Pleistocene intertidal carbonate environments, San Salvador Island, Bahamas. Palaeogeogr. Palaeoclimatol. Palaeoecol. 192, 229–245. doi: 10.1016/S0031-0182(02)00687-9
Dahl, M., Deyanova, D., Lyimo, L. D., Näslund, J., Samuelsson, G. S., Mtolera, M. S. P., et al. (2016). Effects of shading and simulated grazing on carbon sequestration in a tropical seagrass meadow. J. Ecol. 104, 654–664. doi: 10.1111/1365-2745.12564
Day, J. H. (1967). A monograph of the polychaeta of Southern Africa. J. Mar. Bio. 48:836. doi: 10.1017/S0025315400019299
Duarte, C. M., Middelburg, J. J., and Caraco, N. (2005). Major role of marine vegetation on the oceanic carbon cycle. Biogeosciences 2, 1–8. doi: 10.5194/bg-2-1-2005
Eyre, B. D, and Maher, D. (2011). Mapping ecosystem processes and function across shallow seascapes. Cont. Shelf. Res. 31, 162–72. doi: 10.1016/j.csr.2010.01.013
Githaiga, M. N., Kairo, J. G., Gilpin, L., and Huxham, M. (2017a). The Role of Seagrass Meadows in Gazi Bay, Kenya as Carbon Sinks. Ph.D thesis, Edinburgh Napier University, Edinburgh.
Githaiga, M. N., Kairo, J. G., Gilpin, L., and Huxham, M. (2017b). Carbon storage in the seagrass meadows of Gazi Bay, Kenya. PLoS ONE 12:e0177001. doi: 10.1371/journal.pone.0177001
Green, E. P., and Short, F. T. (2003). World Atlas of Seagrasses. Berkeley, CA: University of California Press.
Guannel, G., Arkema, K., Ruggiero, P., and Verutes, G. (2016). The power of three: coral reefs, seagrasses and mangroves protect coastal regions and increase their resilience. PLoS ONE 11:e0158094. doi: 10.1371/journal.pone.0158094
Harcourt, W., Briers, R., and Huxham, M. (2018). The thin(ning) green line? Investigating changes in Kenya's seagrass coverage. Biol. Lett. 14, doi: 10.1098/rsbl.2018.0227
Hayward, P. J., and Ryland, J. S. (eds.). (2000). Handbook of the Marine Fauna of North-West Europe. New York, NY: Oxford University Press.
Heithaus, M. R., Alcoverro, T., Arthur, R., Burkholder, D. A., Coates, K. A., Christianen, M. J. A., et al. (2014). Seagrasses in the age of sea turtle conservation and shark overfishing. Front Mar Sci. 1:28. doi: 10.3389/fmars.2014.00028
Herkül, K., and Kotta, J. (2009). Effects of eelgrass (Zostera marina) canopy removal and sediment addition on sediment characteristics and benthic communities in the Northern Baltic Sea. Mar Ecol 30, 74–82. doi: 10.1111/j.1439-0485.2009.00307.x
Howard, J., Hoyt, S., Isensee, K., Telszewski, M., and Pidgeon, E. (2014). “Coastal Blue Carbon:Methods for assessing carbon stocks and emmission factors in mangroves, tidal salt marshes and seagrasses,” in Conservation International (Arlington, VA: Conservation International, Intergovernmental Oceanographic Commission of UNESCO, International Union for Conservation of Nature).
Huxham, M., Whitlock, D., Githaiga, M., and Dencer-Brown, A. (2018). Carbon in the coastal seascape : how interactions between mangrove forests, seagrass meadows and tidal marshes influence carbon storage. Curr. For. Rep. 4, 101–110. doi: 10.1007/s40725-018-0077-4
IPCC (2013). Supplement to the 2006 IPCC Guidelines for National Greenhouse Gas Inventories: Wetlands. eds T. Hiraishi, T. Krug, K. Tanabe, N. Srivastava, J. Baasansuren, M. Fukuda, and T. G. Troxler (IPCC).
Johannessen, S. C., and Macdonald, R. W. (2016). Geoengineering with seagrasses: is credit due where credit is given? Environ. Res. Lett. 11. doi: 10.1088/1748-9326/11/11/113001
Jokiell, P. L., and Janice, I. (1993). Water motion on coral reefs : evaluation of the' clod card' technique. Mar. Ecol. Prog. Ser. 93, 175–81.
Kneer, D., Asmus, H., and Jompa, J. (2013). Journal of experimental marine biology and ecology do burrowing callianassid shrimp control the lower boundary of tropical seagrass beds? J. Exp. Mar. Bio. Ecol. 446, 262–72. doi: 10.1016/j.jembe.2013.05.023
Macreadie, P. I., Trevathan-Tackett, S. M., Skilbeck, C. G., Sanderman, J., Curlevski, N., Jacobsen, G., et al. (2015). Losses and recovery of organic carbon from a seagrass ecosystem following disturbance. Proc. Biol. Sci. 282. doi: 10.1098/rspb.2015.1537
Macreadie, P. I., York, P. H., Sherman, C. D. H., Keough, M. J., Ross, D. J., Ricart, A, M., et al. (2014). No detectable impact of small-scale disturbances on ‘blue carbon' within seagrass beds. Mar. Biol. 161, 2939–2944. doi: 10.1007/s00227-014-2558-8
Mcleod, E., Chmura, G. L., Bouillon, S., Salm, R., Björk, M., Duarte, C. M., et al. (2011). A blueprint for blue carbon: toward an improved understanding of the role of vegetated coastal habitats in sequestering CO2. Front. Ecol. Environ. 9, 552–560. doi: 10.1890/110004
Ngoc-Ho, N. (2003). European and Mediterranean thalassinidea (Crustacea, decapoda). Zoosystema 25, 439–555.
Odido, M., Appeltans, W., BelHassen, M., Mussai, P., Nsiangango, S. E., Vandepitte, L., et al. (2015). African Register of Marine Species Muraenesocidae Kaup, 1859. Available online at: http://www.marinespecies.org/afremas%20/aphia.php?p=taxdetails&id=125430
Orth, R. J., Carruthers, T. J. B., Dennison, W. C., Duarte, C. M., Fourqurean, J. W., Heck, K. L. Jr., et al. (2006). A global crisis for seagrass ecosystems. Bioscience 56, 987–997. doi: 10.1641/0006-3568(2006)56[987:AGCFSE]2.0.CO;2
Papaspyrou, S., Thessalou-Legaki, M., and Kristensen, E. (2004). Impact of Pestarella tyrrhena on benthic metabolism in sediment microcosms enriched with seagrass and macroalgal detritus. Mar. Ecol. Prog. Ser. 281, 165–79. doi: 10.3354/meps281165
Pendleton, L., Donato, D. C., Murray, B. C., Crooks, S., Jenkins, W. A., Sifleet, S., et al. (2012). Estimating global “blue carbon” emissions from conversion and degradation of vegetated coastal ecosystems. PLoS ONE 7:e43542. doi: 10.1371/journal.pone.0043542
Potouroglou, M., Bull, J. C., Krauss, K. W., Kennedy, H. A., Fusi, M., Daffonchio, D., et al. (2017). Measuring the role of seagrasses in regulating sediment surface elevation. Sci. Rep. 7:11917. doi: 10.1038/s41598-017-12354-y
Rose, C., Sharp, W C., Kenworth, W. J., Hunt, J. H., Lyons, W., Prager, E. J., et al. (1999). Overgrazing of a large seagrass bed by the sea urchin Lytechinus variegatus in Outer Florida Bay. Mar. Ecol. Prog. Ser. 190, 211–22. doi: 10.3354/meps190211
Sand-Jensen, K., Pedersen, O., Binzer, T., and Borum, J. (2005). Contrasting oxygen dynamics in the freshwater isoetid Lobelia dortmanna and the marine seagrass Zostera marina. Ann. Bot. 96, 613–623. doi: 10.1093/aob/mci214
Short, F. T., and Wyllie-Echeverria, S. (1996). Natural and human-induced disturbance of seagrasses. Environ. Conserv. 23, 17–27. doi: 10.1017/S0376892900038212
Sida and WIOMSA. (2011). A Field Guide to the Seashores of Eastern Africa and the Western Indian Ocean Islands, ed M. D Richmond (Norwich: Sida), 155.
Smith, M. M., and Heemstra, P. C. (1999). Smith's Sea Fishes. Southern Africa: Southern Book Publishers.
Thomson, A. C. G. (2018). Bioturbator-stimulated loss of seagrass sediment carbon stocks. Limnol. Oceanogr. 64, 1–15. doi: 10.1002/lno.11044
Troch, M. D., Gurdebeke, S., Fiers, F., and Vincx, M. (2001). Zonation and structuring factors of meiofauna communities in a tropical seagrass bed (Gazi Bay, Kenya). J. Sea Res. 45, 45–61. doi: 10.1016/S1385-1101(00)00055-1
Waycott, M., Duarte, C. M., Carruthers, T., Orth, R. J., Dennison, W. C., Olyarnik, S., et al. (2009). Accelerating loss of seagrasses across the globe threatens coastal ecosystems. Proc. Natl. Acad. Sci. USA. 106, 12377–12381. doi: 10.1073/pnas.0905620106
Webb, A. P., and Eyre, B. D. (2004). Effect of natural populations of burrowing thalassinidean shrimp on sediment irrigation, benthic metabolism, nutrient fluxes and denitrification. Mar. Ecol. Prog. Ser. 268, 205–220. doi: 10.3354/meps268205
WoRMS Editorial Board (2015). World Register of Marine Species. Available online at: http://www.marinespecies.org at VLIZ.
Keywords: macrofaunal communities, seagrass removal, surface elevation, carbon, bioturbation
Citation: Githaiga MN, Frouws AM, Kairo JG and Huxham M (2019) Seagrass Removal Leads to Rapid Changes in Fauna and Loss of Carbon. Front. Ecol. Evol. 7:62. doi: 10.3389/fevo.2019.00062
Received: 05 November 2018; Accepted: 18 February 2019;
Published: 15 March 2019.
Edited by:
Alberto Vieira Borges, University of Liège, BelgiumReviewed by:
Sebastiaan van de Velde, University of California, Riverside, United StatesTania M. Costa, São Paulo State University, Brazil
Alex Clare Goudie Thomson, University of Technology Sydney, Australia
Copyright © 2019 Githaiga, Frouws, Kairo and Huxham. This is an open-access article distributed under the terms of the Creative Commons Attribution License (CC BY). The use, distribution or reproduction in other forums is permitted, provided the original author(s) and the copyright owner(s) are credited and that the original publication in this journal is cited, in accordance with accepted academic practice. No use, distribution or reproduction is permitted which does not comply with these terms.
*Correspondence: Michael N. Githaiga, bmpvcm9nZS5taWNoYWVsMDRAZ21haWwuY29t