 Máximo Sánchez-Aragón1†
 Julia Cantisán-Gómez2†‡
 Carlos M. Luque1‡
 Catarina Brás-Pereira1‡
 Carla S. Lopes1‡
 M. Carmen Lemos2*
 Fernando Casares1*
- 1GEM-DMC2 Unit, CABD (CSIC-Universidad Pablo de Olavide-Junta de Andalucía), Seville, Spain
- 2Department of Condensed Matter Physics, University of Sevilla, Sevilla, Spain
Dipterans show a striking range of eye sizes, shapes, and functional specializations. Their eye is of the compound type, the most frequent eye architecture in nature. The development of this compound eye has been most studied in Drosophila melanogaster. The early development of the Drosophila eye is under the control of a gene regulatory network of transcription factors and signaling molecules called the retinal determination gene network (RDGN). Nodes in this network have been found to be involved not only in the development of different eye types in invertebrates and vertebrates, but also of other organs. Here we have analyzed the network properties in detail. First, we have generated quantitative expression profiles for a number of the key RDGN transcription factors, at a single-cell resolution. With these profiles, and applying a correlation analysis, we revisited several of the links in the RDGN. Our study uncovers a new link, that we confirm experimentally, between the transcription factors Hth/Meis1 and Optix/Six3 and indicates that, at least during the period of eye differentiation, positive feedback regulation from Eya and Dac on the Pax6 gene Ey is not operating. From this revised RDGN we derive a simplified gene network that we model mathematically. This network integrates three basic motifs: a coherent feedforward loop, a toggle-switch and a positive autoregulation which, together with the input from the Dpp/BMP2 signaling molecule, recapitulate the gene expression profiles obtained experimentally, while ensuring a robust transition from progenitor cells into retinal precursors.
Introduction
During organ development, specification of cell fates depends on gene regulatory networks (GRNs). These GRNs represent as directed graphs biochemical reactions that result in changes in gene expression (mRNA and protein production), which ultimately control cell function. GRNs comprise intracellular as well as extracellular components. Within a cell, nodes represent transcription factors (TFs) that regulate further tiers of genes, and the links connecting the nodes represent the activation/repression action of TFs on their target genes. Extracellular signals modify the activation/repression rates and thereby are key modulators of the dynamics of these GRNs. In general, GRNs operating during organ development must account for several biological phenomena: the generation of patterns of gene expression in space and time and the reliability in the generation of these patterns (i.e., robustness). Equally important, variations in the GRN of a particular organ underlie the evolutionary changes in the morphology and function of this organ (Levine and Davidson, 2005; Smith et al., 2018).
The Drosophila eye has been used as a paradigm to describe and study a GRN controlling organ specification and early development, the so-called retinal determination gene network (RDGN) (Silver and Rebay, 2005; Kumar, 2009; Amore and Casares, 2010; Casares and Almudi, 2016). Major genes in this network have been implicated in the development of other organs in Drosophila and, interestingly, in vertebrates, suggesting some degree of conservation in the processes controlled by those genes (Ikeda et al., 2002; Zhang et al., 2002, 2006b; Bessarab et al., 2004; Purcell et al., 2005; Bumsted-O'Brien et al., 2007; Kaiser et al., 2007; Erickson et al., 2010; Pineiro et al., 2014; Spieler et al., 2014). The current Drosophila RDGN has been built compiling genetic (i.e., functional), expression and regulatory information. Genetic experiments include loss- and gain-of-function experiments. Some of the latter, performed through ectopic gene expression in other organs (mostly in the developing wing), showed that some of the RDGN genes were sufficient to drive eye development, with the Pax6 gene eyeless (ey) being a paradigmatic case of the capacity of a TF to re-specify tissues toward eye development (Halder et al., 1995; Czerny et al., 1999; Baker et al., 2018). Expression data included transcripts, protein products and transcriptional reporters. For some interactions, enhancer elements have been identified and direct biochemical proof of transcription factor binding obtained, establishing direct regulatory links. This GRN should then result in specific spatio-temporal patterns of gene expression. However, the RDGN has not been challenged against a comprehensive quantitative analysis of the expression of its key transcription factors yet. This analysis can potentially identify inconsistencies between the GRN and its actual output (gene expression patterns) or give support to network topologies, as has been shown, for example, for the Drosophila embryonic segmentation network (Jaeger and Manu, 2012). Further, if the quantitative analysis comes from space-resolved single-cell data, it allows measuring important parameters such as gene expression variability (“noise”) and expression correlations among genes, from which potential regulatory relationships can be inferred.
The eye primordium is a monostratified epithelium. Before differentiation onset, the progenitor state is characterized by the expression of the Meis1 homolog homothorax (hth) and of two paralogue pairs: the Pax6 genes ey and twin of eyeless (toy) plus the paralogues teashirt (tsh) and tip-top (tio) (Bessa et al., 2002, 2009; Datta et al., 2009; Weasner et al., 2009). The network is animated by two secreted signals: Hh (Hedgehog) and the BMP2 Dpp (Decapentaplegic). Hh and Dpp are initially expressed at the primordium's posterior margin and facilitate the repression of hth and the upregulation of a set of nuclear/transcription factors that include eyes absent (eya/Eya), sine oculis (so/Six2) and dachshund (dac/Dach), so that progenitors are converted into cell cycle quiescent precursors. The RDGN culminates with the activation of the proneural gene atonal (ato) which is required for the further differentiation of precursor cells into photoreceptors (“R”). R cells express Hh, and Hh, in turn, induces the expression of Dpp. In this way, Hh and Dpp set in motion a differentiation wave that sweeps across the primordium leaving on its wake differentiating retinal tissue [reviewed in (Treisman, 2013)]. The front of this wave (that marks the transition from precursors to R cells) is characterized by an indentation of the epithelium, the morphogenetic furrow (MF), which acts as landmark for the wave-front. The wave/MF advances across the primordium at about constant speed during most of the differentiation process (except at the beginning and ending) (Campos-Ortega and Hofbauer, 1977; Basler and Hafen, 1989; Wartlick et al., 2014; Vollmer et al., 2016). One important consequence of this fact is that gene expression patterns remain stationary relative to the MF throughout most of the process. This allows, in principle, to use data from different time points -as long as the initiation and ending of the process are not included- to generate gene expression curves, registering all data relative to the MF.
In this paper we have generated registered spatial expression curves for hth, optix, ey, eya, dac, and ato in the Drosophila eye primordium, extracting expression information as fluorescence intensity from single-nuclei using laser confocal microscopy data. By performing double-labeling experiments, correlated data for gene-pairs was obtained to analyze potential regulatory relationships. With these data at hand, we revise the current gene regulatory model and explore, using a computational model, a core network topology that might confer, simultaneously, bi-stability and noise reduction properties to the RDGN.
Materials and Methods
Genotypes and Genetic Manipulations
Eye imaginal discs from the Drosophila melanogaster wild type strain Oregon-R were used when no transgenes were present in the genotype. Transgenes used: The optix2/3-dGFP enhancer reporter transgene is described in Ostrin et al. (2006) and recapitulates the endogenous expression of Optix (see Supplementary Figure 1). To generate the 3′ato-destabilized GFP (3′ato-dGFP) enhancer reporter transgenic line, the 3′ato enhancer sequence, which controls the onset of ato expression anterior to the morphogenetic furrow (Zhang et al., 2006a), was PCR-amplified from genomic DNA using the primer set: FW: ATCGGGAGCAGTAACAAACTTAAC and RW: ATCTCCATCCTCAATCAAAGCTAC and cloned into pCR8-TOPO. The cloned fragment was then transferred into the pBPUw-dGFP Gateway integration vector (Royo et al., 2011) according to the manufacturer's recommendations (Invitrogen). DNA constructs were microinjected into embryos from flies carrying the landing platformZH- attP- 22A (Bischof et al., 2007), using standard Drosophila transformation techniques. The hth-YFP protein trap strain [CPTI-001356; Flannotator (Ryder et al., 2009)] was used in some experiments to follow hth expression and is described in (Choo et al., 2014).
dac3(Flybase) mutant clones were induced by flip-mediated mitotic recombination (Xu and Rubin, 1993) by subjecting yw, hs-flipase 122; FRT40A dac3/FRT40A Ubi-GFP larvae to a 30′ heat shock (37°C). dac3-mutant tissue was marked by the absence of GFP.
Flip-out clones: the Flip-Out method (Struhl and Basler, 1993) was used to knock down Drosophila Pax6 paralogues simultaneously. RNA-mediated interference (RNAi) of ey expression was achieved using UAS-eyRNAi (II) (VDRC 106628), while toy expression was knocked down using UAS-toyRNAi/TM6B,Tb(VDRC 15919). Both UAS-RNAi transgenes were combined in a single line using standard genetic techniques. Females of the genotype y,w,hsFLP,Act5C(FRT.hsCD2)Gal4;;UAS GFP/TM6b,Tb were crossed to males carrying both UAS-RNAi for ey and toy. Clones were induced 24–48 h after egg laying (AEL) by a 15′ heat shock at 35.5°C. Next, larvae were grown at 29°C to maximize UAS-RNAi expression on standard medium and dissected 48 h later. In order to recover clones of cells simultaneously expressing both ey and toy RNAi, larvae of the following genotype were selected: y,w,hsFLP,Act5C(FRT.hsCD2)Gal4/+;UAS-eyRNAi/+;UAS-toyRNAi/UAS-GFP. To induce hth expressing clones, y,w,hsFLP,Act5C(FRT.hsCD2)Gal4 females were crossed to UAS-131-GFPhth (Casares and Mann, 2000) males. Clones were induced 24–48 h AEL by a 15' heat shock at 35.5°C, and larvae raised at 25°C until dissection.
Immunofluorescence and Imaging
For immunofluorescence, discs were processed essentially as in Casares and Mann (2000). For the samples aimed at obtaining quantitative gene expression profiles, one extra step was introduced. In order to improve nuclei segmentation during image analysis, discs were briefly (10′) incubated in 0.75×PBS on ice just before fixation. This “hypotonic shock” induced a slight swelling of the cells resulting in larger spacing between nuclei that made the segmentation of the nuclei after confocal imaging easier. Primary antibodies used were guinea pig anti-Hth at 1:3000 (Casares and Mann, 1998), rat-anti-Ey (1/150; gift from P. Callaerts), mouse anti-Eya (10H6 at 1/100 from Developmental Studies Hybridoma Bank, DSHB), mouse anti-Dac (1/500 Mabdac1-1, DSHB), chicken anti-GFP (1/500 Abcamab 13970), rabbit anti-GFP (1/1000 Molecular Probes A11122), rabbit anti-Optix [1/500, gift from F. Pignoni, SUNY Upstate Medical University (Kenyon et al., 2005)] and rat anti-Elav (1:10007EBA10, DSHB). Fluorescently labeled secondary antibodies were from Molecular Probes (1/500). Laser Confocal Microscopy (LCM) was carried out on Leica SPE (all imaging for quantitative analysis) or Leica SP2 (data in Figures 3C,D, 4E) confocal microscope set-ups. The gene combinations imaged and the number of samples per combination were: Hth;Eya (19), Hth;Ey;ato-dGFP (8), Hth:YFP;Dac (8), Ey;optix2/3-dGFP (5), Eya;optix2/3-dGFP (5), Dac;optix2/3-dGFP (3), Eya;ato-dGFP (2), Dac;ato-dGFP (4).
Gene Expression Profile Generation, Including Segmentation and Alignment
Although gene expression profiles were generated from discs of different strains, we expect all relative positions and correlations/anticorrelations of the gene expression profiles to be the same irrespective of strain. Samples imaged by LCM were processed in order to retrieve DAPI-stained nuclei in the three dimensions within a “sampling volume” (see Figure 1). This sampling volume spans the central region of the disc, avoiding the inclusion of the lateral folds of the disc, as these would complicate the analysis, contained the anterior-most region of the eye disc and straddled the morphogenetic furrow. An ad hoc software, iFLIC, was designed that scans for ellipsoid intersection patterns with the confocal planes in any position and orientation within a rank of semiaxis lengths (RSL). These RSL were determined by a pre-scanning in which blobs of variable radius were tested. The patterns were checked for voxels whose value is greater than an optimized threshold, i.e., Otsu. Once these patters were established, a limited flooding was performed around the detected ellipsoids in order to cover the nuclei volume. The software also allowed performing a manual user transformation of the coordinates (i.e., the centroids of nuclei segments) which results in the selection of anterior-posterior stripes of constant width centered at the MF, i.e., the transformed reference frame (TRF). Tissue folds (which generally would introduce unrelated variability due to differential allocation of cells) were later corrected by the estimation of the z-coordinate in the TRF using a Gaussian radial function with an optimal bandwidth (shape parameter) and the centroids as positional data, which rendered a surface model of the selected volume. Centroids were projected onto the closer position of this surface and their trajectories within (up to the TRF origin) computed for both the x and y directions, replacing the original coordinates. The full description of iFLIC, the image segmentation software, can be found in Sanchez-Aragon and Casares (2019).
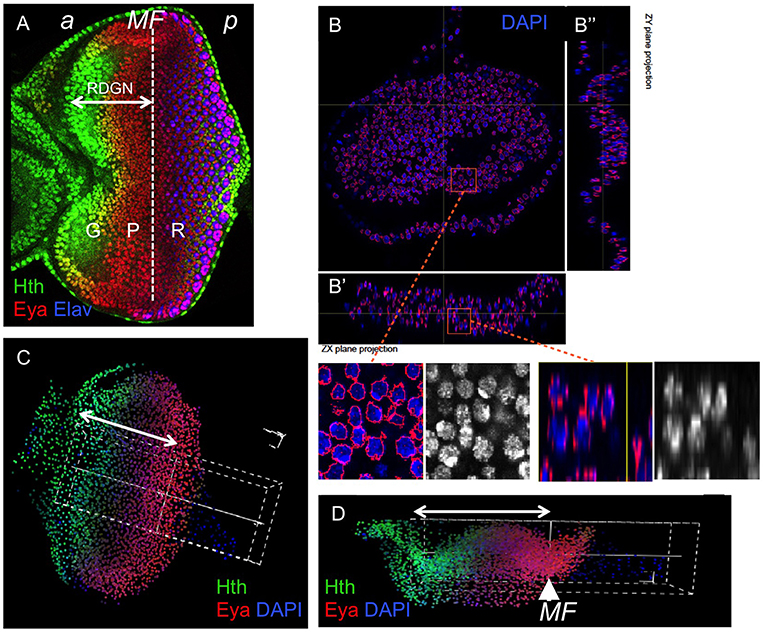
Figure 1. Quantification of gene expression using confocal microscopy data in eye discs. (A) Confocal image of a late third larval stage (L3) eye disc, stained for Hth, Eya, and the photoreceptor marker Elav. These genes mark three major domains in the primordium: progenitors (“G”), precursors (“P”), and differentiating retina (“R”). The dashed line marks the approximate location of the morphogenetic furrow (MF). The retinal determination gene network (RDGN) comprises the regulatory interactions that span the specification of progenitors and their transition to atonal-expressing retinal precursors. “a” and “p” indicate anterior and posterior, respectively. The confocal data used in this study included the nuclear marker DAPI. Nuclei are segmented in 3D using iFLIC, a custom made software (Sanchez-Aragon and Casares, 2019). When the segmented stacks are re-sliced (B–B″), nuclear boundaries (RED) appear correctly located in most nuclei. The insets show higher magnification views of the boxed regions. (C,D) 3D reconstruction of an early disc showing a sampling volume (white dashed box) oriented parallel to the AP axis and centered at the morphogenetic furrow, stained with Hth, Eya and DAPI. (x,y) (A) and (x,z) (B) views are shown. The double-headed arrow indicates the region anterior to the MF. In general, the 3D reconstruction may be sampled in specific directions (white dashed box in A,B), and the profiles for specific genes measured with high accuracy. The result is similar to a FACS analysis, but with the advantage of keeping the positional information.
Finally the lack of calibration for each transcription factor signal was further corrected by a method we call Linear Scaling Minimization, in which variability across samples was reduced by linear transformations (implemented separately in an R package, Riflic, described in Supplementary Material). This produced the final data set for the model validation. This software can be downloaded at http://www.pvcbacteria.org/maxf/. The mean gene expression profiles shown in Figure 3 for each gene are the assembled profiles using all data sets for that gene. However, the correlation and coefficient of variation metrics for gene-pairs were computed exclusively using data from samples co-stained for each gene pair. These co-stained data are shown individually within the Supplementary Material on Mathematical Methods for Variability Reduction in Spatially Distributed Samples of Cell Segmentation.
Model and Model Analysis
In order to reproduce qualitatively the gene expression profiles obtained experimentally (see Figure 5B), we modeled the dynamics of the concentrations of the key transcription factors of the RDGN using coupled differential equations. The model equations were built as follows:
The regulatory links are modeled as Hill equations, of the type:
for activation and
for repression. We consider the production rate of protein A controlled by a single transcription factor B and, therefore, rate of production of A is equal to f(B). n is the Hill coefficient, β is the maximum A production rate, and K, which is named the activation/repression coefficient and has units of concentration, is the concentration of B necessary to obtain β/2–i.e., half-maximal A production rate.
In the following equations, the subindex “X” makes reference to the TF X, and the subindex “XY” to a (positive or negative) interaction from X to Y.
The equations that describe the coherent feed-forward loop (cFFL) for Pax6 (“P”), Eya:So (“E”), and target (“T”) are:
in the form P activates both E and T, while E activates T and besides, E is self-regulated.
The equations contain different parameter types: the first term Bk (k = E, T) accounts for the basal production rate; βk(k = E, T) is the maximum production rate; αk(k = E, T) is for the degradation/dilution rates; and hence the last term, αkK, represents the decay of each TF (including degradation and dilution as cells grow). The profile of P distribution is an input in this case, and was modeled as a sum of two Gaussian functions in order to approximate qualitatively the experimental profile:
Equation (3) describes the concentration variation with time of E. This variation is determined by P activation (second term of the equation) and E's autoregulation (third term). As both terms are independent of each other they appear as a sum. The self-regulation allows the concentration of E to be maintained even if P concentration falls to zero.
Equation (4) describes the concentration variation with time of T. The product of the contribution of P and E represents the AND integration logic. This “AND” logic of the FFL imposes a delay in T because it makes necessary minimum concentrations of P and E to activate T. If the integration logic becomes “OR,” T concentration appears earlier, even before that of E. In addition, an OR logic would cause T be expressed even after P were no longer expressed.
Next, including the toggle-switch motif that represents the mutual repression between E (Eya/So) and H (Hth), the model equations are:
with (8) describing the final dynamics of the target T.
Finally, we introduce the action of the Dpp morphogen signaling (“M”). Dpp is produced at the differentiation wave-front, the morphogenetic furrow (MF), that separates anterior proliferative undifferentiated cells from posterior differentiating, cell cycle quiescent, retinal cells. Dpp signaling is required for Hth (“H”) repression. As the Dpp signaling cascade is transduced in the nucleus by a transcription factor [Mad (Wiersdorff et al., 1996)], we model the action of Dpp signaling as a repressor transcriptional input on H, and approximate the distribution of Dpp signaling as a Gaussian representing the spatial distribution of the active form of Mad [see (Neto et al., 2016) and references therein]. The model is now described by the following equations, where the repression of M on H has been included. Note that the integration of the repressor links from E and Dpp (“M”) on Hth (“H”) (Equation 10) are additive, equivalent to an “OR” logic (Mangan and Alon, 2003):
In our model, the profile of M distribution has been approximated as a Gaussian function as this is a one-dimensional diffusion process centered around the MF. M is simulated as:
The full model is represented by the differential equations (9), (10), and (11), being M and P the inputs to the system.
In order to obtain a set of values for all the parameters capable of simulating computationally the expression profiles obtained from experiments, the model was implemented using Vensim software (Vensim PLE, Ventana Systems, https://vensim.com/vensim-software/), a visual tool for solving differential equations that allows modifying parameter values in run-time. Note that the values of the parametric set have been manually adjusted to obtain qualitatively similar profiles to the experimental ones. Once this was done (see Supplementary Figure 2 for the Vensim model and parameter values used), the model was also implemented using MATLAB (http://www.mathworks.com/).
To test whether the network is stable with respect to noise and whether the FFL acts as noise filter, we added white Gaussian noise to the inputs of the system—that is, to M and P. This implies that E, H, and T become stochastic variables. We computed a sufficiently large number of trajectories and calculated the standard deviation, which is a function of time. After averaging in time, we compared it to the noise in the input and obtained that the propagated noise constitutes only an ~8.5% (See below).
Results
Image Analysis Pipeline: Obtaining Gene Expression Profiles
Our first aim was to describe quantitatively changes in the expression of key RDGN genes as cells get closer to the differentiation wave. As a correlate of gene expression we used immunofluorescence intensity signal obtained from dense confocal imaging stacks. Rather than mean fluorescence profiles, we aimed at obtaining single cell expression data. This type of data is equivalent to performing cell cytometry but preserving spatial information, and allows a precise measurement of gene expression variation among cells. In addition, to obtain gene expression correlation profiles, we obtained data from eye discs co-stained with pairs of genes.
As a first step, we used an image analysis pipeline, based on watershed, to segment nuclei in 3D, using DAPI as nuclear marker, and recording the information on the position of the centroid of each nucleus. Next, each nucleus is assigned gene expression values as fluorescence intensity (Figure 1) (Naval-Sanchez et al., 2013; Sanchez-Aragon and Casares, 2019). Although the eye primordium (or “eye disc”) is an epithelial monolayer, it becomes folded as development proceeds. In addition, even using spacers for mounting the samples, there is some experimental variation in the degree of folding of the discs. Therefore, to minimize the impact of this folding on the registration of gene expression profiles from different samples, we implemented a computational “flattening” procedure of the data. With it, nuclei are connected orthogonally with the mean plane going across the sample (Figures 2A–C) and then their position is reassigned as the plane is flattened. The correlation analysis of pairs of gene expression profiles before and after flattening shows that correlation is generally improved after flattening (Figure 2D; see Supplementary Material for a full description of the procedure). The expression profiles were registered using the position of the MF as coordinate x = 0.
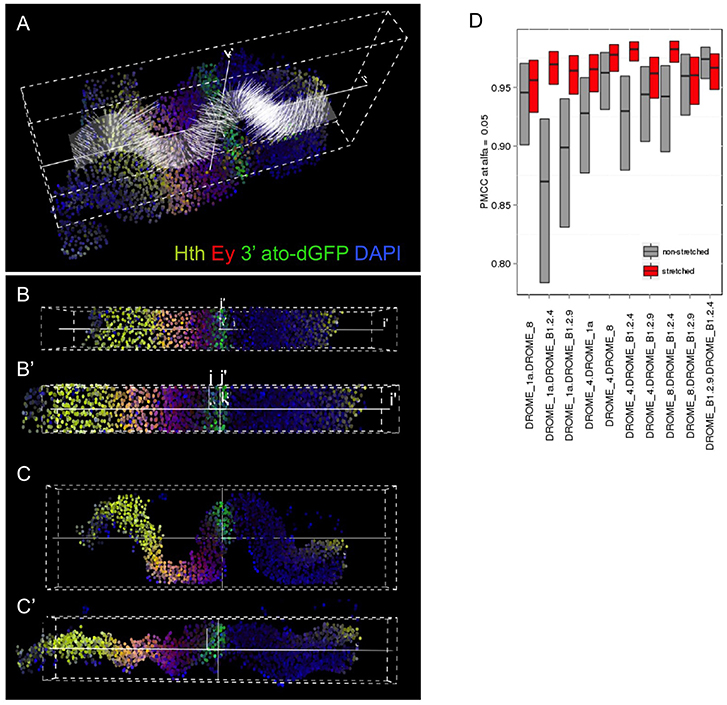
Figure 2. Computer-aided stretching of the tissue improves the registration of gene expression profiles. The folding of the disc epithelium is an important source of analytical error. We have developed an iFLIC plug-in (see Supplementary Material) that solves sufficiently this problem by estimating the actual z coordinate for each nucleus centroid of the sampled tissue and calculates the orthogonal projection of each cell on that surface (A). The disc shown is from an ato-dGFP individual, stained for GFP (ato), Hth (yellow), Ey (red), and DAPI (blue). The results of the computer-aided stretching are shown in (B,B′: top views) and (C,C′: lateral views). B′ and C′ are the stretched data. (D) Comparison of the Pearson's correlation coefficient (PMCC) of gene profiles in several independent samples by combining them in pairs, either non-stretched (gray) or after stretching (red) (D). Stretching leads to a general improvement of the PMCC. PMCC was computed by Fisher's transform, showing confidence intervals at α = 0.05.
Link Inference Based on Expression Correlations
We generated expression profiles for key nodes of the gene network (Figure 3A) using specific antibodies (Hth, Ey, Eya, and Dac), a hth protein-trap (hth-YFP) and transcriptional reporters for ato and optix [3′ato-dGFP and optix2/3-dGFP (Ostrin et al., 2006)] (see Materials and Methods), which constitute a dense sampling of many key nodes of the gene network.
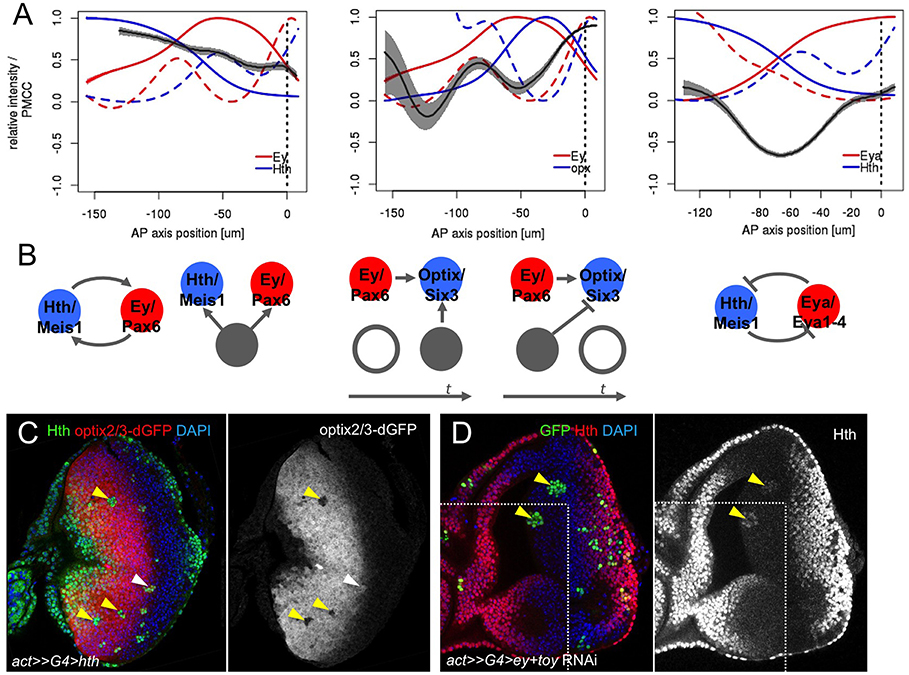
Figure 3. Correlation analysis of gene expression profiles. (A) Local weighted correlation for Hth/Ey, Ey/Optix, and Eya/Hth showing three parameters: their mean (solid line), their Fano's factor (as a measure of signal variability, or “noise,” dashed line) and their weighted local correlation (gray ribbon). Ribbon width corresponds to a confidence interval with α = 0.05. (B) Potential regulatory interactions that are compatible with the correlation analysis (see main text for details). (C) Hth-expressing clones (marked with anti-Hth) in an optix2/3-dGFP eye disc. Most hth clones repress optix2/3 cell-autonomously (yellow arrowheads). A clone adjacent to the MF does not show this repression (white arrowhead). Merged and optix2/3-dGFP-only channels are shown. (D) Clones simultaneously expressing ey-RNAi and toy-RNAi (marked in green, yellow arrowheads). In these clones Hth expression is upregulated. Merged and Hth-only channels are shown; a white line delineates two confocal planes obtained from the same imaginal disc. Nuclei in (C) and (D) are counterstained with DAPI.
Samples were co-stained with pairs or triads of these genes (see Materials and Methods) and gene expression profiles relative to the MF, which is given a position x = 0, were quantified. The regulatory links may be inferred by analyzing the degree of correlation (or anti-correlation) between different nodes in the network, so that direct interactions show the highest degree of correlation (in the case of activating links) or anticorrelation (in case of inhibitory links) (Dunlop et al., 2008). As the distance in the connection graph increases, the signal (correlation/anticorrelation) blurs. For each correlation, we obtained three metrics: mean, weighted local correlation and Fano factor [variance (σ2)/mean], this latter a measure of expression variability or “noise” (Figure 3A). Noise may be particularly informative, as increasing noise is associated with fast expression changes (Munsky et al., 2012). In Figure 3A we represent all the spatial expression profiles and the noise profiles for each gene.
We first analyzed the correlation between the TFs Hth and Ey, which display high levels of expression during the progenitor (i.e., initial) state of the GRN. Both profiles keep a high correlation throughout the anterior region that drops slowly as cells approach the MF. This may point to a direct relation between the two TFs or their combined upregulation by a third gene that is directly linked to both Hth and Ey (Figure 3B). In fact, the Tsh/Tio paralogues have been shown to regulate Hth (Bessa et al., 2002; Singh et al., 2002), and Ey, Hth, and Tsh might form a protein complex (Bessa et al., 2002; Datta et al., 2011). Therefore, this profile is compatible with a mutual interdependence between Ey, Hth and some other regulator, likely Tsh/Tio.
We next checked the correlation between Ey and the activity of the optix enhancer, optix2/3-dGFP, which is a direct Ey's target (Ostrin et al., 2006). The destabilized GFP reporter (“dGFP”) allows following the dynamics of GFP expression avoiding GFP perdurance. As expected, Ey and optix-dGFP profiles show peaks of positive correlation when both appear in the most anterior part of the disc and when they are shut down at the MF. This latter simultaneous loss of Ey and optix2/3 at the MF is consistent with Ey being a direct, linear optix activator -so that loss of Ey is closely followed by a loss of optix2/3 expression. The onset of optix2/3 expression is also positively correlated with Ey, with a peak of noise marking exactly the anterior correlation peak. However, optix activation is delayed relative to Ey. This delay is compatible with the need for a coactivator or the removal of a repressor. The anterior limit of Optix expression is almost mutually exclusive with Hth, which might point to Hth acting as the anterior repressor of optix. In order to test this hypothesis, we generated random clones of cells expressing Hth in an optix2/3-dGFP background. Indeed, Hth-expressing clones do repress optix2/3 activity in a cell autonomous manner (Figure 3C), in agreement with a repressor role for Hth. We note, though, that this repression ability is lost at the posterior border of optix2/3-dGFP expression, which coincides with the MF. Therefore, it is possible that signals from the MF, directly or through the regulation of gene intermediaries, prevent Hth from repressing this enhancer close to the MF.
A third interaction that we analyzed in detail was that between Hth and Eya. It has been described that Hth and Eya repress each other (Bessa et al., 2002). This is reflected in the complementary pattern of their expression profiles (Figure 3A). In addition, the two profiles show a strong anti-correlation, which suggests that the mutual repression is likely direct. This interaction seems critical in the GRN, as progenitors are maintained in their proliferative undifferentiated state as long as Hth expression is ON. Therefore, the transition to a precursor state requires the simultaneous loss of Hth and the upregulation of Eya. Eya, which lacks a DNA-binding domain, acts as co-transcriptional activator of So/Six2 (Pignoni et al., 1997; Ohto et al., 1999; Jemc and Rebay, 2007), itself a Pax6 target (Halder et al., 1998; Punzo et al., 2002). The Eya:So transcriptional complex then activates the transcription of their two genes, thereby establishing a positive feedback that maintains their expression and the precursor state. One of the targets of Eya:So is dac (Chen et al., 1997, 1999). When all profiles are plotted together (Figure 4A), the onset of Dac expression follows that of Eya with a short delay, in agreement with it being an Eya:So target. Interestingly, the activation phase of Dac is associated to two noise peaks, instead of one (Figure 4B). This might be indicative of two regulatory inputs separated in space acting as Dac activators. These two noise peaks coincide with the Ey and Eya expression maxima (Figures 4A,B). Recent work on the regulatory sequences of Dac and its upstream regulators has discovered two Dac enhancers, 5′EE and 3′EE. The 5′EE is regulated by Ey, with a contribution of Eya:So, while the 3′EE is activated by Eya:So and the Dpp signal produced by the MF (Pappu et al., 2005). Therefore, Dac regulation receives Ey input first and, only when Eya:So have been upregulated, also that of Eya:So. These two inputs, which are separate in time, might be responsible for the two noise peaks that we detect. However, the fact that Dac follows with a short delay the activation in Eya expression suggests that this regulatory architecture induces Dac expression only when both Ey and Eya:So are expressed (Pappu et al., 2005).
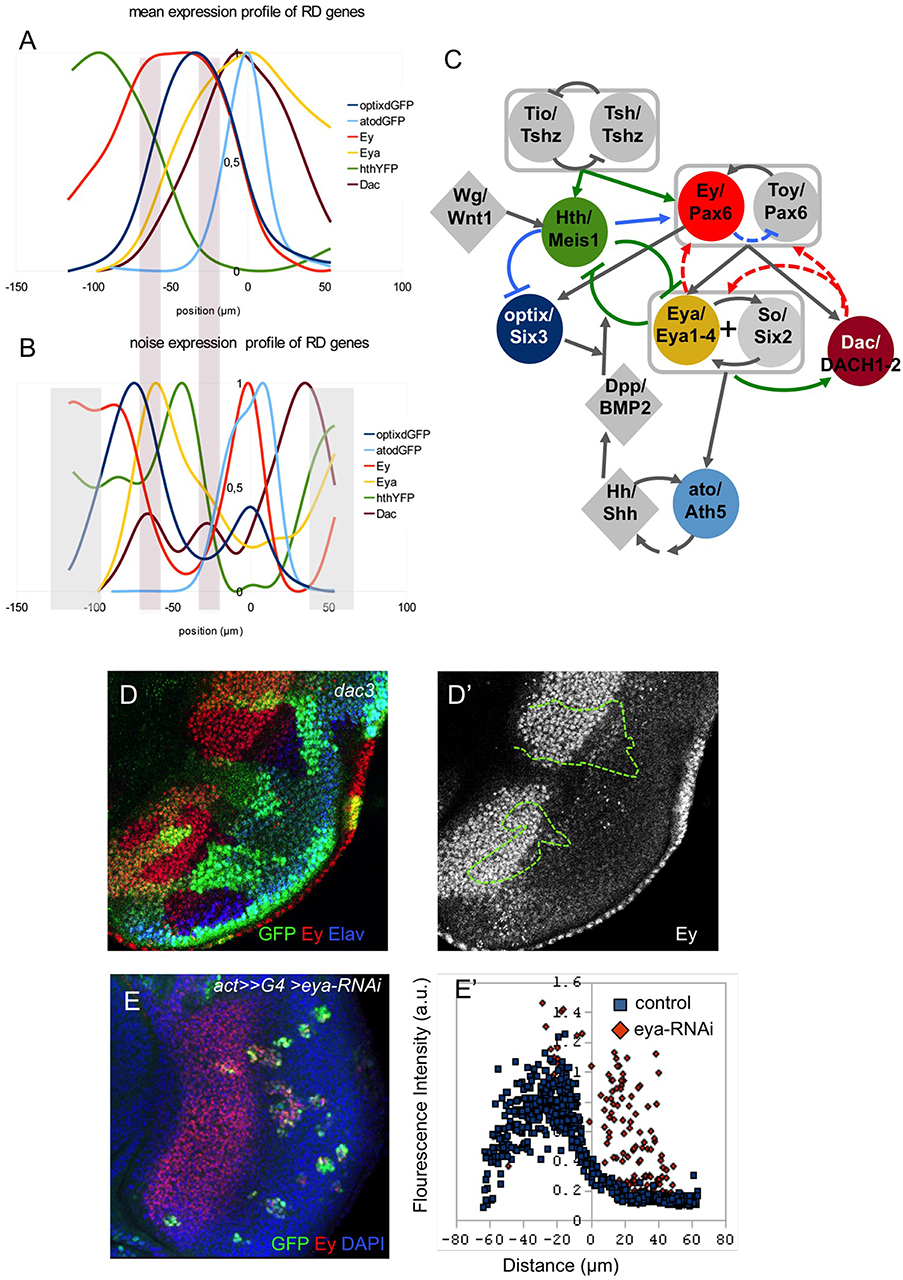
Figure 4. The RDGN gene expression profiles. Normalized gene expression (A) and noise (Fano factor; B) profiles relative to the MF (x = 0). The two bars spanning A and B mark the two “noise” peaks for the dac gene. (C) Revised schematic RDGN. Genes are named as “Drosophila gene name/vertebrate gene homolog.” Colored nodes are genes studied in this work. Boxes group genes with partly redundant functions (tsh/tio; ey/toy) or working jointly (eya/so). Green links are regulatory relationships supported by our study. Blue links are suggested relationships, including a potential negative regulation from ey to toy ensuring constant levels of Pax6 function. Red links are not supported (see D,E), at least, for eye development during the third larval stage. (D) Disc containing dac3-mutant clones (marked by the absence of GFP, and outlined in D'), stained for Ey and Elav (to mark the differentiating retina). The expression of Ey within the dac-mutant tissue is indistinguishable from its expression in the surrounding control tissue (D′). (E) Clones attenuating eya function (with an eya-RNAi), marked in green. The disc is stained for GFP (eya-RNAi), Ey and nuclei (DAPI). Quantitative analysis of Ey expression with single cell resolution (E′) shows that Ey expression is derepressed in eya-RNAi cells.
The endpoint of the RDGN is the activation of the proneural gene atonal (ato). Here we have monitored the transcriptional activity of the ato3′ enhancer, which is responsible for the initiation phase of ato expression (Zhang et al., 2006a; Tanaka-Matakatsu and Du, 2008). Ey and Eya:So have been shown to be direct regulators of this enhancer (Zhang et al., 2006a; Zhou et al., 2014), similar to what has been described for Dac. However, the expression of ato3′-dGFP raises just anterior to the MF (Figures 2A–C, 4A). Hh, produced by the differentiating photoreceptors posterior to the furrow has been proposed as an ato activator (Dominguez, 1999; Heberlein and Treisman, 2000). Therefore, initiation of ato expression just anterior to the MF would result from the short range action of Hh, produced by cells just behind the MF, on Ey and Eya:So-expressing precursors.
Integrated with previous RDGN models (Silver and Rebay, 2005; Kumar, 2009; Amore and Casares, 2010; Casares and Almudi, 2016), these analyses result in a consensus Drosophila RDGN, shown in Figure 4C, comprising its major players. The GRN model includes activator feedback links from Dac to Eya:So and Ey/Toy, and from Eya:So to Ey/Toy. Experimental evidence for these links derives from ectopic gene expression. A suggested role for these positive feedbacks is to lock-in, once activated, a precursor state characterized by coexpression of Pax6, Eya, So, and Dac (Desplan, 1997). Our analysis of gene expression profiles does not allow us to clearly support or reject any such feedbacks, so we decided to test them experimentally. If there were a positive feedback between Dac and Ey, we would expect to lose Ey expression in Dac-mutant clones. However, this is not the case. In dac-null (dac3) clones, Ey expression remains unchanged relative to the expression of control tissue surrounding the clones (Figures 4D, D'). This result contrasts with those obtained by Atkins et al. (2013), showing that in dac-mutant clones Ey expression is derepressed. Our interpretation of their results is that dac-clones cause a delay in MF movement (Mardon et al., 1994; Bras-Pereira et al., 2016) and this results in a delay in the turning off of Ey, rather than a true derepression. To test if the feedback operates upstream of Dac, we generated clones expressing an Eya-specific RNAi and analyzed Ey levels, quantitatively, in individual nuclei. In eya-RNAi clones, labeled with GFP, Ey levels remained comparable to control ones, even where Ey expression should have been lost (i.e., behind the MF) (Figure 4E). In fact, some eya-RNAi cells within the normal region of Ey/Eya co-expression express higher than normal Ey levels (Figure 4E'). These results confirm those obtained by the Mardon group (Atkins et al., 2013). Therefore, our results seem to indicate that during the development of the eye, positive feedbacks from Dac and Eya:So to Ey (and presumably Toy) are not necessary to maintain Ey levels.
A Core RDGN Integrates a Feed-Forward Loop and a Toggle Switch
The RDGN might have specific regulatory properties that would be functionally relevant beyond the biochemical properties of its individual TFs. To investigate what these properties might be, we focused on some central and well-established links to identify network motifs and study their dynamic properties. This “core” network is shown in Figure 5. In it, Ey and Toy are considered a single transcriptional function (“Pax6”), as these two genes have been shown to be partly redundant (Zhou et al., 2014; Lopes and Casares, 2015; Zhu et al., 2017). The Eya-So mutual positive feedback loop is represented by a single autoregulatory node (“Eya/So”). The output of the core network is a generalized target (“T”), as it seems that the regulatory logic that controls molecularly characterized enhancers of these targets, such as ato (Zhou et al., 2014), dac (Pappu et al., 2005) and string [stg; (Lopes and Casares, 2015)] is similar, being activated by both Ey and Eya:So. The mutual Hth/Eya:So repression is well established (Bessa et al., 2002; Lopes and Casares, 2010) and reinforced by the analysis presented here. In addition, it has been reported recently that Hth might also contribute to the repression of dac and stg (Bras-Pereira et al., 2015; Lopes and Casares, 2015), and that Hth hinders Ey's capacity to activate stg (Lopes and Casares, 2015). This activity was represented as an indirect repressive link from Hth onto the activation of the target (“T”) by Pax6 (“P”). Next, we modeled this GRN, including a source of Dpp, the major signal produced at the MF as differentiation proceeds (Figure 5A).
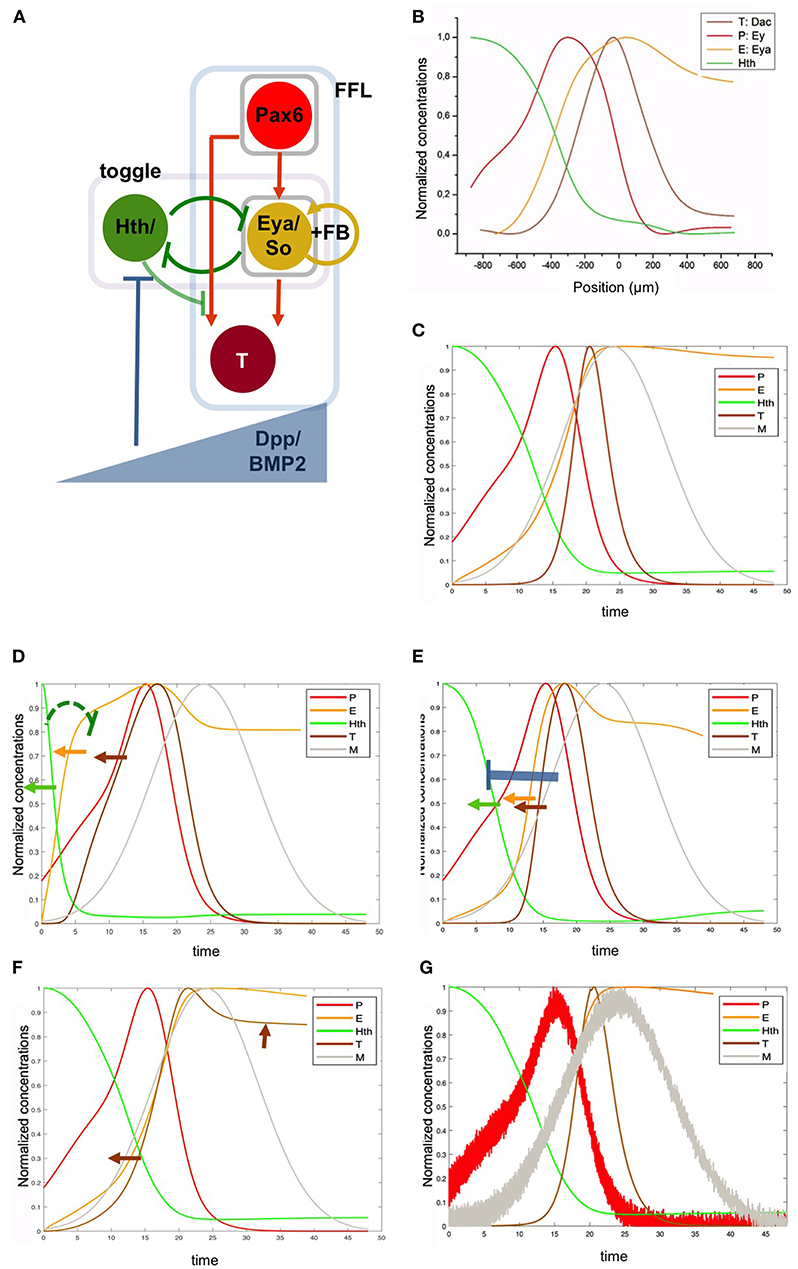
Figure 5. A gene regulatory network with intertwined feed-forward loop and toggle-switch motifs recapitulates the RDGN expression profiles. (A) The basic RDGN. The function of ey and toy has been grouped as “Pax6.” The mutual activating loop between Eya and So has been simplified as a positive feedback autoregulatory loop (“FB”). Coherent feedforward loop motif (FFL) and toggle-switch motif (“toggle”) have been boxed. A potential repression from Hth to targets has been included (as light negative link), but is not required to retrieve the experimental pattern. “T” represents a generalized target gene, such as dac, stg, or ato. A gradient of Dpp, produced by the differentiation wavefront, animates the network. (B) Normalized experimental expression profiles. (C) Gene network model-generated expression profiles. Note that while the x axis in (B) is distance, x has time units in (C). This is because, as the differentiation speed is constant, the gene expression pattern observed in the disc is equivalent to the gene expression changes that a cell experiences as time passes (i.e., as the differentiation wave gets closer to the cell). This means that earlier times are equivalent to more anterior positions in the primordium. (D) Weakening the H to E repression within the toggle-switch (KHE from 0.1 to 0.9; indicated by the green repressive link) leads to a faster increase in E levels and, to a lesser extent, of T (orange and brown arrows, respectively). This results in the anterior shift of H. (E) More intense repression from M on H (KMH de 0.9 to 0.1; blue repressor link) also results in anterior shifts (arrows) of H (green) and E (orange) and T (brown). (F) Changing the regulatory integration logic in the FFL from “AND” to “OR” results in the premature expression of T. However, this expression does not extend to follow P, as a negative link from H to P prevents this further expansion. (G) Introducing noise in the Pax6 and Dpp profiles has minor effects on the expression profiles of the other nodes, including T (compare to C). See main text for details.
Ey (“P”), Eya:So (“E”) and T are organized as a feed-forward loop (FFL) with Ey and Eya inputs having the same sign (in this case positive), making it a “coherent” FFL [cFFL (Alon, 2007)]. The integration logic of both inputs seems to be “AND.” For example, the delayed expression of dac relative to Ey suggests that although targets typically require Ey, they only become expressed after Eya:So are also expressed (Mangan et al., 2003). This cFFL loop has an addition: the autorregulation of E (Eya:So).
The GRN integrates another network motif: Hth (“H”) and Eya:So (“E”) repress each other. This regulatory structure is a “toggle switch,” a motif that allows the selection of either of two, mutually exclusive, states. In this case H:ON/ E:OFF or H:OFF/ E:ON, that correspond to proliferative progenitors or cell cycle quiescent precursors, respectively.
Finally, the eye primordium is polarized by the action of the moving MF, that produces Dpp, a BMP2 type morphogen (“M”) (Gelbart, 1989). Dpp represses Hth at long distance (Bessa et al., 2002) and contributes to the repression of Ey at shorter range, just abutting the MF (Firth and Baker, 2009). The full model, including the intertwined toggle switch and the cFFL with a positive feedback (see Materials and Methods) recapitulates very well the measured experimental profiles (Figures 5B,C), indicating that, although not including all the TFs of the full RDGN, this core network captures the main regulatory processes occurring during normal eye specification. We tested specifically the role that the model predicts for the toggle switch between Hth (“H”) and Eya/So (“E”) by weakening the repression of H on E (K_HE from 0.1 to 0.9). In this case, E levels rise prematurely. This causes a reduction in the H domain (as E is a H repressor), a broadening of the E domain and an anterior shift of the target T, although less prominent (as T expression depends on the joint contribution of E AND P) (Figure 5D). Since the proliferative progenitor pool requires H for its maintenance, a weaker H-to-E link should result in a premature exhaustion of this pool and, as a consequence, in a smaller eye. Similarly, an increase in the intensity of repression of H by M also leads to a retraction of the H domain (Figure 5E) and would result similarly in the reduction of the progenitor pool. Therefore, the regulatory links in the toggle-switch (including the action of Dpp signaling, that acts as a modulator of this motif) may have an impact on the final eye's size. When we change the logic operator within the FFL from “AND” to “OR” we observe that the delay in T expression relative to E disappears (Figure 5F). However, T expression does not follow P as would be expected from a cFFL (in which P alone should be able to activate T even without E). This is because the model introduced a negative input from H to P, as shown for some Pax6 targets in the eye (see, for example, Lopes and Casares, 2015).
Discussion
In this work, through a combination of quantitative single-cell imaging, correlation analysis, genetics and modeling, we have shown that a toggle-switch motif regulates the transition from progenitor to precursor cells. Hth exerts a general negative regulatory action on the establishment of the precursor state by regulating not only the expression of Eya, but also that of the Six3 TF Optix. The transition from progenitors to precursors is facilitated by Dpp. As Dpp is induced by differentiating photoreceptors through their production of Hh, ultimately it is the differentiating retina that controls this progenitor-to-precursor transition. As increasing the size of the eye requires the expansion of the progenitor pool, the Dpp-Hth link is key. Indeed, increasing the production of Dpp, itself an “eye-promoting” signal, is predicted to result in a smaller eye, as the progenitor cell pool would be prematurely exhausted. This control may be more complex than anticipated, as optix, itself controlled by Hth, also regulates Dpp production and signaling (Li et al., 2013). As hth is repressed, a coherent feed-forward loop, accelerated by Eya/So mutual positive regulation, ensures a robust establishment of the precursor state and the onset of ato expression, the last step before the initiation of retinal differentiation.
The analysis of the network shows how Hth delays the engagement of the cFFL, through its participation in the toggle-switch. Here, a major role is played by Dpp which, acting as a repressor of Hth, tips the switch favoring Eya/So expression. The delay imposed by Hth seems especially important. As Hth maintains the Ey-expressing cells as progenitors (Pichaud and Casares, 2000; Bessa et al., 2002; Neto et al., 2017), the longer the delay in entering the FFL state, the larger the expansion of the progenitor pool, thereby having a potential impact on final eye size. The repressor link from Hth to T does not seem critical, as removing it just shortens the delay in T induction (not shown). In addition, our expression correlation analysis and genetic experiments further include Optix among the “pro-eye” transcription factors repressed by Hth. This repression may vary in intensity, as the region of overlap with Hth is larger for Optix than for Eya (and minimal for Dac). This fact reinforces the notion that Hth delays the full acquisition of a retinal precursor state. The fact that Optix has been recently shown to be necessary for Dpp signaling (Li et al., 2013) and that Dpp signaling contributes to Hth repression draws another feedback (Hth-Optix-Dpp-Hth) that requires further investigation. Finally, we noted that the establishment of the precursor cell state by the Pax6 genes should result in the repression of Hth. Indeed, the simultaneous attenuation of ey and toy through the combined expression of ey-RNAi and toy-RNAi in clones results in the maintenance of Hth (Figure 3D).
The coherent FFL imposes a delay in the activation of target genes downstream of Pax6 and Eya/So that ensures that these targets are activated only when the precursor cell state, characterized by the coexpression of Pax6 and Eya:So, has been established. The further addition of the “E” positive feedback loop on top of the FFL accelerates Eya and So expression and makes it independent of Ey, something that may allow the maintenance of this gene pair behind the MF, once the expression of Ey and Toy has been turned off. This is important in order to stay in the state H:OFF/ E:ON. In addition, the FFL may act as a noise filter (Gui et al., 2016). This noise may derive, for example, from fluctuations in biochemical rates or from genetic variation that could affect the regulatory constants that are included in our model. To test whether the network is stable with respect to noise, we carried out some computational experiments in which a random component was included in the network as white Gaussian noise, g(σ), on P [g(σ)·P], M [g(σ)·M] or both signals. This implies that E, H, and T become stochastic variables. The standard deviation (σ) was varied from low (5%) to high (20%) amplitudes with respect to the original value of P or M. We computed a sufficiently large number of simulations and, even with the highest noise, which would be considered greater than biological noise, added to both P and M, the behavior of the system is qualitatively similar to the case without noise, with a noise reduction of 91.5% (Figure 5G). This shows that the core network is capable of filtering noise efficiently. This is particularly interesting, because the network can absorb variations in two major inputs in the system: Ey/Toy (“P”), that initiates the FFL, and Dpp (“M”), which regulates the toggle-switch's output. One implication of this property is that the early RDGN can absorb the effects that might be caused by genetic variation affecting many of its parameter rates. This noise buffering property of the gene networks controlling early organ development has been observed experimentally analyzing the endomesoderm GRN in the sea urchin (Garfield et al., 2013). Thus, early organogenetic GRNs would be very robust, allowing the maintenance of genetic variation affecting these early stages, while morphological variation would rest more on terminal differentiation branches of the network (Garfield et al., 2013).
Data Availability
The datasets generated for this study are available on request to the corresponding author.
Ethics Statement
The study involved wild type and transgenic Drosophila melanogaster strains. The study did not entail ethical considerations.
Author Contributions
FC: Conceptualization. MS-A, JC-G, and MCL: Formal analysis. MS-A, CML, CSL, and CB-P: Investigation. MS-A: Software. MS-A, JC-G, CML, CSL, and CB-P: Visualization. FC: Writing–original draft. FC, MCL, MS-A, JC-G, CML, CSL, and CB-P: Writing–review and final version. FC and MCL: Supervision. FC: Funding acquisition.
Funding
This work was funded by MINECO and the Agencia Estatal de Investigacion (AEI) of Spain, co-financed by FEDER funds (EU) through grants BFU2012-34324 and BFU2015-66040-P to FC, MDM-2016-0687 in which FC is participant researcher, and TIN2017-89842 P in which MCL is participant researcher.
Conflict of Interest Statement
The authors declare that the research was conducted in the absence of any commercial or financial relationships that could be construed as a potential conflict of interest.
Acknowledgments
We thank ALMI (Avanced Light Imaging and Analysis Platform, CABD) for imaging support. CML would like to thank Prof. Dr. Isabel Correas (Universidad Autónoma de Madrid, Spain) for her constant support and generosity.
Supplementary Material
The Supplementary Material for this article can be found online at: https://www.frontiersin.org/articles/10.3389/fevo.2019.00221/full#supplementary-material
References
Alon, U. (2007). Network motifs: theory and experimental approaches. Nat. Rev. Genet. 8, 450–461. doi: 10.1038/nrg2102
Amore, G., and Casares, F. (2010). Size matters: the contribution of cell proliferation to the progression of the specification Drosophila eye gene regulatory network. Dev. Biol. 344, 569–577. doi: 10.1016/j.ydbio.2010.06.015
Atkins, M., Jiang, Y., Sansores-Garcia, L., Jusiak, B., Halder, G., and Mardon, G. (2013). Dynamic rewiring of the Drosophila retinal determination network switches its function from selector to differentiation. PLoS Genet. 9:e1003731. doi: 10.1371/journal.pgen.1003731
Baker, L. R., Weasner, B. M., Nagel, A., Neuman, S. D., Bashirullah, A., and Kumar, J. P. (2018). Eyeless/Pax6 initiates eye formation non-autonomously from the peripodial epithelium. Development 145. doi: 10.1242/dev.163329
Basler, K., and Hafen, E. (1989). Dynamics of Drosophila eye development and temporal requirements of sevenless expression. Development 107, 723–731.
Bessa, J., Carmona, L., and Casares, F. (2009). Zinc-finger paralogues tsh and tio are functionally equivalent during imaginal development in Drosophila and maintain their expression levels through auto- and cross-negative feedback loops. Dev. Dyn. 238, 19–28. doi: 10.1002/dvdy.21808
Bessa, J., Gebelein, B., Pichaud, F., Casares, F., and Mann, R. S. (2002). Combinatorial control of Drosophila eye development by eyeless, homothorax, and teashirt. Genes Dev. 16, 2415–2427. doi: 10.1101/gad.1009002
Bessarab, D. A., Chong, S. W., and Korzh, V. (2004). Expression of zebrafish six1 during sensory organ development and myogenesis. Dev. Dyn. 230, 781–786. doi: 10.1002/dvdy.20093
Bischof, J., Maeda, R. K., Hediger, M., Karch, F., and Basler, K. (2007). An optimized transgenesis system for Drosophila using germ-line-specific phiC31 integrases. Proc. Natl. Acad. Sci. U.S.A. 104, 3312–3317. doi: 10.1073/pnas.0611511104
Bras-Pereira, C., Casares, F., and Janody, F. (2015). The retinal determination gene Dachshund restricts cell proliferation by limiting the activity of the Homothorax-Yorkie complex. Development 142, 1470–1479. doi: 10.1242/dev.113340
Bras-Pereira, C., Potier, D., Jacobs, J., Aerts, S., Casares, F., and Janody, F. (2016). dachshund potentiates hedgehog signaling during Drosophila retinogenesis. PLoS Genet. 12:e1006204. doi: 10.1371/journal.pgen.1006204
Bumsted-O'Brien, K. M., Hendrickson, A., Haverkamp, S., Ashery-Padan, R., and Schulte, D. (2007). Expression of the homeodomain transcription factor Meis2 in the embryonic and postnatal retina. J. Comp. Neurol. 505, 58–72. doi: 10.1002/cne.21458
Campos-Ortega, J. A., and Hofbauer, A. (1977). Cell clones and pattern formation: on the lineage of photoreceptor cells in the compound eye of Drosophila. Wilehm Roux Arch. Dev. Biol. 181, 227–245. doi: 10.1007/BF00848423
Casares, F., and Almudi, I. (2016). “Fast and Furious 800. The retinal determination gene network in drosophila,” in Organogenetic Gene Networks, eds J. Castelli-Gair Hombría and P. Bovolenta (Cham: Springer), 95–124. doi: 10.1007/978-3-319-42767-6_4
Casares, F., and Mann, R. S. (1998). Control of antennal versus leg development in Drosophila. Nature 392, 723–726. doi: 10.1038/33706
Casares, F., and Mann, R. S. (2000). A dual role for homothorax in inhibiting wing blade development and specifying proximal wing identities in Drosophila. Development 127, 1499–1508. Available online at: http://dev.biologists.org/content/127/7/1499.long
Chen, R., Amoui, M., Zhang, Z., and Mardon, G. (1997). Dachshund and eyes absent proteins form a complex and function synergistically to induce ectopic eye development in Drosophila. Cell 91, 893–903. doi: 10.1016/S0092-8674(00)80481-X
Chen, R., Halder, G., Zhang, Z., and Mardon, G. (1999). Signaling by the TGF-beta homolog decapentaplegic functions reiteratively within the network of genes controlling retinal cell fate determination in Drosophila. Development 126, 935–943.
Choo, S. W., Beh, C. Y., Russell, S., and White, R. (2014). Characterisation of Drosophila Ubx CPTI000601 and hth CPTI000378 protein trap lines. ScientificWorldJournal 2014:191535. doi: 10.1155/2014/191535
Czerny, T., Halder, G., Kloter, U., Souabni, A., Gehring, W. J., and Busslinger, M. (1999). twin of eyeless, a second Pax-6 gene of Drosophila, acts upstream of eyeless in the control of eye development. Mol. Cell 3, 297–307. doi: 10.1016/S1097-2765(00)80457-8
Datta, R. R., Lurye, J. M., and Kumar, J. P. (2009). Restriction of ectopic eye formation by Drosophila teashirt and tiptop to the developing antenna. Dev. Dyn. 238, 2202–2210. doi: 10.1002/dvdy.21927
Datta, R. R., Weasner, B. P., and Kumar, J. P. (2011). A dissection of the teashirt and tiptop genes reveals a novel mechanism for regulating transcription factor activity. Dev. Biol. 360, 391–402. doi: 10.1016/j.ydbio.2011.09.030
Desplan, C. (1997). Eye development: governed by a dictator or a junta? Cell 91, 861–864. doi: 10.1016/S0092-8674(00)80475-4
Dominguez, M. (1999). Dual role for Hedgehog in the regulation of the proneural gene atonal during ommatidia development. Development 126, 2345–2353.
Dunlop, M. J., Cox, R. S. 3rd, Levine, J. H., Murray, R. M., and Elowitz, M. B. (2008). Regulatory activity revealed by dynamic correlations in gene expression noise. Nat. Genet. 40, 1493–1498. doi: 10.1038/ng.281
Erickson, T., French, C. R., and Waskiewicz, A. J. (2010). Meis1 specifies positional information in the retina and tectum to organize the zebrafish visual system. Neural. Dev. 5:22. doi: 10.1186/1749-8104-5-22
Firth, L. C., and Baker, N. E. (2009). Retinal determination genes as targets and possible effectors of extracellular signals. Dev. Biol. 327, 366–375. doi: 10.1016/j.ydbio.2008.12.021
Garfield, D. A., Runcie, D. E., Babbitt, C. C., Haygood, R., Nielsen, W. J., and Wray, G. A. (2013). The impact of gene expression variation on the robustness and evolvability of a developmental gene regulatory network. PLoS Biol. 11:e1001696. doi: 10.1371/journal.pbio.1001696
Gelbart, W. M. (1989). The decapentaplegic gene: a TGF-beta homologue controlling pattern formation in Drosophila. Development 107 (Suppl), 65–74.
Gui, R., Liu, Q., Yao, Y., Deng, H., Ma, C., Jia, Y., et al. (2016). Noise decomposition principle in a coherent feed-forward transcriptional regulatory loop. Front. Physiol. 7:600. doi: 10.3389/fphys.2016.00600
Halder, G., Callaerts, P., Flister, S., Walldorf, U., Kloter, U., and Gehring, W. J. (1998). Eyeless initiates the expression of both sine oculis and eyes absent during Drosophila compound eye development. Development 125, 2181–2191.
Halder, G., Callaerts, P., and Gehring, W. J. (1995). Induction of ectopic eyes by targeted expression of the eyeless gene in Drosophila. Science 267, 1788–1792. doi: 10.1126/science.7892602
Heberlein, U., and Treisman, J. E. (2000). Early retinal development in Drosophila. Results Probl. Cell. Differ. 31, 37–50. doi: 10.1007/978-3-540-46826-4_3
Ikeda, K., Watanabe, Y., Ohto, H., and Kawakami, K. (2002). Molecular interaction and synergistic activation of a promoter by Six, Eya, and Dach proteins mediated through CREB binding protein. Mol. Cell Biol. 22, 6759–6766. doi: 10.1128/MCB.22.19.6759-6766.2002
Jaeger, J., Manu and Reinitz, J. (2012). Drosophila blastoderm patterning. Curr. Opin. Genet. Dev. 22, 533–541. doi: 10.1016/j.gde.2012.10.005
Jemc, J., and Rebay, I. (2007). The eyes absent family of phosphotyrosine phosphatases: properties and roles in developmental regulation of transcription. Annu. Rev. Biochem. 76, 513–538. doi: 10.1146/annurev.biochem.76.052705.164916
Kaiser, R., Posteguillo, E. G., Muller, D., and Just, W. (2007). Exclusion of genes from the EYA-DACH-SIX-PAX pathway as candidates for Branchio-Oculo-Facial syndrome (BOFS). Am. J. Med. Genet. A 143A, 2185–2188. doi: 10.1002/ajmg.a.31875
Kenyon, K. L., Yang-Zhou, D., Cai, C. Q., Tran, S., Clouser, C., Decene, G., et al. (2005). Partner specificity is essential for proper function of the SIX-type homeodomain proteins Sine oculis and Optix during fly eye development. Dev. Biol. 286, 158–168. doi: 10.1016/j.ydbio.2005.07.017
Kumar, J. P. (2009). The molecular circuitry governing retinal determination. Biochim. Biophys. Acta. 1789, 306–314 doi: 10.1016/j.bbagrm.2008.10.001
Levine, M., and Davidson, E. H. (2005). Gene regulatory networks for development. Proc. Natl. Acad. Sci. U.S.A. 102, 4936–4942. doi: 10.1073/pnas.0408031102
Li, Y., Jiang, Y., Chen, Y., Karandikar, U., Hoffman, K., Chattopadhyay, A., et al. (2013). optix functions as a link between the retinal determination network and the dpp pathway to control morphogenetic furrow progression in Drosophila. Dev. Biol. 381, 50–61. doi: 10.1016/j.ydbio.2013.06.015
Lopes, C. S., and Casares, F. (2010). hth maintains the pool of eye progenitors and its downregulation by Dpp and Hh couples retinal fate acquisition with cell cycle exit. Dev. Biol. 339, 78–88. doi: 10.1016/j.ydbio.2009.12.020
Lopes, C. S., and Casares, F. (2015). Eye selector logic for a coordinated cell cycle exit. PLoS Genet. 11:e1004981. doi: 10.1371/journal.pgen.1004981
Mangan, S., and Alon, U. (2003). Structure and function of the feed-forward loop network motif. Proc. Natl. Acad. Sci. U.S.A. 100, 11980–11985. doi: 10.1073/pnas.2133841100
Mangan, S., Zaslaver, A., and Alon, U. (2003). The coherent feedforward loop serves as a sign-sensitive delay element in transcription networks. J. Mol. Biol. 334, 197–204. doi: 10.1016/j.jmb.2003.09.049
Mardon, G., Solomon, N. M., and Rubin, G. M. (1994). Dachshund encodes a nuclear protein required for normal eye and leg development in Drosophila. Development 120, 3473–3486.
Munsky, B., Neuert, G., and van Oudenaarden, A. (2012). Using gene expression noise to understand gene regulation. Science 336, 183–187. doi: 10.1126/science.1216379
Naval-Sanchez, M., Potier, D., Haagen, L., Sanchez, M., Munck, S., Van de Sande, B., et al. (2013). Comparative motif discovery combined with comparative transcriptomics yields accurate targetome and enhancer predictions. Genome Res. 23, 74–88. doi: 10.1101/gr.140426.112
Neto, M., Aguilar-Hidalgo, D., and Casares, F. (2016). Increased avidity for Dpp/BMP2 maintains the proliferation of progenitors-like cells in the Drosophila eye. Dev. Biol. 418, 98–107. doi: 10.1016/j.ydbio.2016.08.004
Neto, M., Naval-Sanchez, M., Potier, D., Pereira, P. S., Geerts, D., Aerts, S., et al. (2017). Nuclear receptors connect progenitor transcription factors to cell cycle control. Sci. Rep. 7:4845. doi: 10.1038/s41598-017-04936-7
Ohto, H., Kamada, S., Tago, K., Tominaga, S. I., Ozaki, H., Sato, S., et al. (1999). Cooperation of six and eya in activation of their target genes through nuclear translocation of Eya. Mol. Cell Biol. 19, 6815–6824. doi: 10.1128/MCB.19.10.6815
Ostrin, E. J., Li, Y., Hoffman, K., Liu, J., Wang, K., Zhang, L., et al. (2006). Genome-wide identification of direct targets of the Drosophila retinal determination protein Eyeless. Genome Res. 16, 466–476. doi: 10.1101/gr.4673006
Pappu, K. S., Ostrin, E. J., Middlebrooks, B. W., Sili, B. T., Chen, R., Atkins, M. R., et al. (2005). Dual regulation and redundant function of two eye-specific enhancers of the Drosophila retinal determination gene dachshund. Development 132, 2895–2905. doi: 10.1242/dev.01869
Pichaud, F., and Casares, F. (2000). homothorax and iroquois-C genes are required for the establishment of territories within the developing eye disc. Mech. Dev. 96, 15–25. doi: 10.1016/S0925-4773(00)00372-5
Pignoni, F., Hu, B., Zavitz, K. H., Xiao, J., Garrity, P. A., and Zipursky, S. L. (1997). The eye-specification proteins So and Eya form a complex and regulate multiple steps in Drosophila eye development. Cell 91, 881–891. doi: 10.1016/S0092-8674(00)80480-8
Pineiro, C., Lopes, C. S., and Casares, F. (2014). A conserved transcriptional network regulates lamina development in the Drosophila visual system. Development 141, 2838–2847. doi: 10.1242/dev.108670
Punzo, C., Seimiya, M., Flister, S., Gehring, W. J., and Plaza, S. (2002). Differential interactions of eyeless and twin of eyeless with the sine oculis enhancer. Development 129, 625–634. Available online at: http://dev.biologists.org/content/129/3/625.long
Purcell, P., Oliver, G., Mardon, G., Donner, A. L., and Maas, R. L. (2005). Pax6-dependence of Six3, Eya1 and Dach1 expression during lens and nasal placode induction. Gene Expr. Patterns 6, 110–118. doi: 10.1016/j.modgep.2005.04.010
Royo, J. L., Maeso, I., Irimia, M., Gao, F., Peter, I. S., Lopes, C. S., et al. (2011). Transphyletic conservation of developmental regulatory state in animal evolution. Proc. Natl. Acad. Sci. U.S.A. 108, 14186–14191. doi: 10.1073/pnas.1109037108
Ryder, E., Spriggs, H., Drummond, E., St Johnston, D., and Russell, S. (2009). The Flannotator–a gene and protein expression annotation tool for Drosophila melanogaster. Bioinformatics 25, 548–549. doi: 10.1093/bioinformatics/btp012
Sanchez-Aragon, M., and Casares, F. (2019). A new image segmentation algorithm with applications in confocal microscopy analysis. BioRxiv. doi: 10.1101/524389
Silver, S. J., and Rebay, I. (2005). Signaling circuitries in development: insights from the retinal determination gene network. Development 132, 3–13. doi: 10.1242/dev.01539
Singh, A., Kango-Singh, M., and Sun, Y. H. (2002). Eye suppression, a novel function of teashirt, requires Wingless signaling. Development 129, 4271–4280. Available online at: http://dev.biologists.org/content/129/18/4271.long
Smith, S. J., Rebeiz, M., and Davidson, L. (2018). From pattern to process: studies at the interface of gene regulatory networks, morphogenesis, and evolution. Curr. Opin. Genet. Dev. 51, 103–110. doi: 10.1016/j.gde.2018.08.004
Spieler, D., Kaffe, M., Knauf, F., Bessa, J., Tena, J. J., Giesert, F., et al. (2014). Restless legs syndrome-associated intronic common variant in Meis1 alters enhancer function in the developing telencephalon. Genome Res. 24, 592–603. doi: 10.1101/gr.166751.113
Struhl, G., and Basler, K. (1993). Organizing activity of wingless protein in Drosophila. Cell 72, 527–540. doi: 10.1016/0092-8674(93)90072-X
Tanaka-Matakatsu, M., and Du, W. (2008). Direct control of the proneural gene atonal by retinal determination factors during Drosophila eye development. Dev. Biol. 313, 787–801. doi: 10.1016/j.ydbio.2007.11.017
Treisman, J. E. (2013). Retinal differentiation in drosophila. Wiley Interdisc. Rev. Dev. Boil. 2, 545–557. doi: 10.1002/wdev.100
Vollmer, J., Fried, P., Sanchez-Aragon, M., Lopes, C. S., Casares, F., and Iber, D. (2016). A quantitative analysis of growth control in the Drosophila eye disc. Development 143, 1482–1490. doi: 10.1242/dev.129775
Wartlick, O., Julicher, F., and Gonzalez-Gaitan, M. (2014). Growth control by a moving morphogen gradient during Drosophila eye development. Development 141, 1884–1893. doi: 10.1242/dev.105650
Weasner, B. M., Weasner, B., Deyoung, S. M., Michaels, S. D., and Kumar, J. P. (2009). Transcriptional activities of the Pax6 gene eyeless regulate tissue specificity of ectopic eye formation in Drosophila. Dev. Biol. 334, 492–502. doi: 10.1016/j.ydbio.2009.04.027
Wiersdorff, V., Lecuit, T., Cohen, S. M., and Mlodzik, M. (1996). Mad acts downstream of Dpp receptors, revealing a differential requirement for dpp signaling in initiation and propagation of morphogenesis in the Drosophila eye. Development 122, 2153–2162.
Xu, T., and Rubin, G. M. (1993). Analysis of genetic mosaics in developing and adult Drosophila tissues. Development 117, 1223–1237.
Zhang, T., Ranade, S., Cai, C. Q., Clouser, C., and Pignoni, F. (2006a). Direct control of neurogenesis by selector factors in the fly eye: regulation of atonal by Ey and So. Development 133, 4881–4889. doi: 10.1242/dev.02669
Zhang, X., Friedman, A., Heaney, S., Purcell, P., and Maas, R. L. (2002). Meis homeoproteins directly regulate Pax6 during vertebrate lens morphogenesis. Genes Dev. 16, 2097–2107. doi: 10.1101/gad.1007602
Zhang, X., Rowan, S., Yue, Y., Heaney, S., Pan, Y., Brendolan, A., et al. (2006b). Pax6 is regulated by Meis and Pbx homeoproteins during pancreatic development. Dev. Biol. 300, 748–757. doi: 10.1016/j.ydbio.2006.06.030
Zhou, Q., Zhang, T., Jemc, J. C., Chen, Y., Chen, R., Rebay, I., et al. (2014). Onset of atonal expression in Drosophila retinal progenitors involves redundant and synergistic contributions of Ey/Pax6 and So binding sites within two distant enhancers. Dev. Biol. 386, 152–164. doi: 10.1016/j.ydbio.2013.11.012
Keywords: eye development, Drosophila, gene regulatory networks, quantitative gene expression, modeling, cell specification, noise
Citation: Sánchez-Aragón M, Cantisán-Gómez J, Luque CM, Brás-Pereira C, Lopes CS, Lemos MC and Casares F (2019) A Toggle-Switch and a Feed-Forward Loop Engage in the Control of the Drosophila Retinal Determination Gene Network. Front. Ecol. Evol. 7:221. doi: 10.3389/fevo.2019.00221
Received: 28 March 2019; Accepted: 28 May 2019;
Published: 12 June 2019.
Edited by:
Alistair Peter McGregor, Oxford Brookes University, United KingdomReviewed by:
Sebastian Kittelmann, University of Oxford, United KingdomBerta Verd, University of Cambridge, United Kingdom
Copyright © 2019 Sánchez-Aragón, Cantisán-Gómez, Luque, Brás-Pereira, Lopes, Lemos and Casares. This is an open-access article distributed under the terms of the Creative Commons Attribution License (CC BY). The use, distribution or reproduction in other forums is permitted, provided the original author(s) and the copyright owner(s) are credited and that the original publication in this journal is cited, in accordance with accepted academic practice. No use, distribution or reproduction is permitted which does not comply with these terms.
*Correspondence: M. Carmen Lemos, bGVtb3NAdXMuZXM=; Fernando Casares, ZmNhc2ZlckB1cG8uZXM=
†These authors have contributed equally to this work
‡Present Address: Julia Cantisán-Gómez, Department of Physics, Universidad Rey Juan Carlos, Madrid, Spain
Carlos M. Luque, Department of Molecular Biology, CBM Severo Ochoa (CSIC-UAM), Universidad Autónoma de Madrid, Madrid, Spain
Catarina Brás-Pereira, Champalimaud Centre for the Unknown, Lisbon, Portugal
Carla S. Lopes, IBMC, Instituto de Biologia Molecular e Celular, i3S, Instituto de Investigação e Inovação em Saúde, Universidade do Porto, Porto, Portugal