 Alexandra M. Anderson
 Sjoerd Duijns
 Paul A. Smith2
 Christian Friis
 Erica Nol
- 1Environmental and Life Sciences Graduate Program, Trent University, Peterborough, ON, Canada
- 2National Wildlife Research Centre, Environment and Climate Change Canada, Ottawa, ON, Canada
- 3Canadian Wildlife Service, Environment and Climate Change Canada, Toronto, ON, Canada
- 4Department of Biology, Trent University, Peterborough, ON, Canada
Technological constraints have limited our ability to compare and determine the proximate and ultimate drivers of migratory behavior in small-bodied birds. Small VHF transmitters (<1.0 g) paired with automated radio telemetry allowed us to track the movements of six small shorebird species and test hypotheses about migratory behavior in species with different migration distances. We predicted that during southbound migration, species with longer migration distances (>9,000 km; pectoral sandpiper, Calidris melanotos, and white-rumped sandpiper, Calidris fuscicollis) would be more likely to migrate with characteristics of a time-minimizing migration strategy compared to species migrating intermediate distances (5,000–7,500 km; semipalmated sandpiper, Calidris pusilla; and lesser yellowlegs, Tringa flavipes) or shorter distances (~5,000 km; least sandpiper, Calidris minutilla; semipalmated plover, Charadrius semipalmatus), which would migrate with more characteristics of an energy-minimizing strategy. Our results indicate that migration and stopover behaviors for adults matched this prediction; longer distance migrants had longer stopover lengths, departed with higher relative fuel loads, flew with faster ground and airspeeds, and had a lower probability of stopover in North America after departing the subarctic. The predicted relationship between migration distance and migratory strategy was not as clear for juveniles. Despite our prediction that longer distance migrants would be less wind selective at departure and fly into headwinds en route, all species and age classes departed and migrated with supportive winds. Birds with higher estimated fuel loads at departure were less likely to stop in North America after departing the subarctic, indicating that some birds attempted non-stop flights from the subarctic to the Caribbean or South America. Additionally, within species, adults with higher relative fuel loads at departure had a higher detection probability after departing the subarctic, which we interpret as evidence of higher survival compared to juveniles. This study shows that migratory behavior of shorebirds has predictable patterns based on migration distance that are moderated by body condition of individuals, with potential implications for fitness.
Introduction
Many animals migrate to exploit spatial and temporal increases in prey abundance (Alerstam et al., 2003; Teitelbaum et al., 2015) while also reducing predation risk (Hebblewhite and Merrill, 2007; McKinnon et al., 2010). Despite the benefits of migration, mortality can be high during this life stage (Sillett and Holmes, 2002; Calvert et al., 2009; Piersma et al., 2016) because animals encounter variable environments, habitat limitation, inclement weather, and other risks (Klaassen et al., 2012) throughout their migratory range.
Migration distances vary across species, and this variation may influence migratory behaviors and strategies. Long-distance migrants must rely on local conditions, circannual clocks, and photoperiod to make migratory decisions (Gwinner, 1996) about far-away destinations. This may, in part, explain more consistent and less plastic timing of migration for long-distance migrants compared to short-distance migrants (Rubolini et al., 2007; Miller-Rushing et al., 2008). Long-distance migrants must balance high energetic demands of migration with predation risk and time constraints to complete farther migrations (Alerstam et al., 2003). Optimal migration theory provides clear predictions about migratory strategies for individuals under different energy, time, and predation constraints (Alerstam and Lindström, 1990; Hedenström and Alerstam, 1997; Alerstam, 2011), but the theory is less clear about how total migration distance influences migratory behavior and the currency individuals use to maximize fitness (i.e., time, energy, and predation). Few empirical studies have investigated the effects of migration distance on migratory behavior. A recent study found support for the hypothesis that long-distance migrants are more time-constrained than short-distance migrants because of farther travel distance (Nilsson et al., 2014).
Optimal bird migration theory predicts the consequences for stopover ecology of different migration strategies. The energy-minimization hypothesis predicts that migrants minimize the total energy cost of migration, whereas the time-minimization hypothesis predicts that animals migrate to reduce total migration time (which is more costly energetically). Time-minimizers are predicted to depart stopover sites with higher fuel loads despite the high energetic costs of carrying more weight (Pennycuick, 1969, 1975; Hedenström and Alerstam, 1997). To avoid delays, they may depart stopover sites with less wind assistance than energy minimizing migrants (Nilsson et al., 2014; McCabe et al., 2018). They also are predicted to be more goal oriented during migration and should have a higher propensity to fly into headwinds toward their destination (Alerstam, 1979; Liechti, 1995). Lastly, they should migrate at higher airspeeds (Hedenström and Alerstam, 1997; Nilsson et al., 2014) and make fewer stops en route compared to energy-minimizing migrants (Hedenström and Alerstam, 1997; Alerstam, 2011).
Larger relative fuel loads in the form of fat (Ramenofsky, 1990; McWilliams et al., 2004) can increase flight range and reduce the number of stops necessary en route (Hedenström and Alerstam, 1997). This is favorable for longer distance migrants, because it reduces energy and time costs associated with search and settling at each stopover site (Alerstam, 2011), such as rebuilding and subsequently catabolizing digestive tracts and other organs (Piersma and Lindström, 1997).
In this study, we use automated radio telemetry to compare southbound migration strategies of six shorebird species with variable migration distances (Table 1) from a key subarctic stopover site in North America. We examine the relationship between migration distance and stopover length, departure fuel loads, wind selectivity, ground speeds and airspeeds, and subsequent stopover probability and determine if these patterns match previously observed patterns of time-minimizing migration in longer-distance migrants (e.g., Nilsson et al., 2014). More specifically, we predict that species with longer migrations (white-rumped sandpiper, Calidris fuscicollis, and pectoral sandpiper, Calidris melanotos; ~9,000–11,000 km from the subarctic) will exhibit migratory behaviors more consistent with a time-minimizing migration strategy (i.e., higher fuel loads at departure, less wind selectivity and tailwind support en route, faster ground speeds and airspeeds, and lower probability of subsequent stopover after departing the subarctic). By comparison, we predict that species with intermediate migration distances (semipalmated sandpiper, Calidris pusilla and lesser yellowlegs, Tringa flavipes; ~5,000–7,500 km from the subarctic) or shorter migration distances (least sandpiper, Calidris minutilla and semipalmated plover, Charadrius semipalmatus; ~5,000 km from the subarctic) will show more characteristics of an energy-minimizing strategy.
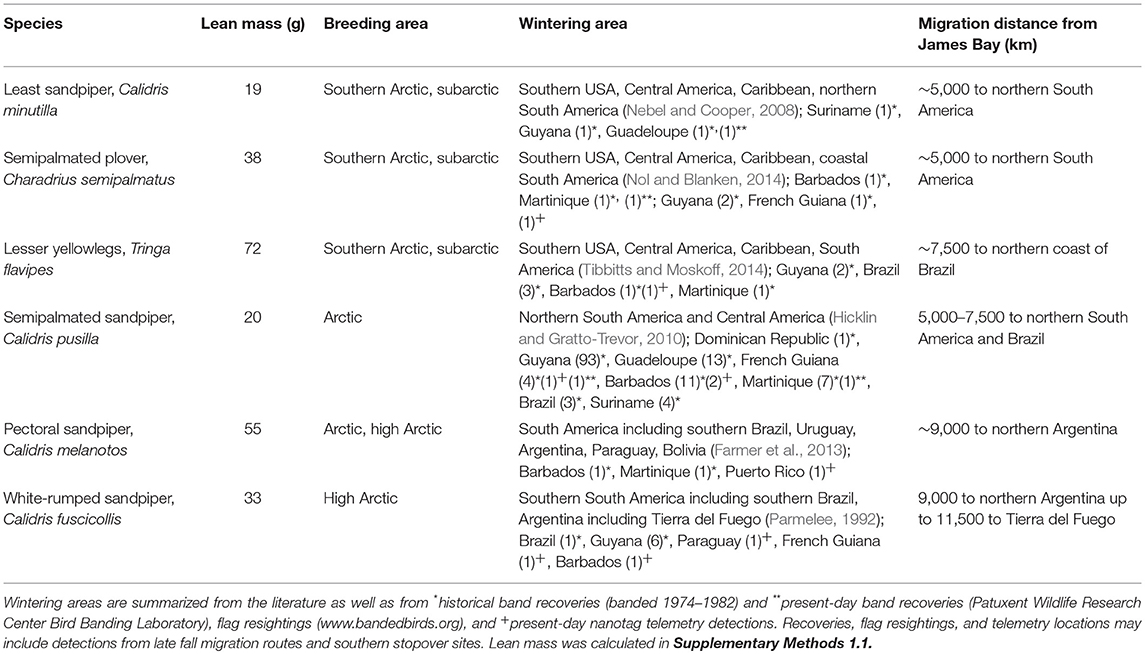
Table 1. Migration characteristics of shorebirds stopping at James Bay, Ontario, Canada, on southbound migration.
We examine these patterns as a function of age class (adult or juvenile) because juvenile shorebirds tend to have shorter, rounder (Fernández and Lank, 2007), and more convex (Anderson et al., 2019) wings than adults, a shape that is less efficient for long migratory flights (Rayner, 1988; Lockwood et al., 1998). Because of these differences in wing shape, juvenile shorebirds may need to take more stops en route than adults. Alternatively, the migration behavior of juveniles may show less clear patterns than adults because they have no previous migration experience. Lastly, body condition is known to influence migratory behavior and outcomes (e.g., Duijns et al., 2017), so we explore how it influences migration strategies and determine if it affects detection probabilities, and hence potentially survival, of individuals outside of James Bay.
Materials and Methods
Banding and Relative Fuel Loads
Shorebirds were captured with mist nets at four remote field camps in 2014–2018, from mid-July through mid-September each year along the southwestern coast of James Bay, Ontario, Canada (Figure 1). The sampling period corresponded with the bulk of southbound migration for shorebirds at James Bay, except least sandpiper adults and white-rumped sandpiper juveniles, which we excluded from the study. We banded birds and recorded mass (± 0.1 g), maximum flattened wing length (± 1 mm) (Gratto-Trevor, 2004), and subcutaneous fat score [0–7 scale, (Meissner, 2009)]. Birds were aged as juvenile (hatched that year) and adult (> 1 year of age) by examining the color and shape of the median wing coverts (Gratto-Trevor, 2004). In 2014–2017, we attached digitally coded VHF nanotags (Lotek Wireless, Newmarket, Ontario, Canada; Supplementary Table 1) to skin on the lower back of each bird above the uropygial gland (Warnock and Warnock, 1993) using cyanoacrylate glue (Loctite® Super Glue ControlTM UltraGelTM).
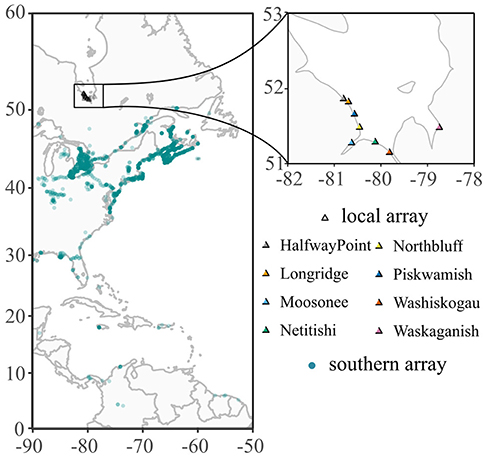
Figure 1. Locations of Motus Wildlife Tracking System automated VHF radio telemetry receiver stations used to track shorebirds during stopover along the southwestern coast of James Bay, Ontario, Canada, and during southbound migration. Towers mapped were active in at least 1 year between 2014 and 2017. Darker blue dots indicate multiple towers in close proximity. One tower at Asunción Bay, Paraguay, is not shown in the figure.
We collected blood from the brachial vein of most birds for molecular sexing because many shorebirds cannot be sexed by morphometrics or plumage (Baker et al., 1999; Dos Remedios et al., 2010). We used 27-gauge needles and capillary tubes to collect samples, and samples did not exceed 1% of body mass. Samples were stored on ice and in 95% ethanol prior to DNA extraction. DNA was extracted and amplified using primers and molecular methods designed for shorebirds (van der Velde et al., 2017). Capture, banding, and blood sampling were approved by Trent University and Environment and Climate Change Canada's Animal Care Committees and carried out under permit from Environment and Climate Change Canada.
We calculated relative fuel loads (f; ratio of fat mass to lean mass) at capture and departure by subtracting lean mass (m0) from capture mass (mcap) or estimated departure mass (mdep) and dividing by lean mass f = (mcap or mdep−m0)/m0 (Delingat et al., 2008). We calculated m0 (fat score zero) for each bird from regression equations (Supplementary Methods 1.1) of mass predicted by fat score, wing length, species, and interactions between species and fat score and species and wing length. Mass at departure was calculated as mdep = mcap+ mchange*L where mchange is the species and age specific rate of daily mass change (g/day) at the population level, and L is the individual's minimum length of stay (days) in James Bay determined from nanotags (see Length of Stay below). We determined mchange using linear mixed effects models for each age group with mass as the response variable and species, capture day of year, and an interaction between capture day of year and species as predictor variables (Supplementary Methods 1.2). Wing length was included as a covariate and year as a random factor. We used population rates of mass change to estimate departure masses because it was not possible to recapture individuals. Population rates of mass change were low (Supplementary Methods 1.2) and may underestimate individual rates of mass gain as a result of the arrival of thin birds or departure of fat birds. Although they obscure individual differences in refueling rates, population level rates allow for conservative estimates of mass change in individuals with long length of stay (several weeks) and little mass change in individuals with short length of stay (days). We compared relative departure fuel loads using linear mixed effects models with species as a predictor variable. We only included birds that we could confirm departed from James Bay (Supplementary Methods 1.3).
Automated Radio Telemetry
We used automated radio telemetry paired with VHF nanotags to obtain high temporal resolution estimates of length of stay, departure decisions, and flight speeds. Nanotags were the best option for this study on small shorebirds because they are light-weight (<1.0 g) and provide data without requiring recapture, which is difficult at this study site. Nanotags operate on a single frequency (166.380 MHz) and transmit unique, identifiable bursts every 4.7 to 10.1 s for ~80–160 d depending on battery size and burst rate (Supplementary Table 1). Nanotags were monitored through the Motus Wildlife Tracking System, a network of > 325 automated radio tower receivers (Taylor et al., 2017). Nanotags were automatically recorded by SRX receivers (Lotek Wireless, Newmarket, Ontario, Canada) or Sensorgnome receivers (www.sensorgnome.org) when a tagged bird was within range of tower antennas (~50 km; Supplementary Table 2). Birds were detected in James Bay by 5 to 8 towers (henceforth the “local array”) and at towers south of James Bay (the “southern array”; Figure 1). In 2016 and 2017, tags also were detected in James Bay with an SRX800 receiver and a 3-element Yagi antenna mounted to the base of a helicopter.
We removed detections with <3 consecutive bursts at intervals of a tag's burst rate (Brown and Taylor, 2017; Duijns et al., 2017), which removed most false detections; however, some towers were prone to noise, which resulted in systematic false detections of tags (e.g., detections of multiple birds at the same tower and time hundreds of kilometers away from their last known location). These false detection patterns were identified by examining plots of detections for each bird by latitude and time and longitude and time and were subsequently removed.
Length of Stay and Migratory Departure
We estimated minimum length of stay from the capture time and the last detection of the individual in the local array. For birds captured in 2014 and 8 birds captured in other years of the study, capture times were not recorded, so we set the capture time to 12:00 p.m. on the day of capture (resulting in a maximum error of 12 h). We compared length of stay using linear mixed effects models with species, relative fuel load at capture, capture day of year, and all interactions as predictors. Only birds for which we could confidently identify departure detection patterns from nanotags (Supplementary Methods 1.3) were included in this analysis because length of stay could be biased shorter by undetected mortality or by birds traveling outside of the detection zone of the local array during the stopover period. We considered the last detection of an individual in the local array to be the time of migratory departure, and we evaluated weather conditions at departure for birds with confirmed departure (Supplementary Methods 1.3).
Wind and precipitation data at departure were obtained from a weather station attached to the Piskwamish tower (Figure 1) in 2015–2017. The Piskwamish weather station was not erected in 2014, so we used weather data from a nearby weather station in Moosonee. The data were comparable between stations, except for wind speeds, which we calibrated to ensure similar estimates (Supplementary Methods 1.4). The weather stations had different temporal resolutions (Moosonee: hourly point observations; Piskwamish: 2 h averages), so we selected wind and precipitation data from the hour closest to departure (2014) or from the 2 h time-period in which the bird departed. For each bird, we compared wind profit (see below) and precipitation at the time of departure with the same weather variables 48 h prior. We chose 48 h as a comparison because wind speeds are correlated for up to 32 h in this region (Supplementary Methods 1.4), and we aimed to sample wind at the same time of day to avoid confounding results with daily temporal patterns in wind speed.
We estimated wind profit, wind support toward a migratory goal, at departure and 48 h prior following Erni et al. (2002) where and D = airspeed (m/s), W = wind speed (m/s), and α = wind direction (degrees)–orientation direction (degrees) converted to radians. Positive wind profit values indicate wind assistance whereas negative values indicate wind hindrance. We assumed birds would fly at an airspeed of 16 m/s (Alerstam et al., 2007; Grönroos et al., 2012; the mean airspeed of shorebirds detected by radar). For each species and age class, we used the median bearing of the first migratory flight from James Bay to the southern array (Supplementary Figure 1) as the migratory goal. We compared departure probability using generalized linear mixed effects models with a binomial response variable (departed yes/no, where “yes” represented predictors at the time of departure and “no” represented predictors 48 h prior). We included fixed predictors of wind profit, precipitation (yes/no), departure day of year, relative fuel load at departure, and species. We also included pairwise interactions between wind profit and all other predictors.
Migration Tracks and Flight Speeds
We partitioned migration data into “tracks”: the great circle trajectories between sequential tower detections for each bird. Partitioning flights into tracks allowed for multiple estimates of flight speed and wind assistance during a single migratory flight for some individuals. We calculated ground speeds (speed of the bird relative to the ground) for each track as the time elapsed between tower detections divided by the track distance. We considered ground speeds between 9 and 42 m/s to be typical of shorebird migratory flight (Grönroos et al., 2012; Supplementary Figure 2) and excluded tracks with ground speeds outside of these ranges. Ground speeds <9 m/s may indicate undetected stops en route or a longer flight path than the great circle trajectory. Speeds > 42 m/s were typical of detections on nearby towers (typically <140 km; Supplementary Table 2) and represent a small proportion (<10%) of the southbound migratory distance traveled by these birds from the subarctic to the southern array.
We compared ground speeds using generalized linear mixed effects models. Species, relative departure fuel load at departure, departure day of year, and interactions between fuel load and species and species and departure day were included as predictors. We considered a quadratic effect of tailwind support for the track (see below) as a covariate in the models because the relationship between tailwind and ground speed was non-linear.
We used the NCEP.flight function and tailwind equation in the RNCEP package (Kemp et al., 2012b) in R (R Core Team, 2018) to estimate wind assistance along the great circle trajectory for each track assuming 16 m/s airspeed (Alerstam et al., 2007; Grönroos et al., 2012). We extracted wind data from the NCEP/NCAR Reanalysis I dataset (https://www.esrl.noaa.gov/psd/data/gridded/data.ncep.reanalysis.html), which has a 2.5° latitude by 2.5° longitude spatial resolution and 6 h temporal resolution (Kemp et al., 2012a). Wind conditions were interpolated in space and time every 3 h along the route using inverse weighting distance. We considered wind conditions at pressure levels of 1,000, 925, 850, and 700 hPa (corresponding to ~100, 700, 1,500, and 3,000 m above sea level respectively) as candidate flight altitudes because radar studies have recorded shorebirds migrating within this range (Grönroos et al., 2012; La Sorte et al., 2015b). We assumed birds would migrate at the altitude with the highest wind assistance at each interpolated point. We compared tailwind support with linear mixed effects models containing species, relative fuel load at departure, departure day of year, and interactions between species and fuel load and species and departure day as predictors.
We estimated airspeeds for each track by subtracting the average tailwind support (m/s) for the track from its ground speed (m/s). We compared airspeeds with linear mixed effects models containing species, relative fuel load at departure, departure day of year, and interactions between species and fuel load and species and departure day as predictors.
Stopover and Detection Probability
We classified individuals to two categories: made at least one stop or did not stop in North America after departing James Bay. Category assignments were made using a combination of back-and-forth transmitter detection patterns on nearby towers and/or slow speed thresholds between sequential tower detections (Supplementary Methods 1.5). We examined stopover probability with generalized linear mixed effects models. The response variable for each model was binomial (the bird stopped or did not stop) and contained predictors of species, relative fuel load at departure (or relative fuel load at time of last detection at James Bay for individuals that did not have clear departure detection signals), and an interaction between species and fuel load. We did not include departure day as a predictor in this model because we detected stopovers for some birds with unknown departure.
Individuals that were not detected in the southern array either died, took a route not monitored by receivers, or nanotags malfunctioned or were lost. In this study, we cautiously interpret detection probability as a metric of apparent survival. Detection probability will underestimate true survival, because of tag loss or migration through areas without receivers (such as central North America and Newfoundland, Canada). It should, however, show reliable patterns for the effect of relative fuel load at departure on probability of detection unless skinny or fat birds migrate using different routes. For birds with confirmed departure from the subarctic, we compared detection probability using generalized linear mixed effects models with a binomial response variable (detected in the southern array or not) and predictors of species, departure day of year, and relative fuel load at departure. Each model included an interaction between species and departure day of year and species and fuel load. For adults, all semipalmated plovers with confirmed departure from James Bay were detected in the southern array; therefore, we did not include this species in this analysis.
Statistical Analyses
Age classes were analyzed separately for all models because not all age classes were sampled for each species. All mixed models included sex and year as random factors. The models predicting tailwind, ground speed, and air speed also included bird ID as a random factor to account for multiple migration tracks per individual. We used the “drop1” function with a Wald chi-square test (in a backwards stepwise approach) to remove model parameters from each global model that were not significant (α = 0.05). Model predicted means and slopes were calculated and compared with Tukey HSD post-hoc tests using the emmeans package (Lenth, 2019). Analyses were conducted with program R version 3.5.1 (R Core Team, 2018), and we made figures with ggplot2 (Wickham, 2016) and sjPlot (Lüdecke, 2018).
Results
We tagged 335 adult and 275 juvenile shorebirds with nanotags at James Bay (Table 2). A subset of those tags (19%) was never detected (Table 2) because of tag activation errors in 2014 and malfunctions of the Northbluff Point tower in 2015 and 2016. Of birds that were detected at least once, 62% were detected in the southern array where they were detected for, on average, 5 ± 9 days. Most detections in the southern array occurred in North America, and none of these birds were detected south of 35.7° N in North America (northern North Carolina, USA) despite the presence of towers south of this latitude (Figure 1). Migration routes were variable across species and age classes (Supplementary Figure 3).
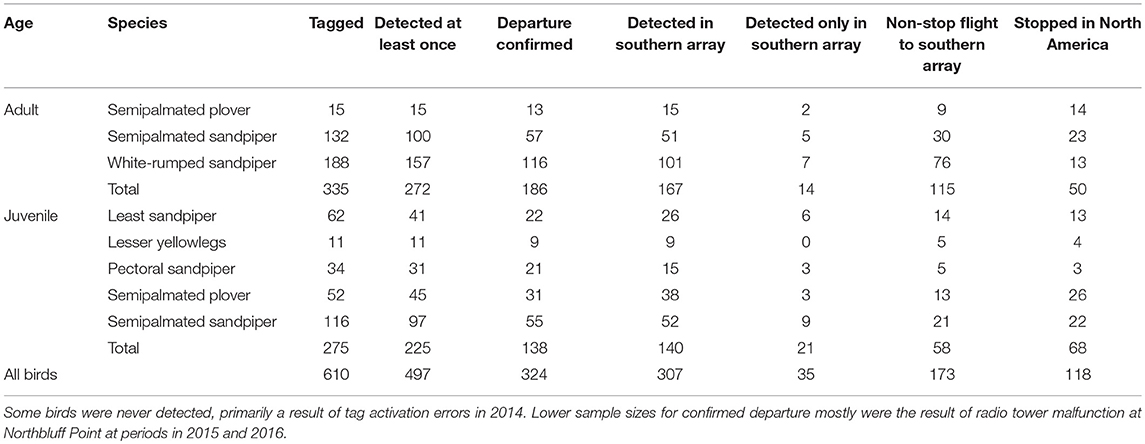
Table 2. Sample sizes of shorebirds tagged with VHF radio transmitters in James Bay, Ontario, Canada in 2014–2017 and detected on departure and in the southern automated radio telemetry with the Motus Wildlife Tracking System.
Length of Stay, Relative Fuel Loads, and Departure
Minimum length of stay in James Bay was explained by species, relative fuel load at capture, and capture day for both adults and juveniles. For all adults, length of stay differed by species (χ2 = 38.8, df = 2, p < 0.001), and the pattern indicated longer stopover lengths with increasing migration distance. Semipalmated plovers had the shortest length of stay (5.9 days ± 3.0 SE), followed by semipalmated sandpipers (14.4 ± 1.7 days), and white-rumped sandpipers (21.4 ± 1.2 days; Figure 2). There also was an interaction between capture day and relative fuel load at capture for adults (χ2 = 11.3, df = 1, p < 0.001) but not juveniles (Figure 2). Adult birds with high fuel loads captured early in the season stayed longer in James Bay than birds with lower fuel loads. This pattern changed later in the season; birds with high fuel loads stayed fewer days than birds with low fuel loads.
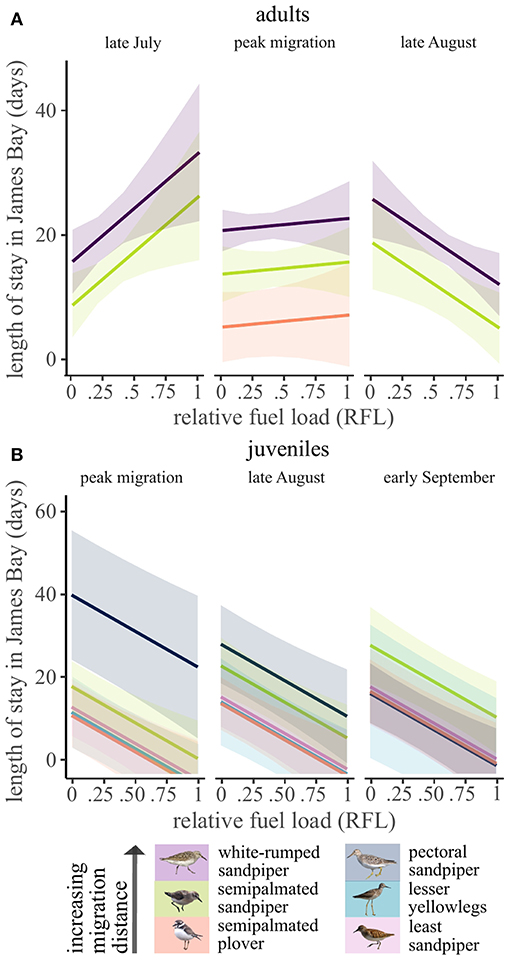
Figure 2. Model predicted patterns in minimum length of stay of (A) adult and (B) juvenile shorebirds along the southwestern coast of James Bay, Ontario, Canada in 2014–2017. Predictions were made at different time periods to demonstrate interactions between day of year by relative fuel load at capture (adults) and day of year and species (juveniles). Late July predictions were made at day of year 205 (corresponding to early arrival adults), peak migration at day 220 (most adults and early juveniles), late August at day 235 (late adult captures, most juveniles), and early September at day 250 (late juvenile captures). Semipalmated plover adults were only captured during the peak migration period.
Juveniles with higher fuel loads at capture had shorter stopover lengths in James Bay (χ2 = 11.0, df = 1, p < 0.001), and this pattern did not change throughout the season (Figure 2). A species by capture day of year interaction (χ2 = 15.1, df = 4, p < 0.01) indicated that, while controlling for relative fuel load at capture, pectoral sandpipers captured later in the season had shorter stopover lengths. This contrasted with the other species in which later captures had slightly longer stopovers (Figure 2; Supplementary Figure 4). This indicated longer stopover durations for the longest distance migrant juveniles (pectoral sandpipers) captured during the peak migration period (~August 7th, the time of first juvenile arrivals) and late August but not during early September.
For both age classes, relative fuel loads at departure differed by species (juveniles: χ2 = 38.5, df = 4, p < 0.001; adults: χ2 = 50.0, df = 2, p < 0.001; Figure 3). For adults, individuals with longer migration distances had larger relative fuel loads at departure (semipalmated plover: 0.20 ± 0.08 (mean ± SE); semipalmated sandpiper: 0.53 ± 0.05; white-rumped sandpiper: 0.68 ± 0.04). For juveniles, there was no clear association between departure fuel loads and migration distance. Pectoral sandpipers (the longest distance migrant juvenile) did not have higher departure fuel loads than other species (Figure 3), and differences only were detected between least and semipalmated sandpipers (Tukey HSD: t = −4.0, df = 81.3, p < 0.01) and semipalmated plovers and semipalmated sandpipers (Tukey HSD: t = −5.1, df = 73.4, p < 0.001).
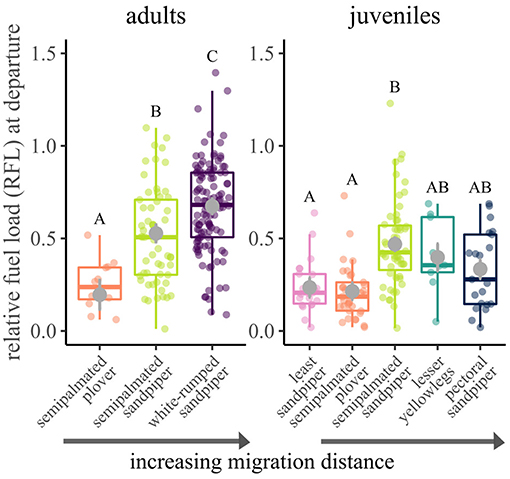
Figure 3. Relative fuel loads of shorebirds departing on migration from the southwestern coast of James Bay, Ontario, Canada in 2014–2017. Each colored point is a measurement of an individual bird, and model estimated mean and standard error are plotted with gray circles and error bars. Different letters designate significant differences (α = 0.05) for that age class.
Wind profit, precipitation, relative fuel load at departure, and an interaction between wind profit and fuel load explained departure decisions in adult shorebirds. There was no difference in departure decisions by species; therefore, wind selectivity at departure did not differ by migration distance. Individuals were more likely to depart on nights with higher wind support, but those with lower fuel loads at departure were more likely to depart in unfavorable winds (juveniles: χ2 = 10.3, df = 1, p < 0.01; adults: χ2 = 14.4, df = 1, p < 0.001; Figure 4). On nights with precipitation, adults were less likely to depart (χ2 = 112.8, df = 1, p < 0.001), but juveniles would depart regardless of precipitation (N.S. term removed from model). For juveniles, species had different patterns of wind selectivity at departure (χ2 = 9.5, df = 4, p = 0.0498). This was driven by uncertainty in the relationship for lesser yellowlegs (though there were no statistically significant differences in wind selectivity by species in post-hoc tests), and all other species had higher departure probability with increasing wind profit.
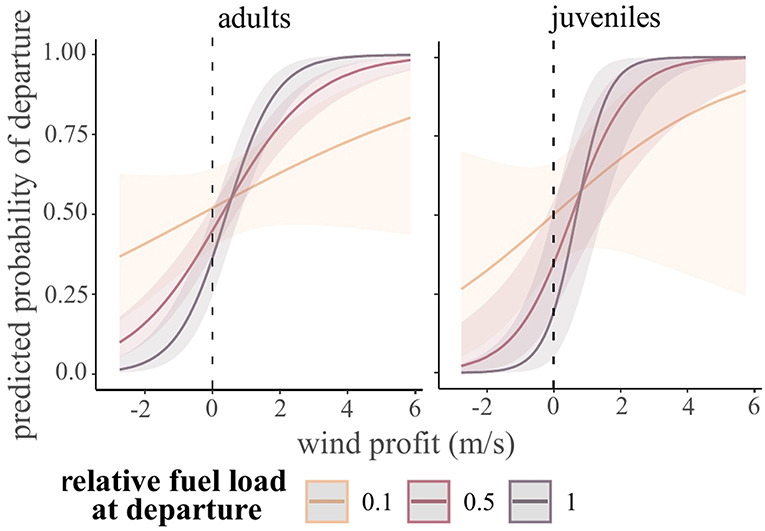
Figure 4. Model predicted departure probability for shorebirds during stopover in James Bay, Ontario, Canada in 2014–2017. For clarity, the continuous variable of relative fuel load at departure is plotted at 0.1 (low), 0.5 (moderate), and 1 (high fat load). The dashed line indicates a threshold for favorable (+) and unfavorable winds (–).
Tailwinds En Route and Flight Speeds
Tailwind support for adults during southbound migration was best explained by a model with species, departure day of year, and an interaction between the two variables. Overall, there was no difference in mean tailwind support en route between species (χ2 = 1.6, df = 2, p = 0.44); however, there was a species by departure day interaction (χ2 = 6.2, df = 2, p = 0.04) that was driven by an increase in tailwind support with later departure dates for semipalmated plovers (1.1 m/s ± 0.5 increase in tailwind support per day over the 8 d departure window for the species). For juveniles, no predictors explained tailwind support en route. Like adults, all species of juvenile shorebirds migrated with tailwind support (adults: 7.6 ± 6.3 m/s; juveniles: 7.2 ± 7.4 m/s).
For adult shorebirds, a model with species and a quadratic variable of tailwind explained ground speeds. Ground speeds differed by species (χ2 = 11.5, df = 2, p < 0.01; Figure 5), and there was a pattern of faster ground speeds with increasing migration distance. As predicted, white-rumped sandpipers achieved faster ground speeds than semipalmated sandpipers (20.1 ± 0.7 SE and 17.5 ± 0.8 m/s respectively; Tukey HSD: t = −2.6, df = 36.8, p = 0.04), but there was no difference between semipalmated plovers and the other species. Ground speeds were fastest for individuals flying with high tailwind support (Supplementary Figure 5). For juveniles, species and relative fuel load at departure remained in the final model. Ground speeds differed by species (χ2 = 16.4, df = 4, p < 0.01; Figure 5). Pectoral sandpipers, the longest distance migrant juvenile, had faster ground speeds (24.0 ± 1.6 m/s) than least sandpipers (17.3 ± 1.3 m/s) and semipalmated plovers (18.4 ± 1.2 m/s), but no other pairwise comparisons were significantly different. Across species, juvenile birds with higher fuel loads at departure migrated with higher ground speeds (χ2 = 6.6, df = 1, p = 0.01).
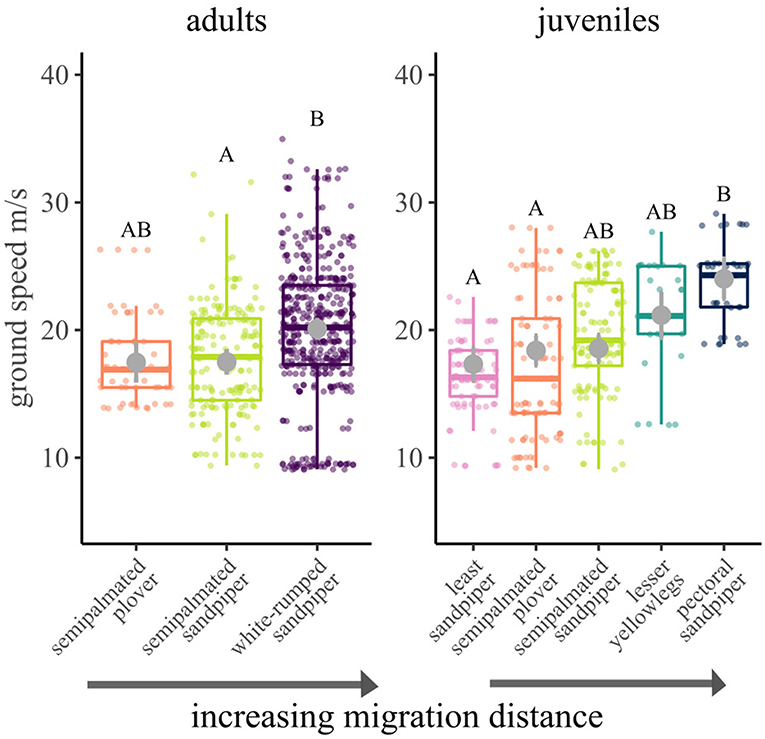
Figure 5. Ground speeds for shorebirds migrating from James Bay, Ontario, Canada to the southern automated radio telemetry array. Boxplots were constructed from raw data, whereas gray circles and error bars show model predicted means and standard errors. Letters designate significant differences (α = 0.05) for that age class.
Airspeeds differed by species for adult shorebirds (χ2 = 6.3, df = 2, p = 0.04). Adult white-rumped sandpipers migrated with faster airspeeds (13.5 m/s ± 0.7 SE) than semipalmated sandpipers (11.5 ± 0.9 m/s) indicating faster airspeeds in species with longer migration distances, though the relationship was no longer significant in post-hoc means comparisons (Tukey HSD: t = −0.1, df = 47.8, p = 0.10). Semipalmated plover airspeed (13.1 ± 1.5 m/s) did not differ from the other species (p > 0.05). For juveniles, no model predictors explained airspeeds; therefore, all species had similar airspeeds (mean 19.3 m/s ± 5.3 SD) and there was no clear association with migration distance.
Stopover and Detection Probability
Approximately 38% (n = 118) of all birds detected in the southern array stopped in North America at least once (Table 2). For adults, stopover probability differed by species (χ2 = 14.6, df = 2, p < 0.001). White-rumped sandpiper, the longest distance migrant adult, had the lowest stopover probability in North America, and this was lower than that of semipalmated sandpipers (Tukey HSD: z = 3.3, p < 0.01) and semipalmated plovers (Tukey HSD: z = 2.6, p = 0.02). Individuals with higher relative fuel loads at departure were less likely to make a stop in North America for both adults (χ2 = 10.8, df = 1, p < 0.01) and juveniles (χ2 = 8.4, df = 4, p < 0.01; Figure 6; Supplementary Figure 6). For juveniles, species was not a significant predictor in the final model, but there was a pattern of a lower stopover probability for the longest distance migrant juvenile, pectoral sandpiper, compared to other species (Figure 6; Supplementary Figure 6).
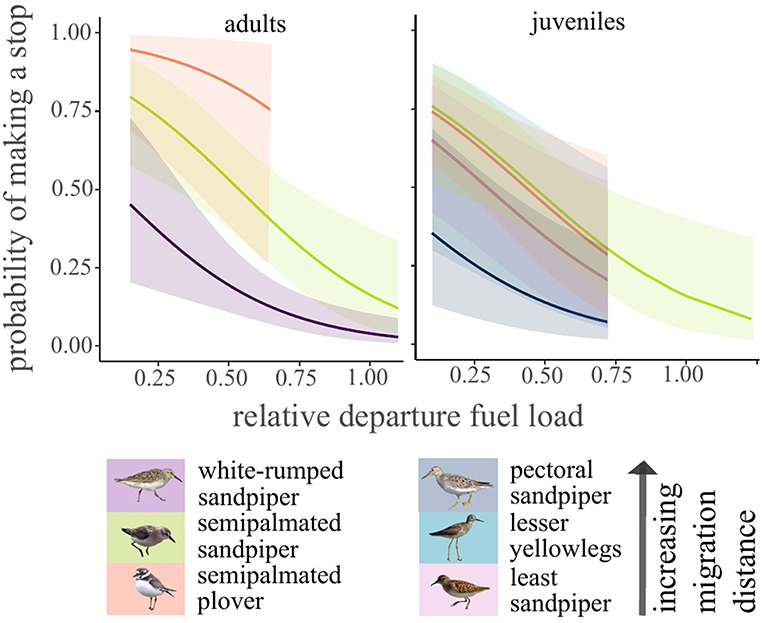
Figure 6. Model predicted stopover probability for shorebirds in North America after departing James Bay, Ontario, Canada in years 2014–2017. Species was not a significant predictor for juveniles (α = 0.05) but is plotted here to show the pattern. Least sandpipers had the same predicted pattern as lesser yellowlegs.
Detection probability of adult semipalmated and white-rumped sandpipers in North America only was explained by relative fuel load at departure (χ2 = 15.8, df = 1, p < 0.001). For both species, individuals with higher departure fuel loads were more likely to be detected in the southern array (Figure 7; Supplementary Figure 7). Adults with high fuel loads at departure (relative fuel load = 1) had approximately three times higher odds of detection in the southern array than birds with no fat mass at departure (relative fuel load = 0). For juveniles, only species remained in the final model (χ2 = 11.1, df = 4, p = 0.03). Pectoral sandpipers, the longest distance migrant juvenile, had a lower detection probability than semipalmated plovers (Tukey HSD: z = −0.9, p = 0.03; Figure 7), but no other pairwise comparisons were significant. For juveniles, relative fuel load at departure did not remain in the final model (χ2 = 2.1, df = 1, p = 0.14), though there was a trend of higher probability of detection for birds with higher fuel loads at departure (Figure 7; Supplementary Figure 7).
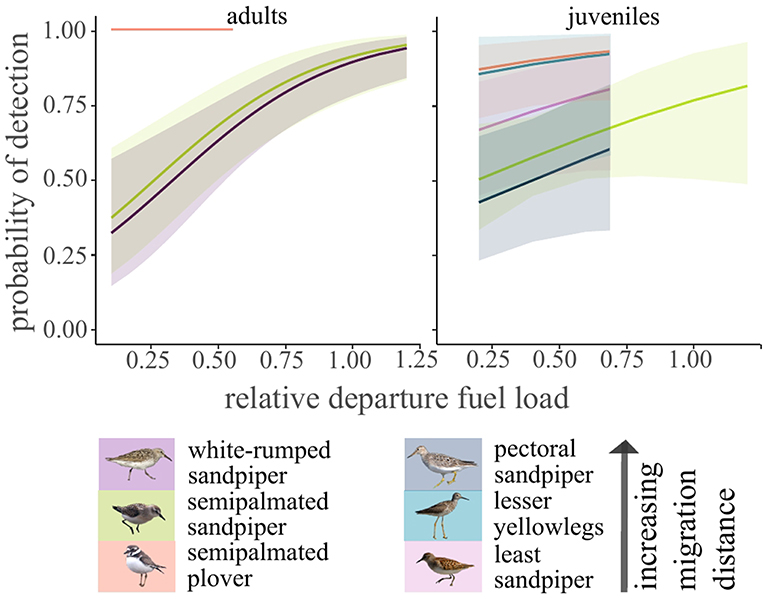
Figure 7. Model predicted detection probability for shorebirds in North America after departing James Bay, Ontario, Canada in years 2014–2017. Relative fuel load at departure was a significant predictor for adults but not juveniles (α = 0.05).
Discussion
Stopover and migration behaviors of adult shorebirds were associated with migration distance and matched behaviors consistent with a time-minimizing migration strategy. Adult white-rumped sandpipers, the longest distance migrant, had longer stopovers in James Bay, departed James Bay with higher relative fuel loads, migrated with faster airspeeds and ground speeds, and had a lower probability of stopover in North America after departing James Bay than semipalmated sandpipers and semipalmated plovers, species that migrate shorter distances. The relationship between migration strategies and migration distance was not as clear in juvenile shorebirds. The longest distance migrant juvenile, pectoral sandpipers, did not depart James Bay with higher fuel loads than shorter distance migrant juveniles, nor migrate with faster airspeeds than other species. They did, however, have longer stopovers in James Bay earlier in the migratory period, migrate with faster ground speeds, and tended to have a lower stopover probability outside of James Bay than shorter distance migrants.
The less clear relationship between migration distance and migratory behavior for juvenile birds than adults simply may be a result of inexperience. We found that adults were less likely to depart the subarctic on nights with precipitation if the winds were supportive, but juveniles would depart regardless of precipitation. Possibly juveniles are more time-constrained because they tend to arrive at the stopover site later in the season than adults. Late arrival may coincide with the peak of southbound raptor migration (Lank et al., 2003; Ydenberg et al., 2004) or declines in dipteran larvae and oligochaete prey abundance at intertidal marsh habitats at James Bay (Morrison et al., 1982), perhaps because of seasonal weather patterns and/or prey depletion by shorebirds (Székely and Bamberger, 1992; Salem et al., 2014). Additionally, individuals departing from the subarctic later in the migratory period may encounter unfavorable wind patterns along the Atlantic coast (La Sorte et al., 2015a), which could increase departure probability under poor conditions. Ultimately, the decision to depart under poor weather conditions could result in juvenile mortality (Newton, 2007) and selection favoring departure under favorable weather conditions.
In contrast to predictions of time-minimization (e.g., McLaren et al., 2012; Nilsson et al., 2014; McCabe et al., 2018), we found that all shorebird species were wind selective at departure regardless of migration distance. Wind selectivity may indicate that all groups were attempting to minimize energy expenditure during migration. This could be a result of a broader tendency toward energy-minimizing strategies on southbound compared to northbound migration (Karlsson et al., 2012; Nilsson et al., 2013; Horton et al., 2016; Duijns et al., in press). Alternatively, departure with favorable wind conditions could reduce total migration time by reducing energy costs and increasing flight range. Supportive winds during migration can cut flight energy expenditures in half and double a bird's flight range (Liechti and Bruderer, 1998), and this could reduce the number of stopovers and subsequent associated search and settling time.
We identified a pattern of lower wind selectivity at departure for birds with lower relative fuel loads. This matches theoretical predictions of wind selectivity in optimal migration theory if refueling opportunities are poor (Liechti and Bruderer, 1998). Lean birds with low refueling rates should be more likely to depart in headwinds because there is a higher energetic cost of migrating into headwinds with heavier fuel loads (Liechti and Bruderer, 1998). If foraging opportunities are poor, lean individuals may leave the subarctic in anticipation of better refueling opportunities elsewhere (i.e., the “expectation rule”; Alerstam and Lindström, 1990; Alerstam, 2011), whereas individuals in good condition may be able to afford to wait for favorable winds to curtail costs of carrying high fuel loads.
Body condition (relative fuel load at capture) also moderated length of stay and stopover and detection probability of shorebirds outside of James Bay. Juveniles with high fat mass (relative fuel load = 1) remained in James Bay approximately 17 fewer days than birds with no fat at capture (relative fuel load = 0). This is consistent with other studies (e.g., Matthews and Rodewald, 2010; Seewagen and Guglielmo, 2010; Cohen et al., 2014), though some studies do not detect such a relationship (Skagen and Knopf, 1994; Lyons and Haig, 1995; Lehnen and Krementz, 2007). For adults, individuals with high fuel loads at capture early in the migratory period stayed longer at the stopover site than individuals with low fuel loads. This pattern changed later in the migratory period; individuals with high fuel loads captured late in the migratory period had shorter stopover durations. This pattern simply could be the result of more time available to forage prior to the arrival of migratory birds of prey (Lank et al., 2003; Ydenberg et al., 2004) or the onset of freezing temperatures and declining prey availability (Morrison et al., 1982).
Across species, individuals in better condition were less likely to make a subsequent stop in North America. Longer distance migrants were less likely to make a stop than shorter distance migrants with the same relative fuel loads at departure, which could indicate less flexibility in migratory strategies for longer distance migrants. Surprisingly, many individuals were not detected making a stop in North America. Stopover probability may be higher than the levels observed in our study because of tag loss or stopover outside of the southern array after a tag's last detection; however, we found evidence that some individuals attempted non-stop transoceanic flights to the Caribbean or South America. In this study, one white-rumped sandpiper made a non-stop flight from James Bay to Barbados via the Bay of Fundy (Nova Scotia, Canada), a trip of ~4,800 km in ~5 days, after which it stayed in Barbados for at least 2.5 d. This result mirrors that of a semipalmated sandpiper with a geolocator (Brown et al., 2017) which made a non-stop transoceanic flight from James Bay to Venezuela (5,270 km). This phenomenon of non-stop flights was not identified in historical studies for James Bay, which identified shorebirds stopping along the Atlantic seaboard prior to transoceanic flights (Morrison, 1978, 1984; Morrison and Harrington, 1979). Future work should examine if body condition has changed for shorebirds during stopover at James Bay resulting in non-stop flights or if these flights went undetected in historical studies.
Body condition also was related to detection probability in the southern array, which we cautiously interpret as a metric reflecting apparent survival of individuals after their departure from James Bay. This pattern of higher detection of birds in better body condition was clear for white-rumped and semipalmated sandpiper adults, and though non-significant in juveniles, there was a positive relationship between relative fuel load at departure and detection probability. The pattern may be less clear for juveniles than adults because juvenile shorebirds may be more prone to mortality from predation (Whitfield, 2003; Van Den Hout et al., 2008) or inclement weather during migration (Newton, 2007). Alternatively, juveniles may migrate through more variable routes because of inexperience (Able and Bingman, 1987; Chernetsov, 2016), resulting in lower detection probability.
Given the high energetic demands of migration and physiological limitations of powered flight, it is not surprising that migration distance is associated with different migratory strategies, or suites of migratory behaviors in birds. These migratory strategies have not evolved independently of other traits, such as body size (La Sorte et al., 2013; Zhao et al., 2017, 2018; Horton et al., 2018) and wing shape (Minias et al., 2015; Vágási et al., 2016). In this study, we cannot disentangle migration distance from other species differences such as body size and shape. For closely related sandpipers in this study, migration distance tends to scale positively with lean mass (Table 1; least sandpipers traveling the shortest distance, semipalmated sandpiper intermediate distances, and white-rumped and pectoral sandpipers traveling the farthest). Similarly, longer-distance migrants (white-rumped and pectoral sandpiper) have more pointed wings compared to shorter distance migrants (e.g., least sandpiper), which may allow for more efficient long-distance migratory flights and offset costs of larger body size (Rayner, 1988; Hedenström, 2007). Future studies should continue to investigate the complex relationships between these traits and migratory strategies.
The use of a widespread automated radio telemetry network to study migratory strategies is not without limitations. The data obtained from this system are constrained to the spatial extent of receiver stations, and the status of individuals prior to capture is unknown. At our study site, species with farther migratory destinations also tend to breed at higher latitudes (Table 1); therefore, the migratory strategies we observed may be a result of distance traveled prior to arrival to James Bay as well as the distance yet to travel. Similarly, migratory strategies may be influenced by events prior to arrival at the stopover site, such as reproductive success (Inger et al., 2010). In this study, we made inferences about flights and stopovers from biologically relevant flight speeds, but we cannot exclude the possibility of misclassification of stopover decisions of birds with circuitous routes (and therefore low flight speeds). Future studies should compare this classification approach with true bird location data, such as from small GPS tags, to validate these inferences. Despite these constraints, this system provides high temporal resolution estimates of length of stay, departure times, and flight speeds of individuals at a site where recapture and monitoring of individuals otherwise is difficult.
This work is one of the first to track small shorebirds with fine temporal resolution during southbound migration over a broad spatial scale. It is the first migration tracking study of white-rumped sandpipers, least sandpipers, and semipalmated plovers outside of stopover or breeding sites, and it is the first to link body condition of individuals at a stopover site directly to future stopover probability for small shorebirds. Overall, this study shows that migration strategies of small shorebirds are linked to migration distance, but stopover, departure, and flight behaviors are moderated by body condition.
Data Availability
The raw data supporting the conclusions of this paper will be made available by the authors, without undue reservation, upon request.
Ethics Statement
Capture, banding, and blood sampling were approved by Trent University and Environment and Climate Change Canada's Animal Care Committees and carried out under permit from Environment and Climate Change Canada.
Author Contributions
AA, EN, and PS: conceptualized and designed the study. AA and CF: collected the data. AA: analyzed the data and wrote the paper. EN, PS, SD, and CF: contributed significantly to data interpretation and writing. AA, EN, PS, CF, and SD: approved the final version of the manuscript.
Funding
This study was funded by Environment and Climate Change Canada, the United States Fish and Wildlife Service Neotropical Migratory Bird Conservation Act (Award #F14AP00405 and #F17AP00668), Ontario Ministry of Natural Resources and Forestry Species at Risk Stewardship Fund, W. Garfield Weston Fellowship for Northern Research, and the Ontario Trillium Scholarship.
Conflict of Interest Statement
The authors declare that the research was conducted in the absence of any commercial or financial relationships that could be construed as a potential conflict of interest.
Acknowledgments
We thank the many volunteers, staff, and collaborators from the James Bay Shorebird Project for their assistance with field work and data management. We thank Moose Cree First Nation for their collaboration and continued work to protect shorebirds in their Traditional Territory. We appreciate the support of Bird Studies Canada with the Motus Wildlife Tracking System, field work, and nanotag deployment. We also thank the Royal Ontario Museum Ornithology Collection for field work support and assistance with molecular sexing analyses. We thank the Ontario Ministry of Natural Resources and Forestry for logistical support with field work and helicopter surveys. We are grateful for shorebird photographs from S. Bonnett, A. Lenske, and M. Peck.
Supplementary Material
The Supplementary Material for this article can be found online at: https://www.frontiersin.org/articles/10.3389/fevo.2019.00251/full#supplementary-material
References
Able, K. P., and Bingman, V. P. (1987). The development of orientation and navigation behavior in birds. Q. Rev. Biol. 62, 1–29. doi: 10.1086/415265
Agostinelli, C., and Lund, U. (2017). R Package 'Circular': Circular Statistics (version 0.4-93). Available online at: https://r-forge.r-project.org/projects/circular/
Alerstam, T. (1979). Wind as selective agent in bird migration. Ornis Scand. 10, 76–93. doi: 10.2307/3676347
Alerstam, T. (2011). Optimal bird migration revisited. J. Ornithol. 152, 5–23. doi: 10.1007/s10336-011-0694-1
Alerstam, T., Hedenström, A., and Åkesson, S. (2003). Long-distance migration: evolution and determinants. Oikos 103, 247–260. doi: 10.1034/j.1600-0706.2003.12559.x
Alerstam, T., and Lindström, Å. (1990). Optimal Bird Migration: The Relative Importance of Time, Energy, and Safety. Bird Migration. Berlin: Springer, 331–351.
Alerstam, T., Rosén, M., Bäckman, J., Ericson, P. G., and Hellgren, O. (2007). Flight speeds among bird species: allometric and phylogenetic effects. PLoS Biol. 5:e197. doi: 10.1371/journal.pbio.0050197
Anderson, A. M., Friis, C., Gratto-Trevor, C. L., Morrison, R. I. G., Smith, P. A., and Nol, E. (2019). Consistent declines in wing lengths of calidridine sandpipers suggest a rapid morphometric response to environmental change. PLoS ONE 14:e0213930. doi: 10.1371/journal.pone.0213930
Baker, A. J., Piersma, T., and Greenslade, A. D. (1999). Molecular vs. phenotypic sexing in red knots. Condor 101, 887–893. doi: 10.2307/1370083
Brown, J. M., and Taylor, P. D. (2017). Migratory blackpoll warblers (Setophaga striata) make regional-scale movements that are not oriented toward their migratory goal during fall. Mov. Ecol. 5:15. doi: 10.1186/s40462-017-0106-0
Brown, S., Gratto-Trevor, C., Porter, R., Weiser, E. L., Mizrahi, D., Bentzen, R., et al. (2017). Migratory connectivity of semipalmated sandpipers and implications for conservation. Condor Ornithol. Appl. 119, 207–224. doi: 10.1650/CONDOR-16-55.1
Calvert, A. M., Walde, S. J., and Taylor, P. D. (2009). Nonbreeding-season drivers of population dynamics in seasonal migrants: conservation parallels across taxa. Avian Conserv. Ecol. 4:5. doi: 10.5751/ACE-00335-040205
Chernetsov, N. S. (2016). Orientation and navigation of migrating birds. Biol. Bull. 43, 788–803. doi: 10.1134/S1062359016080069
Cohen, E. B., Moore, F. R., and Fischer, R. A. (2014). Fuel stores, time of spring, and movement behavior influence stopover duration of Red-eyed Vireo Vireo olivaceus. J. Ornithol. 155, 785–792. doi: 10.1007/s10336-014-1067-3
Delingat, J., Bairlein, F., and Hedenström, A. (2008). Obligatory barrier crossing and adaptive fuel management in migratory birds: the case of the Atlantic crossing in Northern Wheatears (Oenanthe oenanthe). Behav. Ecol. Sociobiol. 62, 1069–1078. doi: 10.1007/s00265-007-0534-8
Dos Remedios, N., Lee, P. L., Szekely, T., Dawson, D. A., and Kupper, C. (2010). Molecular sex-typing in shorebirds: a review of an essential method for research in evolution, ecology and conservation. Wader Study Group Bull. 117, 109–118. Available online at: https://www.waderstudygroup.org/publications/bulletin/bulletin-volume-117/bulletin-volume-117-issue-2/
Duijns, S., Anderson, A. M., Aubry, Y., Dey, A., Flemming, S. A., and Smith, P. A. (in press). Long-distance migratory shorebirds travel faster towards their breeding grounds, but fly faster post-breeding. Sci. Rep. doi: 10.1038/s41598-019-45862-0
Duijns, S., Niles, L. J., Dey, A., Aubry, Y., Friis, C., Koch, S., et al. (2017). Body condition explains migratory performance of a long-distance migrant. Proc. R. Soc. B. 284:20171374. doi: 10.1098/rspb.2017.1374
Erni, B., Liechti, F., Underhill, L. G., and Bruderer, B. (2002). Wind and rain govern the intensity of nocturnal bird migration in central Europe-a log-linear regression analysis. Ardea 90, 155–166. Available online at: http://ardea.nou.nu/
Farmer, A., Holmes, R. T., and Pitelka, F. A. (2013). “Pectoral Sandpiper (Calidris melanotos), version 2.0,” in The Birds of North America, eds Poole, A. F. (Ithaca, NY: Cornell Lab of Ornithology). doi: 10.2173/bna.348
Fernández, G., and Lank, D. B. (2007). Variation in the wing morphology of Western Sandpipers (Calidris mauri) in relation to sex, age class, and annual cycle. Auk 124, 1037–1046. doi: 10.1642/0004-8038(2007)124[1037:VITWMO]2.0.CO;2
Gratto-Trevor, C. L. (2004). The North American Bander's Manual for Banding Shorebirds (Charadriiformes, Suborder Charadrii). Point Reyes Station, CA: North American Banding Council.
Grönroos, J., Green, M., and Alerstam, T. (2012). To fly or not to fly depending on winds: shorebird migration in different seasonal wind regimes. Anim. Behav. 83, 1449–1457. doi: 10.1016/j.anbehav.2012.03.017
Gwinner, E. (1996). Circadian and circannual programmes in avian migration. J. Exp. Biol. 199, 39–48.
Hebblewhite, M., and Merrill, E. H. (2007). Multiscale wolf predation risk for elk: does migration reduce risk?. Oecologia 152, 377–387. doi: 10.1007/s00442-007-0661-y
Hedenström, A. (2007). Adaptations to migration in birds: behavioural strategies, morphology and scaling effects. Philos. Trans. R. Soc. Lond. B 363, 287–299. doi: 10.1098/rstb.2007.2140
Hedenström, A., and Alerstam, T. (1997). Optimum fuel loads in migratory birds: distinguishing between time and energy minimization. J. Theor. Biol. 189, 227–234. doi: 10.1006/jtbi.1997.0505
Hicklin, P., and Gratto-Trevor, C. L. (2010). “Semipalmated Sandpiper (Calidris pusilla), version 2.0,” in The Birds of North America, eds Poole, F. (Ithaca, NY: Cornell Lab of Ornithology). doi: 10.2173/bna.6
Horton, K. G., Van Doren, B. M., La Sorte, F. A., Fink, D., Sheldon, D., Farnsworth, A., et al. (2018). Navigating north: how body mass and winds shape avian flight behaviours across a North American migratory flyway. Ecol. Lett. 21, 1055–1064. doi: 10.1111/ele.12971
Horton, K. G., Van Doren, B. M., Stepanian, P. M., Farnsworth, A., and Kelly, J. F. (2016). Seasonal differences in landbird migration strategies. Auk 133, 761–769. doi: 10.1642/AUK-16-105.1
Inger, R., Harrison, X. A., Ruxton, G. D., Newton, J., Colhoun, K., Gudmundsson, G. A., et al. (2010). Carry-over effects reveal reproductive costs in a long-distance migrant. J. Anim. Ecol. 79, 974–982. doi: 10.1111/j.1365-2656.2010.01712.x
Karlsson, H., Nilsson, C., Bäckman, J., and Alerstam, T. (2012). Nocturnal passerine migrants fly faster in spring than in autumn: a test of the time minimization hypothesis. Anim. Behav. 83, 87–93. doi: 10.1016/j.anbehav.2011.10.009
Kemp, M. U., Shamoun-Baranes, J., van Loon, E. E., McLaren, J. D., Dokter, A. M., and Bouten, W. (2012a). Quantifying flow-assistance and implications for movement research. J. Theor. Biol. 308, 56–67. doi: 10.1016/j.jtbi.2012.05.026
Kemp, M. U., Van Loon, E. E., Shamoun-Baranes, J., and Bouten, W. (2012b). RNCEP: global weather and climate data at your fingertips. Methods Ecol Evol. 3, 65–70. doi: 10.1111/j.2041-210X.2011.00138.x
Klaassen, M., Hoye, B. J., Nolet, B. A., and Buttemer, W. A. (2012). Ecophysiology of avian migration in the face of current global hazards. Philos. Trans. R. Soc. Lond. B 367, 1719–1732. doi: 10.1098/rstb.2012.0008
La Sorte, F. A., Fink, D., Hochachka, W. M., DeLong, J. P., and Kelling, S. (2013). Population-level scaling of avian migration speed with body size and migration distance for powered fliers. Ecology 94, 1839–1847. doi: 10.1890/12-1768.1
La Sorte, F. A., Hochachka, W. M., Farnsworth, A., Sheldon, D., Fink, D., Geevarghese, J., et al. (2015a). Migration timing and its determinants for nocturnal migratory birds during autumn migration. J. Anim. Ecol. 84, 1202–1212. doi: 10.1111/1365-2656.12376
La Sorte, F. A., Hochachka, W. M., Farnsworth, A., Sheldon, D., Van Doren, B. M., Fink, D., et al. (2015b). Seasonal changes in the altitudinal distribution of nocturnally migrating birds during autumn migration. R. Soc. Open Sci. 2:150347. doi: 10.1098/rsos.150347
Lank, D. B., Butler, R. W., Ireland, J., and Ydenberg, R. C. (2003). Effects of predation danger on migration strategies of sandpipers. Oikos 103, 303–319. doi: 10.1034/j.1600-0706.2003.12314.x
Lehnen, S., and Krementz, D. (2007). The influence of body condition on the stopover ecology of least sandpipers in the Lower Mississippi alluvial valley during fall migration. Avian Conserv. Ecol. 2:209. doi: 10.5751/ACE-00176-020209
Lenth, R. (2019). emmeans: Estimated Marginal Means, aka Least-Squares Means. R package version 1.3.2. Available online at: https://CRAN.R-project.org/package=emmeans
Liechti, F. (1995). Modelling optimal heading and airspeed of migrating birds in relation to energy expenditure and wind influence. J. Avian Biol. 49, 330–336. doi: 10.2307/3677049
Liechti, F., and Bruderer, B. (1998). The relevance of wind for optimal migration theory. J. Avian Biol. 1998, 561–568. doi: 10.2307/3677176
Lockwood, R., Swaddle, J. P., and Rayner, J. M. (1998). Avian wingtip shape reconsidered: wingtip shape indices and morphological adaptations to migration. J. Avian Biol. 1998, 273–292. doi: 10.2307/3677110
Lüdecke, D. (2018). sjPlot: Data Visualization for Statistics in Social Science. R package version. 2.6.2.9000. Available online at: https://CRAN.R-project.org/package=sjPlot
Lyons, J. E., and Haig, S. M. (1995). Fat content and stopover ecology of spring migrant Semipalmated Sandpipers in South Carolina. Condor 1995, 427–437.
Matthews, S. N., and Rodewald, P. G. (2010). Urban forest patches and stopover duration of migratory Swainson's thrushes. Condor 112, 96–104. doi: 10.1525/cond.2010.090049
McCabe, J. D., Olsen, B. J., Osti, B., and Koons, P. O. (2018). The influence of wind selectivity on migratory behavioral strategies. Behav. Ecol. 29, 160–168. doi: 10.1093/beheco/arx141
McKinnon, L., Smith, P. A., Nol, E., Martin, J. L., Doyle, F. I., Abraham, K. F., et al. (2010). Lower predation risk for migratory birds at high latitudes. Science 327, 326–327. doi: 10.1126/science.1183010
McLaren, J. D., Shamoun-Baranes, J., and Bouten, W. (2012). Wind selectivity and partial compensation for wind drift among nocturnally migrating passerines. Behav. Ecol. 23, 1089–1101. doi: 10.1093/beheco/ars078
McWilliams, S. R., Guglielmo, C., Pierce, B., and Klaassen, M. (2004). Flying, fasting, and feeding in birds during migration: a nutritional and physiological ecology perspective. J. Avian Biol. 35, 377–393. doi: 10.1111/j.0908-8857.2004.03378.x
Meissner, W. (2009). A classification scheme for scoring subcutaneous fat depots of shorebirds. J. Field Ornithol. 80, 289–296. doi: 10.1111/j.1557-9263.2009.00232.x
Miller-Rushing, A. J., Lloyd-Evans, T. L., Primack, R. B., and Satzinger, P. (2008). Bird migration times, climate change, and changing population sizes. Glob. Chang. Biol. 14, 1959–1972. doi: 10.1111/j.1365-2486.2008.01619.x
Mills, A. M., Thurber, B. G., Mackenzie, S. A., and Taylor, P. D. (2011). Passerines use nocturnal flights for landscape-scale movements during migration stopover. Condor 113, 597–607. doi: 10.1525/cond.2011.100186
Minias, P., Meissner, W., Włodarczyk, R., Ozarowska, A., Piasecka, A., Kaczmarek, K., et al. (2015). Wing shape and migration in shorebirds: a comparative study. IBIS 157, 528–535. doi: 10.1111/ibi.12262
Mitchell, G. W., Newman, A. E., Wikelski, M., and Norris, D. R. (2012). Timing of breeding carries over to influence migratory departure in a songbird: an automated radiotracking study. J. Anim. Ecol. 81, 1024–1033. doi: 10.1111/j.1365-2656.2012.01978.x
Morrison, R. I. G. (1978). Shorebird banding and colour-marking studies in James Bay, 1977. Wader Study Group Bull. 23, 36–43.
Morrison, R. I. G. (1984). Migration Systems of Some New World Shorebirds. Behavior of Marine Animals: Current Perspectives in Research. New York, NY: Plenum Press.
Morrison, R. I. G., and Harrington, B. (1979). “Critical shorebird resources in James Bay and Eastern North America” in Transaction of the North American Wildlife and Natural Resources Conference (Washington, DC).
Morrison, R. I. G., Rimmer, C. C., and, B. A., and Campbell (1982). Shorebird Banding, Migration and Related Studies at North Point, Ontario. Ottawa, ON: Canadian Wildlife Service.
Nebel, S., and Cooper, J. M. (2008). “Least sandpiper (Calidris minutilla), version 2.0” in The Birds of North America, eds Poole, A. F. (Ithaca, NY: Cornell Lab of Ornithology). doi: 10.2173/bna.115
Newton, I. (2007). Weather-related mass-mortality events in migrants. IBIS 149, 453–467. doi: 10.1111/j.1474-919X.2007.00704.x
Nilsson, C., Bäckman, J., and Alerstam, T. (2014). Seasonal modulation of flight speed among nocturnal passerine migrants: differences between short-and long-distance migrants. Behav. Ecol. Sociobiol. 68, 1799–1807. doi: 10.1007/s00265-014-1789-5
Nilsson, C., Klaassen, R. H., and Alerstam, T. (2013). Differences in speed and duration of bird migration between spring and autumn. Am. Nat. 181, 837–845. doi: 10.1086/670335
Nol, E., and Blanken, M. S. (2014). “Semipalmated plover (Charadrius semipalmatus), version 2.0,” in The Birds of North America, eds Poole, A. F. (Ithaca, NY: Cornell Lab of Ornithology). doi: 10.2173/bna.444
Parmelee, D. F. (1992). “White-rumped Sandpiper (Calidris fuscicollis), version 2.0,” in The Birds of North America, eds Poole, A. F., Stettenheim, P. R., and Gill, F. B. (Ithaca, NY: Cornell Lab of Ornithology). doi: 10.2173/bna.29
Pennycuick, C. J. (1969). The mechanics of bird migration. IBIS 111, 525–556. doi: 10.1111/j.1474-919X.1969.tb02566.x
Pewsey, A., Neuhäuser, M., and Ruxton, G. D. (2013). Circular Statistics in R. Oxford, UK: Oxford University Press.
Piersma, T., and Lindström, Å. (1997). Rapid reversible changes in organ size as a component of adaptive behaviour. Trends Ecol. Evol. 12, 134–138. doi: 10.1016/S0169-5347(97)01003-3
Piersma, T., Lok, T., Chen, Y., Hassell, C. J., Yang, H. Y., Boyle, A., et al. (2016). Simultaneous declines in summer survival of three shorebird species signals a flyway at risk. J. Appl. Ecol. 53, 479–490. doi: 10.1111/1365-2664.12582
R Core Team (2018). R: A Language and Environment for Statistical Computing. Vienna: R Foundation for Statistical Computing. Available online at: http://www.R-project.org/
Ramenofsky, M. (1990). “Fat storage and fat metabolism in relation to migration” in Bird Migration, ed Gwinner, E. (Berlin; Heidelberg: Springer) 214–231.
Rayner, J. M. (1988). Form and function in avian flight. Curr Ornithol. 1988, 27–40. doi: 10.1007/978-1-4615-6787-5_1
Rubolini, D., Møller, A. P., Rainio, K., and Lehikoinen, E. (2007). Intraspecific consistency and geographic variability in temporal trends of spring migration phenology among European bird species. Clim. Res. 35, 135–146. doi: 10.3354/cr00720
Salem, M. V. A., van der Geest, M., Piersma, T., Saoud, Y., and van Gils, J. A. (2014). Seasonal changes in mollusc abundance in a tropical intertidal ecosystem, Banc d'Arguin (Mauritania): testing the ‘depletion by shorebirds' hypothesis. Estuar. Coast. Shelf Sci. 136, 26–34. doi: 10.1016/j.ecss.2013.11.009
Seewagen, C. L., and Guglielmo, C. G. (2010). Effects of fat and lean body mass on migratory landbird stopover duration. Wilson J. Ornithol. 122, 82–87. doi: 10.1676/09-088.1
Sillett, T. S., and Holmes, R. T. (2002). Variation in survivorship of a migratory songbird throughout its annual cycle. J. Anim. Ecol. 71, 296–308. doi: 10.1046/j.1365-2656.2002.00599.x
Skagen, S. K., and Knopf, F. L. (1994). Residency patterns of migrating sandpipers at a midcontinental stopover. Condor 1994, 949–958. doi: 10.2307/1369104
Székely, T., and Bamberger, Z. (1992). Predation of waders (Charadrii) on prey populations: an exclosure experiment. J. Anim. Ecol. 1992, 447–456. doi: 10.2307/5335
Taylor, P., Crewe, T., Mackenzie, S., Lepage, D., Aubry, Y., Crysler, Z., et al. (2017). The motus wildlife tracking system: a collaborative research network to enhance the understanding of wildlife movement. Avian Conserv. Ecol. 12:108. doi: 10.5751/ACE-00953-120108
Teitelbaum, C. S., Fagan, W. F., Fleming, C. H., Dressler, G., Calabrese, J. M., Leimgruber, P., et al. (2015). How far to go? Determinants of migration distance in land mammals. Ecol. Lett. 18, 545–552. doi: 10.1111/ele.12435
Tibbitts, T. L., and Moskoff, W. (2014). “Lesser yellowlegs (Tringa flavipes), version 2.0,” in The Birds of North America, eds Poole, A. F. (Ithaca, NY: Cornell Lab of Ornithology). doi: 10.2173/bna.427
Vágási, C. I., Pap, P. L., Vincze, O., Osváth, G., Erritzøe, J., and Møller, A. P. (2016). Morphological adaptations to migration in birds. Evol. Biol. 43, 48–59. doi: 10.1007/s11692-015-9349-0
Van Den Hout, P. J., Spaans, B., and Piersma, T. (2008). Differential mortality of wintering shorebirds on the Banc d'Arguin, Mauritania, due to predation by large falcons. IBIS 150, 219–230. doi: 10.1111/j.1474-919X.2008.00785.x
van der Velde, M., Haddrath, O., Verkuil, Y. I., Baker, A. J., and Piersma, T. (2017). New primers for molecular sex identification of waders. Wader Study 124, 147–151. doi: 10.18194/ws.00069
Warnock, N., and Warnock, S. (1993). Attachment of radio-transmitters to sandpipers: review and methods. Wader Study Group Bull. 70, 28–30.
Whitfield, D. P. (2003). Predation by Eurasian sparrowhawks produces density-dependent mortality of wintering redshanks. J. Anim. Ecol. 72, 27–35. doi: 10.1046/j.1365-2656.2003.00672.x
Ydenberg, R. C., Butler, R. W., Lank, D. B., Smith, B. D., and Ireland, J. (2004). Western Sandpipers have altered migration tactics as peregrine falcon populations have recovered. Proc. R. Soc. B Biol. Sci. 271:1263. doi: 10.1098/rspb.2004.2713
Zhao, M., Christie, M., Coleman, J., Hassell, C., Gosbell, K., Lisovski, S., et al. (2017). Time versus energy minimization migration strategy varies with body size and season in long-distance migratory shorebirds. Mov. Ecol. 5:23. doi: 10.1186/s40462-017-0114-0
Keywords: automated telemetry, body condition, carryover effects, flight speed, migration distance, optimal migration, stopover
Citation: Anderson AM, Duijns S, Smith PA, Friis C and Nol E (2019) Migration Distance and Body Condition Influence Shorebird Migration Strategies and Stopover Decisions During Southbound Migration. Front. Ecol. Evol. 7:251. doi: 10.3389/fevo.2019.00251
Received: 24 March 2019; Accepted: 17 June 2019;
Published: 09 July 2019.
Edited by:
Yolanda E. Morbey, University of Western Ontario, CanadaReviewed by:
Phil Taylor, Acadia University, CanadaSimeon Lisovski, Swiss Ornithological Institute, Switzerland
Copyright © 2019 Anderson, Duijns, Smith, Friis and Nol. This is an open-access article distributed under the terms of the Creative Commons Attribution License (CC BY). The use, distribution or reproduction in other forums is permitted, provided the original author(s) and the copyright owner(s) are credited and that the original publication in this journal is cited, in accordance with accepted academic practice. No use, distribution or reproduction is permitted which does not comply with these terms.
*Correspondence: Alexandra M. Anderson, YWFuZGU3NjNAZ21haWwuY29t