 Anthony J. Silva
 Michael Kawalek
 Donna M. Williams-Hill
 Rosalee S. Hellberg
- 1One University Drive, Food Science Program, Schmid College of Science and Technology, Chapman University, Orange, CA, United States
- 2Pacific Southwest Food and Feed Laboratory, Office of Regulatory Affairs, Office of Regulatory Science, U.S. Food and Drug Administration, Irvine, CA, United States
DNA barcoding is a valuable tool for regulatory identification of fish species; however, it does not perform well when multiple species are present within the same food product. Therefore, the objective of this study was to examine the use of PCR cloning to identify fish in a mixed-species product that cannot be identified with standard DNA barcoding. A total of 15 fish ball mixtures were prepared with known amounts of Nile tilapia (Oreochromis niloticus), Pacific cod (Gadus macrocephalus), and walleye pollock (Gadus chalcogrammus). Three subsamples from each fish ball underwent DNA extraction, full DNA barcoding (655 bp), and mini-barcoding (226 bp) of the cytochrome c oxidase subunit 1 (CO1) gene. Subsamples that did not pass sequencing according to regulatory standards were further analyzed with PCR cloning. All fish balls made of just one species tested positive for that species (i.e., tilapia, cod, or pollock) with both full and mini-barcoding. However, only tilapia was detected in fish balls containing multiple species when tested with standard barcoding techniques, reflecting an inaccurate representation of the fish mixture and suggesting species bias. PCR cloning allowed for identification of Pacific cod in 86% of the mixed-species fish balls tested with full-barcode cloning and 100% of the mixed-species fish ball tested with mini-barcode cloning. However, PCR cloning did not enable the identification of walleye pollock. Standard full barcoding produced more high quality sequences compared to mini-barcoding yet failed to accurately detect all species present in the tested fish mixtures. Overall, the results of this study show that PCR cloning may be an effective method to identify certain fish in mixed-species products when standard DNA barcoding fails. However, additional research is needed to overcome the species bias observed in this study.
Introduction
Food fraud, including species substitution and mislabeling, is a concern within the seafood industry (Pardo et al., 2016). The United States is a major importer of fish and fish-based products, with annual imports valued at United States $20.5 billion in 2016 (FAO, 2018). The vulnerability of fish-based products to fraud is high due to fluctuations in pricing, quality, supply, and demand. Species substitution and mislabeling is largely motivated through the economic gain that results from substitution of an inexpensive fish for a premium fish (Khaksar et al., 2015). However, species substitution can have serious consequences, including exposure to toxins and allergens, infringement of religious practices, and financial loss (Armani et al., 2015).
DNA barcoding is typically used by the U.S. Food and Drug Administration (FDA) to identify fish species in food for regulatory purposes (Handy et al., 2011). In DNA full-barcoding, a ∼650 base-pair (bp) region of the cytochrome c oxidase subunit 1 (CO1) gene is sequenced and compared to reference sequences to enable species identification. While full barcoding has been shown to work well with raw or minimally processed single-species products, challenges have arisen in the identification of more processed products. One means of addressing these challenges has been the development of DNA mini-barcodes that target shorter regions (∼100–300 bp) of CO1 (Shokralla et al., 2015). DNA mini-barcodes have been found to perform well for species identification in a variety of processed products (Shokralla et al., 2015; Pollack et al., 2018). However, both full and mini DNA barcoding utilize Sanger sequencing and, therefore, often fail to identify species when two or more species are mixed in the same sample (Carvalho et al., 2017b). This is because the presence of multiple species in the same sample can lead to the generation of multiple, overlapping peaks on the resulting sequencing chromatogram, making it unreadable.
Some seafood products, such as fish balls, fish cakes and surimi, are made with a range of fish species and can readily be adulterated due to the lack of morphological identifiers (Galal-Khallaf et al., 2016; Carvalho et al., 2017a). For example, a previous study involving 22 processed cod products (including fish cakes) purchased in Brazil found that 41% of samples were mislabeled and 31% of samples consisted of two or more species (Carvalho et al., 2017b). Mixed fish products, such as fish cakes and fish balls, are consumed worldwide in regions such as Asia, Brazil, and Scandinavia. A wide variety of species are commonly used for production of mixed fish products, typically ranging from 2 to 3 fish species per mixture, including Pacific cod (Gadus microcephalus), walleye pollock (Gadus chalcogrammus), Pacific whiting (Merluccius productus), and tilapia (Oreochromis spp.) (Morrissey and Guenneugues, 2000; Ninan et al., 2010; Carvalho et al., 2017b). Cod is the most highly valued of these species, while the latter three are relatively inexpensive and sometimes mislabeled as more expensive fish (Stiles et al., 2013; NOAA, 2019).
PCR cloning has previously been used in combination with DNA barcoding for species identification in mixed-species fish products (Galal-Khallaf et al., 2016). This technique involves the use of an E. coli-based cloning vector to isolate DNA amplicons from different species in the same sample (Rondon et al., 2000; Galal-Khallaf et al., 2016). The resulting amplicons can then be sequenced separately and identified using DNA barcoding techniques. PCR cloning in combination with mini-barcoding (127 bp) of the CO1 gene was previously reported to identify species in 100% (29 out of 29) of commercial surimi products tested from China, Singapore, and India (Galal-Khallaf et al., 2016). This method enabled identification of an average of 2.3, 1.6, and 1.0 species per product from Singapore, China, and India, respectively. Common species identified in this study included Sutchi catfish (Pangasianodon hypophthalmus), yellowbelly threadfin bream (Nemipterus bathybius), and fringescale sardinella (Sardinella fimbriata). PCR cloning has been used previously for the identification of species in other applications involving mixed samples, such as detection of animal species in pet food (Donne-Gousse et al., 2005; Teletchea et al., 2005), identification of plant species in honey (Bruni et al., 2015), and analysis of fish species in the fecal material of predators (Deagle et al., 2005; Murray et al., 2011).
Although various DNA barcoding techniques have been established for species identification, no definitive research has been done on the ability of PCR cloning combined with DNA barcoding to identify specific fish in a mixed-species sample using known amounts of each species. Therefore, the objective of this study was to examine the use of PCR cloning combined with DNA barcoding to identify fish in a mixed-species product (i.e., fish balls) containing known amounts of each species. This is the only study to date that has assessed the use of these methods to identify species in known mixtures of fish with varying composition. In accordance with typical fish species testing procedures, all products were first tested with standard DNA barcoding. To simulate regulatory testing, all samples that passed sequencing with standard DNA barcoding were not additionally tested. Products that failed to produce a species identification underwent PCR cloning. This method was tested using both mini-barcoding and full barcoding in order to determine which barcoding technique is most appropriate for this application.
Materials and Methods
Sample Collection and Preparation
Fifteen fish ball samples were prepared containing specific proportions of Nile tilapia, Pacific cod, and walleye pollock (Table 1). Filets corresponding to each species were purchased from local grocery stores in Orange County, CA, United States. Prior to use in this study, the filets were authenticated with DNA barcoding (described below) and then stored at −20°C until authentication was complete. Fish balls were prepared using an adapted recipe from China Sichuan Food1. The authenticated filets from the three species of fish were used to prepare 100-g mixtures at the proportions specified in Table 1. Each fish mixture was homogenized with 10 g ice and 10 ml deionized water in a sterile 12-speed Oster blender (Fort Lauderdale, FL, United States) for 2 min at speed 2. Next, 0.3 g of salt and 0.4 g of sugar were added and the mixture was blended for 1–2 min at speed 5. Then, an additional 8 g of ice and 3 ml deionized water were added and mixed for 2 min at speed 11. This step was repeated and blended at speed 4. Finally, 0.4 g of cornstarch and 5 ml deionized water was added to the mixture and blended for 2 min at speed 8. The mixture was then rolled into a 100-g fish ball and heated in 80°C deionized water for 1–2 min. After heating, the fish ball was cooled, placed in an individually labeled Ziploc freezer bag (Racine, WI, United States), and stored at −80°C until further analysis.
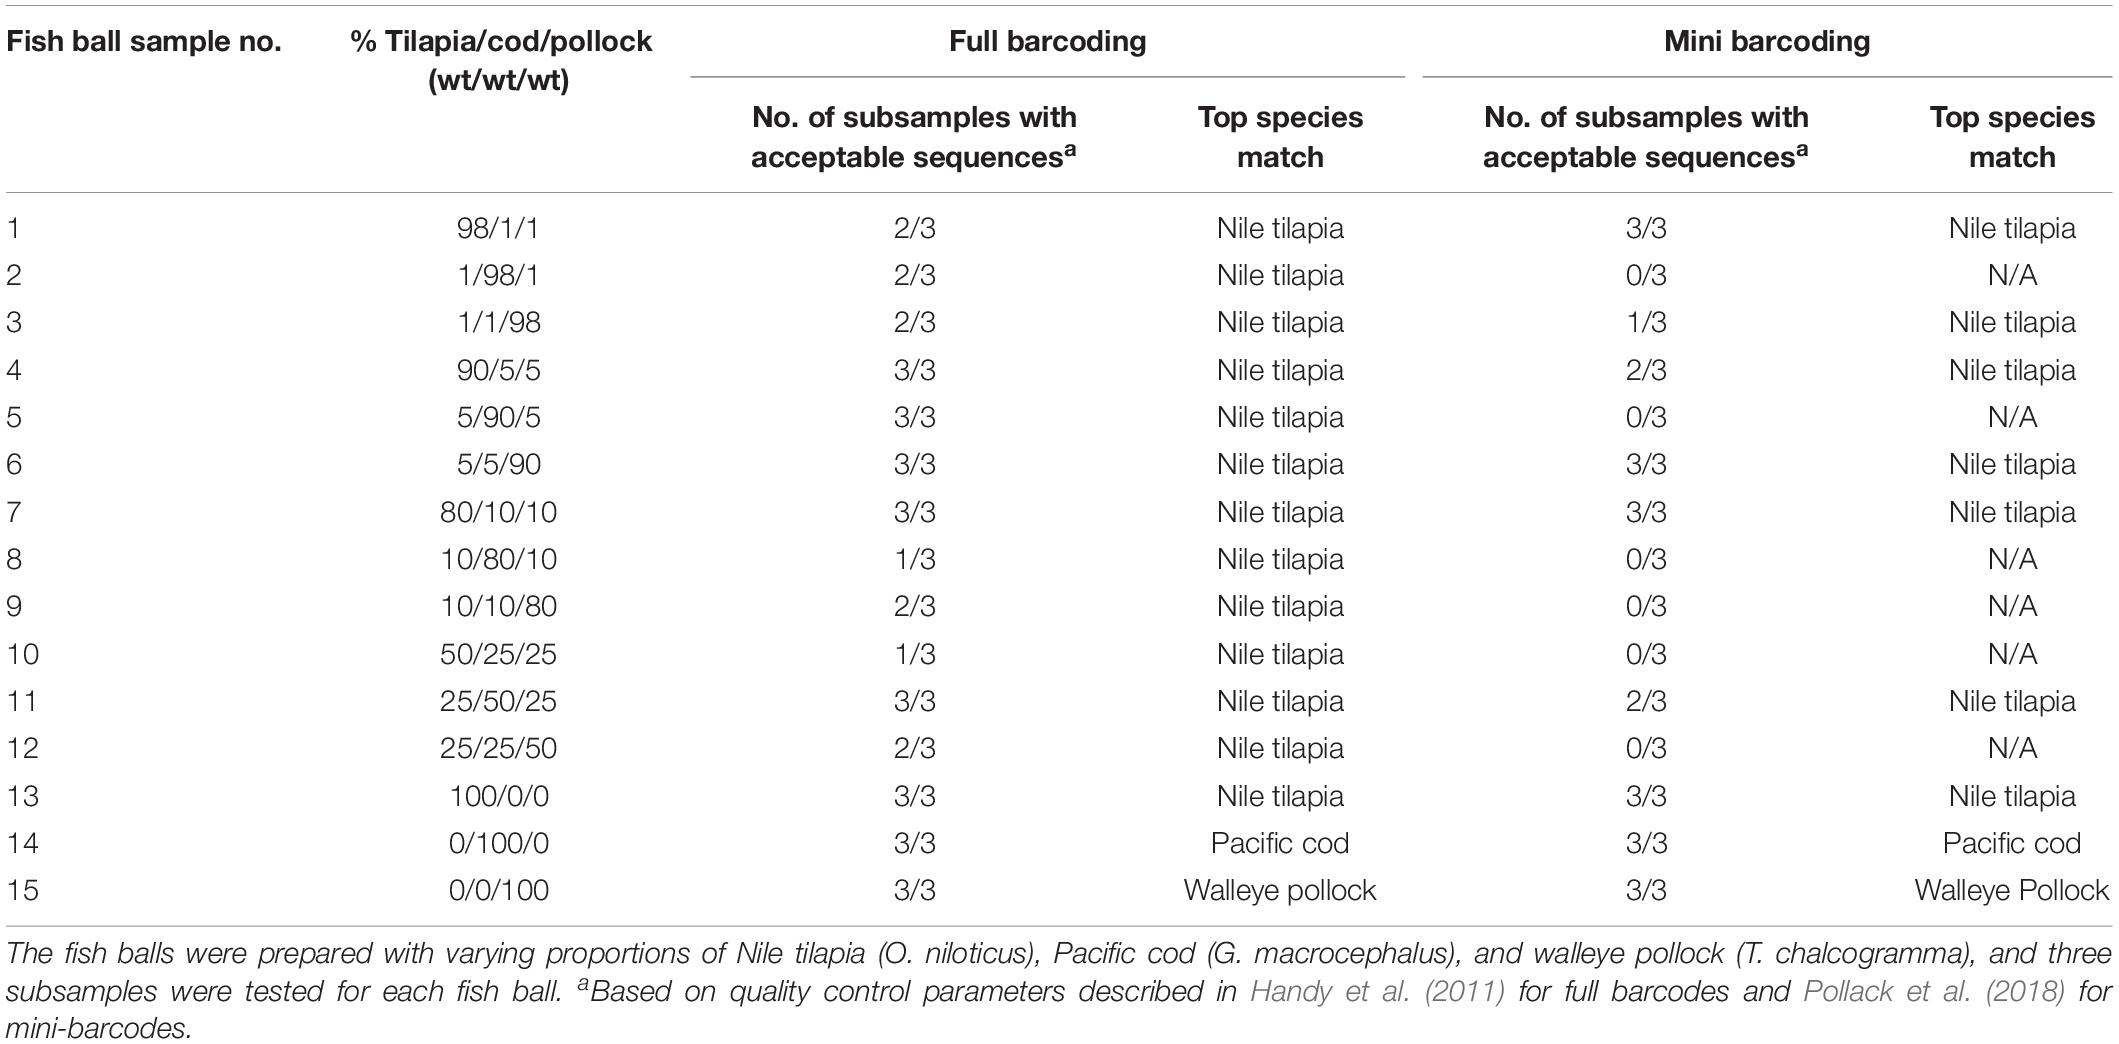
Table 1. Sequencing results for fish ball subsamples tested with standard DNA barcoding techniques (no PCR cloning).
DNA Extraction
Three subsamples from each fish ball underwent DNA extraction using the DNeasy Blood and Tissue Kit (Qiagen, Valencia, CA, United States), Spin-Column protocol, with modifications. The amount of starting tissue was increased to 100 mg. The fish tissue was mixed with 500 μl Buffer ATL and 55.6 μl proteinase K in a 2-ml microcentrifuge tube and then incubated at 56°C for 2 h at 300 rpm using a Thermomixer C (Eppendorf, Hamburg, Germany). Next, equal parts (556 μl) Buffer AL and 95% ethanol were added to the sample tubes and the tubes were vortexed. A portion (177 μl) of each sample was transferred to a DNeasy Mini spin column in a 2 ml collection tube. Samples were centrifuged (8000 × g) for 1 min and the columns were transferred to new collection tubes. The subsequent wash and elution steps were performed as described in Handy et al. (2011). The extracted DNA was stored at −80°C until PCR and DNA sequencing. A reagent negative blank control was included for each set of DNA extractions.
PCR and DNA Sequencing
All DNA extracts underwent PCR and DNA sequencing using both full (655 bp) and mini-barcoding (226 bp) of the CO1 gene. PCR primers (Table 2) were synthesized by Integrated DNA Technologies (Coralville, IA, United States) and a Master Cycler Nexus Gradient Thermal Cycler (Eppendorf) was used to perform PCR. PCR amplification for the SH-E mini-barcode was carried out as described in Pollack et al. (2018) with 16 μL of molecular-grade water, 2.5 μL 10X buffer, 2.5 μL MgCl2 (50 nM), 0.5 μL dNTPs (10 mM), 0.5 μL platinum Taq, 0.5 μL of 10 μM forward primer cocktail, 0.5 μL of 10 μM reverse primer, and 2.0 μL of template DNA (Pollack et al., 2018). The cycling conditions for fish mini-barcoding were: 95°C for 5 min; 35 cycles of 94°C for 40 s, 46°C for one min, and 72°C for 30 s; and a final extension step at 72°C for 5 min (Pollack et al., 2018). PCR for the fish full-barcode was carried out as described in Handy et al. (2011) using 6.25 μL 10% trehalose, 2 μL of molecular-grade water, 1.25 μL 10X PCR Buffer, 0.625 μL of MgCl2 (50 mM), 0.062 μL dNTPs (10 mM), 0.060 μL Platinium Taq (5U/μl), 0.125 μL of 10 μM forward primer, 0.125 μL of 10 μM reverse primer, and 1.0 μL of template DNA. The cycling conditions for fish full barcoding were: 94°C for 2 min; 35 cycles of 94°C for 30 s, 55°C for 40 s, and 72°C for 1 min; and a final extension step at 72°C for 10 min (Handy et al., 2011). PCR product confirmation for full and mini-barcodes was carried out with 2% agarose E-Gels (Invitrogen, Carlsbad, CA, United States) run on an E-Gel iBase (Invitrogen) for 15 min (Pollack et al., 2018). The results were visualized using a FOTO/Analyst Express (Fotodyne, Hartland, WI, United States) and Transilluminator (Fisher Scientific, Waltham, MA, United States) combined with FOTO/Analyst PCImage (version 5.0.0.0, FOTODYNE). Samples with a PCR band correlating to the target region length were considered successfully amplified and prepared for DNA sequencing. PCR products were cleaned using ExoSAP-IT (Affymetrix, Santa Clara, CA, United States) following the manufacturer’s instructions. Next, bi-directional cycle sequencing was carried out using the M13 primers as described in Handy et al. (2011). Sequencing purification was performed using a Performa DTR V3 96-well short plate (Edge Bio, Gaithersburg, MD, United States). Samples underwent sequencing using a 3500xl Genetic Analyzer (Thermo Fisher Scientific, Waltham, MA, United States) with POP-7 polymer (Thermo Fisher Scientific).

Table 2. Primer sets used in this study.
Sequence Analysis
Raw sequence data was assembled and edited using Geneious v.5.4.7 (Biomatters Ldt., Auckland, New Zealand) following steps described in Handy et al. (2011). Full barcodes were only considered acceptable if they met the following quality control (QC) parameters: bi-directional sequences with ≥500 bp and <2% ambiguities or single reads with ≥500 bp and ≥98% high-quality bases (Handy et al., 2011). Mini-barcodes were analyzed using QC parameters described in Pollack et al. (2018), which call for bi-directional sequences that are ≥171 bp and have <2% ambiguities or single reads that are ≥171 bp and have ≥98% high-quality bases. Samples that did not produce an assembled sequence underwent repeat DNA extraction, PCR, and sequencing. PCR amplicons from samples with assembled sequences that did not meet QC parameters were used for PCR cloning, due to the assumption that QC failure was due to the presence of a species mixture. Sequences that passed QC were identified to the species level using the Barcode of Life Database (BOLD) Animal Identification Request Engine2, Species Level Barcode Records. The top species match in BOLD with >98% genetic identity to the query sequence was recorded as the identified species. All sequences obtained in this project were deposited in BOLD (Project Code: AJS). Sequences from each fish species analyzed in this project were uploaded to GenBank (Accession IDs: MN879772, MN879773, and MN879774).
PCR Cloning
Samples with assembled sequences that did not pass QC sequencing parameters were further analyzed through PCR cloning using the Qiagen PCR cloning Kit (Qiagen). Each PCR product (2 μl) was ligated to the commercially prepared Qiagen pDrive A/U cloning vector (1 μl) with 2x buffer (5 μl) and nuclease free water (2 μl) for 2 h at 4°C. Next, the ligations were transformed into E. coli competent cells with the addition of 2 μl of ligation-reaction mixture to QIAGEN EZ Competent Cells (Qiagen). This mixture was incubated on ice for 5 min, heated at 42°C for 30 s, and then incubated on ice for 2 min. Next, 250 μl of SOC broth was vortexed in each tube and 100 μl of the sample was plated on Luria Bertani agar containing ampicillin, X-Gal, and Isopropyl B-D-1 thiogalactopyranoside (IPTG). The plates were incubated at 37°C overnight. Next, white colonies bearing PCR strand inserts were transferred to fresh Trypticase Soy Broth with 0.6% Yeast Extract (TSBYE) broth. A plasmid mini-prep was performed on 10 independent plasmid clones for each sample, which served as the template for DNA sequencing. Prior to sequencing, each plasmid clone underwent a restriction digest that included 10 μl plasmid, 2.0 μl 10X buffer, 0.5 μl EcoRI, and 7.5 μl molecular grade H2O incubated in a 37°C water bath for 2 h. The digested plasmids were then mixed with loading dye (5 μl) and 10 μl was pipetted to the appropriate wells of a 2% agarose E-gel to confirm that PCR inserts were still present. If individual cloned isolates did not have PCR inserts, additional clones were selected for a total of 10 PCR bearing clones. Plates with additional white colonies were stored at 4°C in case additional clones needed to be selected for analysis. Ten individual plasmid templates were DNA sequenced in the forward and reverse direction using T7 and SP6 primers, respectively. The raw sequences were analyzed, and top species matches were identified as described above in the “Sequence analysis” section.
In silico Primer Analysis
Based on the results of DNA barcoding, the full and mini-barcode primers were examined in silico for their potential to preferentially amplify Nile tilapia over the other two species tested in this study. All available COI gene sequences from complete mitochondrial genomes were downloaded from GenBank for Nile tilapia (Accession IDs:NC_013663, GU238433, GU370126, GU477624-GU477628), Pacific cod (Accession IDs: AP017650, KY296294, NC_036931) and walleye pollock (NC_004449, MH018252, AB094061, and AB182300-AB182308). The sequences were aligned in Geneious using MUSCLE. The nucleotides in the primer-binding regions of each sequence were examined for mismatches with the primer sequences shown in Table 2.
Results and Discussion
Standard Full Barcoding Without PCR Cloning
As shown in Table 1, standard full-barcoding identified Nile tilapia in all 12 of the mixed-species fish ball samples and correctly identified each of the three fish species in the single-species fish ball samples. However, walleye pollock and Pacific cod were not identified in any of the mixed-species fish balls. The average length of the full barcodes that passed quality control was 650 bp, with a range of 558–655 bp (Table 3). The sequence quality and percent ambiguities averaged 77.9 and 0.49%, respectively. The overall percent of mixed-species subsamples with a species identification (tilapia) was 75.0% (27 of 36), ranging from 33.3% (1 of 3 subsamples) to 100% (3 of 3 subsamples) for individual fish balls. Similarly, Galal-Khallaf et al. (2016) reported a relatively low sequencing rate (45%) for surimi-based mixed fish products. This low rate may be attributed to multiple species producing peaks in a chromatogram during sequencing (Galimberti et al., 2013). In comparison, Pollack et al. (2018) reported a full barcoding sequencing rate of 90% for single-species fish products processed in a variety of ways. The variation in sequencing rates among subsamples in the current study may be due to the possibility of slight variations in the fish ball matrix combined with the use of only 100 mg of sample for DNA extraction.
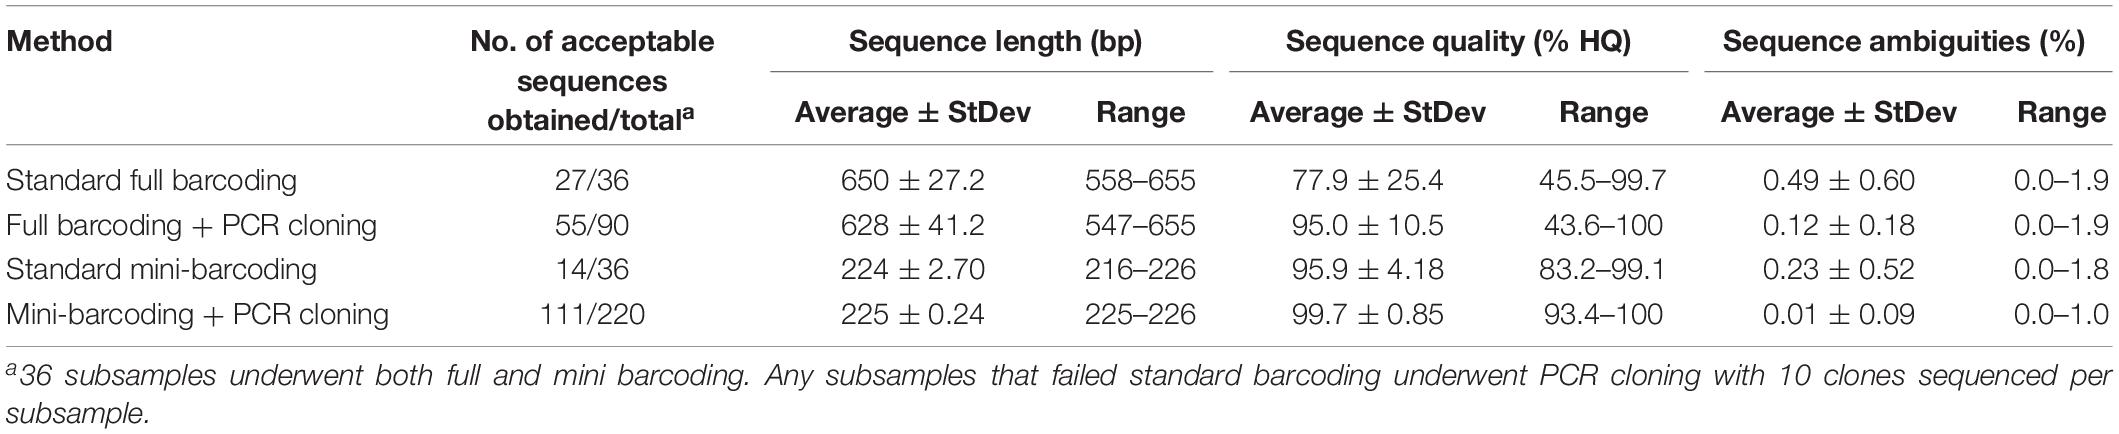
Table 3. Sequencing results of methods assessed for sequencing parameters and quality control.
The consistent detection of only Nile tilapia in all of the mixed-species samples suggests the occurrence of species bias. Bias for a particular species could be due to various factors, including primer bias, mitochondrial copy number differences, and/or genome duplications or insertions of the COI gene. The full barcode primers used in the current study were able to detect Pacific cod and walleye pollock in the single-species fish balls (sample nos. 14–15) and have previously demonstrated the ability to detect these species in single-species processed fish products (Di Pinto et al., 2013; Pollack et al., 2018). Given that this primer set is known to be effective in identifying these fish species, the inability to identify them in mixed-species fish balls suggests the possibility of preferential primer binding to Nile tilapia. Primer bias has not previously been reported with these specific primers; however, it has been reported for DNA barcoding of mixed-fish products using NGS techniques with the cytochrome b gene, in which an overrepresentation of skipjack tuna was identified (Kappel et al., 2017). Primer bias has also been reported to be a problem in other studies involving DNA barcoding, such as DNA metabarcoding research involving macroinvertebrates (Elbrecht and Leese, 2015; Deiner et al., 2017; Elbrecht and Leese, 2017).
Due to the possibility of primer bias in the current study, an in silico analysis was carried out to examine the potential for the full and mini-barcode primers to preferentially amplify Nile tilapia. The results of the analysis showed very few mismatches when comparing the primer sequences to each species and there was no apparent explanation for the bias observed in this study (Figure 1). When the results for all four primers were combined, Nile tilapia showed the greatest number of mismatches (n = 3) with the primer sequences, followed by walleye pollock (n = 1 or 2, depending on haplotype), and Pacific cod (n = 1). Furthermore, none of the mismatches observed with the primers occurred within the first 5 nucleotides of the 3′ end. These results suggest that the bias observed for Nile tilapia may have been due to biological factors, such as differences in mitochondrial copy number or insertions/duplications of the COI gene (Brown, 2008). Analytical bias for a particular species can lead to a misinterpretation of the actual composition of a mixed-species product and could be a concern for regulators and consumers. Future research should be carried out to investigate the likelihood of species bias in mixed products across a wider range of commercial fish species.
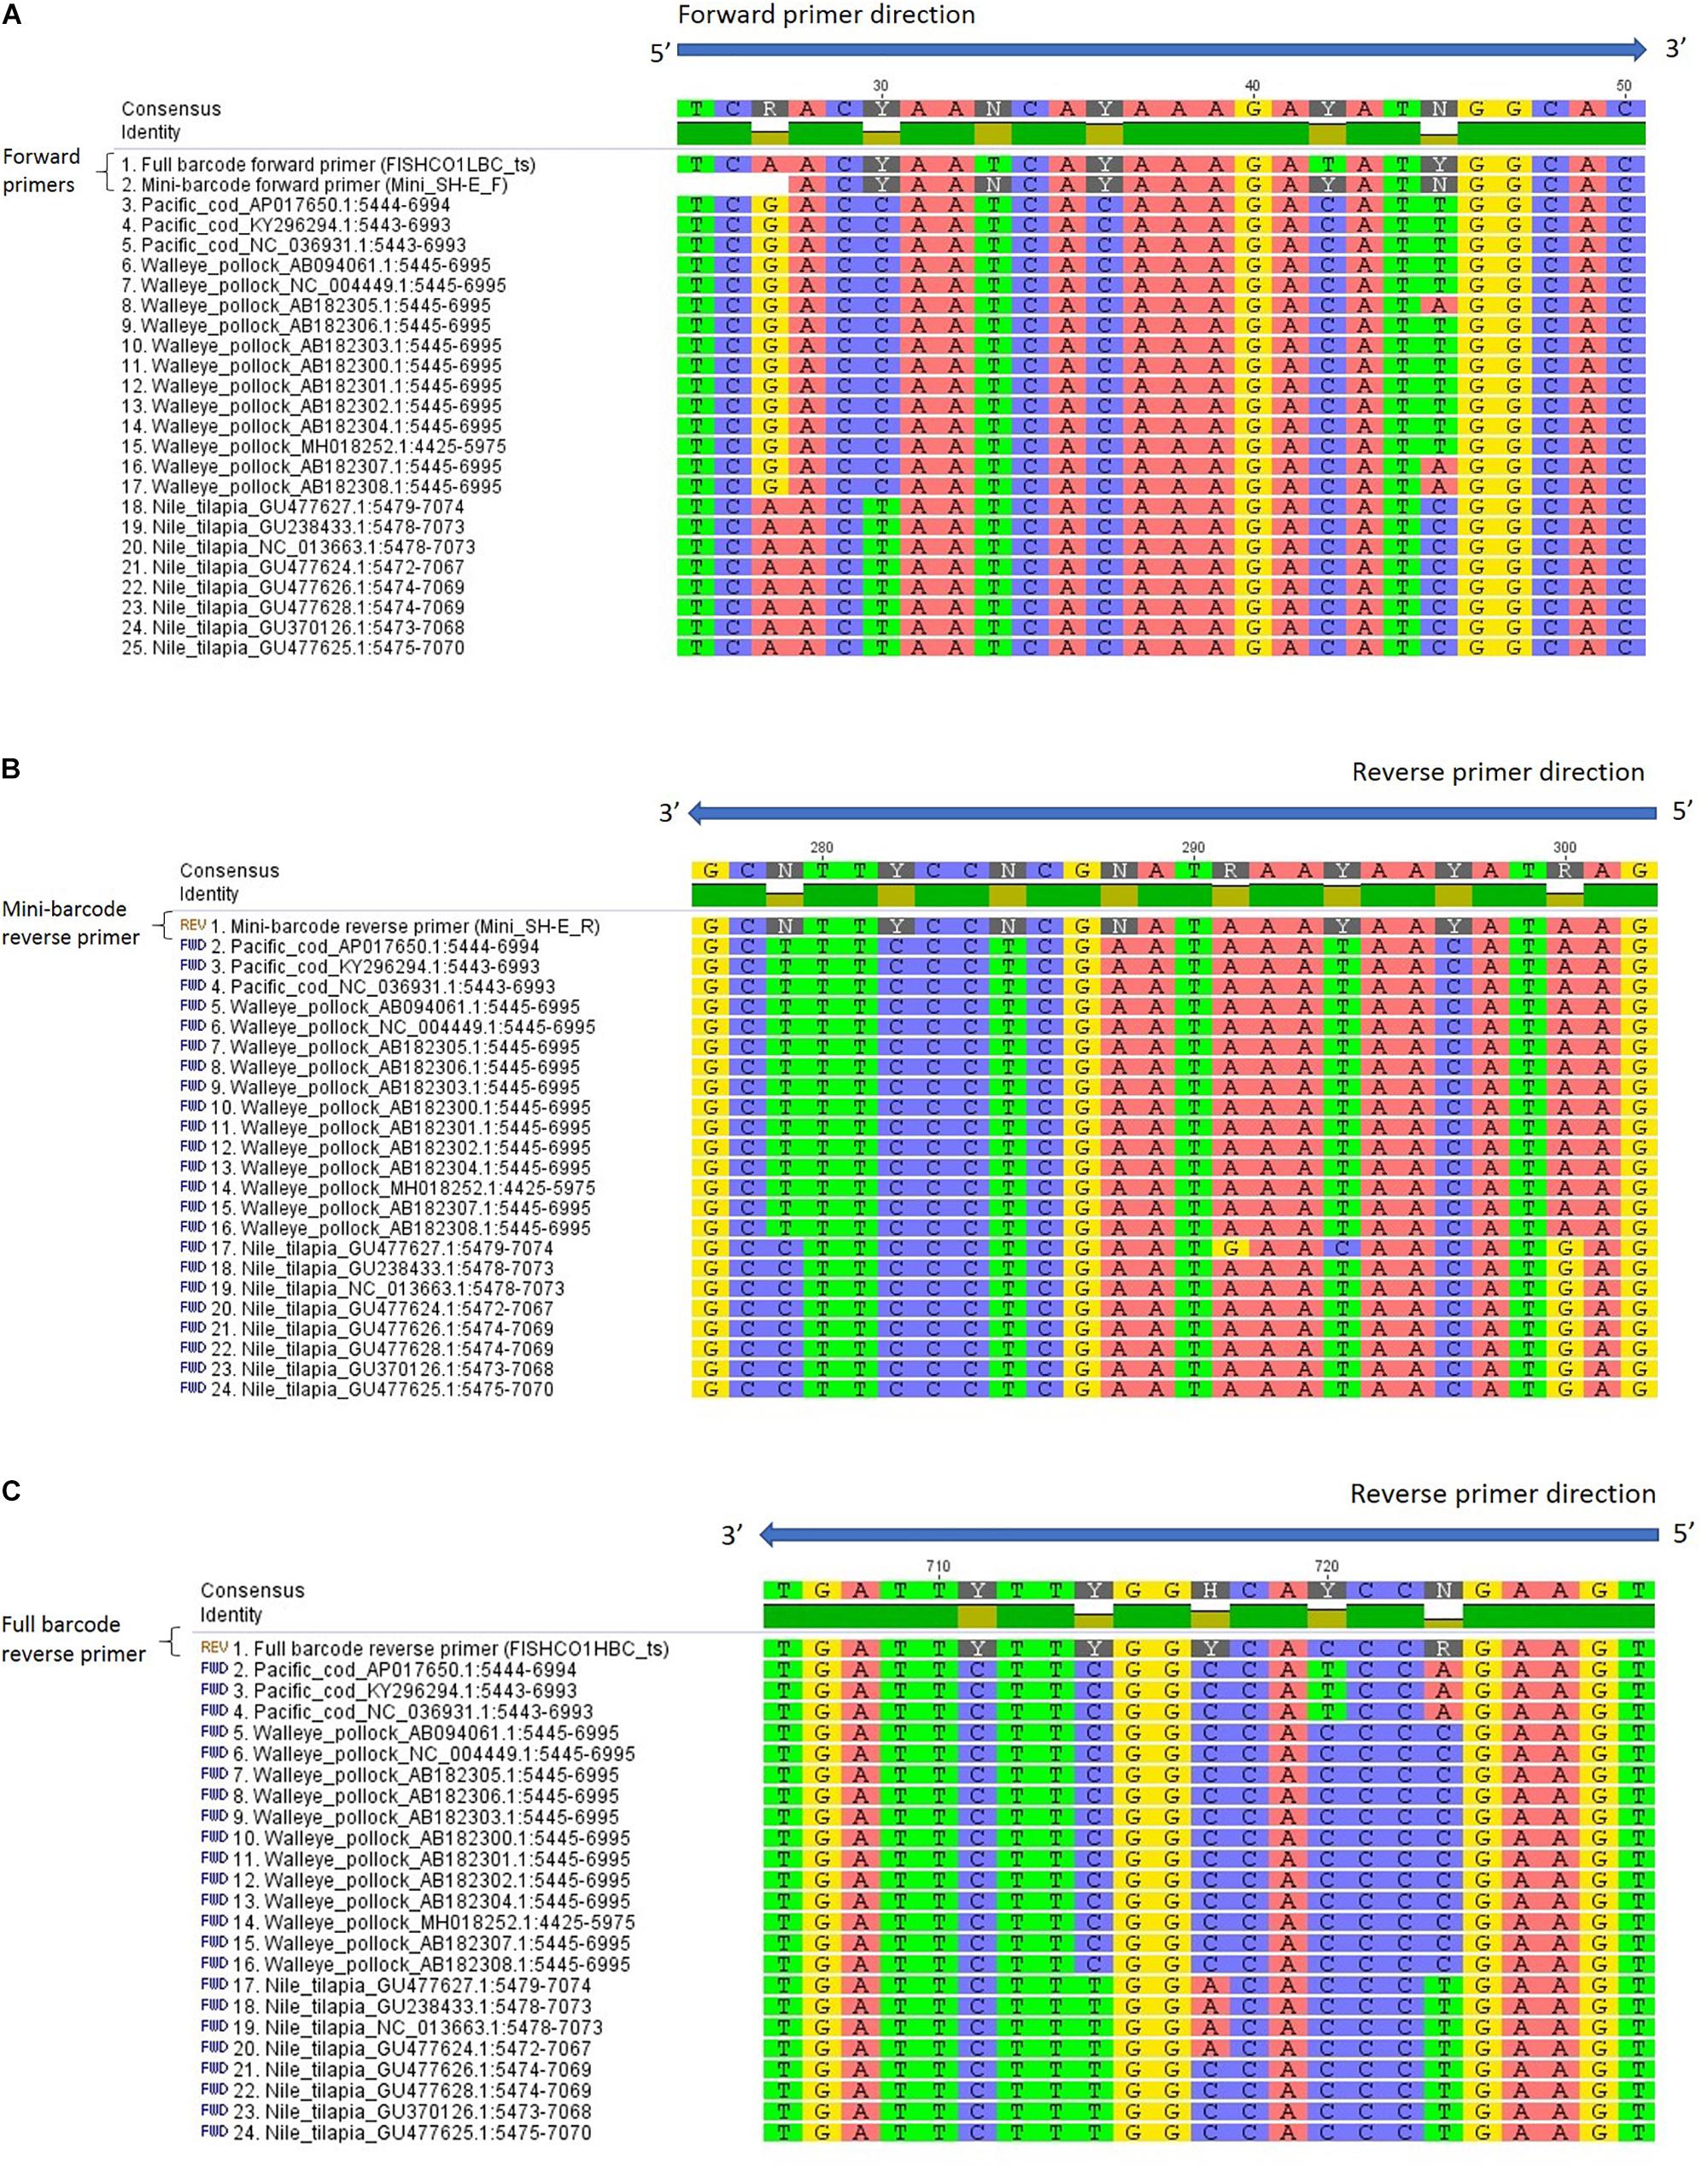
Figure 1. Reference sequences from GenBank aligned with (A) mini SH-E and full-barcode forward primers, (B) mini SH-E reverse primer (reverse complement), and (C) full barcode reverse primer (reverse complement). The sequences were aligned in Geneious using MUSCLE and are shown in the 5′ to 3′ orientation. Primers are shown without the M13 tails and inosine is represented by an “N” in the primer sequence.
PCR Cloning Combined With Full Barcoding
The nine fish ball subsamples that did not generate acceptable sequences with standard full barcoding were partially identified through PCR cloning and DNA sequencing (Table 4). Out of the 90 clones sequenced, 55 (61%) had sequences that passed quality control parameters according to Handy et al. (2011). These sequences had an average full-barcode length of 639 bp, average sequence quality of 95.0%, and average ambiguities of 0.12% (Table 3). The percentage of clones from each subsample with acceptable sequences ranged from 40% (4 of 10) to 100% (10 of 10). The subsamples with the highest percentage of a single fish (e.g., 98/1/1%) had the highest average sequencing rate, at 70%. Subsamples with 80% of a single fish (e.g., 10/80/10%) had an average sequencing rate of 67% and subsamples in which no fish was present at >50% (e.g., 50/25/25%) had the lowest average sequencing rate, at 43% (Table 4).
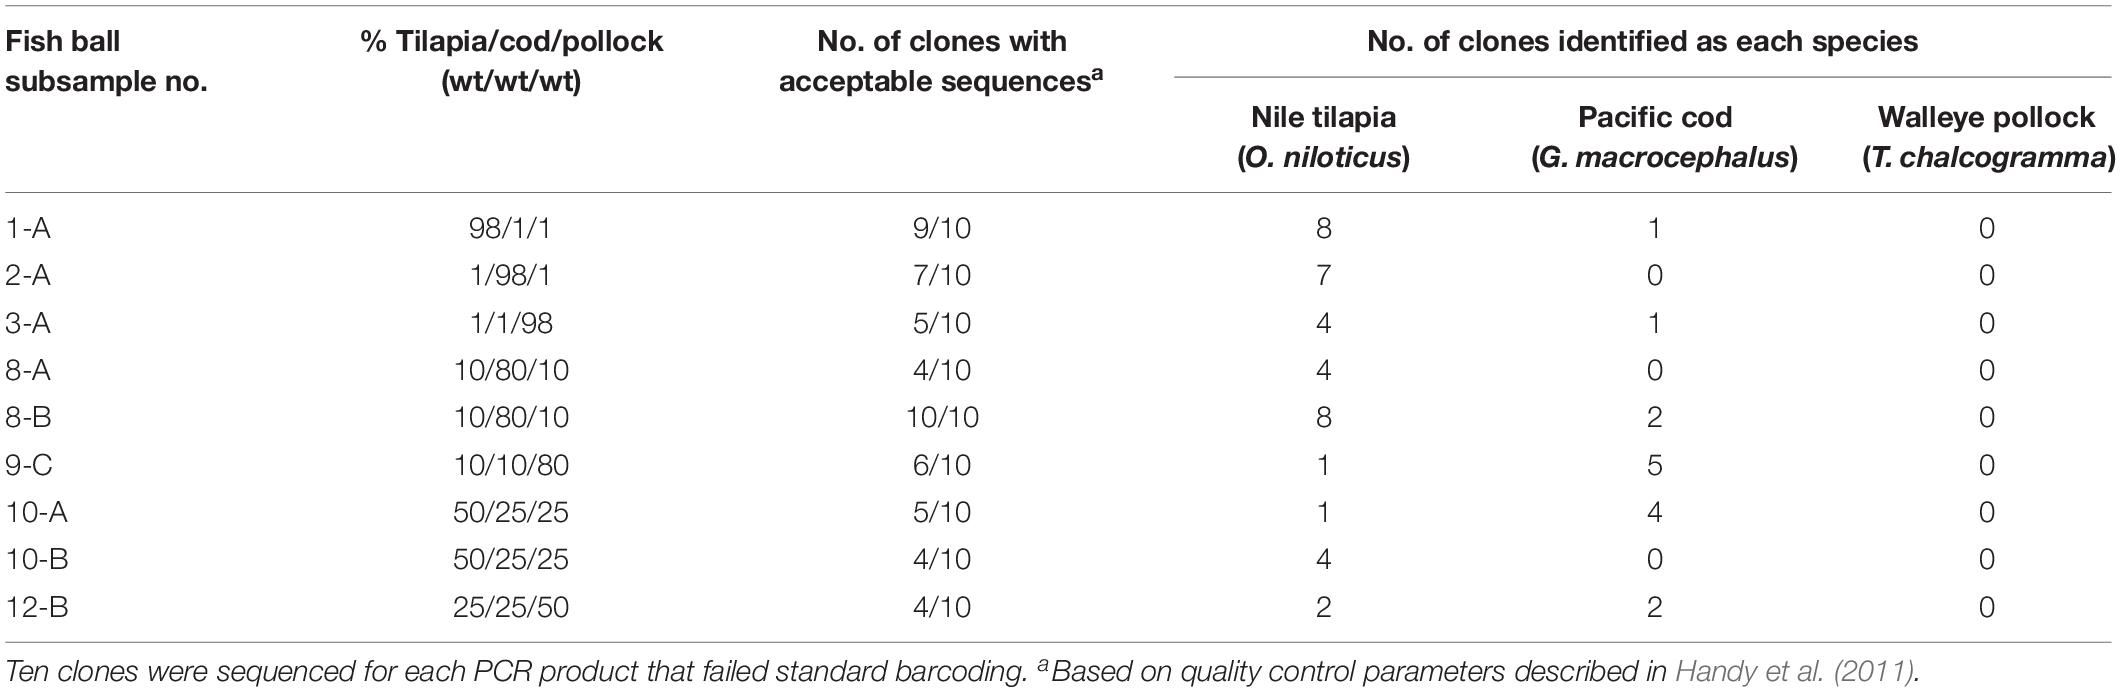
Table 4. Sequencing results for fish ball subsamples that underwent PCR cloning and full DNA barcoding after failing standard full barcoding.
As shown in Table 4, Nile tilapia was identified in all nine subsamples tested with PCR cloning, Pacific cod was identified in six of the subsamples, and walleye pollock was not identified in any of the subsamples. All species-level identifications showed high genetic similarity (≥99.6%) to sequences in BOLD. Overall, the combination of results from standard full barcoding and PCR cloning combined with full barcoding enabled identification of Nile tilapia in all 12 mixed-species fish balls and identification of Pacific cod in 6 of 12 mixed-species fish balls.
Interestingly, there was no correlation between the percentage of each fish in a mixture and the percentage of identifications for that species among the ten clones sequenced. For example, subsample 8-B contained 80% Pacific cod, 10% walleye pollock., and 10% Nile tilapia; however, the sequencing results showed Nile tilapia identifications for 80% of the 10 clones, and Pacific cod identifications for 20% of the clones. This discrepancy is likely a continued effect of the species bias observed with standard DNA barcoding combined with the low number of clones sequenced per subsample. Although PCR cloning enables detection of individual species within mixtures, it is still reliant on the initial PCR amplification step to capture the amplicons representing each species. Bias for Nile tilapia over Pacific cod and walleye pollock during the initial PCR amplification step likely led to a greater number of Nile tilapia amplicons available for the subsequent cloning procedure. While it is possible that sequencing a higher number of clones may result in a more accurate representation of the species present, the matter of bias would also need to be reconciled.
Standard Mini-Barcoding Without PCR Cloning
Standard mini-barcoding identified Nile tilapia in 6 of the 12 mixed-species fish ball samples and correctly identified each of the three fish species in the single-species fish ball samples (Table 1). Similar to the results of full barcoding, mini-barcoding did not allow for identification of walleye pollock or Pacific cod in any of the mixed-species fish balls. This is likely due to the species bias described above. The mini-barcodes that passed quality control had an average sequence length of 224 bp, average sequence quality of 95.9% and average ambiguities of 0.23% (Table 3). The overall percent of mixed-species subsamples with a species identification (tilapia) was 38.9% (14 of 36), which is lower than that obtained for full barcoding (75.0%). The identification of a fewer number of samples with mini-barcoding as compared to full barcoding may actually be advantageous when working with mixed-species products. This is because sequencing failure is an indication that there may be more than one species in the product, among other things. A sample that fails to be identified with standard barcoding techniques could be flagged for additional analysis while it is likely that additional testing would not be carried out on a sample with a single species identified. This is concerning for the fish product testing sector due to the potential for misinterpretation of results. For example, in this study, 75% of full barcoding subsamples and 38.9% of mini barcoding subsamples produced high quality sequences and were incorrectly identified as 100% tilapia. The misidentification of species composition in a fish product could lead to serious issues, such as non-detection of fish associated with health risks, unwarranted fines for improper labeling, and inaccurate market data regarding the types of fish that are harvested and consumed. In order to enable proper identification of species composition, additional research should be carried out to determine the most appropriate technique for the analysis of mixed-species fish samples.
PCR Cloning Combined With Mini-Barcoding
Among the 22 mini-barcode subsamples that did not pass traditional sequencing, 21 were partially identified with PCR cloning and DNA sequencing (Table 5). Out of the 220 clones tested, 111 (50.5%) passed quality control parameters according to Pollack et al. (2018). These sequences had an average mini-barcode length of 225 bp, average sequence quality of 99.7%, and average ambiguities of 0.01% (Table 3). Interestingly, the subsamples in which all three species of fish were present at ≥25% (e.g., 50/25/25%) had the highest average sequencing rate (77%) and the subsamples with fish at levels as low as 1% (e.g., 98/1/1%) had the lowest average sequencing rate (36%). Similar to the results for PCR cloning of full barcodes, both Pacific cod and Nile tilapia were identified in the mixed-species subsamples. Nile tilapia was detected in the highest number of subsamples (n = 18), while Pacific cod was detected in 16 subsamples (Table 5). Both species showed high genetic similarity (99.1–100%) to sequences in BOLD. However, consistent with the full barcode cloning results of this study, walleye pollock was not identified in any of the mixed-species subsamples. Overall, the combination of standard mini-barcoding and PCR cloning combined with mini-barcoding enabled identification of Nile tilapia in all 12 mixed-species fish balls and identification of Pacific cod in 9 of 12 (75%) of mixed-species fish balls.
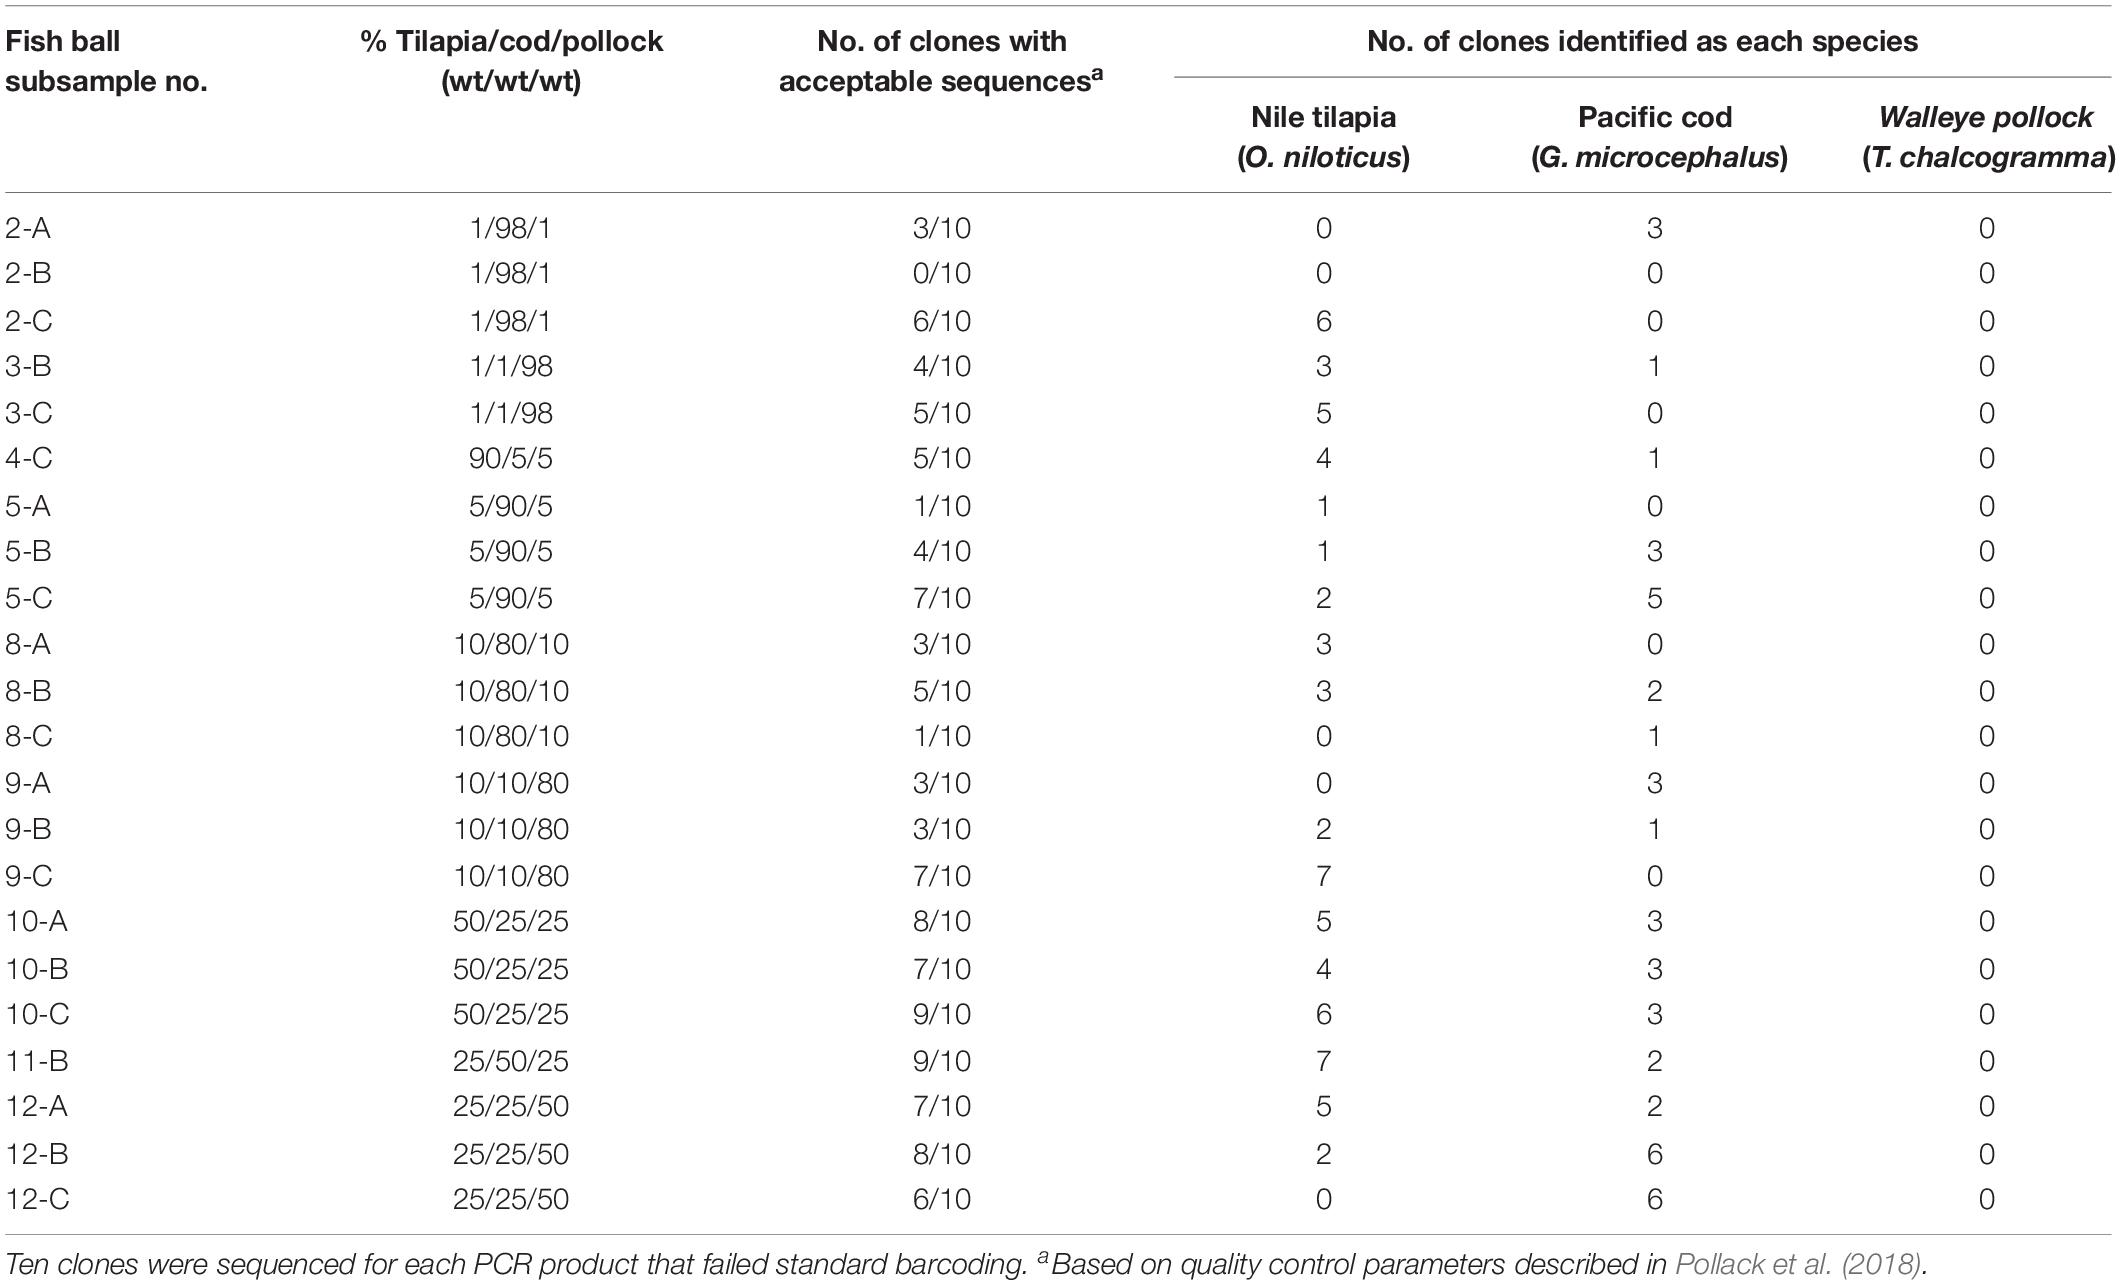
Table 5. Sequencing results for fish ball subsamples that underwent PCR cloning and mini-barcoding after failing standard mini-barcoding.
The percent of clones that passed for full barcode cloning was higher (61%) compared to mini barcode cloning (50.5%). There was no correlation between the percentage of each fish in a mixture and the percentage of identifications for that species among the ten clones sequenced. For example, mixture 10-C, which consisted of 50% walleye pollock, 25% Nile tilapia, and 25% Pacific cod, was indicated by sequencing to be 78% Nile tilapia, 22% Pacific cod, and 0% walleye pollock.
Conclusion
Overall, this study revealed the ability of PCR cloning combined with DNA barcoding to identify multiple fish in a mixed-species sample; however, this technique was unable to identify all fish species present. While only one species (Nile tilapia) was identified in mixed-species fish balls using standard DNA barcoding techniques, PCR cloning of the DNA barcode enabled the identification of a second species (Pacific cod) in 50% of fish balls tested with the full barcode and 75% of fish balls tested with the mini-barcode. However, none of the techniques was able to identify the presence of walleye pollock in any of the fish balls. Furthermore, PCR cloning was unable to identify the composition of specific ratios of each fish in the mixture. While the results of this study suggest the occurrence of species bias, additional research is needed to investigate this further. Additional research is also needed to determine whether alternative primer sets would improve detection rates for fish species using the techniques described in this study. The results from this study indicate a concern with the use of standard DNA barcoding for the analysis of mixed-species samples, as the identification of only one of the species within the mixture could be misleading. Therefore, the feasibility of using additional techniques such as PCR cloning or next-generation sequencing for the routine analysis of mixed-species samples should be explored further, including an assessment of the costs and labor involved.
Data Availability Statement
The datasets generated for this study can be found in the BOLD Systems; Project Code AS; http://www.boldsystems.org/.
Author Contributions
DW-H, MK, RH, and AS designed the study. AS and MK performed the laboratory work. AS, RH, and MK conducted analysis of the data and prepared the manuscript.
Funding
Materials for this study were provided by the FDA and Chapman University. This research did not receive any specific grant from funding agencies in the public, commercial, or not-for-profit sectors.
Conflict of Interest
The authors declare that the research was conducted in the absence of any commerical or financial relationships that could be construed as a potential conflict of interest. The views in this publication represent those of the authors themselves and do not represent the views of the U.S. Food and Drug Administration. The inclusion of specific trade names or technologies does not imply endorsement by the U.S. Food and Drug Administration nor is criticism implied of similar commercial technologies not mentioned within.
Acknowledgments
The authors would like to thank Rachel Isaacs for editorial assistance. Materials for this study were provided by the FDA and Chapman University.
Footnotes
References
Armani, A., Guardone, L., La Castellana, R., Gianfaldoni, D., Guidi, A., and Castigliego, L. (2015). DNA barcoding reveals commercial and health issues sold on the Italian market in ethnic seafood. Food Control 55, 206–214. doi: 10.1016/j.foodcont.2015.02.030
Brown, K. H. (2008). Fish mitochondrial genomics: sequence, inheritance and functional variation. J. Fish Biol. 72, 355–374. doi: 10.1111/j.1095-8649.2007.01690.x
Bruni, I., Galimberti, A., Caridi, L., Scaccabarozzi, D., Mattia, F. D., Casiraghi, M., et al. (2015). A DNA barcoding approach to identify plant species in multiflower honey. Food Chem. 170, 308–315. doi: 10.1016/j.foodchem.2014.08.060
Carvalho, D. C., Guedes, D., Gloria Trindade, M. D., Sartori Coelho, R. M., and de Lima Araujo, P. H. (2017a). Nationwide Brazilian governmental forensic programme reveals seafood mislabelling trends and rates using DNA barcoding. Fish. Res. 191, 30–35. doi: 10.1016/j.fishres.2017.02.021
Carvalho, D. C., Palhares, R. M., Drummond, M. G., and Gadanho, M. (2017b). Food metagenomics: next generation sequencing identifies species mixtures and mislabeling within highly processed cod products. Food Control 80, 183–186. doi: 10.1016/j.foodcont.2017.04.049
Deagle, B. E., Tollit, D. J., Jarman, S. N., Hindell, M. A., Trites, A. W., and Gales, N. J. (2005). Molecular scatology as a tool to study diet: analysis of prey DNA in scats from captive Steller sea lions. Mol. Ecol. 14, 1831–1842. doi: 10.1111/j.1365-294x.2005.02531.x
Deiner, K., Bik, H. M., Machler, E., Seymour, M., Lacoursiere-Roussel, A., Altermatt, F., et al. (2017). Environmental DNA metabarcoding: transforming how we survey animal and plant communities. Mol. Ecol. 26, 5872–5895. doi: 10.1111/mec.14350
Di Pinto, A., Di Pinto, P., Terio, V., Bozzo, G., Bonerba, E., Ceci, E., et al. (2013). DNA barcoding for detecting market substitution in salted cod fillets and battered cod chunks. Food Chem. 141, 1757–1762. doi: 10.1016/j.foodchem.2013.05.093
Donne-Gousse, C., Laudet, V., and Hanni, C. (2005). Method for Determining the Existence of Animal or Vegetable Mixtures in Organic Substances. Alexandria, VA: U.S. Geological Survey.
Elbrecht, V., and Leese, F. (2015). Can DNA-based ecosystem assessments quantify species abundance? testing primer bias and biomass-sequence relationships with an innovative metabarcoding protocol. PLoS One 10:e0130324. doi: 10.1371/journal.pone.0130324
Elbrecht, V., and Leese, F. (2017). Validation and development of COI metabarcoding primers for freshwater macroinvertebrate bioassessment. Front. Environ. Sci. 5:11. doi: 10.3389/fenvs.2017.00011
FAO (2018). The State of World Fisheries and Aquaculture 2018. Contributing to Food Security and Nutrition For All. Rome: Food and Agriculture Organization of the United Nations.
Galal-Khallaf, A., Ardura, A., Borrell, Y. J., and Garcia-Vazquez, E. (2016). Towards more sustainable surimi? PCR-cloning approach for DNA barcoding reveals the use of species of low trophic level and aquaculture in Asian surimi. Food Control 61, 62–69. doi: 10.1016/j.foodcont.2015.09.027
Galimberti, A., De Mattia, F., Losa, A., Bruni, I., Federici, S., Casiraghi, M., et al. (2013). DNA barcoding as a new tool for food traceability. Food Res. Int. 50, 55–63. doi: 10.1016/j.foodres.2012.09.036
Handy, S. M., Deeds, J. R., Ivanova, N. V., Hebert, P. D. N., Hanner, R. H., Ormos, A., et al. (2011). A single-laboratory validated method for the generation of DNA barcodes for the identification of fish for regulatory compliance. J. Aoac Int. 94, 201–210.
Kappel, K., Haase, I., Kaeppel, C., Sotelo, C. G., and Schroeder, U. (2017). Species identification in mixed tuna samples with next-generation sequencing targeting two short cytochrome b gene fragments. Food Chem. 234, 212–219. doi: 10.1016/j.foodchem.2017.04.178
Khaksar, R., Carlson, T., Schaffner, D. W., Ghorashi, M., Best, D., Jandhyala, S., et al. (2015). Unmasking seafood mislabeling in US markets: DNA barcoding as a unique technology for food authentication and quality control. Food Control 56, 71–76. doi: 10.1016/j.foodcont.2015.03.007
Murray, D. C., Bunce, M., Cannell, B. L., Oliver, R., Houston, J., White, N. E., et al. (2011). DNA-based faecal dietary analysis: a comparison of qPCR and high throughput sequencing approaches. PLoS One 6:e25776. doi: 10.1371/journal.pone.0025776
Ninan, G., Bindu, J., and Joseph, J. (2010). Frozen storage studies of value-added mince-based products from Tilapia (Oreochromis Mossambicus, Peters 1852). J. Food Process. Preserv. 34, 255–271. doi: 10.1111/j.1745-4549.2009.00379.x
Pardo, M. A., Jimenez, E., and Perez-Villarreal, B. (2016). Misdescription incidents in seafood sector. Food Control 62, 277–283. doi: 10.1016/j.foodcont.2015.10.048
Pollack, S. J., Kawalek, M. D., Williams-Hill, D. M., and Hellberg, R. S. (2018). Evaluation of DNA barcoding methodologies for the identification of fish species in cooked products. Food Control 84, 297–304. doi: 10.1016/j.foodcont.2017.08.013
Rondon, M. R., August, P. R., Bettermann, A. D., Brady, S. F., Grossman, T. H., Liles, M. R., et al. (2000). Cloning the soil metagenome: a strategy for accessing the genetic and functional diversity of uncultured microorganisms. Appl. Environ. Microbiol. 66, 2541–2547. doi: 10.1128/aem.66.6.2541-2547.2000
Shokralla, S., Hellberg, R. S., Handy, S. M., King, I., and Hajibabaei, M. (2015). A DNA mini-barcoding system for authentication of processed fish products. Sci. Rep. 5:15894. doi: 10.1038/srep15894
Stiles, M., Kagan, A., Lahr, H., Pullekines, E., and Walsh, A. (2013). Seafood Sticker Shock: Why You May Be Paying Too Much for Your Fish. Accessed at: www.oceana.org/costofseafoodfraud (accessed March 1, 2019).
Keywords: DNA barcoding, fish mixtures, PCR cloning, species bias, species identification
Citation: Silva AJ, Kawalek M, Williams-Hill DM and Hellberg RS (2020) PCR Cloning Combined With DNA Barcoding Enables Partial Identification of Fish Species in a Mixed-Species Product. Front. Ecol. Evol. 8:28. doi: 10.3389/fevo.2020.00028
Received: 19 September 2019; Accepted: 31 January 2020;
Published: 21 February 2020.
Edited by:
David S. Thaler, Universität Basel, SwitzerlandReviewed by:
Mark Stoeckle, The Rockefeller University, United StatesAndreanna J. Welch, Durham University, United Kingdom
Copyright © 2020 Silva, Kawalek, Williams-Hill and Hellberg. This is an open-access article distributed under the terms of the Creative Commons Attribution License (CC BY). The use, distribution or reproduction in other forums is permitted, provided the original author(s) and the copyright owner(s) are credited and that the original publication in this journal is cited, in accordance with accepted academic practice. No use, distribution or reproduction is permitted which does not comply with these terms.
*Correspondence: Rosalee S. Hellberg, aGVsbGJlcmdAY2hhcG1hbi5lZHU=