 Kenneth Z. McKenna
 Anna M. Kudla
 H. Frederik Nijhout
- 1Division of Biological Sciences, Section of Cellular and Developmental Biology, University of California, San Diego, La Jolla, CA, United States
- 2Department of Biology, Duke University, Durham, NC, United States
The color patterns on the wings of butterflies and moths are among the most complex manifestations of pattern formation in nature. The complexities of these patterns arise from the diversification of a conserved set of homologous elements known as the Nymphalid Ground Plan that can change color, shift position, expand, or disappear altogether. Recent work has shown that the anterior–posterior (AP) axis of the butterfly wing may also have an important role in the development and evolution of wing-pattern diversity. Here we characterize the AP axis by mapping expression domains of key regulatory genes onto the wing. We show that the butterfly wing can be subdivided into four primary regions, with the boundaries of these domains arising at the positions of the M1, M3, and Cu2 wing-veins. We find that the correlation among variation in the border ocelli is strongest for those within the same domain. We show how these domains may be used to determine phenotypic outcomes by surveying the frequency of color boundaries, tail development, and wing shape discontinuities across five major butterfly families: Lycaenidae, Nymphalidae, Papilionidae, Pieridae, and Riodinidae. Of the more than 200 genera we surveyed in this study, color pattern discontinuities emerge most often at the boundary veins M1, M3, and Cu2, and shape discontinuities and tails at veins M3 and Cu2. These findings reveal a hitherto unrecognized mode of evolution of patterning in the Lepidoptera.
Introduction
The color patterns on the wings of butterflies and moths are among the most striking and complex in nature. Although at first glance these patterns may look like random, abstract art, they are in fact composed of a series of discrete characters called pattern elements. Lepidopteran color patterns therefore differ significantly from color patterns of other organisms in that the pattern is composed of an anatomical set of homologs, or ground plan, quite analogous to that of the vertebrate skeletal system (Nijhout, 1991, 2001). This means the same stripe or spot can be found in the same location in all individuals of a species, and can also be traced from species to species and even genus to genus (Nijhout, 1991, 2001). The ground plan is therefore composed of sets of homologous characters, which makes it an ideal system to study the evolution and development of color patterns.
The ground plan for lepidopteran wing color patterns has been best studied in nymphalid butterflies, often referred to as the Nymphalid Ground Plan (NGP; Nijhout, 1991). Each color pattern element is an individuated character in the same way that a bone is an individuated character (Capdevila and Belmonte, 2001). As bones are regionally specified along the proximo-distal (PD) axis of the limb into the zeugopod, stylopod, and autopod, so too are color pattern elements. The NGP is made up of a modular series of bands and spots along the PD axis of the wing that begins proximally with the basal symmetry system (BSS), followed distally by central symmetry system (CSS), and the border symmetry system (BoSS; Figure 1). The BoSS has the most complex pattern element shapes and size and is composed of border ocelli and parafocal elements (Nijhout, 1991, 2017). Distal to this system lie the marginal bands along the distal wing margin (Figure 1). Changes in the size, shape, color, or position of the pattern elements belonging to this structural plan is hypothesized to have produced the enormous diversity of color patterns in butterflies (Nijhout, 1991, 2001, 2017; Otaki, 2012) and possibly even moths (Gawne and Nijhout, 2019).
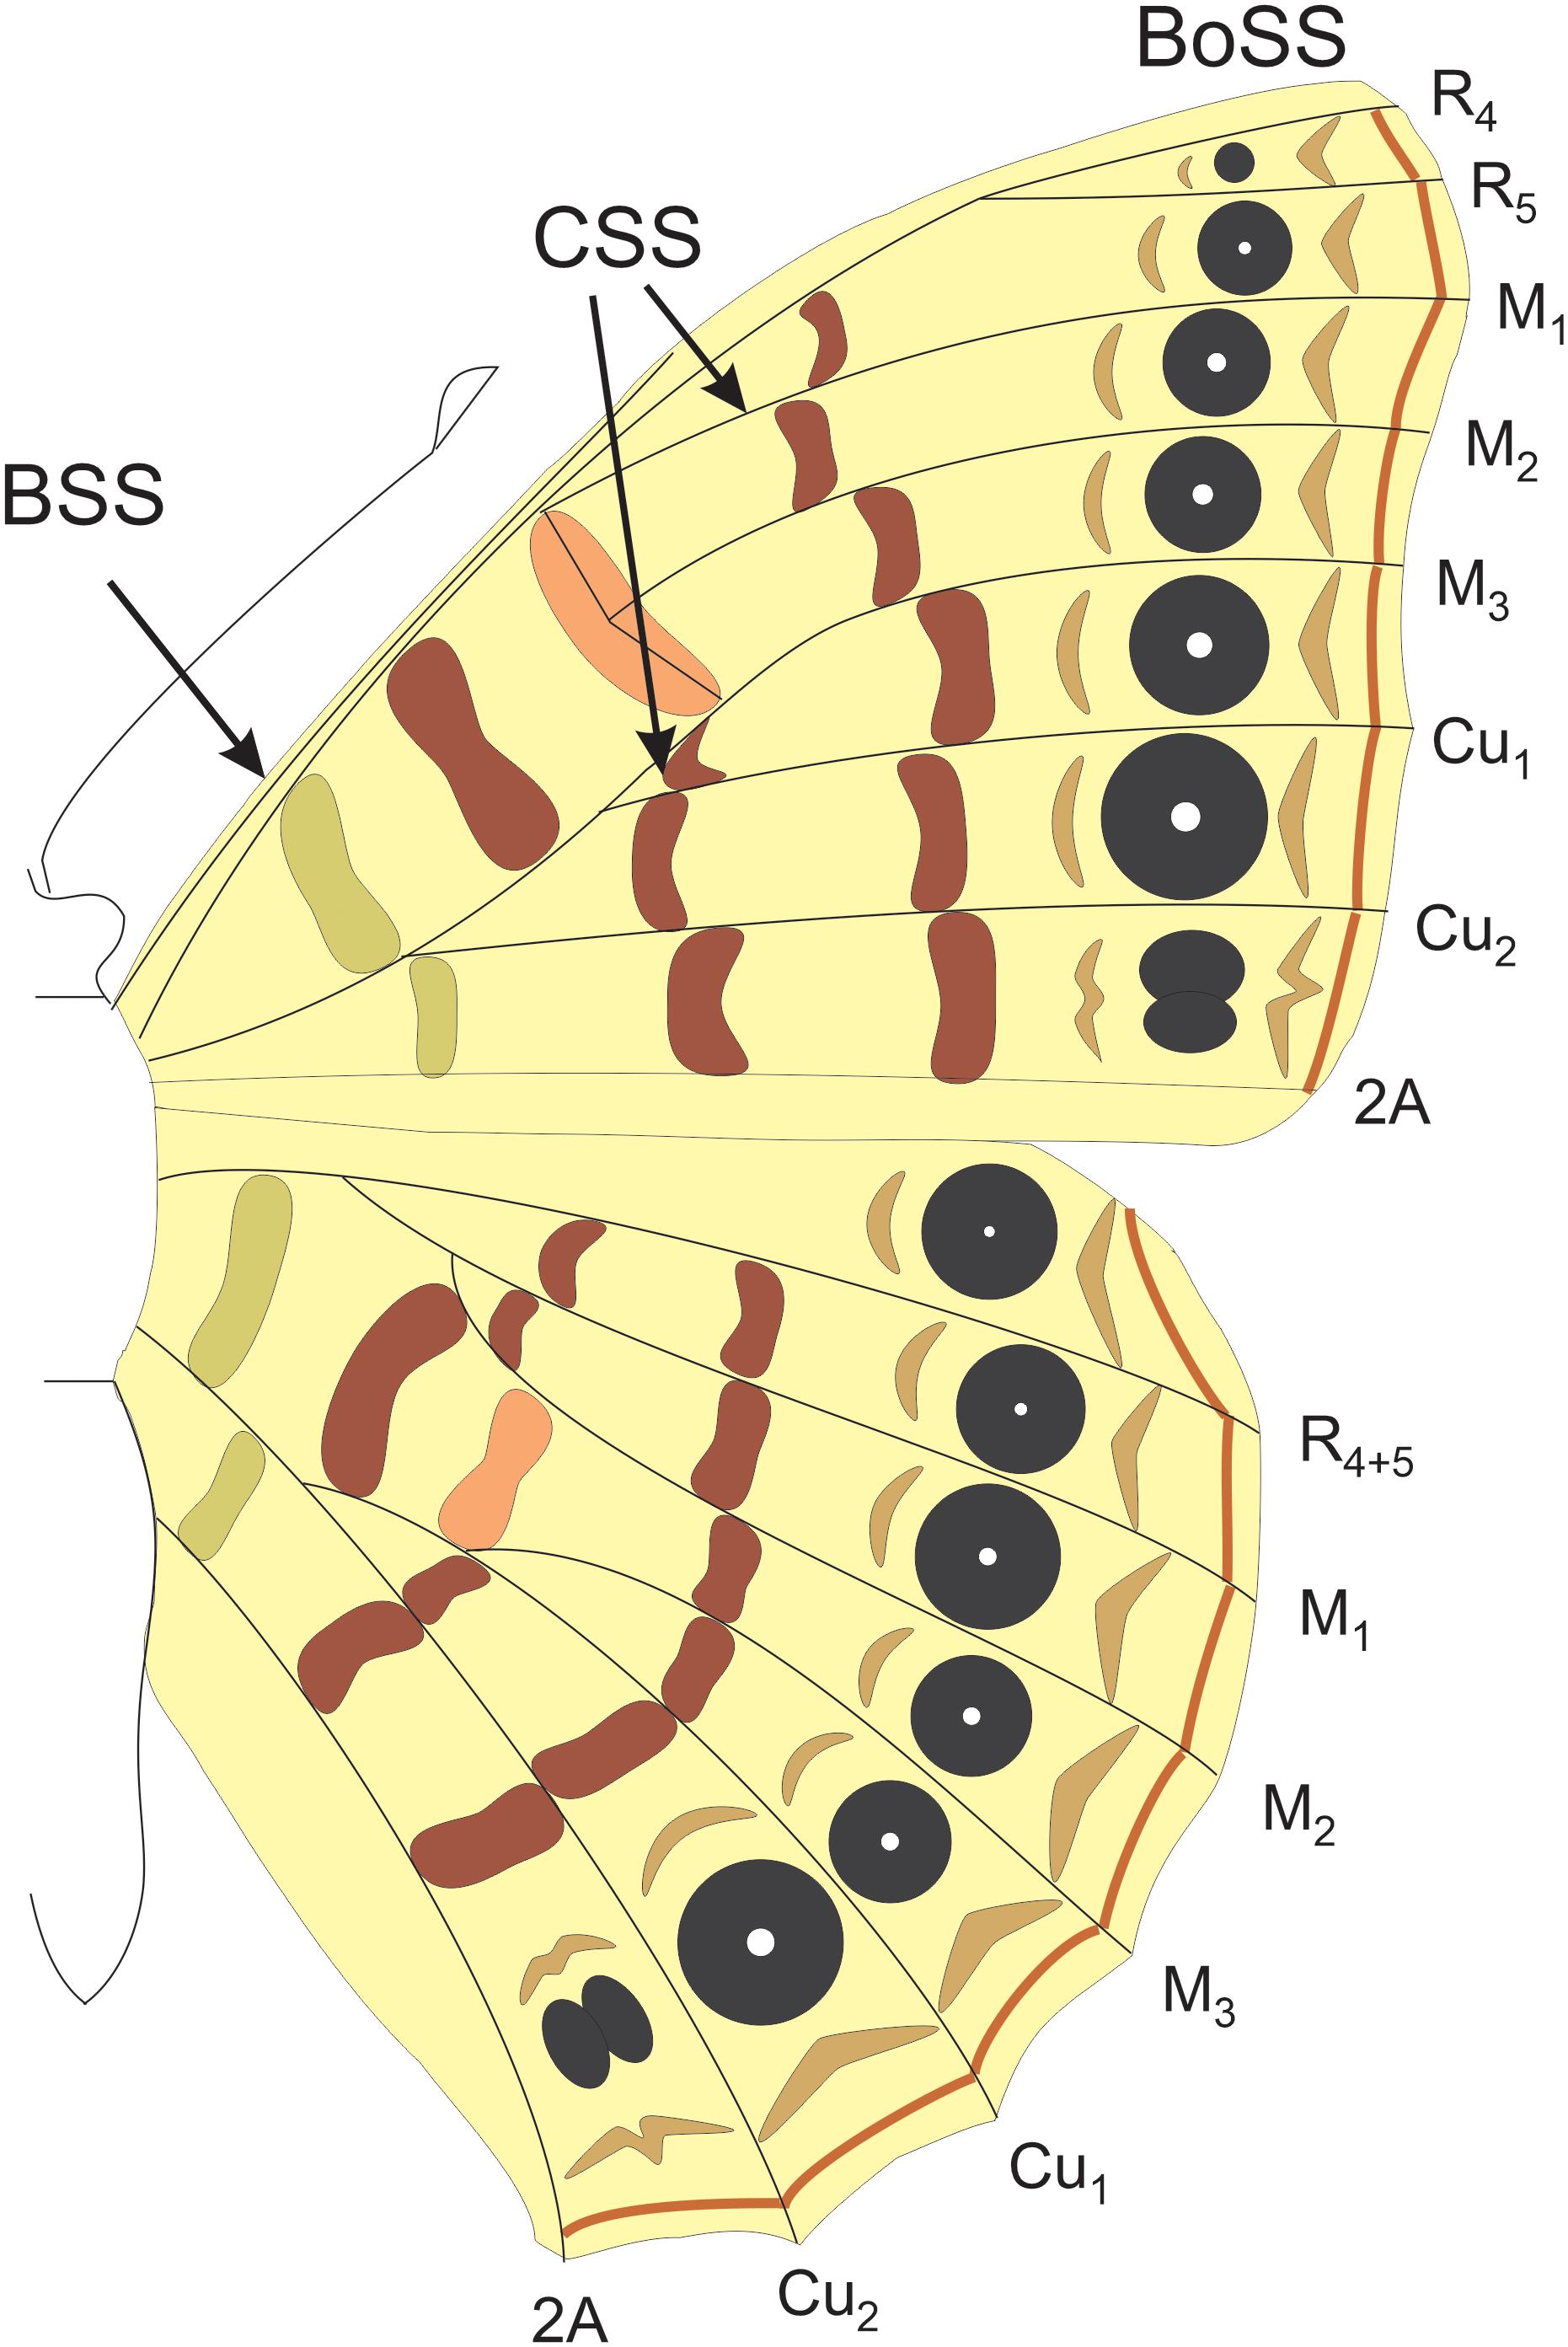
Figure 1. The Nymphalid groundplan. The border symmetry system (BoSS) which includes the border ocelli and parafocal elements. The central symmetry system (CSS) and the basal symmetry system (BSS). Each system is composed of pattern elements that are serially repeated between the wing veins along the anterior–posterior axis of the wing.
Evolutionary change in any of these characteristics of symmetry systems can occur at various positions along the wing. In most cases each band or series of spots is interrupted by wing veins (Nijhout, 1991, 1994). This causes the band to look like a series of short segments that are imperfectly aligned. Developmental studies have shown that each pattern element develops independently within the regions between wing veins referred to as wing cells (Carroll et al., 1994; Panganiban et al., 1994; Keys et al., 1999; Weatherbee et al., 1999; Brunetti et al., 2001; Saenko et al., 2011). Wing veins, and the developmental mechanisms that position them, therefore play an important role in individuating pattern elements along the anterior–posterior (AP) axis.
Thus, the size, shape, and position of a pattern element depends on which wing cell it develops in. A good example of this are the border ocelli, which in some species have been elaborated into eyespots. In Bicyclus anayana, eyespots develop in every wing cell on the hindwing, yet each differs dramatically in size (Brakefield et al., 1996). An artificial selection experiment in Bicyclus demonstrated that the size of eyespots in the anterior portion of the wing can evolve independent of those in the posterior portion of the wing (Beldade et al., 2002; Beldade and Brakefield, 2003; Allen et al., 2008). In Junonia coenia, pattern elements that are farther apart along the AP axis have less correlated variation than elements in the same region (Paulsen and Nijhout, 1993; Paulsen, 1994). Anterior–posterior information may play a key role in the individuation of the pattern elements within a symmetry system, allowing for independent evolution of serially homologous characters and the pattern as a whole (Nijhout, 1991, 1994; Beldade and Brakefield, 2003).
A peculiar feature of the color pattern that occurs in some species is the precise discontinuity of color and shape along the midline of the wing at or near the M3 vein. In many species, the pattern anterior to the M3 vein has a distinctly different look than the pattern posterior to the vein. This manifests in several different ways. The pigmentation of homologous pattern elements may differ on either side of M3, or background pigmentation anterior to M3 may differ from that posterior to this dividing vein. Some have hypothesized that the M3 vein may serve a special function in compartmentalizing color pattern development (Nijhout, 1991; Abbasi and Marcus, 2017, 2019).
The shape of butterfly wings also can have characteristic AP differences on either side of the M3 vein. Several species develop a tail at the M3 vein and an associated distal dislocation of the pattern elements in the M3-Cu1 wing cell (Nijhout, 1991). In others like Hypanartia lethe, the entire wing region posterior to the M3 veins is longer than the region anterior to M3. This size difference is associated with the distal dislocation of color pattern elements posterior to M3.
These common alterations of the ground plan suggest that AP information plays a significant role in the development and evolution of wing color patterns. In this study we aim to uncover trends in the evolution of wing color patterns in butterflies using a comparative approach, with a focus on AP differentiation. We first homologize the regions of the Drosophila and lepidopteran wings in order to establish AP fate maps. We show that the lepidopteran wing is divided into four unique combinatorial expression domains of key regulatory genes, which may facilitate developmental independence. To test the developmental interconnectedness of these domains, we next quantified the degree to which the positioning of border ocelli in each wing cell covaries in Nymphalidae and Satyridae. This analysis suggests that development and evolution of color pattern elements is semi-autonomous in these four domains. We then investigated the role of the M1, M3, and Cu2 veins as pattern boundaries by analyzing color and shape heterogeneity across several butterfly families. Together, these data suggest that AP information serves an important role in butterfly wing color pattern evolution.
Materials and Methods
Border Ocelli Analysis
Border ocelli placement in Satyridae and Nymphalidae was measured and analyzed using high-resolution digital images. Specimens were found in the collections of the Museum of Natural History in London, the Smithsonian National Museum of Natural History, the San Diego Natural History Museum, the Natural History Museum of Los Angeles, and the Nijhout lab’s personal collection. Specimens were photographed with a Nikon D-5300 digital camera with a scale bar. Measurements of wings were done from scaled photographs using the Fiji distribution of ImageJ (Schindelin et al., 2012).
Wing length of forewings and hindwings was measured as the distance from the base of the Radial vein bundle to the tip of the M1 vein. To measure border ocelli placement, a straight line was drawn from the center of each ocellus to the wing margin following the ridge that is present along the midline of each wing cell (Figure 2). To generate correlation heat maps, ocelli distance was normalized to wing length and used JMP Pro to generate correlation matrices. The list of species surveyed are supplied in the Supplementary Data File.
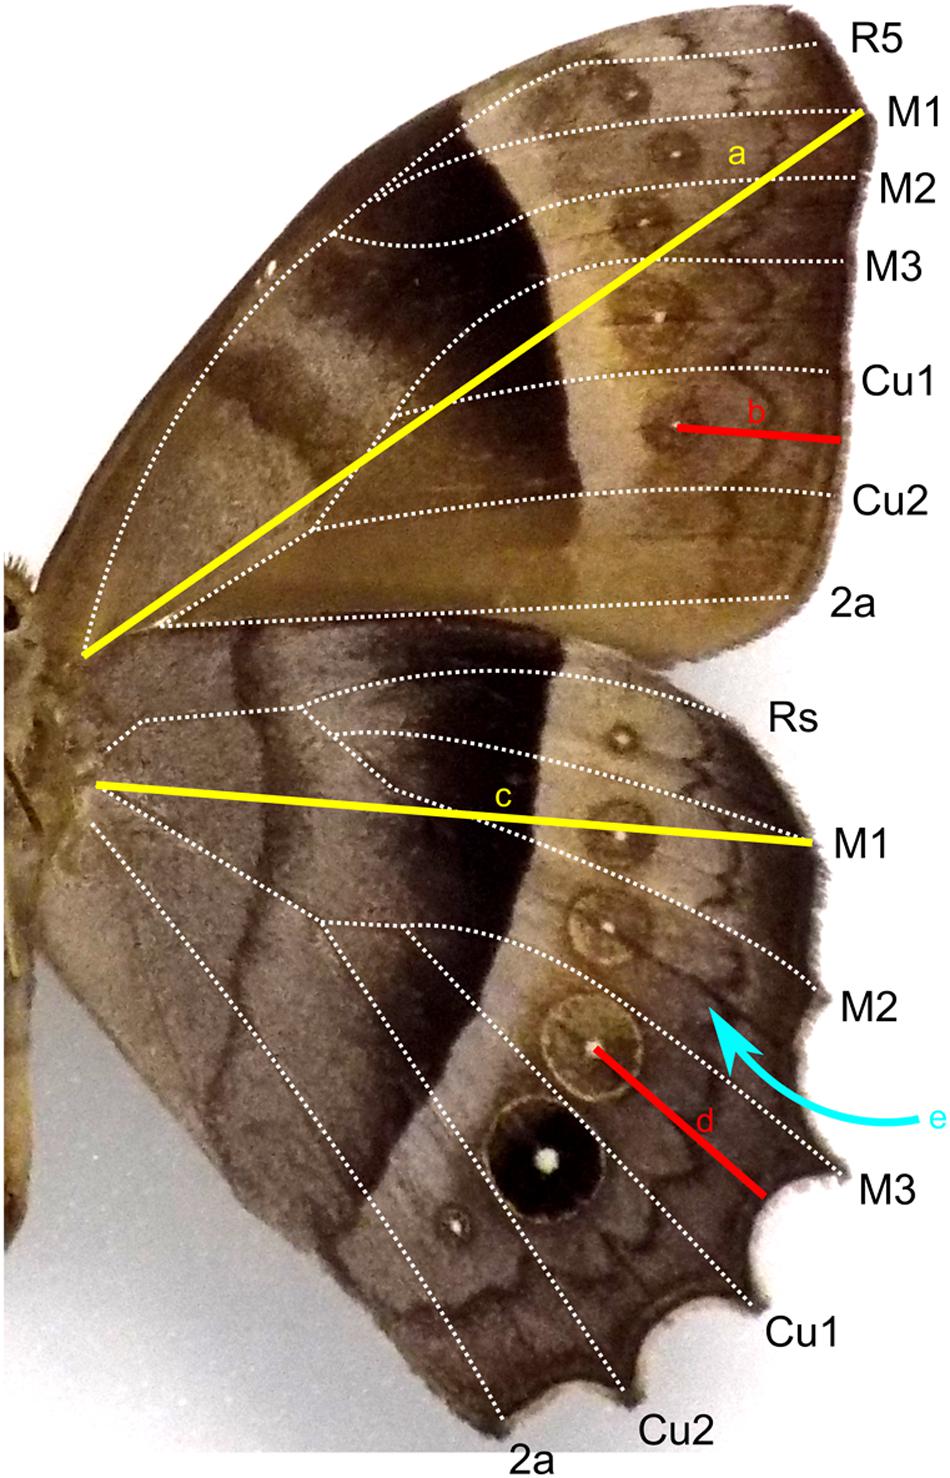
Figure 2. Diagram of wing measurements on a general Nymphalid wing surface. Wing length was measured as the distance from the base of the wing to the distal tip of the M1 vein for forewing (a) and hindwing (c). Placement of an ocellus was measured as the distance from the focus to the wing margin (b,d). A straight line was drawn following the groove along the midline (e) of each wing cell.
Color and Tail Boundary Survey
To survey the diversity of color pattern discontinuities and tails, we used photographed specimens from the agencies listed above as well as a rich photographic dataset from books by Bernard D’Abrera ([citeskum]BR15,BR16,BR17,BR18,BR19,BR20,BR21,BR22[citeekum]D’Abrera, 1980, 1981, 1982, 1984a, 1984b, 1985, 1986, 1990). Images of Pedaliodes species were kindly supplied to us by Dr. Tomasz Pyrcz. We counted the number of genera in five major butterfly Families (Lycaenidae, Nymphalidae, Papilionidae, Pieridae, and Riodinidae) in which a vein associated color boundary or tail occurred, focusing on the hindwing. We defined a color pattern discontinuity as a change in the background color or an element in the color pattern that appeared between intervein regions. Count data were subsequently analyzed using JMP Pro. Adobe Photoshop was used to edit images and produce the final figures. The list of the genera surveyed are supplied in the Supplementary Data File.
Results
Defining Anterior–Posterior Organization in Lepidoptera
Anterior–posterior (AP) information serves a fundamental role in the evolution of butterfly wing color patterns. Much of what we know about AP axis differentiation of the insect wing comes from foundational work in Drosophila melanogaster. In this species, a cell lineage boundary occurs between veins R4 + R5 and M1 + M2 (Figure 3). Cells anterior to the boundary express Cubitus interruptus (Ci) and those posterior to the boundary express Engrailed/Invected (En/Inv) (Blair, 1992; Zecca et al., 1995; Blair and Ralston, 1997).
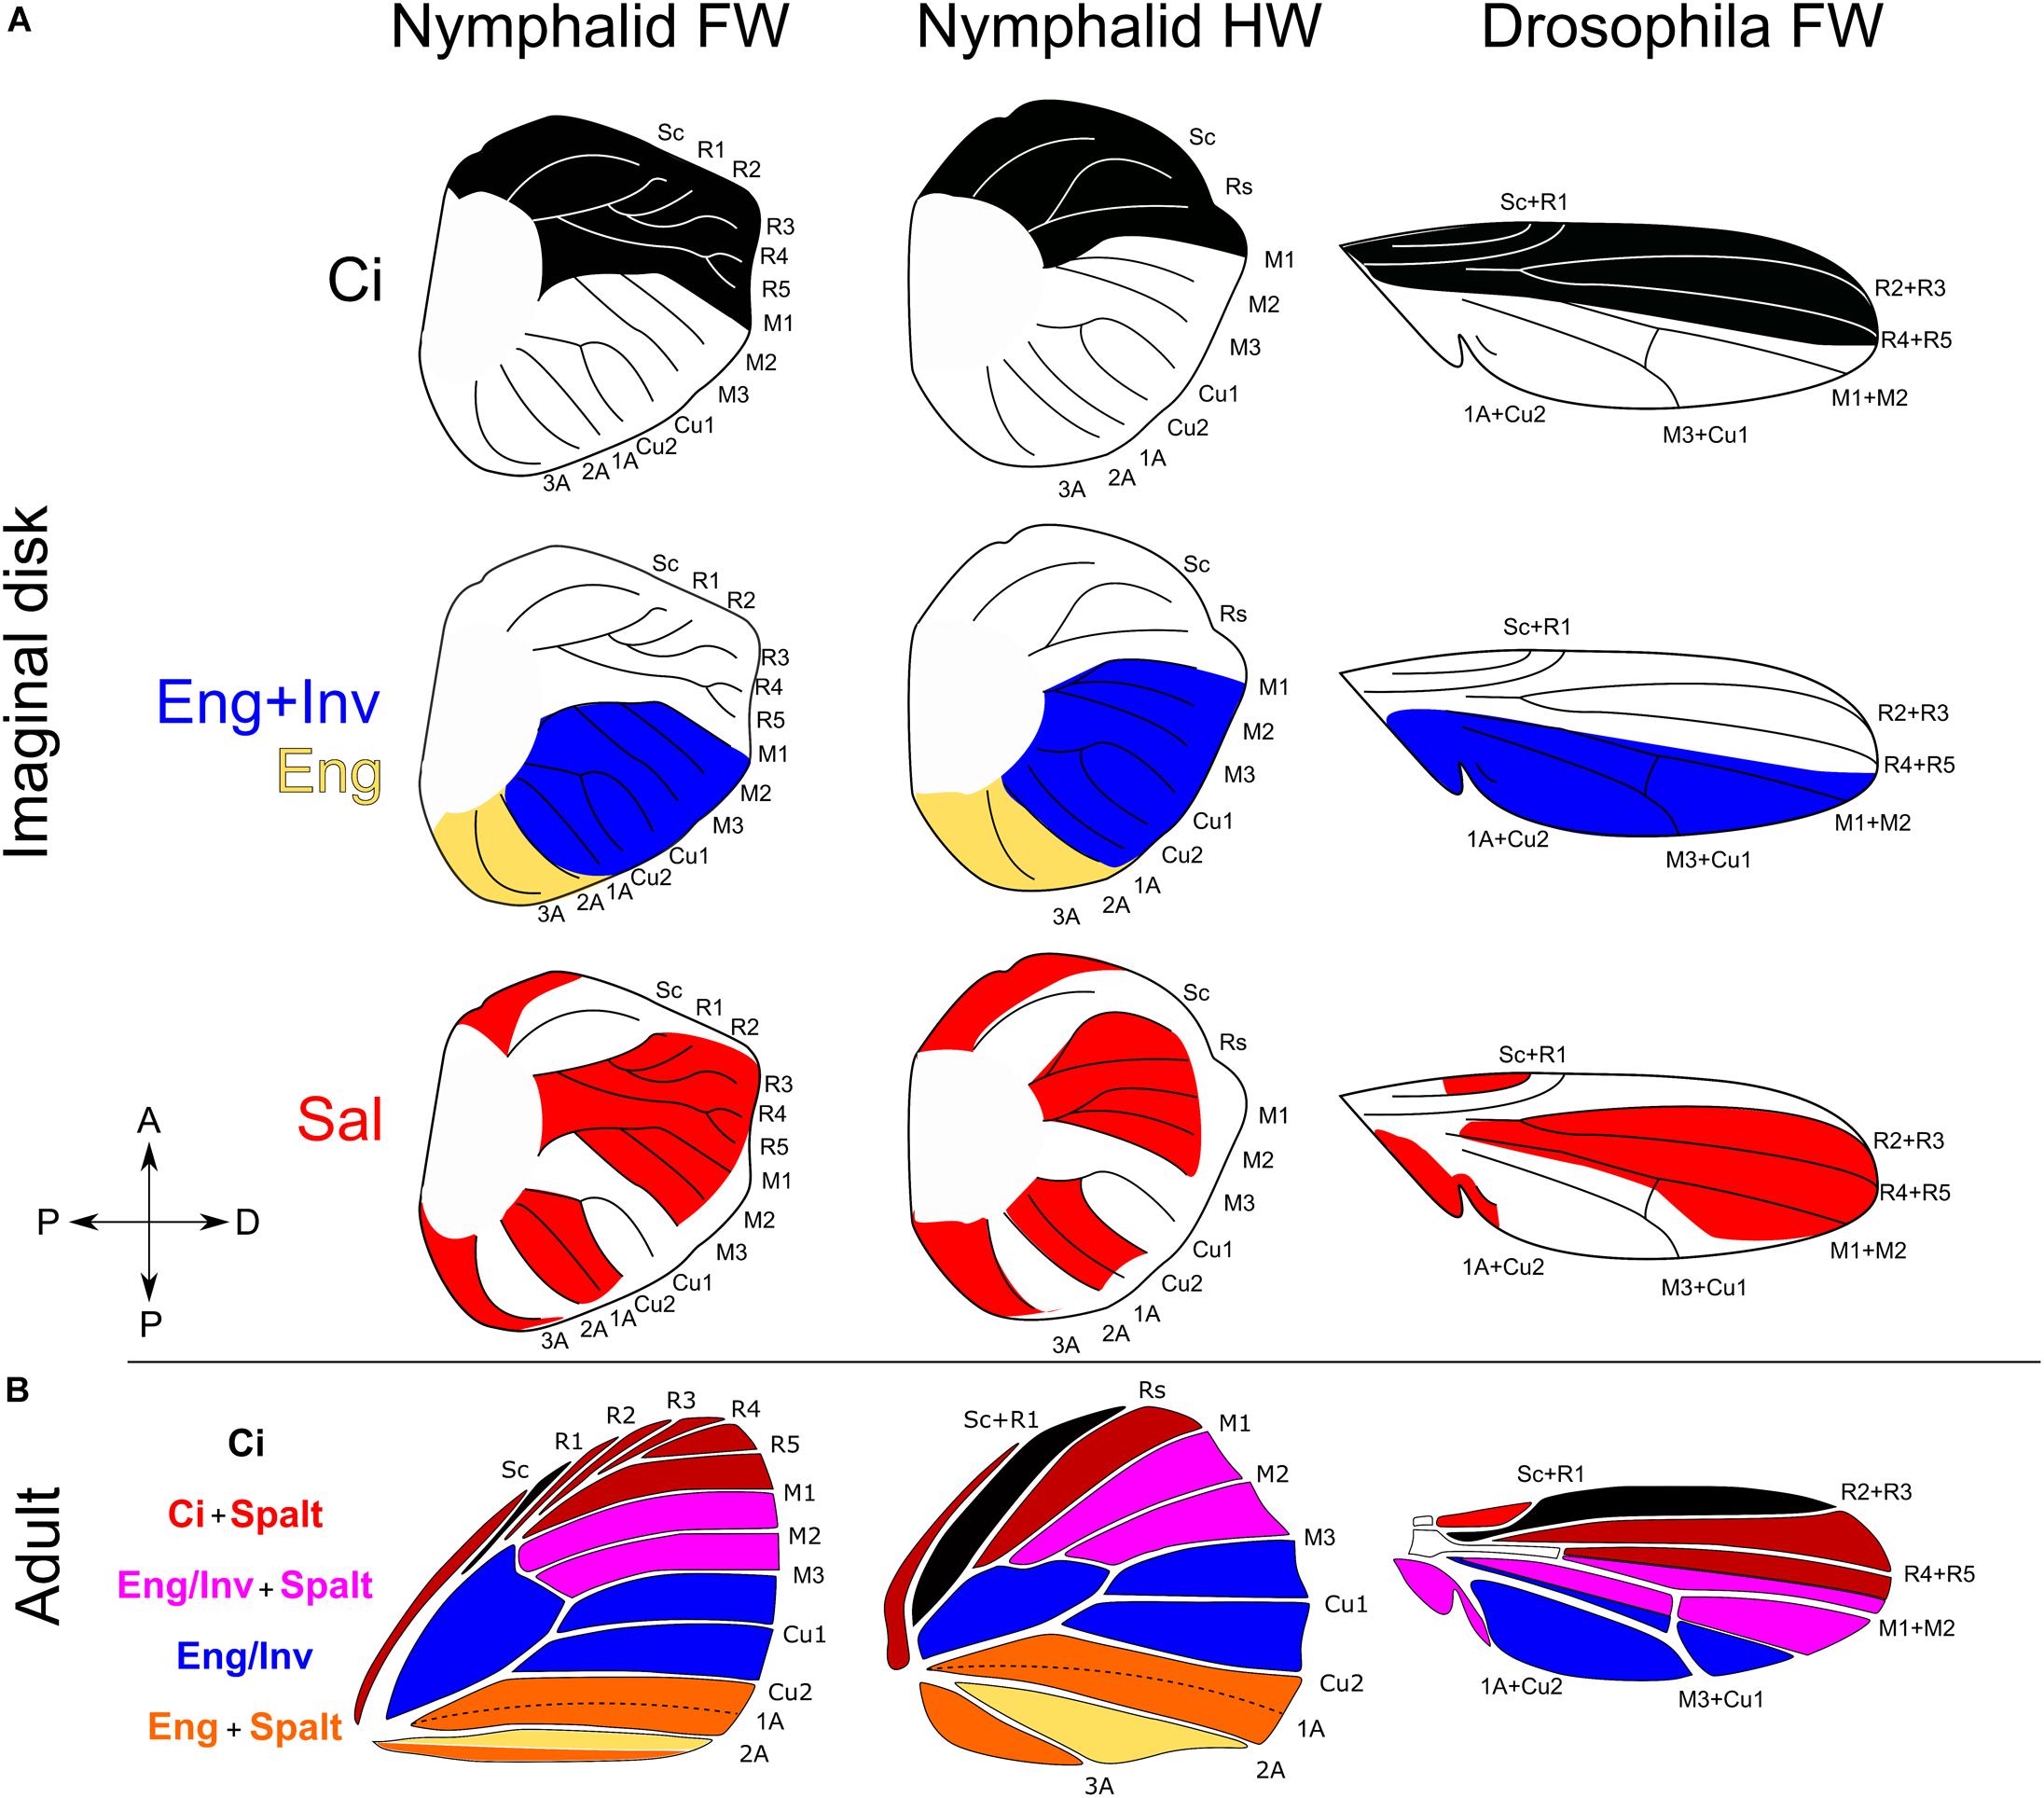
Figure 3. Homology of expression domains of key transcriptional regulators in wing imaginal disks of Nymphalid butterflies and Drosophila melanogaster. (A) Expression of Cubitus interruptus (Ci), Engrailed (En), Invected (Inv), and Spalt (Sal). (B) Superimposing expression domains creates four unique regulatory environments. Ci expression in Nymphalidae from Carroll et al. (1994). Inv and En domains of expression from Banerjee and Monteiro (2020). Spalt expression domains from Reed et al. (2007). Expression data for Drosophila pupal imaginal disks come from Blair (1992) and Milán et al. (2002).
The cells at the AP boundary secrete the diffusible protein decapentaplegic (Dpp), stimulated by the diffusible protein Hedgehog (Hh) secreted from En/Inv cells (Zecca et al., 1995; Tanimoto et al., 2000). Decapentaplegic serves to differentiate the anterior and posterior compartments by inducing the expression of the selector genes Spalt (Sal) and Optomotor blind (Omb). Sal and Omb are induced via a threshold-diffusion mechanism: at high Dpp concentrations Sal and Omb are both expressed (Nellen et al., 1996; Sturtevant et al., 1997; Lecuit and Cohen, 1998; Cook et al., 2004). As Dpp concentrations decline anteriorly and posteriorly away from the AP boundary, Dpp fails to induce the expression of Sal but maintains the expression of Omb. Thus, at least two distinct domains are established by Dpp: a Sal + Omb domain and an Omb domain. This is important because the induction of these domains within anterior Ci and posterior En/Inv cells, and in combination with other genes known to influence cell fate (Shen et al., 2010; Sugimori et al., 2016; Wang et al., 2016), produces combinatorial interactions that may establish semi-independent developmental microenvironments in the wing (Figure 3).
Some of these transcriptional regulators have been studied in Lepidoptera. We used published studies that described the expression of Ci, En/Inv, and Sal to homologize developmental regulatory environments in the wing of lepidoptera and Drosophila. In the buckeye butterfly, J. coenia, the AP boundary occurs between the R5 and M1 veins, where cells anterior to M1 express Ci and cells posterior express En/Inv (Keys et al., 1999). Interestingly, the fluorescence of En/Inv strains are not homogenous throughout the posterior of the wing and seem to fade posterior to M3 (Carroll et al., 1994; Reed et al., 2007; Abbasi and Marcus, 2017). The antibody for En/Inv recognizes both En and Inv (Patel et al., 1989), and the gradual posterior dilution of the fluorescence may be due to reduced expression of one or both of these posterior selector genes. Indeed, in situ hybridization in Bicyclus anyana demonstrates that En is expressed from M1 to the posterior margin, whereas Inv expression starts at M1 and ends at 2a (Banerjee and Monteiro, 2020).
Although there have been no studies of Omb expression, Sal expression has been readily analyzed in Junonia and Bicyclus (Reed et al., 2007; Monteiro, 2015). In these species a Sal expression domain appears anterior to the Sc vein, homologous to the far anterior domain in Drosophila (Sturtevant et al., 1997; Milán et al., 2002). The space from the Sc vein to R2 has little to no fluorescence of Sal, but from R2 to M3 Sal expression is strong. There is weak or no expression that spans the region between M3 to Cu2 (Figure 3). Between Cu2 and 2A another expression domain emerges that has a sharp posterior boundary along the 2A vein. No Sal expression is observed around the 2A vein, but a fourth and final expression domain occurs posterior to 2A that extends to the posterior wing margin.
When the Sal domains are superimposed onto anterior Ci and posterior En/Inv compartments, the wing is secondarily subdivided into four domains with characteristic combinations of expression of the various regulatory genes just as they are in Drosophila (Figure 3). The anterior most domain is between the R1-M1 veins (Rs-M1 on the hindwing), characterized by the expression of Ci and Sal. The next domain is between M1-M3 veins where Sal and En/Inv are co-expressed. Posterior to this domain is the M3-Cu2 domain where only En/Inv is expressed, and likely express Omb or BMP2/Dpp inhibitors. Posterior to Cu2, cells do not express Inv, but maintain En expression. The fourth domain occurs between the Cu2-2A veins where En cells also express Sal. These domains represent unique combinatorial interactions of compartment selector genes (Ci and En/Inv) and Dpp response elements. Such combinatorial interactions may allow for independent developmental regulation of the patterning mechanisms that specify serially homologous elements and background color.
Correlated Color Pattern Variation Maps to Expression Domains
Morphologically, the degree of independence of AP serial homologs can be demonstrated by measuring their correlated variation among individuals or across species. Within a species there is always some degree of individual variation in the position of pattern elements that emerges from genetic or environmental variation (Nijhout, 2001). Similarly, within a particular genus or family and even across families, the positioning of serial homologs differs because species vary in the genetic makeup of the developmental process that specifies and positions each pattern element. If two serially homologous pattern elements covary in position from species to species, it may indicate that they share developmental regulation of the patterning mechanism. If two serially homologous pattern elements do not covary – one may vary in the opposite direction from the first or one varies more than the other – then they may not share the same developmental regulation of the mechanism that positions said pattern element.
To determine if the four AP expression domains described above influence the evolution of ocelli placement, we measured the patterns of correlated variation of ocelli in Satyridae and Nymphalidae. Both Families develop border ocelli in each of the four expression domains, thus allowing us to analyze the degree of independence of AP serial homologs (Figure 4).
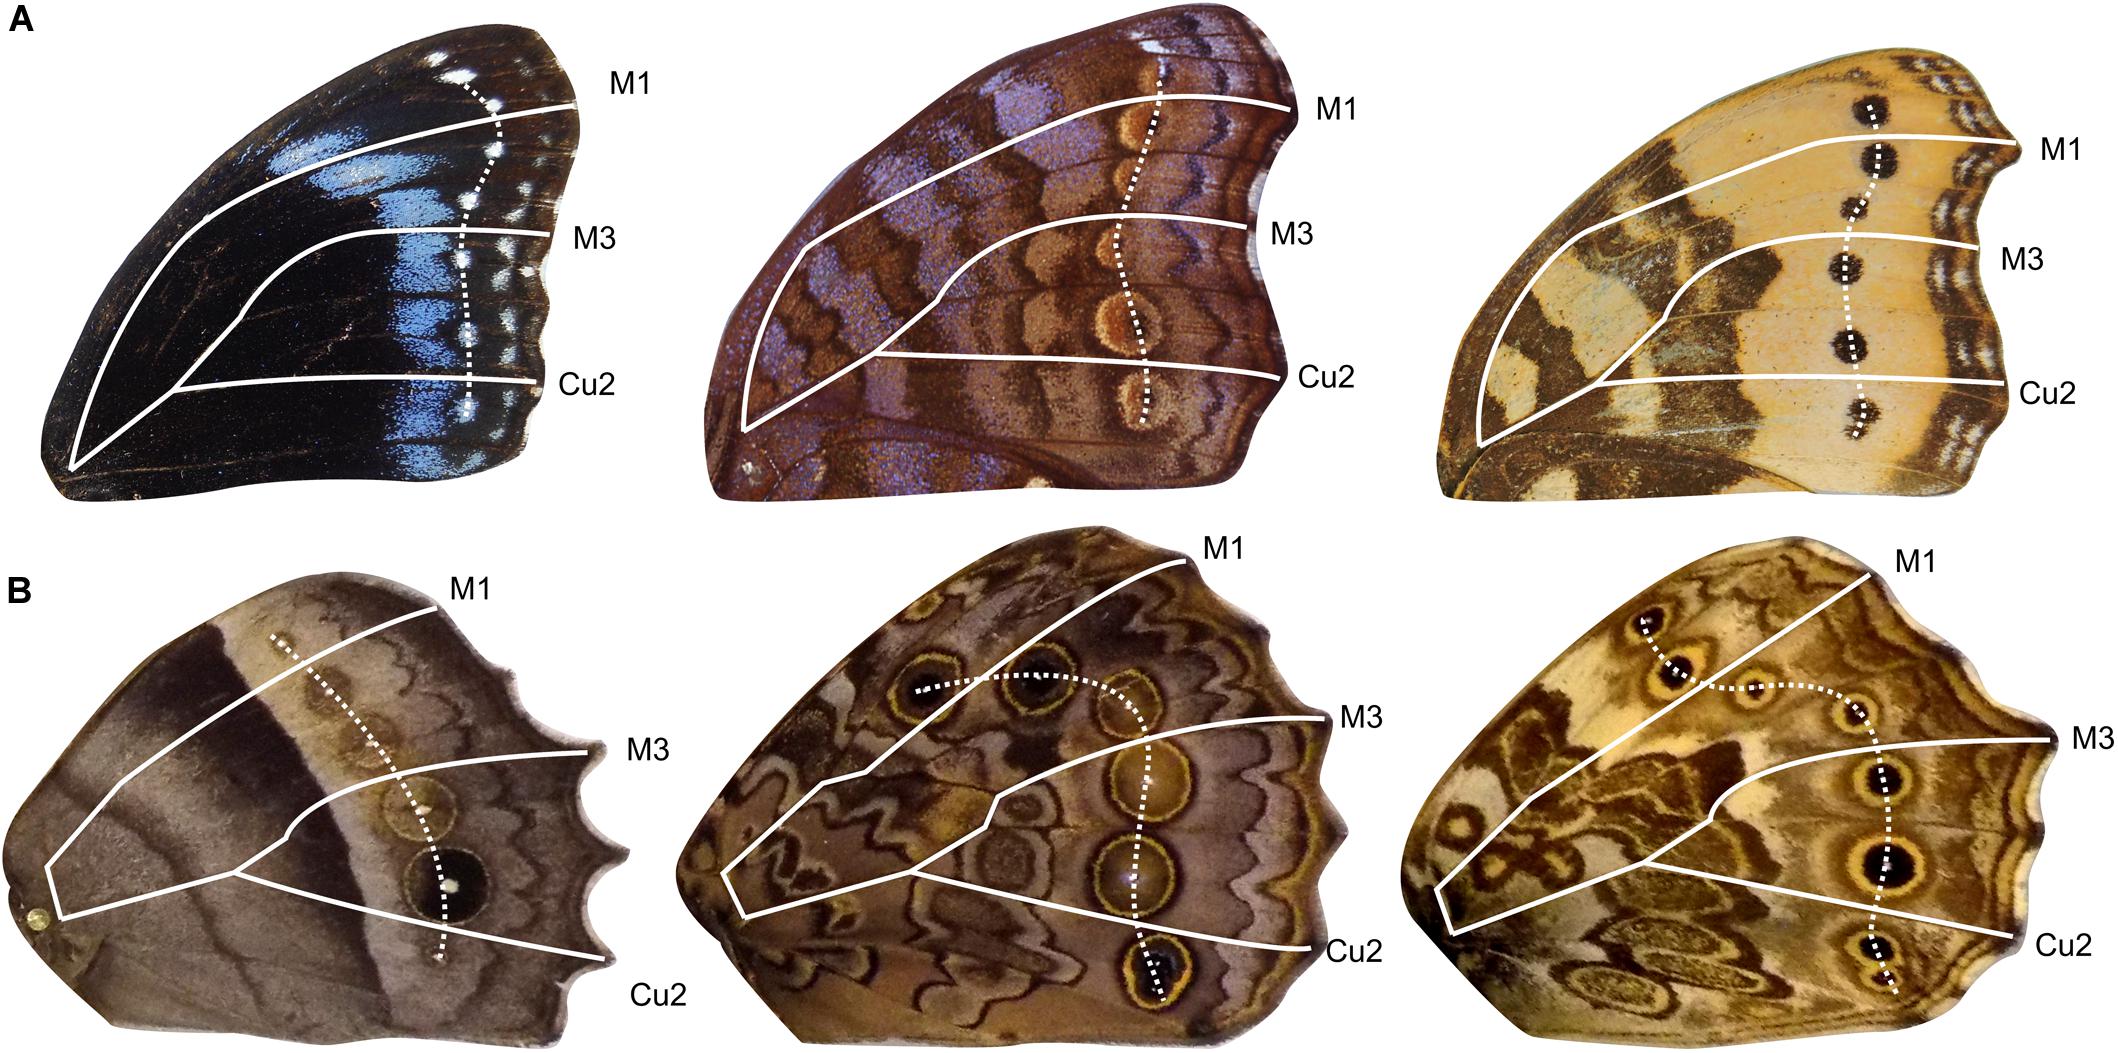
Figure 4. Example of forewing and hindwing dislocation of border ocelli. Forewings in panel (A) show different patterns of ocelli dislocation. Hindwings in panel (B) show different degrees of dislocation. Veins are outlined to represent boundaries between expression domains. Ocelli are connected by white dashed line.
When the measurements from Satyridae and Nymphalidae are combined, a pattern of correlated variation emerged that seems to map directly to the four domains (Figure 5). That is, ocelli that lie within the same domain are strongly correlated, but ocelli in different domains are not. This is true for the forewing and the hindwing. However, when the measurements for the two families are analyzed separately, the strength of these correlations are different. For Satyridae, the forewing correlations were strongest within domains but there was a stronger correlation between domains in close proximity. For the hindwing the strength of the correlations between domains was weak, strengthening the support of evolutionary independence of the domains.
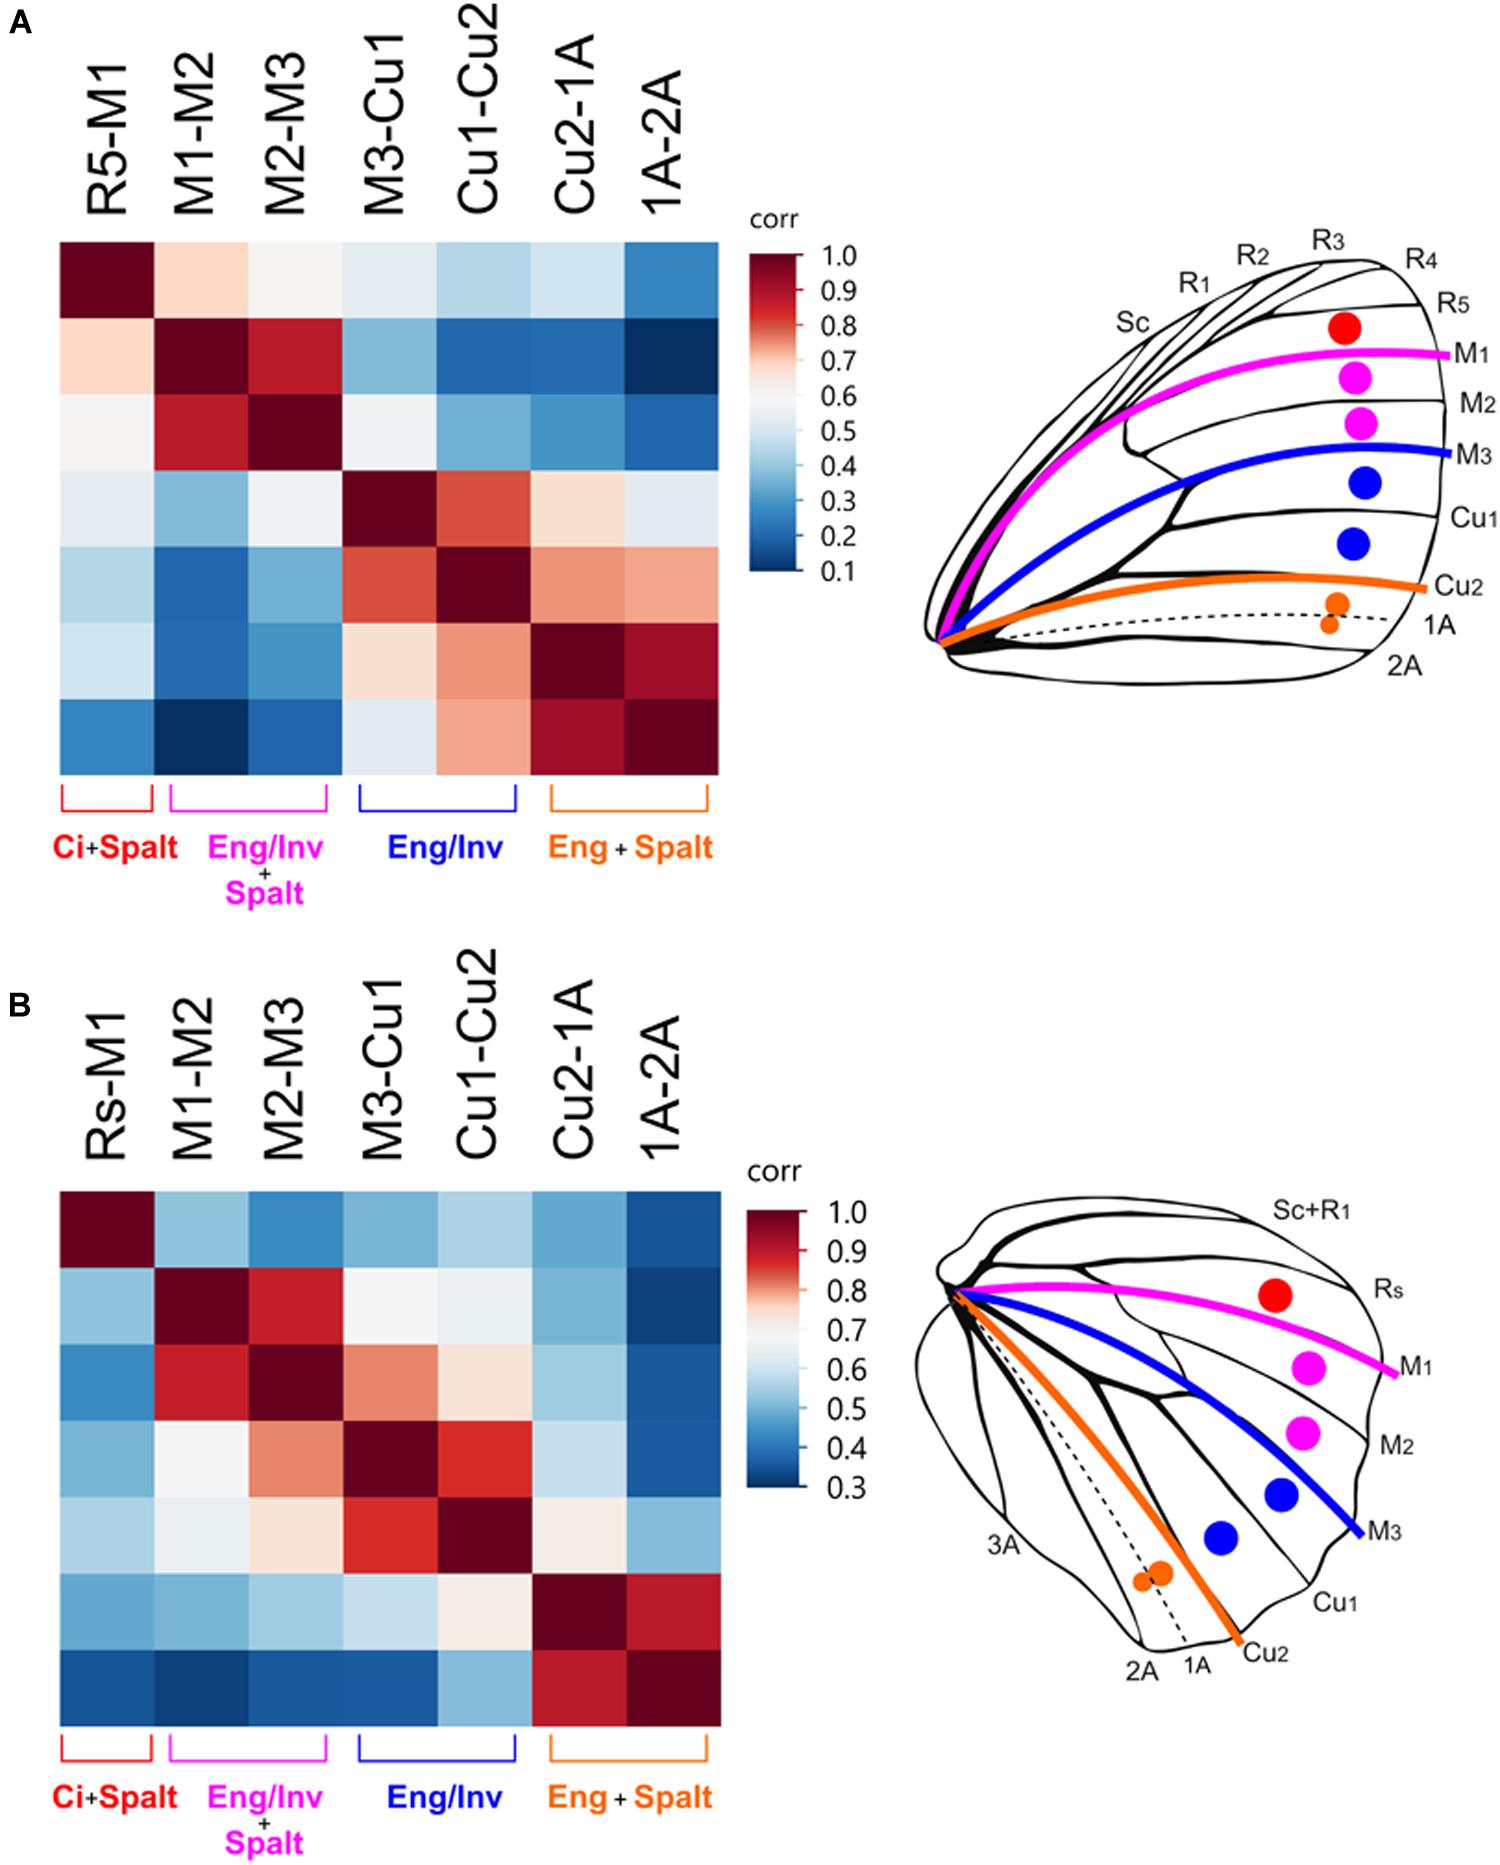
Figure 5. Border ocelli placement is modular and maps to the AP expression domains. Heatmaps of correlations between the relative distance from the wing margin of border ocelli in Satyridae and Nymphalidae. Dark red colors indicate strong correlations. Light red, white, and blue represent weaker correlations. In the forewing (A) and hindwing (B), ocelli within each expression domain are strongly correlated with each other and are weakly correlated with ocelli in other expression domains.
For Nymphalidae, the independence between domains on the forewing was weaker than they are in Satyridae (Supplementary Figure S1). The position of ocelli in the M1-M3 domain were equally correlated with the adjacent domains. The position of the M1-M2 ocellus was equally correlated with that of the R5-M1 ocellus and the M2-M3 ocellus but was not correlated with that of the M3-Cu1 ocellus. The position of the M2-M3 ocellus was equally correlated with the M3-Cu1 ocellus but not with the Cu1-Cu2 ocellus. Thus, forewing ocelli in Nymphalidae displayed the pattern of correlations within domains but displayed stronger correlations between adjacent domains. Similarly, the pattern of correlations on the hindwing are completely different. The position of the Rs-M1 ocellus was uncorrelated with all other ocelli, but ocelli between M1-Cu2 were strongly correlated with each other and less correlated with ocelli between Cu2-2A. This suggests the positioning of ocelli in the M1-M3 and M3-Cu2 domains may share a greater degree of developmental regulation in this family despite differences in the combinatorial transcriptional regulation.
Color Boundaries
Previous studies have documented a widespread occurrence of color pattern discontinuities that form at various positions on the wing (Nijhout, 1991). The most notable discontinuity occurs around the M3 vein. In several species the pattern elements anterior to M3 are different from those posterior to the vein in almost every aspect (size, color, and position) (Nijhout, 1991). The M3 vein, however, is not the only location on the wing where such extreme pattern differences form. Many seem to form near the M1 and Cu2 veins. Interestingly, these veins happen to occur at the boundaries between the combinatorial expression domains (Figure 3).
We sought to discover the abundance of various color pattern boundaries to see if they occur in multiple butterfly taxa and to determine whether boundaries between expression domains were more common in some taxa than others. Genera in every Family displayed some form of color discontinuities at one or more of the veins that mark a boundary between expression domains (Figure 6). Within all five Families that we surveyed, there were genera that have a color pattern boundary at M1, M3, and Cu2/2A. When the genera from each Family were combined into a single dataset, the most frequent color pattern discontinuity occurred at the M1 vein (29%), followed by the Cu2 vein (19%), M3 vein (18%), 2A vein (16%), Rs vein (8%), M2 vein (6.4%), and the Cu1 vein (4.6%). Together, the veins that represent boundaries between expression domains (M1, M3, Cu2, and 2A) represented 82% of the color pattern discontinuities observed in the 201 genera included in this study (Figure 7).
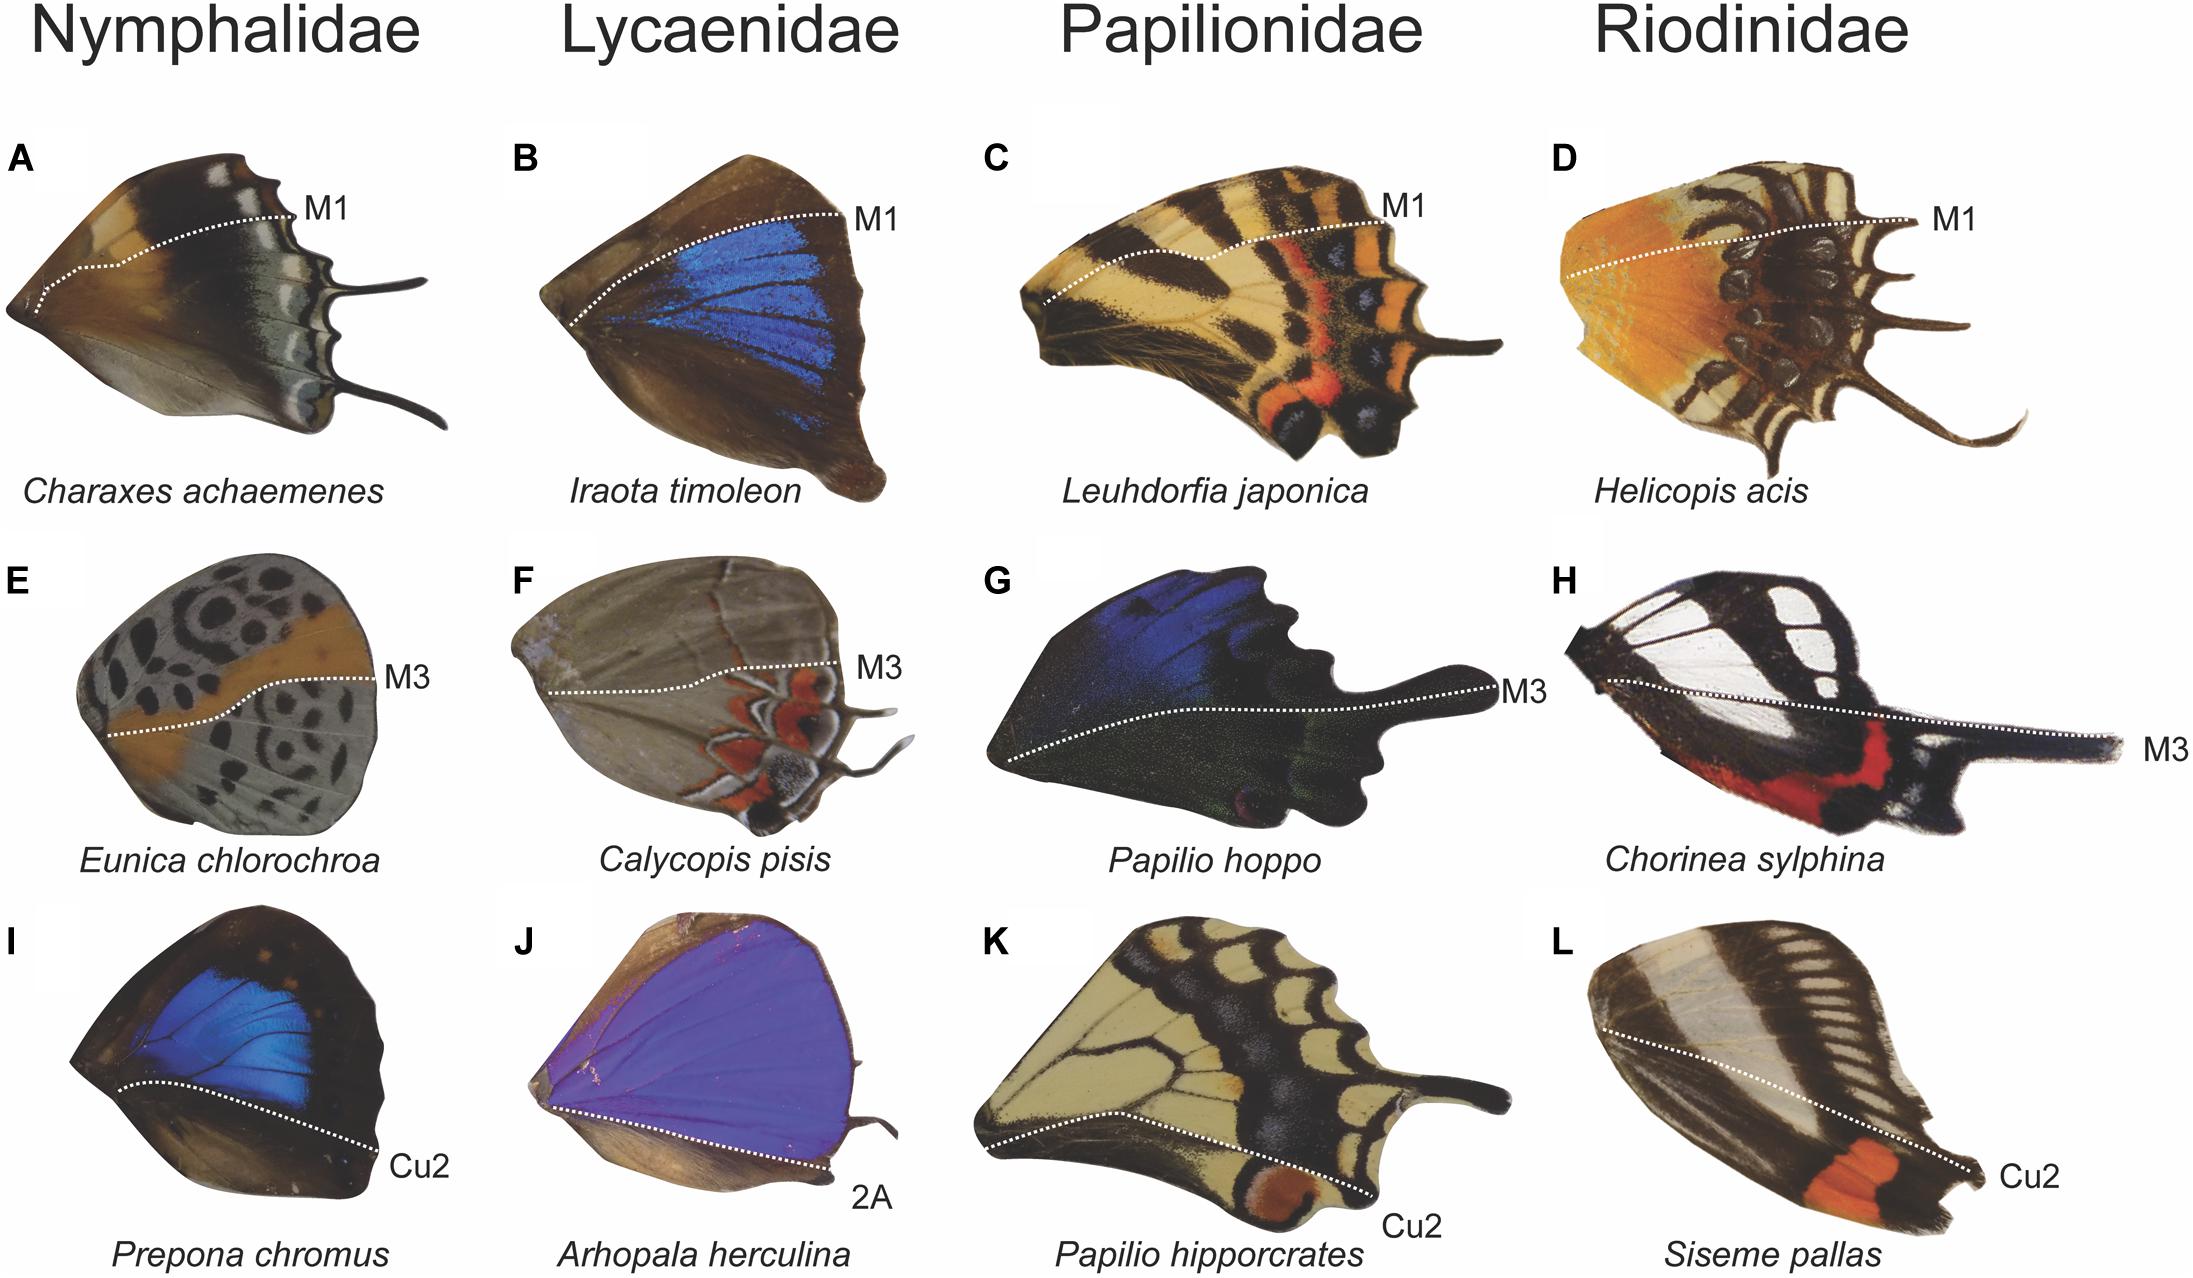
Figure 6. Anterior–posterior color pattern heterogeneity in hindwings across four butterfly families. Wings show color pattern discontinuities at the M1 vein position (A–D), at the M3 vein position (E–H), and at the Cu2 or 2a vein position (I–L). The occurrence of M1, M3, and Cu2/2a discontinuities across diverse taxa highlights the universality of an underlying anterior–posterior pattern formation mechanism on the wing (Chorinea sylphina wing image obtained from Wikimedia Commons, https://commons.wikimedia.org/wiki/File:Chorinea_3.jpg).

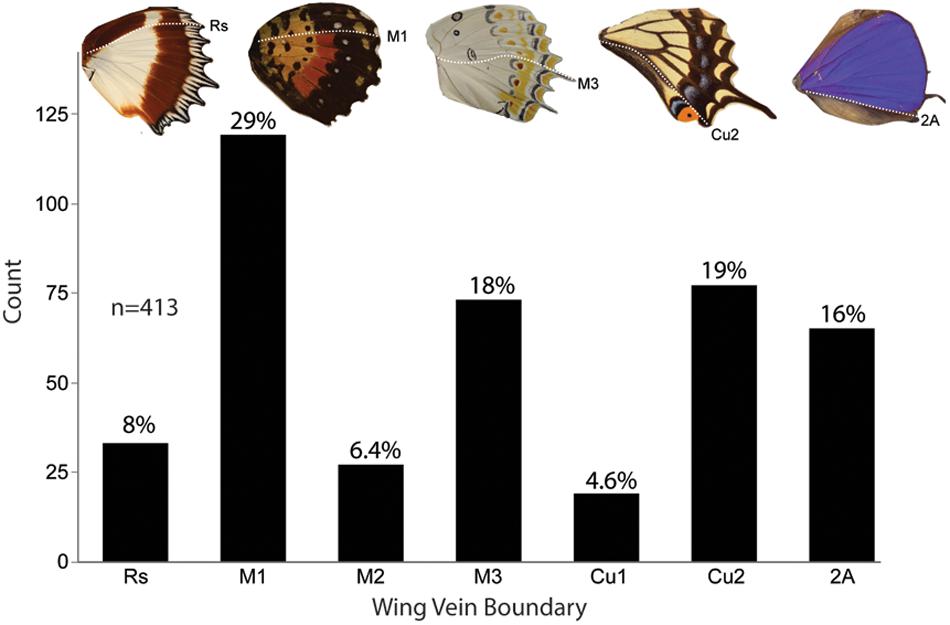
Figure 7. Frequency of anterior–posterior color pattern heterogeneity across five butterfly families. A total of 201 genera from five families were found to have anterior–posterior color pattern discontinuities. Several genera were counted more than when they had color dislocations at multiple boundaries on the same wing for a total count of 413 individuals. Across the specimens surveyed, a color boundary at M1 (29%) occurred most frequently followed by Cu2 (19%) and M3 (18%). These data show that color pattern discontinuities occur most frequently at expression domain boundaries.
We found that the five Families we studied (Lycaenidae, Nymphalidae, Papilionidae, Pieridae, and Riodinidae) had Family-specific differences in these locations of color pattern boundaries (Figure 8). In Lycaenidae, color boundaries primarily occurred at the M1 vein (59%), followed by the M3 (21%), Cu2 (8%), 2A (4%), Cu1 (3%) and Rs (3%). In Nymphalidae, Cu2 (24%) was the most common vein boundary, followed by 2A (22%), M1 (16%), M3 (13%), Rs (11%), M2 (9%), and Cu1 (4%). In Papilionidae, most color boundaries occurred at M3 (24%) and the AP boundary at the M1 (22%) vein, followed by Cu2 (19%) and Rs (11%). Very few color boundaries occurred at M2, Cu1, and 2A (each of with approximately 8%). In Pieridae, the most common color boundary occurred at the 2A vein (32%), followed by M3 (18%), Cu2 (18%), M1 (14%), M2 (9.1%) and Cu1 (9.1%). Finally, in Riodinidae, M1 (55%) represented the most common boundary, followed by M3 (32%), Cu2 (9.7%) and Cu1 (3.2%).
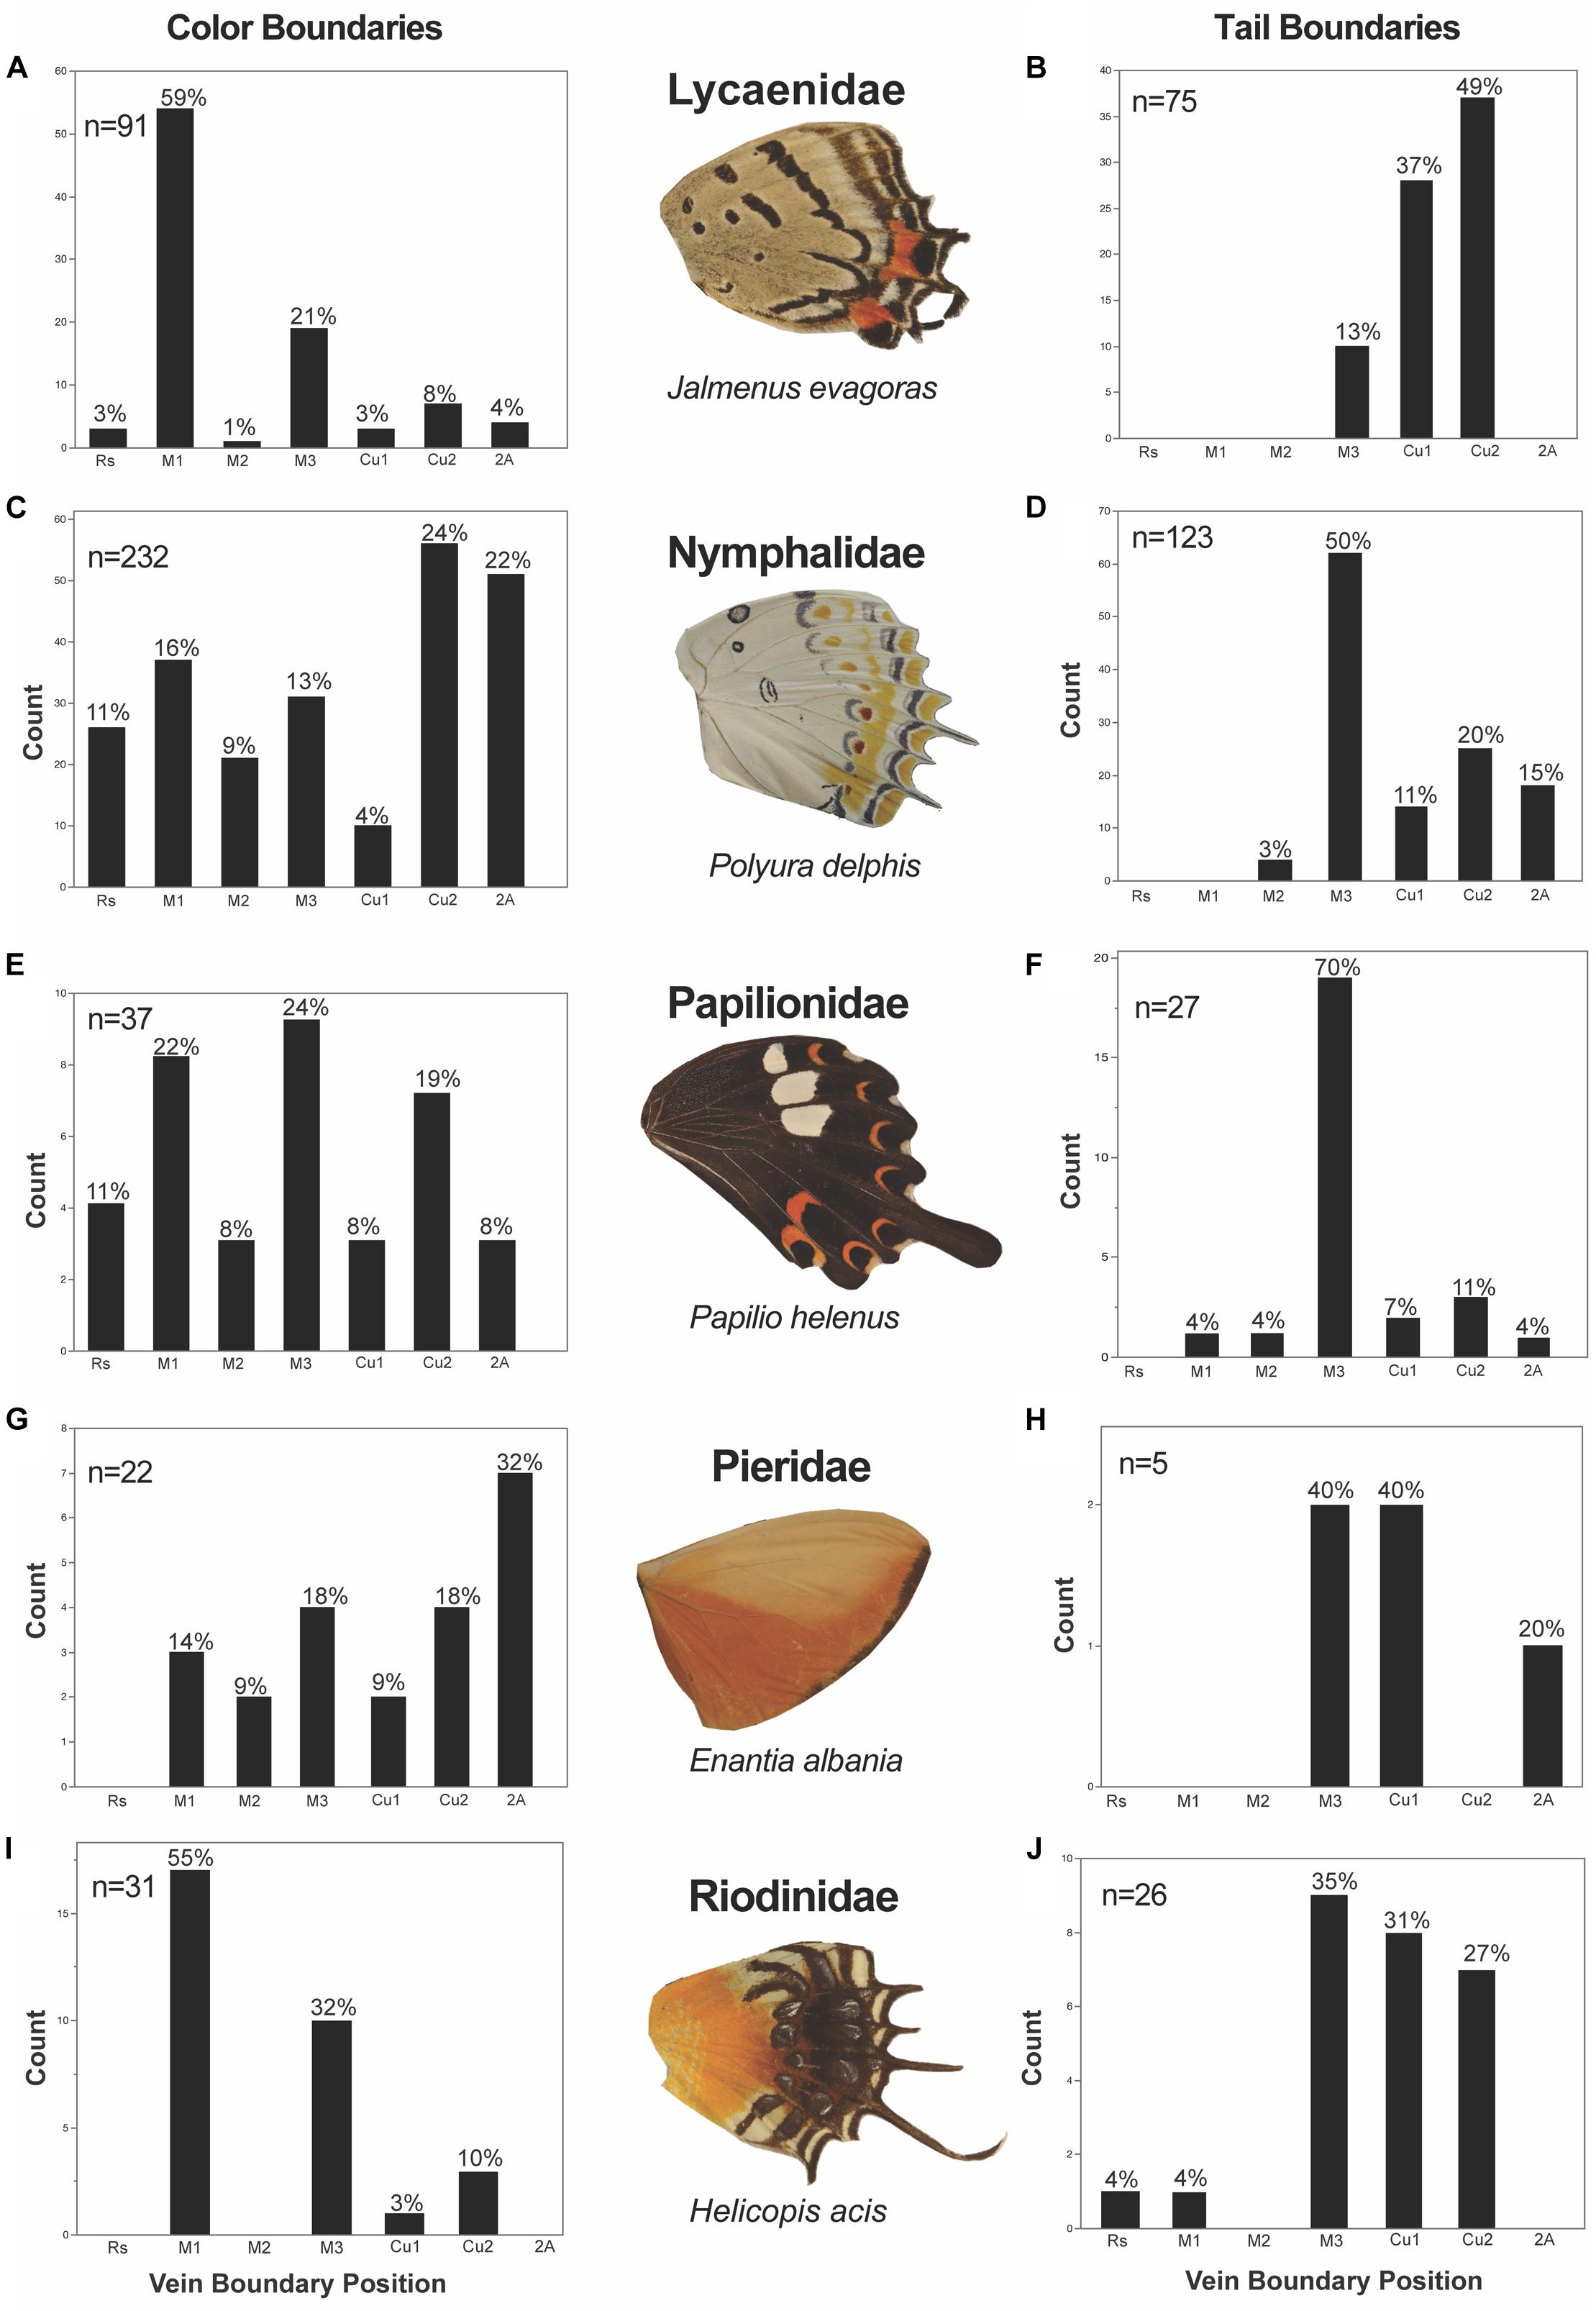
Figure 8. Color pattern heterogeneity and tail occurrence frequency subdivided by Family. There is Family level variation in the position at which color boundaries and tails occur. The color boundaries in Lycaenidae (A) and Riodinidae (I) occur most frequently at M1, while color boundaries appear more frequently posterior to M3 in Nymphalidae (C) and Pieridae (G). In Papilionidae (E), color discontinuities occur most frequently at M3 and equally so at M1 and Cu2. Tails appear most frequently at M3 from all Families (D,F,H,J), but Lycaenidae (B).
Tails and Shape Boundaries
The shapes of butterfly wings can also have AP differences. For instance, a tail that develop from the outward protrusion of a vein is also frequently associated by a dislocation, exaggeration and/or reduction of pattern elements on either side of the vein. As with our analysis of color pattern discontinuities above, we sought to determine the frequency of various vein protrusions as they relate to the AP expression domains.
There is a diversity of tail shapes across the butterfly taxa we sampled as well as differences in the veins at which tails occurred (Figure 9). When the data were combined into a single dataset, tails largely occurred at or posterior to M3, with a 97.2% likelihood (Figure 10). The most common vein to form a tail is the M3 vein (40%), followed by Cu2 (28%), Cu1 (21%), and 2A (8%). Tails anterior to M3 were very rare accounting for approximately 3% of all tails observed (M2; 2%, M1; 0.8%, Rs; 0.4%) in the 161 genera that were included in this study.
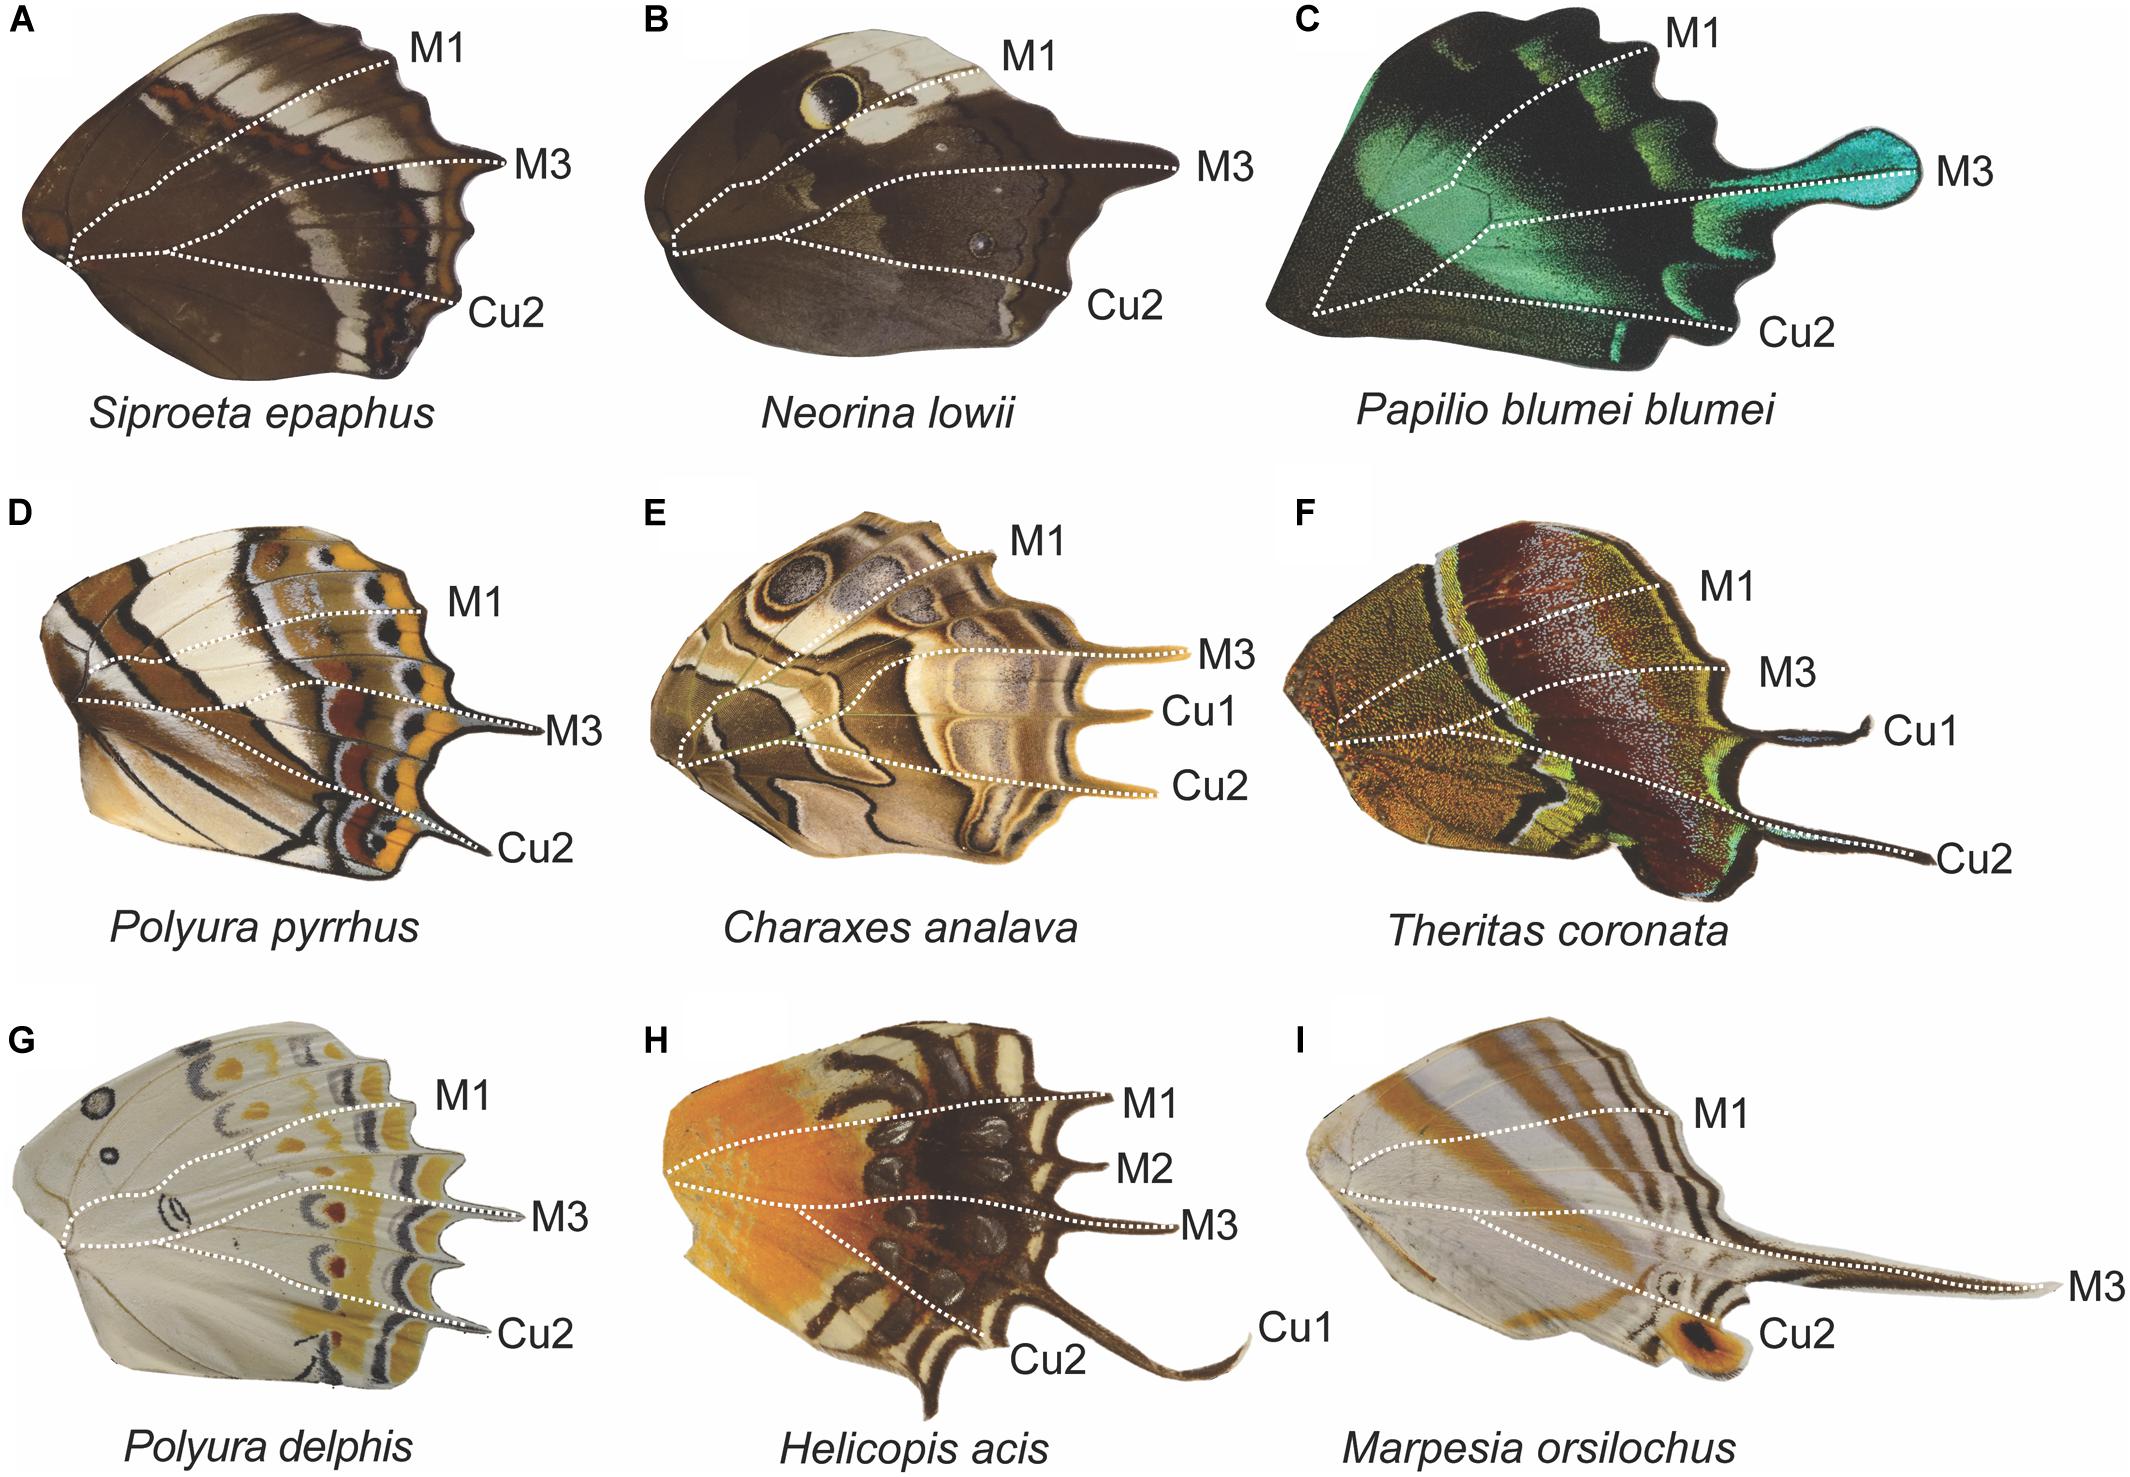
Figure 9. Tail diversity across butterfly families and their correspondence to domain boundaries. Across butterfly taxa, tails most frequently occur at the M3 vein position and posterior to it as seen in nymphalids (A,B,D,E,G,I), a papilionid (C), and a lycaenid (F). There are few instances of wings with projections at M1 and M2, as seen in the riodinid (H). The absence of tails above M3 is most likely due to biomechanical constraints. Frequently, wings that display tails also have a scalloped distal margin (exemplified in C), with most of the veins extending beyond the intervein region, compared to smooth distal wing margin in species where tails are absent (see Figure 6, wings B,E,I,J,L).
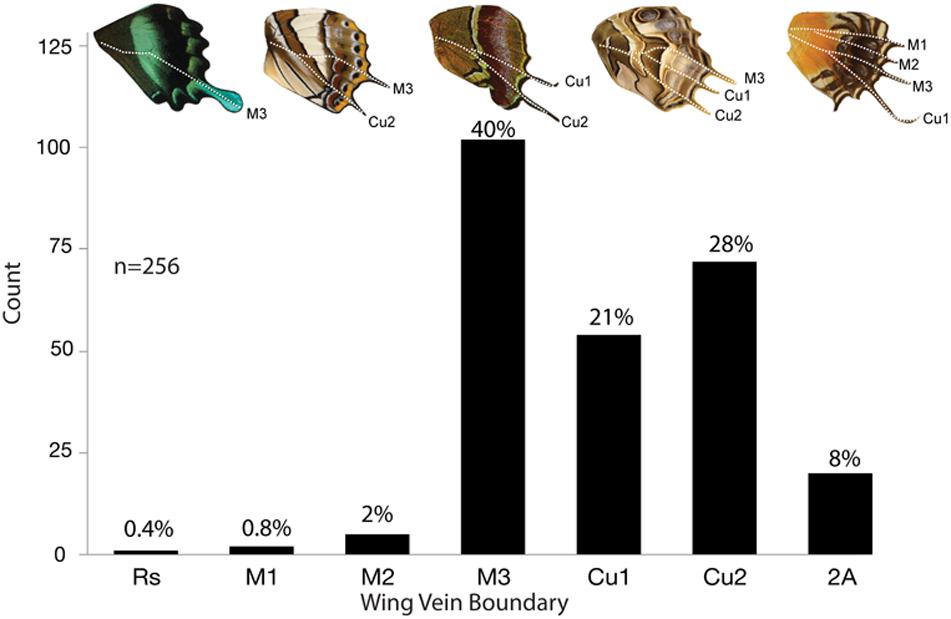
Figure 10. Frequency of tails across five butterfly families. A total of 161 genera across 5 families were observed to have tails. Some genera had multiple tails and were counted more than once for a total of 256 observations. Tails emerge most frequently at M3 (40%), followed by Cu2 (28%), and Cu1 (21%).
There are interesting differences in tail position among the Families we studied. In Lycaenidae, M3 tails are the least common (13%), whereas Cu2 (49%) and Cu1 (37%) tails are the most common, together making up 86% of tails in the Family (Figure 8B). Conversely in Nymphallidae, M3 tails are by far the most common making up 50% of tails (Figure 8D). The next most common tails are Cu2 (20%), 2A (15%), Cu1 (11%), and M2 (3.3%). In Papilionidae, tails almost exclusively occur at the M3 vein (89%) with the remaining 11% tails occurring at the Cu2 vein (Figure 8F). Tails and vein protrusions were very rare in Pieridae (Figure 8H). In this family, we could only identify four genera where tails were present. Of these, two had tails at M3, two at Cu1, and one at vein 2A. The Riodinidae displayed tails primarily at M3 and posteriorly, with tails at M3 most frequently followed by Cu1 and Cu2, respectively (Figure 8J). In some instances, the entire wing posterior to M3 is elongated (Figure 11, and see also Figures 6G,H,L). This was most often observed in Nymphallidae, but also appears in the Riodinidae (Figure 6H). These species show a clear demarcation between the anterior and posterior regions of the wing with respect to shape, but also with regard to the pattern. In some instances, there is a color pattern dislocation (Figure 11A), a change in the predominant background color (Figures 11B,D), or the appearance of a pattern element in the elongated posterior region that was not present in the anterior region (Figure 11C).
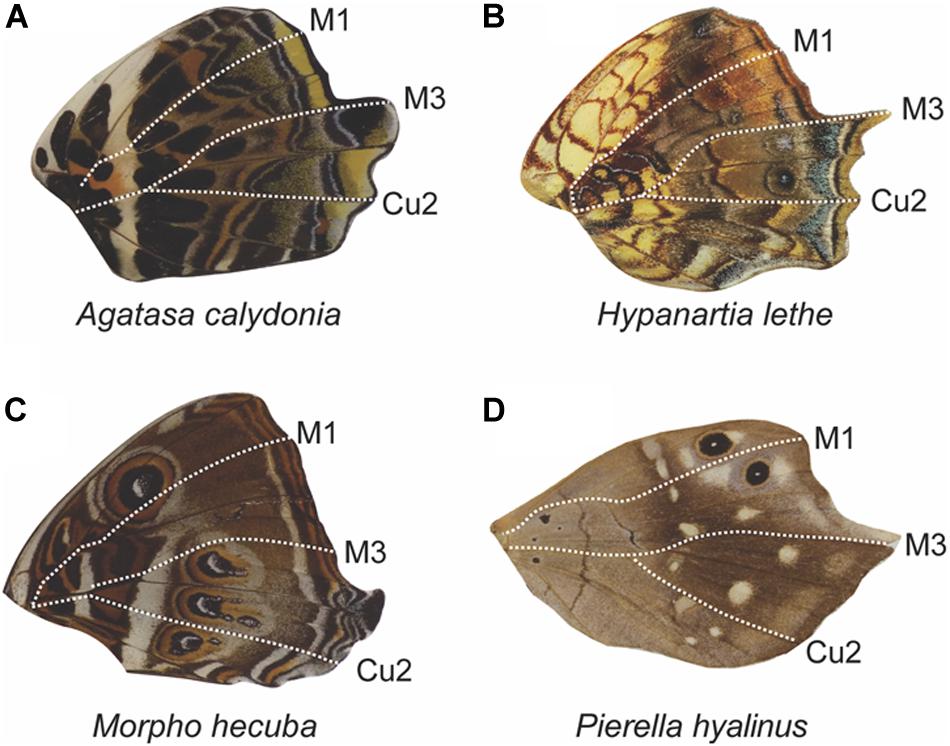
Figure 11. Anterior–posterior dislocation at the M3 vein in hindwings. Butterfly wings can display elongation of the M3, Cu1, and Cu2 veins, leading to a larger posterior wing region (A–D). In some cases, the region of elongation begins at the M3 vein (A,B), in the intervein region posterior to M3 (C), or in the intervein region anterior to M3 (D), suggesting that the expression domain boundary can shift. All four wing examples are from the family Nymphalidae.
Discussion
The work presented above provides several novel insights into the evolution and development of color pattern diversity in Lepidoptera, especially the role of positional information along the AP and PD axes. We have shown that there are conserved developmental microenvironments in the wings of butterflies that divide the AP axis into 4 developmental domains, each characterized by unique combinatorial patterns of gene expression. We hypothesize that the combinatorial activity of selector genes En, Inv, Ci, Sal, and likely others, may facilitate the establishment of unique cellular states that influence color pattern formation and evolution.
Development and Evolution of Border Ocelli Placement
Lepidopteran wing color patterns are composed of three unique character systems that develop along the PD axis of the wing: the BSS, CSS, and the BoSS (Nijhout, 1991). Each system is composed of serially homologous pattern elements that are repeated along the AP axis between the veins.
The organizing principles that specify each character system are coming to be increasing well understood. Most developmental studies have targeted the BoSS, which is composed of border ocelli and parafocal elements. Although this is perhaps the most complex symmetry system, these studies have discovered a relatively simple patterning mechanism that can explain the placement and morphology of ocelli and parafocal elements (Nijhout, 2017).
Early studies into ocelli development discovered that several genes involved in embryonic and limb patterning are redeployed in the later stages of wing imaginal disk development (Carroll et al., 1994; Brakefield et al., 1996; Keys et al., 1999). In both J. coenia and B. anyana, the process begins with the determination of ocelli in the wing imaginal disk shortly after the vein lacuna have formed. This is characterized by an initial patterning of homeobox gene distal-less (Dll) throughout the distal region of the wing epithelia near the dorsal ventral boundary (DV; Brakefield et al., 1996; Reed and Serfas, 2004; Reed et al., 2007; Connahs et al., 2019). As the wing matures later in the instar, Dll begins to localize to a focus in each wing cell (Reed and Serfas, 2004; Reed et al., 2007; Nijhout, 2017).
Theoretical models such as Nijhout’s grassfire model (Nijhout, 2017) and the Gray–Scott model by Connahs et al. (2019) suggest Dll expression is confined to a focus of cells via a diffusion-threshold mechanism. In these models, cells respond to a diffusible signal from the DV boundary to pattern Dll expression (Nijhout, 2017). The actual identities of the morphogenetic signal and the pathway that activates Dll has remained elusive, however, Wnt1/Wg signaling from the DV boundary is known to induce Dll expression in Drosophila (Strigini and Cohen, 2000). In Lepidoptera, several Wnts are expressed in the DV boundary cells: Wnt1/Wg, Wnt6, and Wnt10 (Martin and Reed, 2010; Martin et al., 2012; Martin and Reed, 2014; Mazo-Vargas et al., 2017). Which of these Wnts specify border ocelli is unknown.
Other morphogenetic genes may also be involved in the patterning of eyespots. For instance, Hh and Dpp are redeployed late in butterfly wing development wherein Hh is expressed in eyespot foci (Keys et al., 1999) and Dpp is expressed throughout the wing but is noticeably absent from eyespot foci (Connahs et al., 2019). The mechanism by which they are redeployed in a novel spatial context decoupled from their role in AP organization of the wing is unknown. Their presence however may be significant for the placement of eyespots, exemplified by the Gray–Scott model (Connahs et al., 2019).
We have shown that there are homologous distinct regions of gene expression in the developing wing imaginal disks of Nymphalidae and Drosophila. These divide the wing into four domains with characteristic combinatorial patterns of gene expression of the transcription factors En, Inv, Ci, and Sal. The boundaries between these domains are just anterior to the M1 vein, at the M3 vein, and at the Cu2 vein. Exactly how the expression and overlap of these transcriptional regulators influences the expression of Dpp, Hh, Wnt1/Wg and the deployment of Dll remains an open question. It is entirely possible that local differences in each of these factors could lead to differential placement of ocelli. Rationale for this hypothesis comes from previous developmental studies in J. coenia and B. anyana, which clearly show differential positioning of ocelli occurs by positioning Dll in the larval wing imaginal disk (Brakefield et al., 1996; Reed and Serfas, 2004; Saenko et al., 2011; Connahs et al., 2019).
Because each expression domain spans two wing cells, regulation of the ocellus patterning process may be correlated in adjacent wing cells of the same domain. Thus, we hypothesized that patterns of correlated variation between ocelli should map to expression domains if these domains differentially regulate the ocelli patterning process. Our analysis of border ocelli positioning in Satyridae and Nymphalidae suggest that the AP expression domains do not produce the same patterns of correlated variation in these two families. In Satyridae, the positioning of ocelli displayed a pattern of correlations that supports developmental and evolutionary independence of the expression domains. In this family, the position of an ocellus was most strongly correlated with the ocellus in the same expression domain and was weakly correlated with ocelli in different domains. In Nymphalidae however, no such pattern was present. Instead, ocelli were most correlated with ocelli in wing cells directly adjacent to them. The difference in the patterns of correlation between these two Families suggest that these expression domains may not act as independent developmental and evolutionary modules by default. In fact, evolution of modularity likely requires special conditions where selection favors divergent specialization of parts (West-Eberhard, 2019). It is evident then to understand patterns of modularity in butterfly wing color patterns, we need to understand the selective pressures that favor specialization of pattern elements.
It is interesting to note the differences in forewing and hindwing patterns of correlation. These differences are most likely facilitated by local regulation of patterning events imposed by homeobox selector genes, Antennapedia (Antp) and Ultrabithorax (Ubx). Forewing development is regulated by Antp whereas hindwing development is regulated by Ubx, and mutations affecting Ubx lead to the development of forewing color patterns on the hindwing (Weatherbee et al., 1999; Matsuoka and Monteiro, 2019). These findings suggest homeobox genes play a significant role in shaping pattern formation. The fact that forewing and hindwing correlations differ so substantially suggests that the Hox environment may influence the evolution of AP modularity, and provides a unique opportunity to understand the evolution of developmental modularity.
Color Heterogeneity
Supporting evidence for the potential of developmental autonomy of the AP expression domains stems from our analysis of color and shape discontinuities across several lepidopteran families. In many species of butterflies and moths, the color of pattern elements or of the background display sharp boundaries at various wing veins (Nijhout, 1991; Abbasi and Marcus, 2017). Across the five Families, we found that the vast majority of color discontinuities occur at veins that mark the boundary between expression domains (i.e., M1, M3, and Cu2). When examined at the individual Family level, we observed variation in the position that a color boundary most frequently occurred (Figure 8). This suggests that there may be Family-specific developmental patterns that influence the phenotypes that are more and less likely to occur on the wings. Lycaenids and riodinids, sister taxa, display color pattern discontinuities more frequently above the M3 vein, whereas nymphalids and pierids tend to have color discontinuities below the M3 vein. Papilionids have a more equal distribution of color discontinuities above and below M3. While the expression domains may be conserved across Lepidoptera the downstream uses of them may have become more specialized in different lineages.
Tails almost exclusively occur posterior to M3. M3, Cu1, and Cu2 tails occur in each family we surveyed and again, the frequency of each of these veins was family specific. Tails manifesting from the anal veins were far less common. Although not included in this study, butterflies in the family Hesperiidae seem to break this trend and only develop tails from anal veins (Li et al., 2019). Interestingly, these shape differences along the AP axis of the wing seem to affect the color patterns non-randomly. A common feature of tail formation in each family was the alteration of pattern elements in the wing cells associated with the tails. In many cases, pattern elements were dislocated distally in the wing cells that made up the tail. If tails and other shape differences are formed via differential growth, then this may affect the placement and/or size of pattern elements because they differentiate during the growth period of the wing late in the final larval instar. In previous studies we have found that growth of lepidopteran wings is spatially patterned and changes over time (Nijhout et al., 2014). Therefore, it is possible that differential growth along the AP axis of the wing could affect the patterning and phenotypic evolution of serially homologous pattern elements.
Modes of Pattern Evolution
The results we have presented in this paper provide evidence that AP positional information influences the development and evolution of color pattern, as well as wing shape and the development of tails on the wing. In many species, color pattern and wing size show distinct discontinuities at the locations of the veins that mark boundaries between the four developmental domains we uncovered. These findings imply that both growth and color pattern formation can be influenced by factors that are different in each of the four domains. Since pattern element specification depends upon only a few variables (e.g., morphogen gradients, cellular sensitivity to morphogens, and pigment synthesis pathways), changes in the AP expression domains could have profound effects on various attributes of pattern elements.
Wing growth late in the instar is regulated by two hormones, 20-hydroxyecdysone (20E) and insulin (Kremen and Nijhout, 1998; Miner et al., 2000; Nijhout and Grunert, 2002). 20-Hydroxyecdysone primarily drives cell division while insulins seem to influence cellular growth (Nijhout et al., 2018; McKenna et al., 2019). Additionally, evidence from Drosophila suggests 20E influences the rate of Notch and Wnt pattern progression in the wing (Mirth et al., 2009; Oliveira et al., 2014), which therefore may play a significant role in shaping butterfly wings (Macdonald et al., 2010). In Drosophila, Notch induces expression of Wnt1/Wg and Cut along the peripheral margin (Panin et al., 1997). Each of these genes are expressed in butterfly wings, but there are some significant differences. First, the peripheral tissue in butterflies is relatively large and forms complex contours at the boundary between the Notch expressing cells that makeup the wing primordium and the Wg/Cut expressing peripheral cells (Macdonald et al., 2010). Second, the expression of Wnt1/Wg and Cut in peripheral region leads to programmed cell death of the periphery during the pupal stage (Macdonald et al., 2010). In Lepidoptera therefore, this mechanism works like a molecular cookie-cutter (Nijhout, 1991; Macdonald et al., 2010). In light of our results that hindwing tails and other shape differences largely occur posterior to the M3 vein, Notch/Wg patterning may be differentially regulated along the AP axis. Thus, regional differences in the sensitivity to 20E, or in the response to 20E, could control the relative rates of growth and differential patterning of the wing margin in each of the four domains, and this could account for the diversity of wing shapes found in the Lepidoptera.
Color pattern development and evolution can likewise depend on differences in the molecular and cellular properties of the four domains. For instance, Wnt signaling is involved in the development of several features of the color pattern (Martin et al., 2012). The Wnt pathway is composed of various membrane receptors and intra-cellular signaling proteins (Komiya and Habas, 2008), and the cellular context in which these components are expressed could affect their interaction kinetics or patterns of expression to alter the concentration-dependent response to the morphogens. Additionally, alteration of a pigment synthesis pathway may be the simplest way to modify the pattern. Within the expression domain of an eyespot, for instance, different pigments are synthesized at different distances form the focus. This can happen because differences in the expression patterns of key regulatory genes modify the expression and activity of enzymes in the pigment synthesis pathways, which leads to different outputs (Nijhout, 1991; Reed and Nagy, 2005; Hughes et al., 2020). The same may be true for differences between the four AP expression domains.
In order for AP domains to modularly control pattern formation and growth, there must be some level of genetic modularity. It is entirely possible that the genes involved in Wnt, Hh, Dpp, Insulin/TOR, 20E signaling, and pigment synthesis pathways may be controlled by modular cis-regulatory elements (CREs) that facilitate spatial and temporal differences in gene expression. For example, pigmentation pathways (Roeske et al., 2018) and the insulin/TOR cascade (Tang et al., 2011) are differentially utilized among tissues in Drosophila. Finer spatial resolution of gene expression in lepidopteran wings via RNA-seq and ATAC-seq should be able to determine how various signaling pathways are used throughout the wing. It will be interesting to see if CRISPR mutagenesis of CREs and spatially restricted transcriptional regulators results in more correlated development throughout the wing. If indeed the AP expression domains within the wing differentially regulate aspects of various pathways, this could be a mechanism by which the placement of pattern elements and development of wing shape evolve.
Our findings add several new tools to the toolbox of pattern development and evolution in the Lepidoptera. Not only can color patterns be compartmentalized by wing veins (Nijhout, 1991), but the nature of the background in which patterns develop can be different in the larger regions of the wing defined by the boundaries of the expression domains we describe. As we begin to learn more about how patterns and wing shapes arise from the underlying developmental mechanisms, it will also be interesting to explore why they come about. An investigation of potential selective pressures on wing shape and color pattern may shed light on what leads certain taxa to display heterogenous color patterns and shapes, while others do not. Understanding how selection shapes the reductionist control of gene expression to produce different patterns of developmental independence represents one of the most daunting challenges in biology. Nevertheless, the study of butterfly color patterns may provide a unique opportunity to shed light on some of these fundamental principles in evolutionary developmental biology.
Data Availability Statement
The raw data supporting the conclusions of this manuscript will be made available by the authors, without undue reservation, to any qualified researcher.
Author Contributions
KM and AK collected and analyzed the data and constructed the figures. All authors contributed equally to the conception and writing of the manuscript.
Funding
This work was supported by grants IOS-0744952 and IOS-1557341 from the National Science Foundation.
Conflict of Interest
The authors declare that the research was conducted in the absence of any commercial or financial relationships that could be construed as a potential conflict of interest.
Acknowledgments
We would like to thank Laura Grunert for help in mounting many of the butterflies used in this study.
Supplementary Material
The Supplementary Material for this article can be found online at: https://www.frontiersin.org/articles/10.3389/fevo.2020.00146/full#supplementary-material
FIGURE S1 | Border ocelli modularity differs between Nymphalidae and Satyridae. Heatmaps of correlations between the relative distance from the wing margin of border ocelli in Satyridae and Nymphalidae. Dark red colors indicate strong correlations. Light red, white, and blue represent weaker correlations.
References
Abbasi, R., and Marcus, J. M. (2017). A new A-P compartment boundary and organizer in holometabolous insect wings. Sci. Rep. 7:16337. doi: 10.1038/s41598-017-16553-5
Abbasi, R., and Marcus, J. M. (2019). Reply to ‘A refutation to ‘A new A-P compartment boundary and organizer in holometabolous insect wings’. Sci. Rep. 9:7048. doi: 10.1038/s41598-019-42679-9
Allen, C. E., Beldade, P., Zwaan, B. J., and Brakefield, P. M. (2008). Differences in the selection response of serially repeated color pattern characters: standing variation, development, and evolution. BMC Evol. Biol. 8:94. doi: 10.1186/1471-2148-8-94
Banerjee, T. D., and Monteiro, A. (2020). Molecular mechanism underlying venation patterning in butterflies. bioRxiv [Preprint]. doi: 10.1101/2020.01.02.892760
Beldade, P., and Brakefield, P. M. (2003). Concerted evolution and developmental integration in modular butterfly wing patterns. Evol. Dev. 5, 169–179. doi: 10.1046/j.1525-142X.2003.03025.x
Beldade, P., Koops, K., and Brakefield, P. M. (2002). Developmental constraints versus flexibility in morphological evolution. Nature 416, 844–847. doi: 10.1038/416844a
Blair, S. S. (1992). Engrailed expression in the anterior lineage compartment of the developing wing blade of Drosophila. Development 115, 21–33.
Blair, S. S., and Ralston, A. (1997). Smoothened-mediated Hedgehog signalling is required for the maintenance of the anterior-posterior lineage restriction in the developing wing of Drosophila. Development 124, 4053–4063.
Brakefield, P. M., Gates, J., Keys, D., Kesbeke, F., Wijngaarden, P. J., Montelro, A., et al. (1996). Development, plasticity and evolution of butterfly eyespot patterns. Nature 384, 236–242. doi: 10.1038/384236a0
Brunetti, C. R., Selegue, J. E., Monteiro, A., French, V., Brakefield, P. M., and Carroll, S. B. (2001). The generation and diversification of butterfly eyespot color patterns. Curr. Biol. 11, 1578–1585. doi: 10.1016/S0960-9822(01)00502-4
Capdevila, J., and Belmonte, J. C. I. (2001). Patterning mechanisms controlling vertebrate limb development. Annu. Rev. Cell Dev. Biol. 17, 87–132. doi: 10.1146/annurev.cellbio.17.1.87
Carroll, S., Gates, J., Keys, D., Paddock, S., Panganiban, G., Selegue, J., et al. (1994). Pattern formation and eyespot determination in butterfly wings. Science 265, 109–114. doi: 10.1126/science.7912449
Connahs, H., Tlili, S., van Creij, J., Loo, T. Y. J., Banerjee, T. D., Saunders, T. E., et al. (2019). Activation of butterfly eyespots by Distal-less is consistent with a reaction-diffusion process. Development 146:dev169367. doi: 10.1242/dev.169367
Cook, O., Biehs, B., and Bier, E. (2004). Brinker and Optomotor-blind act coordinately to initiate development of the L5 wing vein primordium in Drosophila. Development 131, 2113–2124. doi: 10.1242/dev.01100
D’Abrera, B. (1981). Butterflies of the Neotropical Region. Part I. Papilionidae and Pieridae. Melbourne: Lansdowne Editions.
D’Abrera, B. (1982). Butterflies of the Oriental Region. Part I. Papilionidae, Pieridae and Danaidae. Victoria: Hill House.
D’Abrera, B. (1984a). Butterflies of the Neotropical Region. Part II. Danaidae, Ithomiidae, Heliconidae and Morphidae. Victoria: Hill House.
D’Abrera, B. (1985). Butterflies of the Oriental Region. Part II. Nymphalidae, Satyridae and Amathusidae. Victoria: Hill House.
Gawne, R., and Nijhout, H. F. (2019). Expanding the nymphalid groundplan’s domain of applicability: pattern homologies in an arctiid moth (Utetheisa ornatrix). Biol. J. Linn. Soc. 126, 912–924. doi: 10.1093/biolinnean/bly193
Hughes, J. T., Williams, M. E., Johnson, R., Grover, S., Rebeiz, M., and Williams, T. M. (2020). Gene regulatory network homoplasy underlies recurrent sexually dimorphic fruit fly pigmentation. Front. Ecol. Evol. 8:80. doi: 10.3389/fevo.2020.00080
Keys, D. N., Lewis, D. L., Selegue, J. E., Pearson, B. J., Goodrich, L. V., Johnson, R. L., et al. (1999). Recruitment of a Hedgehog regulatory circuit in butterfly eyespot evolution. Science 283, 532–534. doi: 10.1126/science.283.5401.532
Komiya, Y., and Habas, R. (2008). Wnt signal transduction pathways. Organogenesis 4, 68–75. doi: 10.4161/org.4.2.5851
Kremen, C., and Nijhout, H. F. (1998). Control of pupal commitment in the imaginal disks of Precis coenia (Lepidoptera: Nymphalidae). J. Insect Physiol. 44, 287–296. doi: 10.1016/S0022-1910(97)00121-2
Lecuit, T., and Cohen, S. M. (1998). Dpp receptor levels contribute to shaping the Dpp morphogen gradient in the Drosophila wing imaginal disc. Development 125, 4901–4907.
Li, W., Cong, Q., Shen, J., Zhang, J., Hallwachs, W., Janzen, D. H., et al. (2019). Genomes of skipper butterflies reveal extensive convergence of wing patterns. Proc. Natl. Acad. Sci. U.S.A. 116, 6232–6237. doi: 10.1073/pnas.1821304116
Macdonald, W. P., Martin, A., and Reed, R. D. (2010). Butterfly wings shaped by a molecular cookie cutter: evolutionary radiation of lepidopteran wing shapes associated with a derived Cut/wingless wing margin boundary system. Evol. Dev. 12, 296–304. doi: 10.1111/j.1525-142X.2010.00415.x
Martin, A., Papa, R., Nadeau, N. J., Hill, R. I., Counterman, B. A., Halder, G., et al. (2012). Diversification of complex butterfly wing patterns by repeated regulatory evolution of a Wnt ligand. Proc. Natl. Acad. Sci. U.S.A. 109, 12632–12637. doi: 10.1073/pnas.1204800109
Martin, A., and Reed, R. D. (2010). Wingless and Aristaless2 define a developmental ground plan for moth and butterfly wing pattern evolution. Mol. Biol. Evol. 27, 2864–2878. doi: 10.1093/molbev/msq173
Martin, A., and Reed, R. D. (2014). Wnt signaling underlies evolution and development of the butterfly wing pattern symmetry systems. Dev. Biol. 395, 367–378. doi: 10.1016/j.ydbio.2014.08.031
Matsuoka, Y., and Monteiro, A. (2019). Hox genes are essential for the development of novel serial homologous eyespots on the wings of Bicyclus anynana butterflies. bioRxiv [Preprint]. doi: 10.1101/814848
Mazo-Vargas, A., Concha, C., Livraghi, L., Massardo, D., Wallbank, R. W. R., Zhang, L., et al. (2017). Macroevolutionary shifts of WntA function potentiate butterfly wing-pattern diversity. Proc. Natl. Acad. Sci. U.S.A. 114, 10701–10706. doi: 10.1073/pnas.1708149114
McKenna, K. Z., Tao, D., and Nijhout, H. F. (2019). Exploring the role of insulin signaling in relative growth: a case study on wing-body scaling in Lepidoptera. Integr. Comp. Biol. 59, 1324–1337. doi: 10.1093/icb/icz080
Milán, M., Pérez, L., and Cohen, S. M. (2002). Short-range cell interactions and cell survival in the Drosophila wing. Dev. Cell 2, 797–805. doi: 10.1016/S1534-5807(02)00169-7
Miner, A. L., Rosenberg, A. J., and Nijhout, H. F. (2000). Control of growth and differentiation of the wing imaginal disk of Precis coenia (Lepidoptera: Nymphalidae). J. Insect Physiol. 46, 251–258. doi: 10.1016/S0022-1910(99)00177-8
Mirth, C. K., Truman, J. W., and Riddiford, L. M. (2009). The Ecdysone receptor controls the post-critical weight switch to nutrition-independent differentiation in Drosophila wing imaginal discs. Development 136, 2345–2353. doi: 10.1242/dev.032672
Monteiro, A. (2015). Origin, development, and evolution of butterfly eyespots. Annu. Rev. Entomol. 60, 253–271. doi: 10.1146/annurev-ento-010814-020942
Nellen, D., Burke, R., Struhl, G., and Basler, K. (1996). Direct and long-range action of a Dpp morphogen gradient. Cell 85, 357–368. doi: 10.1016/S0092-8674(00)81114-9
Nijhout, H. F. (1991). The Development and Evolution of Butterfly Wing Patterns. Washington, DC: Smithsonian Institution Press.
Nijhout, H. F. (1994). Symmetry systems and compartments in Lepidopteran wings: the evolution of a patterning mechanism. Development 1994(Suppl.), 225–233.
Nijhout, H. F. (2001). Elements of butterfly wing patterns. J. Exp. Zool. 291, 213–225. doi: 10.1002/jez.1099
Nijhout, H. F. (2017). “The common developmental origin of eyespots and parafocal elements and a new model mechanism for color pattern formation,” in Diversity and Evolution of Butterfly Wing Patterns, eds T. Sekimura and H. Nijhout (Singapore: Springer), 3–19.
Nijhout, H. F., Cinderella, M., and Grunert, L. W. (2014). The development of wing shape in Lepidoptera: mitotic density, not orientation, is the primary determinant of shape. Evol. Dev. 16, 68–77. doi: 10.1111/ede.12065
Nijhout, H. F., and Grunert, L. W. (2002). Bombyxin is a growth factor for wing imaginal disks in Lepidoptera. Proc. Natl. Acad. Sci. U.S.A. 99, 15446–15450. doi: 10.1073/pnas.242548399
Nijhout, H. F., Laub, E., and Grunert, L. W. (2018). Hormonal control of growth in the wing imaginal disks of Junonia coenia: the relative contributions of insulin and ecdysone. Development 145:dev160101. doi: 10.1242/dev.160101
Oliveira, M. M., Shingleton, A. W., and Mirth, C. K. (2014). Coordination of wing and whole-body development at developmental milestones ensures robustness against environmental and physiological perturbations. PLoS Genet. 10:e1004408. doi: 10.1371/journal.pgen.1004408
Otaki, J. M. (2012). Color pattern analysis of nymphalid butterfly wings: revision of the nymphalid groundplan. Zool. Sci. 29, 568–576. doi: 10.2108/zsj.29.568
Panganiban, G., Nagy, L., and Carroll, S. B. (1994). The role of the Distal-less gene in the development and evolution of insect limbs. Curr. Biol. 4, 671–675. doi: 10.1016/S0960-9822(00)00151-2
Panin, V. M., Papayannopoulos, V., Wilson, R., and Irvine, K. D. (1997). Fringe modulates Notch–ligand interactions. Nature 387, 908–912. doi: 10.1038/43191
Patel, N. H., Martin-Blanco, E., Coleman, K. G., Poole, S. J., Ellis, M. C., Kornberg, T. B., et al. (1989). Expression of engrailed proteins in arthropods, annelids, and chordates. Cell 58, 955–968. doi: 10.1016/0092-8674(89)90947-1
Paulsen, S. M. (1994). Quantitative genetics of butterfly wing color patterns. Dev. Genet. 15, 79–91. doi: 10.1002/dvg.1020150109
Paulsen, S. M., and Nijhout, H. F. (1993). Phenotypic correlation structure among elements of the color pattern in Precis coenia (Lepidoptera: Nymphalidae). Evolution 47, 593–618. doi: 10.1111/j.1558-5646.1993.tb02115.x
Reed, R. D., Chen, P.-H., and Nijhout, H. F. (2007). Cryptic variation in butterfly eyespot development: the importance of sample size in gene expression studies. Evol. Dev. 9, 2–9. doi: 10.1111/j.1525-142X.2006.00133.x
Reed, R. D., and Nagy, L. M. (2005). Evolutionary redeployment of a biosynthetic module: expression of eye pigment genes vermilion, cinnabar, and white in butterfly wing development. Evol. Dev. 7, 301–311. doi: 10.1111/j.1525-142X.2005.05036.x
Reed, R. D., and Serfas, M. S. (2004). Butterfly wing pattern evolution is associated with changes in a Notch/Distal-less temporal pattern formation process. Curr. Biol. 14, 1159–1166. doi: 10.1016/j.cub.2004.06.046
Roeske, M. J., Camino, E. M., Grover, S., Rebeiz, M., and Williams, T. M. (2018). Cis-regulatory evolution integrated the Bric-à-brac transcription factors into a novel fruit fly gene regulatory network. eLife 7:e32273. doi: 10.7554/eLife.32273
Saenko, S. V., Marialva, M. S. P., and Beldade, P. (2011). Involvement of the conserved Hox gene Antennapedia in the development and evolution of a novel trait. Evodevo 2:9. doi: 10.1186/2041-9139-2-9
Schindelin, J., Arganda-Carreras, I., Frise, E., Kaynig, V., Longair, M., Pietzsch, T., et al. (2012). Fiji: an open-source platform for biological-image analysis. Nat. Methods 9, 676–682. doi: 10.1038/nmeth.2019
Shen, J., Dahmann, C., and Pflugfelder, G. O. (2010). Spatial discontinuity of Optomotor-blind expression in the Drosophila wing imaginal disc disrupts epithelial architecture and promotes cell sorting. BMC Dev. Biol. 10:23. doi: 10.1186/1471-213X-10-23
Strigini, M., and Cohen, S. M. (2000). Wingless gradient formation in the Drosophila wing. Curr. Biol. 10, 293–300. doi: 10.1016/S0960-9822(00)00378-X
Sturtevant, M. A., Biehs, B., Marin, E., and Bier, E. (1997). The spalt gene links the A/P compartment boundary to a linear adult structure in the Drosophila wing. Development 124, 21–32.
Sugimori, S., Hasegawa, A., and Nakagoshi, H. (2016). Spalt-mediated dve repression is a critical regulatory motif and coordinates with Iroquois complex in Drosophila vein formation. Mech. Dev. 141, 25–31. doi: 10.1016/j.mod.2016.06.004
Tang, H. Y., Smith-Caldas, M. S. B., Driscoll, M. V., Salhadar, S., and Shingleton, A. W. (2011). FOXO regulates organ-specific phenotypic plasticity in Drosophila. PLoS Genet. 7:e1002373. doi: 10.1371/journal.pgen.1002373
Tanimoto, H., Itoh, S., ten Dijke, P., and Tabata, T. (2000). Hedgehog creates a gradient of Dpp activity in Drosophila wing imaginal discs. Mol. Cell 5, 59–71. doi: 10.1016/S1097-2765(00)80403-7
Wang, D., Li, L., Lu, J., Liu, S., and Shen, J. (2016). Complementary expression of optomotor-blind and the Iroquois complex promotes fold formation to separate wing notum and hinge territories. Dev. Biol. 416, 225–234. doi: 10.1016/j.ydbio.2016.05.020
Weatherbee, S. D., Frederik Nijhout, H., Grunert, L. W., Halder, G., Galant, R., Selegue, J., et al. (1999). Ultrabithorax function in butterfly wings and the evolution of insect wing patterns. Curr. Biol. 9, 109–115. doi: 10.1016/S0960-9822(99)80064-5
West-Eberhard, M. J. (2019). Modularity as a universal emergent property of biological traits. J. Exp. Zool. Part B Mol. Dev. Evol. 332, 356–364. doi: 10.1002/jez.b.22913
Keywords: expression domains, pattern diversity, tails, color boundaries, nymphalid groundplan
Citation: McKenna KZ, Kudla AM and Nijhout HF (2020) Anterior–Posterior Patterning in Lepidopteran Wings. Front. Ecol. Evol. 8:146. doi: 10.3389/fevo.2020.00146
Received: 28 February 2020; Accepted: 29 April 2020;
Published: 03 June 2020.
Edited by:
Marcus Kronforst, The University of Chicago, United StatesReviewed by:
Joseph John Hanly, George Washington University, United StatesArnaud Martin, University of California, Berkeley, United States
Copyright © 2020 McKenna, Kudla and Nijhout. This is an open-access article distributed under the terms of the Creative Commons Attribution License (CC BY). The use, distribution or reproduction in other forums is permitted, provided the original author(s) and the copyright owner(s) are credited and that the original publication in this journal is cited, in accordance with accepted academic practice. No use, distribution or reproduction is permitted which does not comply with these terms.
*Correspondence: H. Frederik Nijhout, aGZuQGR1a2UuZWR1