 Yinghua Zha
 Eva S. Lindström
 Alexander Eiler
 Richard Svanbäck
- 1Limnology, Department of Ecology and Genetics, Uppsala University, Uppsala, Sweden
- 2Department of Microbiology, Tumor and Cell Biology, Karolinska Institutet, Solna, Sweden
- 3Section for Aquatic Biology and Toxicology, Centre for BioGeoChemistry in the Anthropocene, Department of Biosciences, University of Oslo, Oslo, Norway
- 4Animal Ecology, Department of Ecology and Genetics, Uppsala University, Uppsala, Sweden
The composition of intestinal microbiota commonly varies among animal hosts and may affect host health. However, we have limited knowledge about the different relative roles of assembly processes, such as drift, dispersal and environmental selection, for the composition of gut microbiota. Here, we conducted a field study analyzing intestinal microbial communities of two fish species that either have (perch) or lack (roach) a stomach. We used a suite of statistical tools to evaluate the role of different assembly processes for intestine microbiota, including null model analysis (Chase et al., 2011; Fine and Kembel, 2011; Stegen et al., 2013), SourceTracker analysis (Knights et al., 2011) and several multivariate analyses, such as pRDA and PLS analysis. Drift, dispersal (i.e., microbes associated with food sources) and environmental factors (i.e., diet, host habitats), appeared to be of equal importance for the assembly of intestinal microbial communities in roach, while drift appeared most important in perch, followed by dispersal and environmental selection. Furthermore, we found that microbes associated with macroinvertebrates had a positive association to fish body condition (weight/length3) whereas microbes associated with zooplankton had a negative association to fish body condition. These results emphasize the important combined roles of drift, dispersal and environmental selection in shaping the host-associated microbial communities. We conclude that general conclusions about fish as a whole are not justified since different species differ in the relative roles of these important drivers of community assembly.
Introduction
Microbes inhabiting animals have been shown to contribute to the health of their hosts, for instance by facilitating nutrient absorption from the diet, and by stimulating important processes such as the development of host immune systems (Costello et al., 2012; Dutton and Turnbaugh, 2012). The interaction between hosts and their microbes, as well as the interactions among microbes, results in a rather stable ecosystem where host health can be seen as an ecosystem service (Costello et al., 2012). Therefore, how this microbial ecosystem works, and what internal and external factors influence its assembly is important for host ecology and evolution (Theis et al., 2016). Conceptually, intestinal microbial communities can be seen as metacommunities, i.e., multiple local communities that are connected by dispersal via interacting hosts (Leibold et al., 2004; Miller et al., 2018). Factors such as drift, selection by local environmental conditions and dispersal can differ in their importance affecting microbial communities depending on the circumstances (Vellend, 2010; Lindström and Langenheder, 2012).
Drift processes comprise of random recruitment from the regional species pool and stochastic community assembly, so the competitive interactions are less important in shaping the community composition (Chave, 2004; Schmidt et al., 2015). If a community is driven by ecological drift, there is a smaller role for environmental interactions, including species-interactions, in determining its community composition, and will show a less correlation between community assembly and environment (Nemergut et al., 2013). For instance, Dethlefsen et al. (2006) emphasized the importance of unpredictable events, such as colonization history, for gut microbiota assembly. In contrast Li and Ma (2016) suggested that in the human microbiome, the environmental conditions of the host generally dominate over ecological drift as a major assembly process.
Dispersal, the process and result of the spreading of organisms from one place to another, is an important regulator of microbial community assembly (Lindström and Langenheder, 2012; Veiga et al., 2014; Berga et al., 2015; Evan, 2016). In the intestine of vertebrates, microbes are dispersed from mother to offspring (Round and Mazmanian, 2009; Dominguez-Bello et al., 2010), from free-living microbes in the surrounding environment, or through ingestion of food particles (De Filippo et al., 2010; Koenig et al., 2011; Zhang et al., 2016). The dispersal ability of microbes from external sources to the intestine will likely vary, for instance because individual hosts may differ in their habitat and diet choice. This will affect which pools of environmental or food associated microorganisms can act as sources for intestinal microbial communities. When microbes successfully enter the host intestine they will have to compete with and integrate into the resident microbial communities (Derrien and van Hylckama Vlieg, 2015; Fukami, 2015; Zhang et al., 2016). Further they will also need to cope with the environment in the intestine (Benson et al., 2010; Campbell et al., 2012).
Environmental factors in the intestine could depend on host traits, such as host species, sex, and also characteristics of the host’s habitat such as temperature and salinity (Stewart et al., 2005; Sullam et al., 2012; Nelson et al., 2013; Bolnick et al., 2014). Other environmental factors, for example, food availability in different habitats, lay more complexity to microbial community assembly (Skulason and Smith, 1995; Bolnick et al., 2003). One apparent environmental factor affecting gut microbiota is the host’s diet, since it serves as a substrate for intestinal microbes (Spor et al., 2011; Wu et al., 2011; Dutton and Turnbaugh, 2012; Ravussin et al., 2012). The effect of food choice on gut microbiota is, thus, 2-fold: both as a source of dispersing microorganisms and as a factor affecting the local habitat conditions within the gut. Disentangling the complexity and quantifying the role of dispersal and environmental factors in the assembly of gut microbiota are important steps toward understanding the among individual variations in gut microbial composition.
Organisms that can use food more efficiently for growth will reduce their vulnerability to predation (Lundvall et al., 1999). The transfer of food into energy reserves is important for reproduction or for times when food is in short supply (Davis et al., 2011). Studies on gut microbiota suggest that microbes in the intestine are crucial for host energy gain and fat storage, where the composition of the microbiota matters for the efficiency of these processes (Bäckhed, 2011; Li et al., 2013; Shapira, 2016). For example bacteria can produce short chain fatty acids (SCFA) from the fermentation of carbohydrates, which then contribute to the energy maintenance of the host (Stevens and Hume, 1998). Furthermore, in wild animals, a higher body condition can be beneficial and result in both increased fecundity and increased survival when food is in short supply (Bender et al., 2008; Dutil and Lambert, 2000; Davis et al., 2011). Thus, detailed understanding of assembly processes in gut microbiota have direct implications for predicting host fitness and well-being (Nicholson et al., 2012).
In this study, we quantified how environmental factors, dispersal, and drift can influence the assembly of intestinal microbiota communities in two co-occurring fish species (Eurasian perch, Perca fluviatilis, and Roach, Rutilus rutilus). Perch and roach are two of the most dominant fish species in Swedish lakes (Persson et al., 1991; Svanbäck et al., 2008). These two species also have different digestive systems, with perch having and roach lacking a stomach. Both fish feed on zooplankton and macroinvertebrates. However, perch also include fish in their diet, and roach include plants and detritus in their diet (Svanbäck et al., 2008).
We analyzed fish intestinal microbial communities as well as microbes associated with their food sources and microbes in the surrounding environment. We hypothesized that environmental factors, such as fish diet and habitat choice will affect intestinal microbial communities (Ley et al., 2008; Spor et al., 2011; Wu et al., 2011). If microbes in the intestine are gained by dispersal via diet and are crucial for host energy gain and body condition (Bäckhed, 2011; Li et al., 2013; Shapira, 2016) we also expected that fish body condition would depend on bacterial dispersal sources.
Materials and Methods
Field Sampling
Sampling was done in Lake Erken in Sweden between September 4 and 5, 2013. Perch (Perca fluviatilis) and roach (Rutilus rutilus) were caught from three sites in lake Erken, including littoral, pelagic and profundal zones using standard survey-link pelagic and benthic multi-mesh gill nets. Littoral nets (30 m long and 1.5 m deep) were set just outside the vegetation at 2 m depth. Pelagic nets (27.5 m long and 6 m deep) were placed at the surface about 200 m from the shoreline and the littoral nets. Nets for the profundal zone (30 m long and 1.5 m deep) were set at 12-meter depth in the lake adjacent to the pelagic nets. We emptied nets immediately to get all fish after leaving the nets in the lake overnight. The fish were frozen immediately after removal from the nets at the Lake Erken field station. Fish were then kept frozen when transported to the lab at Uppsala University for analysis. From the pelagic nets, we divided the catch to represent fish from a depth of 0–3 meters and fish from a depth of 3–6 meters. We then choose maximum 50 individual fish of perch and roach from the littoral (perch: 50, roach: 46), pelagic (0–3 m) (perch: 44, roach: 32), pelagic (3–6 m) (perch: 50, roach: 6) and profundal (perch: 50, roach: 16) nets, respectively, summing up to 194 perch and 100 roach individuals. Perch and roach were chosen because they are the numerically dominant species in Lake Erken and were present in all nets. Water and microalgae were sampled with a Ruttner water sampler, meanwhile zooplankton was sampled with a plankton net (100 μm mesh size) from the littoral and pelagic sites. Sediment (N = 3 per site) and macro-invertebrate samples were taken from both littoral and profundal sites next to the gill-nets (see Supplementary Table S3).
Samples Processing
We determined the sex, measured the weight (W, to the nearest 0.1 g) and length (L, total length to the nearest mm) as well as the intestine length (to the nearest 0.1 mm) of each individual fish. Fish sex was categorized as male, female and YOY (young of the year). Fish body condition was calculated as W/L3 and would indicate the fish nutritional status and fitness, which is similar to the body mass index (BMI) used in human studies. The whole intestine was thereafter stored at −20°C in Eppendorf tubes for later bacterial community analysis. Water and algae were filtered onto 0.2 μm membrane filter (Pall Corporation) and 0.7 μm glass microfiber filter (WhatmanTM) separately. Individuals from zooplankton and macro-invertebrate samples, 0.25 gram sediment and filters from water and algae were all stored into sterilized Eppendorf tubes at −20°C for later bacterial analysis.
Analysis of Short-Term Diet by Stomach Content and Long-Term Diet by Stable Isotopes
Stomach contents of each fish were examined under dissecting microscope and were identified to lowest possible taxonomic group, and lengths of ≤10 prey from each taxonomic group were measured to the nearest 0.1 mm. The lengths of all prey were then converted to biomass (dry weight) using our own length-mass relationship. The biomass-based diet was then grouped into macroinvertebrates, zooplankton and fish and represents measures of short-term diet.
Stable isotopes of carbon and nitrogen are widely used to study long-term feeding ecology in wild populations (Post, 2002, Newsome et al., 2007; Alves-Stanley and Worthy, 2009). We used standard formulas to calculate the proportion of littoral carbon in the diet of an individual fish and its trophic position (Post, 2002; Matthews et al., 2010) using the isotopes from mussels and snails as baselines (Supplementary Table S3). Part of the dorsal muscle was dissected from perch and roach and kept at −20°C. Each muscle sample was dried for 48h at 60°C and ground to fine powder. The powder (around 1 mg) was packed into 6 × 4 mm tin capsules for 13C and 15N analysis using a continuous-flow isotope ratio mass spectrometer at University of California at Davis Stable Isotope Facility. In order to get the baseline values of different carbon and nitrogen sources, we collected snails [Theodoxus fluviatilis, a grazing littoral primary consumer (Jacoby, 1985)] and mussels [Zebra mussels, a pelagic primary consumer filtering phytoplankton (Strayer et al., 1999)] mostly around the littoral zones in the lake while fish sampling (Svanbäck and Persson, 2009).
DNA Extraction and Bacterial 16S rRNA Genes Illumina Sequencing
Bacteria DNA from the whole fish intestine were extracted using PowerSoil® DNA Isolation Kit (MO BIO Laboratories, Inc., Carlsbad, CA, United States) including PCR grade water as negative extraction control (VWR). Bacteria from algae, zooplankton, macroinvertebrates, water and sediment were extracted in the same way. 16S rRNA bacterial genes were amplified by using two universal primers, and PCR grade water was used as PCR negative controls. Polymerase chain reaction was applied in two steps. The first step was amplified with the universal primers 515F (5′-GTGCCAGCMGCCGCGGTAA -3′) and 806R (5′- GGACTACHVGGGTWTCTAAT-3′). Triplicates of 20 μl reaction were carried out for each sample. Each reaction consisted of 10 μM of forward and reverse primers, 5 × reaction buffer, 2 mM of dNTPs and 2 U/μl Q5 HF DNA polymerase and 1 μl of DNA template. Reactions were started with initial denaturation at 98°C for 30 s, then followed with 30 cycles of denaturation at 98°C for 10 s, annealing at 58°C for 30 s and extension at 72°C for 30 s. A final extension was done at 72°C for 2 min. First step PCR products were purified and concentrated using Agencourt® AMPure® XP (Beckman Coulter). Purified products were then used as the template for the second step PCR. Forward and reverse barcode primers were used for the second step PCR. Triplicates were prepared for each sample. Each reaction consisted of 1.25 μM of primers, 5 × reaction buffer, 2 mM of dNTPs and 2 U/μl of Q5 HF DNA polymerase and 1 μl of template. Each reaction started with initial denaturation at 98°C for 30 s, followed by 20 cycles of denaturation at 98°C for 10 s, annealing at 68°C for 30 s and extension at 72°C for 30 s. Final extension was finished at 72°C for 2 min. The second step PCR products were also purified with Agencourt® AMPure® XP, then quantified with Quant-iTTM PicoGreen® dsDNAReagent Kit (Invitrogen) according to manual instructions. Equal amounts of PCR products were mixed with a final concentration of 2.68 ng/ul and sent to sequencing. Sequencing was performed using Illumina Miseq in SNP&SEQ technology platform in the national genomics infrastructure Sweden and science for life laboratory in Uppsala.
Sequencing Data Analysis
In total, 165 fish were included in the sequencing analysis (Supplementary Table S1) due to the failure of PCR for some fish intestine samples. The raw amplicon sequencing data was demultiplexed and sequence-pairs were assembled using pipeline developed by Sinclair et al. (2015). In short, every read-pair produced was parsed and checked for recognizable barcodes on both the forward and reverse sequences.
Next, sequences with missing primers and unassigned base pairs were removed and resulting quality filtered assembled reads were clustered into operational taxonomical units (OTUs) using UPARSE (cutoff of 3% sequence dissimilarity) (Edgar, 2013). Taxonomy was assigned using CREST (Lanzén et al., 2012) and the ribosomal sequence database SilvaMod. Raw sequences were deposited in the European Nucleotide Archive (ENA) under accession numbers ERS4181501–ERS4181737.
Statistical Analysis
Figure 1 gives an overview of the sample and statistical analysis of this study. More specifically, after sequences had been assigned into operational taxonomic units (OTUs) with a 97% sequence similarity, we removed non-bacterial OTUs (e.g., Archaea) prior to all downstream analyses. Each sample was rarified down to 15299 reads using package GUniFrac in R. The following statistical analyses were also run in R (version 3.2.2). Phylogenetic trees were constructed using MacQIIME with default settings (FastTree; Price et al., 2010). We used the Bray-Curtis (vegan, version 2.3-5) and weighted UniFrac distances (phyloseq, version 1.12.2) based on the OTU’s relative abundance to calculate differences in community composition between samples (i.e., fish and environmental). Adding the phylogenetic perspective in distance matrix calculation takes into account the species phylogenetic relationship among communities, and this can help to capture of even small differences among communities (Cadotte et al., 2009). Non-metric multidimensional scaling (NMDS) of the distance matrices was done in package vegan. We used the function of metaMDS to test different k values (number of dimensions), and then used a Shepard plot to determine the value of k, then the first two axis were chosen to make the NMDS plot with ggplot2 package (version 2.1.0). PERMANOVA (vegan, version 2.3-5) was used to test the effects of all measured environmental factors on the intestinal microbial communities among individual fish.
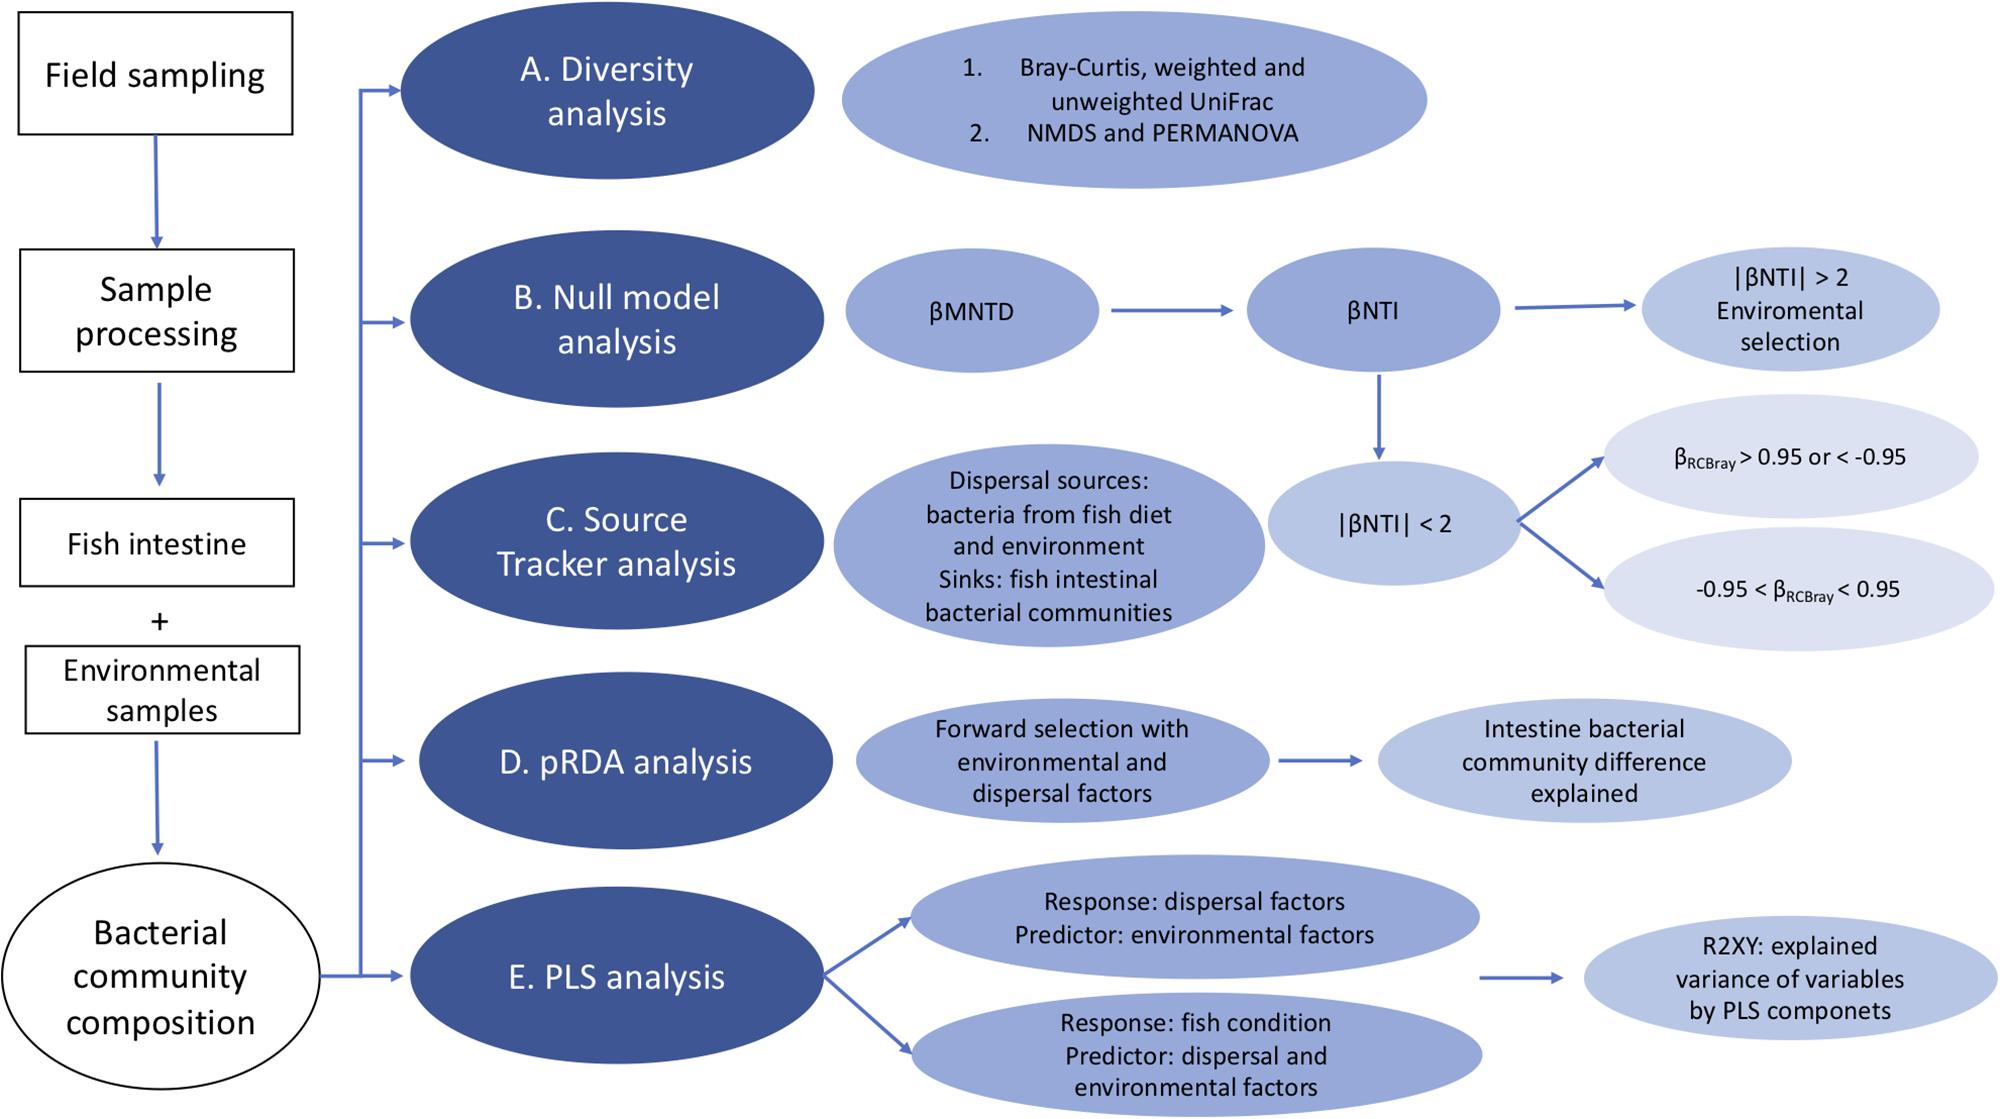
Figure 1. Flow chart of the statistical analysis of this study. (A) Beta diversity analysis of the bacterial community composition using Bray-Curtis and weighted UniFrac distances based on the OTU’s relative abundance. (B) We used null model analysis to determine the contributions of environmental selection and other ecological processes to the assembly of fish intestinal bacterial communities. In this analysis, βMNTD was used to measure the dissimilarities of bacterial communities between fish. Then βNTI is calculated as how much observed βMNTD deviated from the mean of the null distribution based on 1000 randomly shuffling of the tip labels on the phylogenetic tree, to check if the difference between microbial communities is determined by environmental selection when | βNTI | > 2 or not when | βNTI | < 2. For communities with | βNTI | < 2, Raup-Crick distances were calculated based on the relative abundance data. Then we combined βNTI and RCbray into βRCBray, to further assess the contribution of ecological processes. When βRCBray > 0.95 or < –0.95, it indicates that the community variation is influenced by dispersal limitation or mass effects, respectively, when βRCBray is between –0.95 and +0.95, it suggests that community variation is determined by ecological drift. (C) We used Source Tracker analysis, which is a Bayesian method to estimate the proportion of one community that originates from a set of source environments (Knights et al., 2011). In our study, we used it to determine the contribution and relative importance of different dispersal sources to intestinal bacterial communities. (D) pRDA analysis with forward selection is used to test how much the significant variables could explain the differences among fish intestinal bacterial communities. (E) PLS analysis is used to predict the relationship between dispersal factors and environmental factors on one hand, and fish body condition on the other with both environmental and dispersal factors.
Null Model Analysis
We applied a null model analysis to disentangle the contributions of environmental selection and other ecological processes for the assembly of fish intestinal microbial communities. First, we calculated phylogenetic beta diversity between pairs of fish using β-mean-nearest taxon distance (βMNTD) (Fine and Kembel, 2011; Stegen et al., 2013). Then in order to measure the degree to which community composition is determined by environmental selection, we calculated how much the observed βMNTD deviated from the mean of the null distribution based on random shuffling of the tip labels on the phylogenetic tree constructed by MacQIIME. We calculated βNTI (β-nearest taxon index) from 1000 random phylogenetic trees. βNTI indicates the number of standard deviations the observed βMNTD is from the mean of the distribution of the randomized phylogenetic trees (Stegen et al., 2012, 2013). We used the cut off |βNTI| > 2 to identify pairs of communities that were phylogenetically more similar than expected by chance, meaning that the observed difference between communities can be assumed to be determined by environmental selection (Stegen et al., 2013; Langenheder et al., 2017). Further we calculated Raup-Crick distances (RCbray) between pairs of intestinal microbial communities (Raup and Crick, 1979) based on relative abundance data according to modification from Chase et al. (2011). Among the numerous metrices describing OTU turnover, Raup-Crick provides information on whether the OTU turnover in one community is different from a community that would be structured mainly by drift (Chase et al., 2011). In the following analyses, we combined the βNTI and RCbray into βRCBray, to further assess the contribution of ecological processes to fish intestinal microbial communities that were not determined by environmental selection (|βNTI| < 2) (Stegen et al., 2013; Yan et al., 2016; Langenheder et al., 2017). This metric provides some indication of the possible underlying mechanisms of community assembly, in particular the degree to which deterministic processes create communities that deviate from those based on stochastic (null) expectations. An assumption of the analysis is that the samples of each fish species’ microbiome is representative for the regional species pool of the respective gut microbiome. When βRCBray > 0.95 or < −0.95, it indicates that the community variation is influenced by dispersal limitation or mass effects, respectively, when βRCBray is between −0.95 and +0.95, it suggests that community variation is determined by ecological drift (Stegen et al., 2013; Langenheder et al., 2017). The scripts of the null model analysis are attached as Supplementary Material.
Source Tracker Analysis
As fish diet can both be an environmental factor and a dispersal source for the fish intestinal communities, we treated it in two parts. Firstly, microorganisms attached associated with the diet and other external sources (i.e., water, sediment) were assigned as the dispersal sources for fish intestinal microbiota using section “Source Tracker Analysis”. Secondly, stomach content (such as the proportion of zooplankton, macroinvertebrates as diet) were used as intestine environmental factors, together with fish traits such as fish species, sex, habitat, length, weight, intestine length, trophic position, and proportion of littoral carbon.
Source Tracker analysis was used to analyze the contribution and the relative importance of different dispersal sources (bacteria from fish diet including algae, zooplankton, macroinvertebrates, prey fish, and water and sediment as known from sequencing data) (defined as sources in section “Source Tracker Anaysis”) to intestinal microbial communities of the individual fishes as known from sequencing data (defined as sinks in Source Tracker) (Knights et al., 2011). This analysis produces a table showing the proportion of each dispersal source explaining their contribution to the intestine microbiota of each individual fish. For roach of all sizes and perch that were shorter than 18 cm, bacteria attached to algae, zooplankton, macroinvertebrates, water and sediment were treated as external dispersal sources. As perch that are longer than 18 cm can be highly piscivorous and feeds on both smaller perch and roach (Svanbäck et al., 2015), we also included bacteria associated with the 5 shortest perch and 5 shortest roach as an extra source for perch longer than 18 cm. Furthermore, diet analyses of the perch showed that both smaller perch and roach was included in the diet of perch larger than 18 cm (data not shown). A limitation of the Source Tracker is that it computes a source to sink model, only considering unidirectional movement of bacteria into the gut.
pRDA Analysis
We used partial redundancy analysis (pRDA) to determine how much of the variation in intestinal microbial communities could be explained by dispersal and environmental factors (package vegan). According to the results from previous analyses (i.e., NMDS, and PERMANOVA) we found that intestinal microbial communities differed between perch and roach, thus pRDA analysis was implemented for perch and roach separately. Microbial community data of the fish intestines was Hellinger transformed to let us be able to implement ordination methods for species data containing many zeros and minimize the influence from rare species on the analysis (Legendre and Gallagher, 2001). Dispersal (i.e., the contribution of different dispersal sources as obtained from SourceTracker analysis) and environmental variables were log transformed [log (x + 1)] to remove the zeros in the dataset and to make the Canonical coefficient comparable (Ferreira et al., 1999). The full list of dispersal sources includes algae, invertebrates, sediments, water, zooplankton and in some cases fish (see above). The full list of environmental factors includes habitat, sex, length, weight, proportion of littoral carbon, trophic level, macroinvertebrates as diet and zooplankton as diet. Forward selection of both environmental and dispersal variables was implemented in separate analyses prior to pRDA to select only significant variables (p < 0.05) to be included in the model. We used step selection to check which factors should be added to the reduced RDA model with only the significant factors included. AIC value was used to estimate which was the best model, the lower the AIC value, the better the model. In the final reduced pRDA model for perch, the environmental variables were profundal habitat, fish length, trophic level, proportion of littoral carbon in the diet, and the dispersal variables for perch were the proportion of bacteria from zooplankton, macroinvertebrates and fish as obtained from the SourceTracker analysis. In the final reduced pRDA model for roach, the environmental variables were proportion of littoral carbon in the diet, macroinvertebrates as diet and zooplankton as diet; the dispersal variables for roach were the proportion of bacteria from algae, macroinvertebrates, water and zooplankton as obtained from the SourceTracker analysis (Table 1). The first pRDA model was run using environmental factors as constrained variables and dispersal factors as condition variables, while the second pRDA model used dispersal factors as constrained variable and environmental factors as a condition variable. In this way, we could analyze the effect of environmental and dispersal factors on the microbial community composition independent of each other. An ANOVA test of each pRDA model with 999 permutations was followed to test the significance of each variable in environmental and dispersal factors on the variance of intestinal microbial communities (vegan). Further we used variation partitioning based on RDA to quantify the amount of variation explained by environmental and dispersal factors, respectively. Projection of pRDA and variation partitioning was done by packages of ggplot2 and VennDiagram (version 1.6.17) separately.
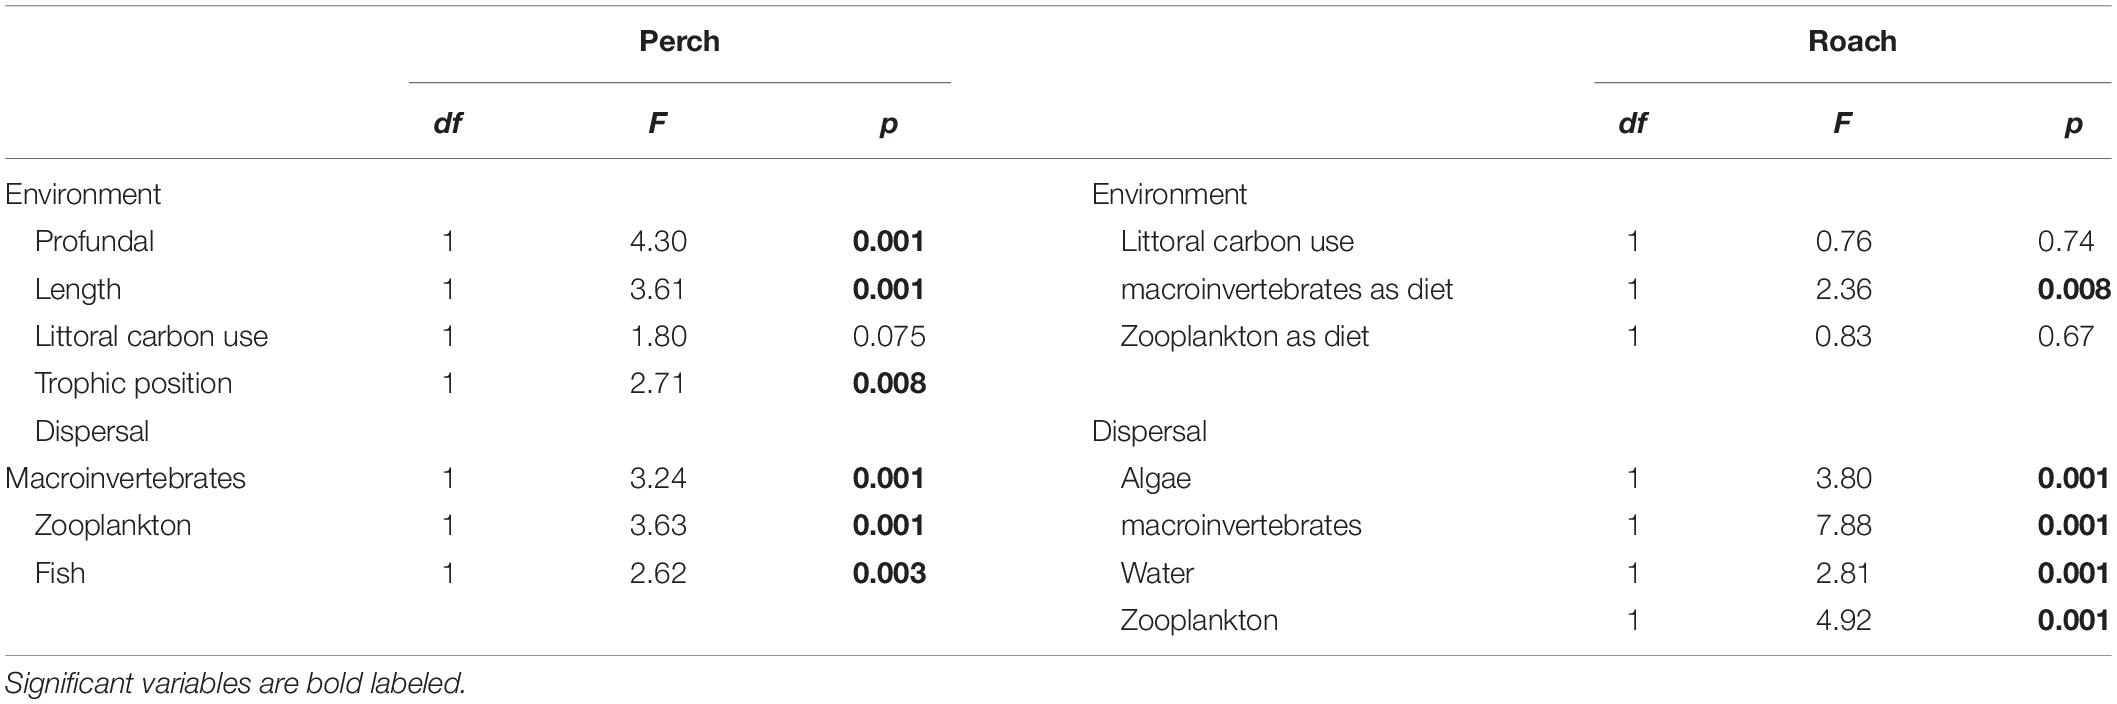
Table 1. ANOVA test the significance of each variable in the estimated environmental and dispersal factors explaining the variance of intestinal microbial communities from pRDA analysis in perch and roach.
PLS Analysis
We ran three separate partial least squares regression (PLS) models. In the first model we investigated if fish body condition (response variable) could be statistically explained by dispersal factors (predictor variables). In the second model, we investigated if fish body condition (response variable) could be explained by environmental factors (predictor variables). The factors included were the same as for the pRDA described above, i.e., dispersal factors were the contributions of the different dispersal sources as obtained from SourceTracker analysis.
In the third PLS model we wanted to explore how well bacteria from the different dispersal sources could establish in the intestines (based on SourceTracker data) considering how important that particular source was as a diet. In this analysis, therefore, the dispersal factors were used as response variables while the environmental factors were used as predictor variables.
For the PLS we used the package plsdepot version 0.1.17 and all analyses were made for perch and roach separately. The R2Xy value (explained variance of variables by PLS components) was used to evaluate how strong this relationship was with a cutoff at 0.8 (Eriksson et al., 2013). Variables in environmental and dispersal factors were log (x + 1) transformed before analysis. The final PLS results were projected as principal component figures showing a circle of correlations with arrows indicating tested variables.
Results
Fish intestinal bacteria were distinctively different from those from the dispersal sources (Figure 2A and Supplementary Figure S1A). Among intestinal microbial communities, fish species (perch and roach) seemed to be one of the major steering factors (Figure 2B and Supplementary Figure S1B). PERMANOVA showed that the microbial communities among individual fish were significantly dependent on the habitat (i.e., littoral, profundal or pelagic) and fish species (Supplementary Table S2).
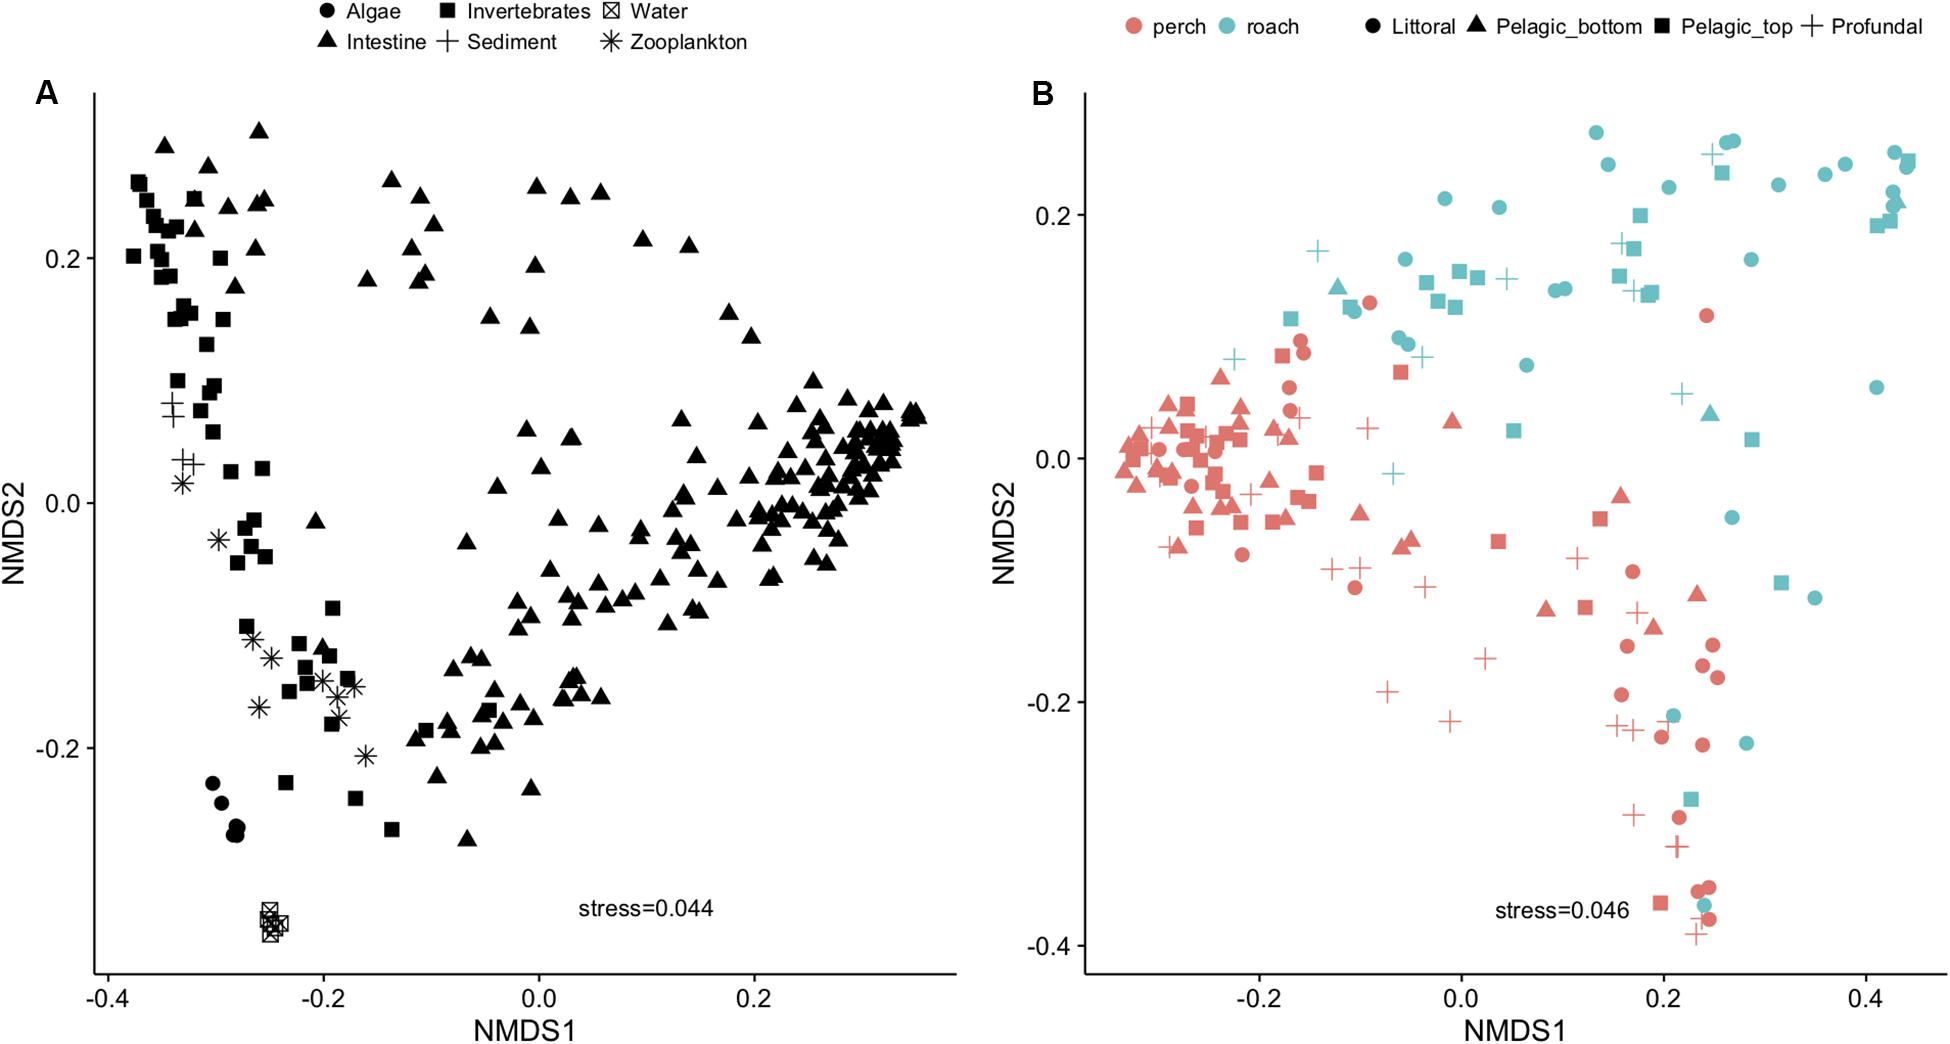
Figure 2. NMDS plot using Bray-Curtis distance showing variations of microbial communities in fish intestine and external dispersal sources (A) and fish species as the main driver for the variation within gut microbial communities (B).
The null model analysis showed that ecological drift could explain 60% of the assembly of the communities in perch, followed by dispersal limitation, environmental selection and mass effects (Figure 3A). In contrast, roach communities appeared to be assembled by environmental selection, dispersal and ecological drift to about an equal degree (approximately 30% each, Figure 3B).
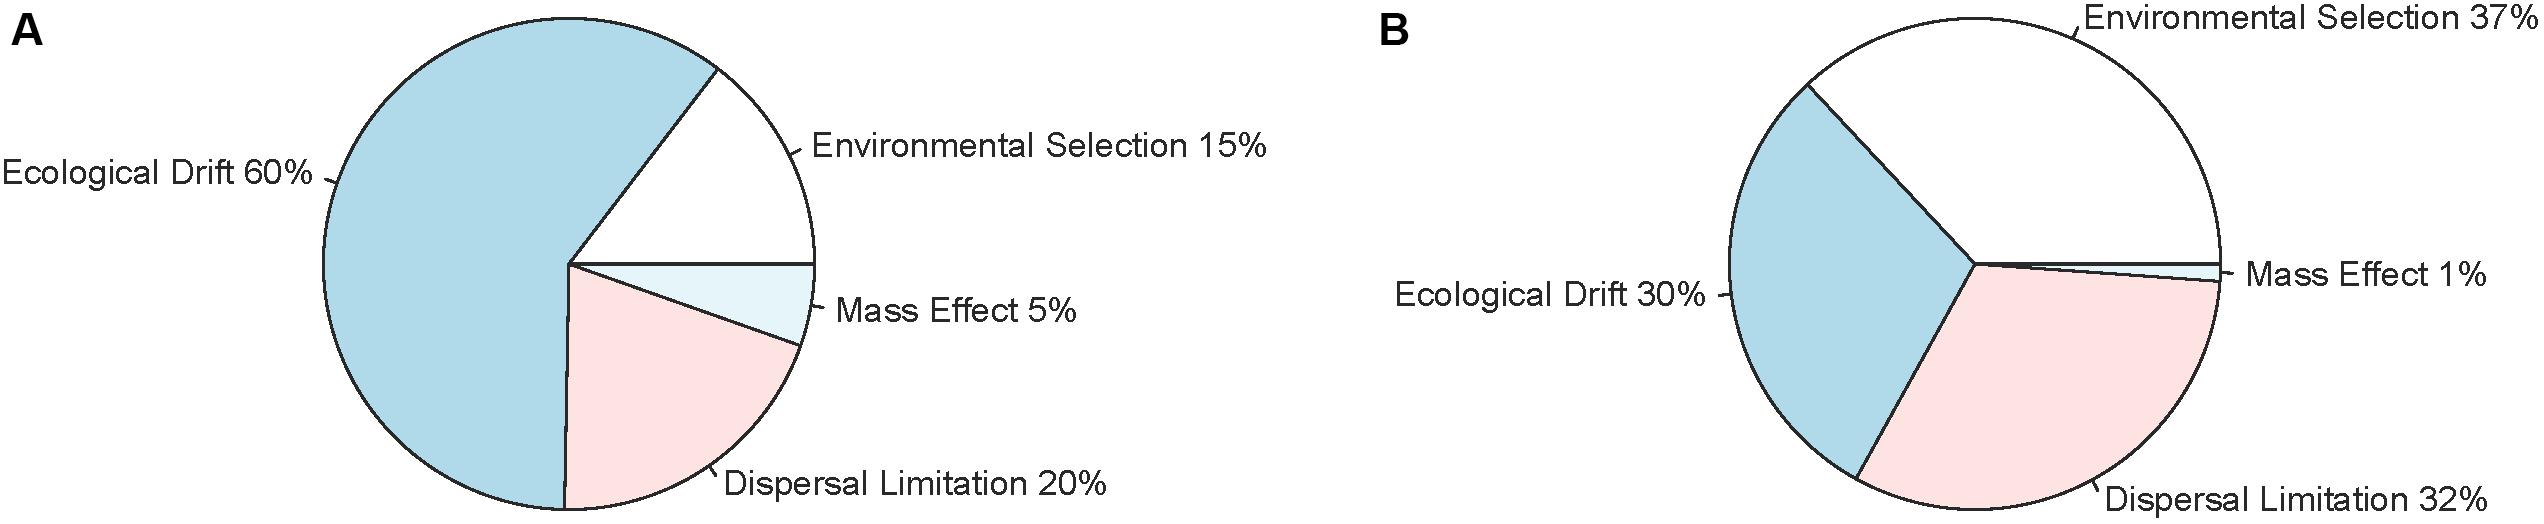
Figure 3. Relative importance of environmental selection, mass effects, dispersal limitation and ecological drift for the variation of intestinal microbial communities among perch (A) and roach (B) as obtained from null model analysis.
Source Tracker analysis showed that dispersal sources contributed to microbiota to different degrees, and this was dependent on fish species. In perch, zooplankton appeared as the most important source of dispersal, followed by macroinvertebrates and fish (Figure 4A). In contrast, the most important dispersal source in roach appeared to be macroinvertebrates (Figure 4B), followed by zooplankton, and algae. Water and sediment seemed to be negligible as dispersal sources in both fish species. Still in both perch and roach, unknown dispersal sources contributed to 28–35% in our Source Tracker model (“unknown” in Figure 4). These unknown sources may be associated with zooplankton and macroinvertebrates that were not present during the time of sampling or not present at the place of sampling.
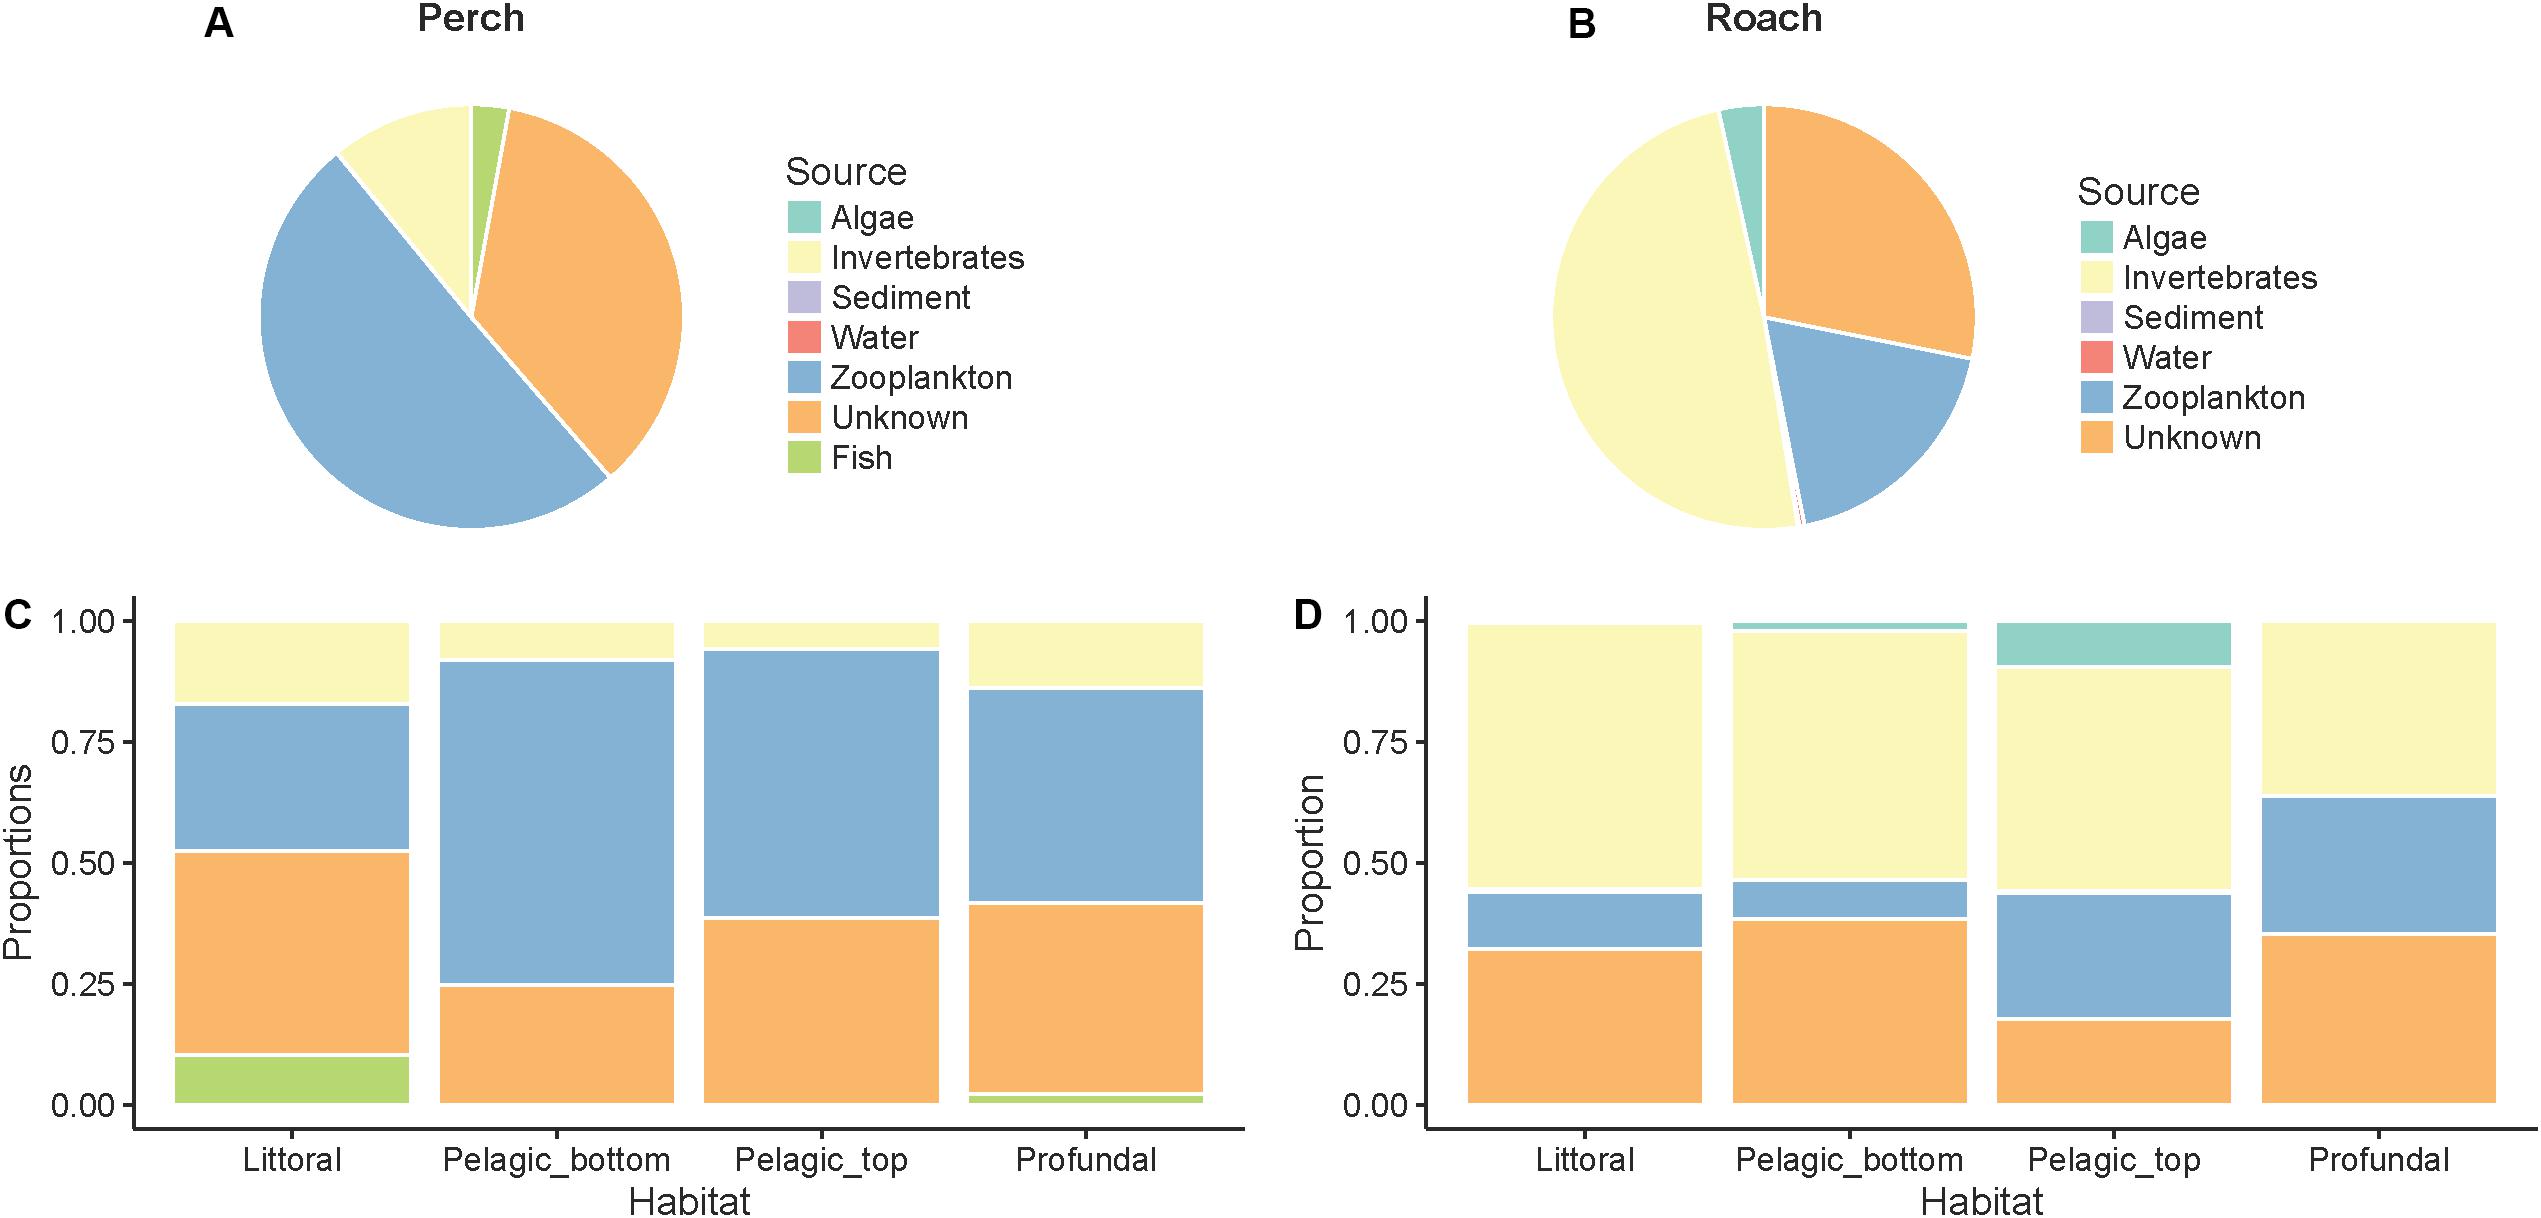
Figure 4. Contributions of microbes from different dispersal sources to intestinal microbial communities as determined by SourceTracker analysis. In perch (A) and roach (B) across habitats in perch (C) and across habitats in roach (D).
When analyzing the Source Tracker results grouped by habitat, we observed that fish as food sources could contribute to the intestinal bacteria in perch from littoral and profundal zones but not from pelagic zones (Figure 4C). Further, zooplankton contributed slightly more to microbes in pelagic fish than in fish from the littoral and profundal zones. In roach (Figure 4D), microbes attached to algae contributed to the microbes in pelagic fish but not to the gut microbiota of littoral and profundal fish.
Forward selection in RDA and subsequent pRDA analysis showed that several environmental and dispersal factors could significantly explain variation in microbial community composition among fishes, and that there were differences between perch and roach (Table 1). More specifically, profundal habitat, fish length and trophic position were significant environmental factors explaining variations in the gut microbiota of perch (Figure 5A and Table 1), while for roach the only significant environmental factor was macroinvertebrates as diet (Figure 5B and Table 1). There were also differences between the fish species when it came to the dispersal factors explaining variations in the microbiota. Bacteria from macroinvertebrates, zooplankton and fish could significantly explain the variation among perch gut microbiota (Figure 5C and Table 1), while for roach, bacteria from algae and water as well as from macroinvertebrates and zooplankton were significant dispersal variables (Figure 5D and Table 1).
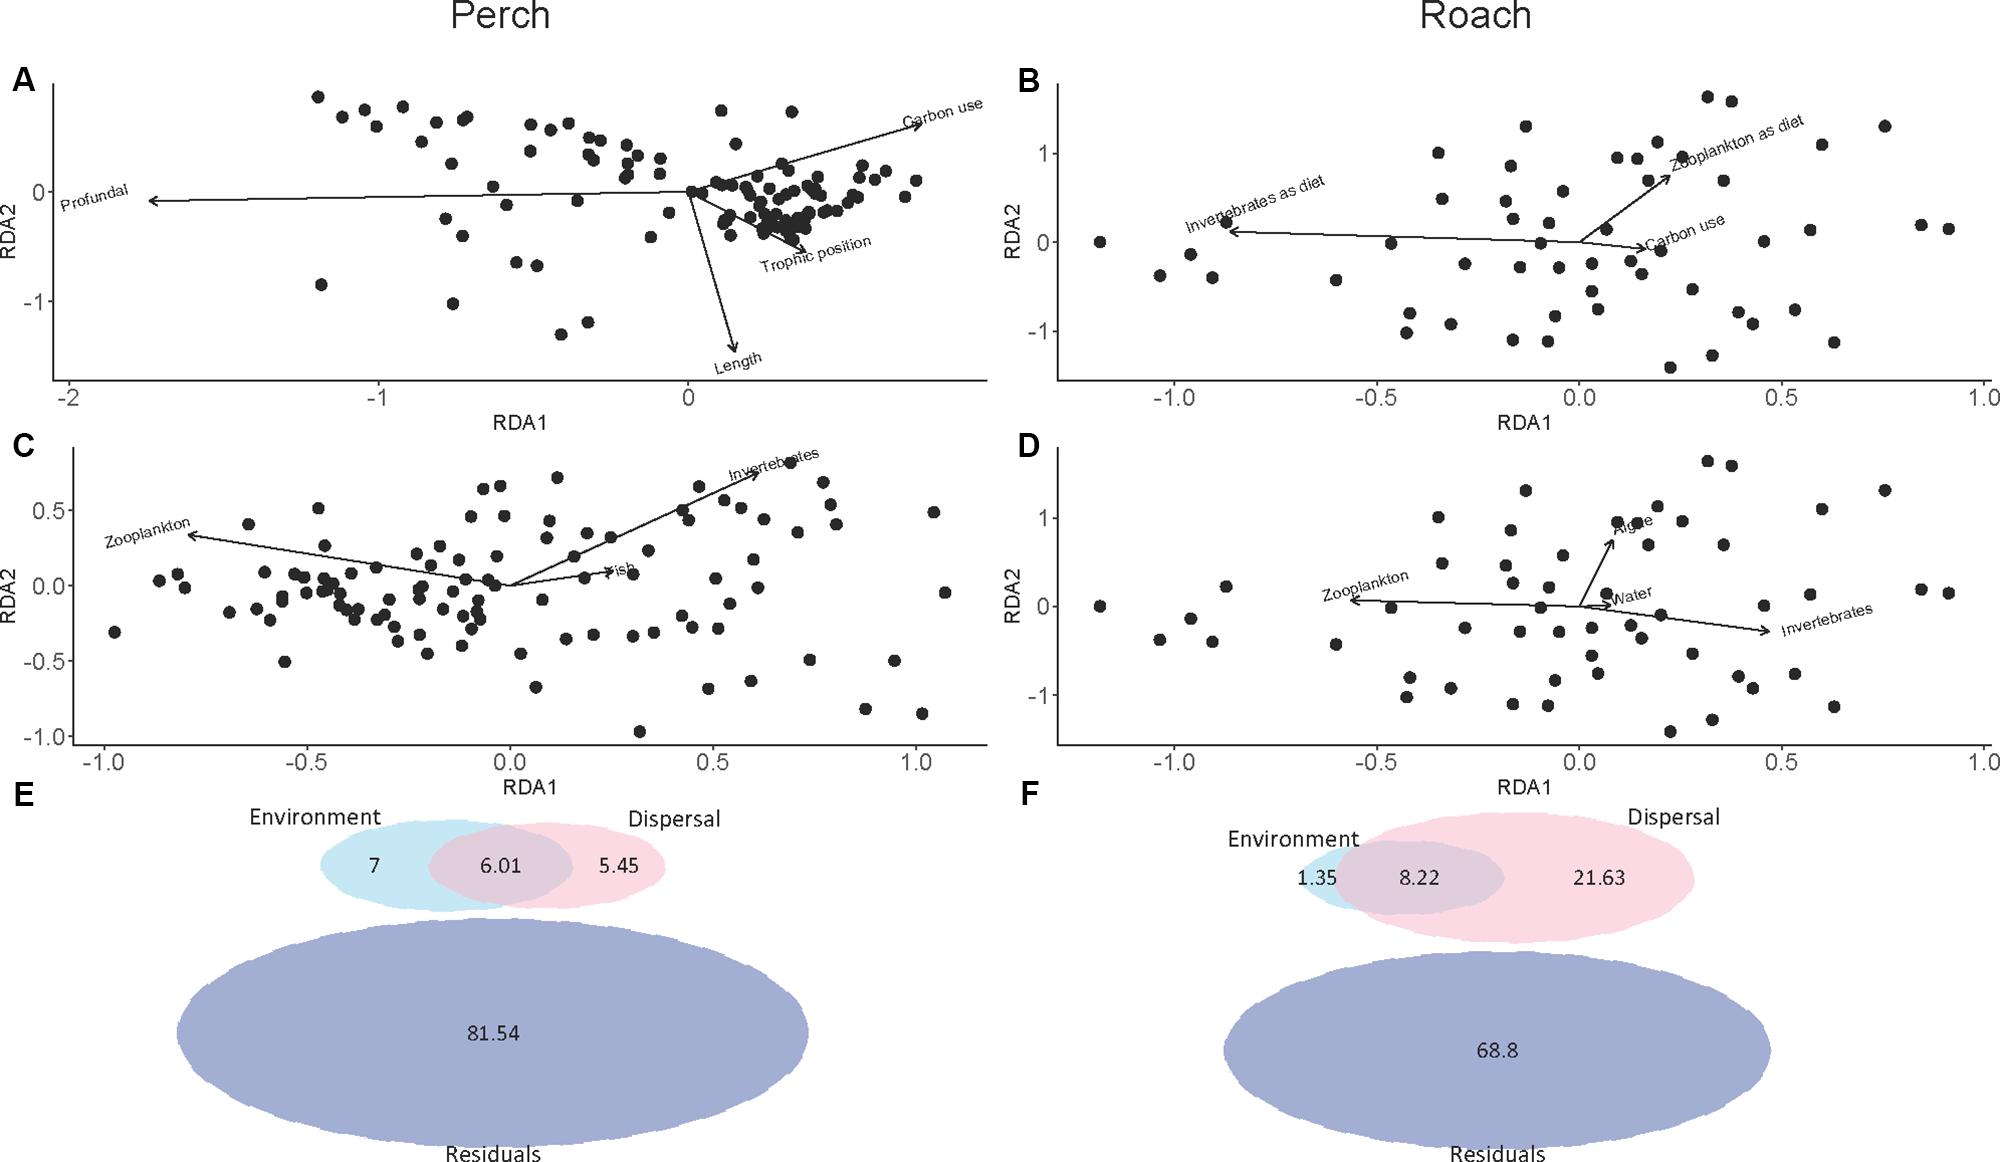
Figure 5. pRDA plot showing the covariation between the composition of intestinal microbial communities and environmental factor in perch (A) and in roach (B), shown as arrows. pRDA plot showing the covariation between the composition of intestinal microbial communities and dispersal factors in perch (C) and in roach (D), shown as arrows. Proportion of variance in intestinal microbial communities explained by environmental and dispersal factors from variation partitioning analysis in perch (E) and in roach (F). Residuals is variation in community composition unexplained by environment and dispersal factors.
Variation partitioning analysis further revealed the differences between perch and roach in the percentage of environmental and dispersal factors that could explain the variation in microbiota (Figures 5E,F). While dispersal explained 21.63% of the variation in roach, only a small proportion of the variation could be explained by dispersal in perch (5.45%). The proportion that dispersal explained in perch was approximately equal to the proportions explained by environmental factors (7%) and their shared contribution (6.01%) (Figure 5E). In both fish species the largest part of the variation was unexplained by the RDA models.
Partial least squares analyses showed that different dispersal sources were related to fish body condition in perch and roach (Figure 6 and Table 2), but only a relatively low proportion if the fish body condition variation could be explained (22.6% variance explained for perch, 4.88% variation explained for roach). More specifically, the effect of macroinvertebrates and zooplankton associated microbes appeared more pronounced compared with other dispersal factors, however, zooplankton as a dispersal source was negatively associated with fish body condition, while macroinvertebrates as a dispersal source was positively associated with fish body condition (Figure 6). When we also included environmental factors in the PLS analyses of fish body condition, more of the variation could be explained (39.03% for perch and 10.88% for roach, respectively), and different variables were related to fish body condition (Tables 3, 4). In this analysis macroinvertebrates as diet was positively related to fish body condition in both perch and roach (Figure 7). Macroinvertebrates as diet was strongly related to roach condition, while this relation was weaker than that between microbes from macroinvertebrates and roach condition (Figure 7). PLS analysis between environmental and dispersal factors showed that, in both perch and roach, that the contribution of bacteria from zooplankton to microbiota in fish intestine was associated with the degree of zooplankton as food, while for macroinvertebrates this association was weaker (Figure 8 and Table 5).
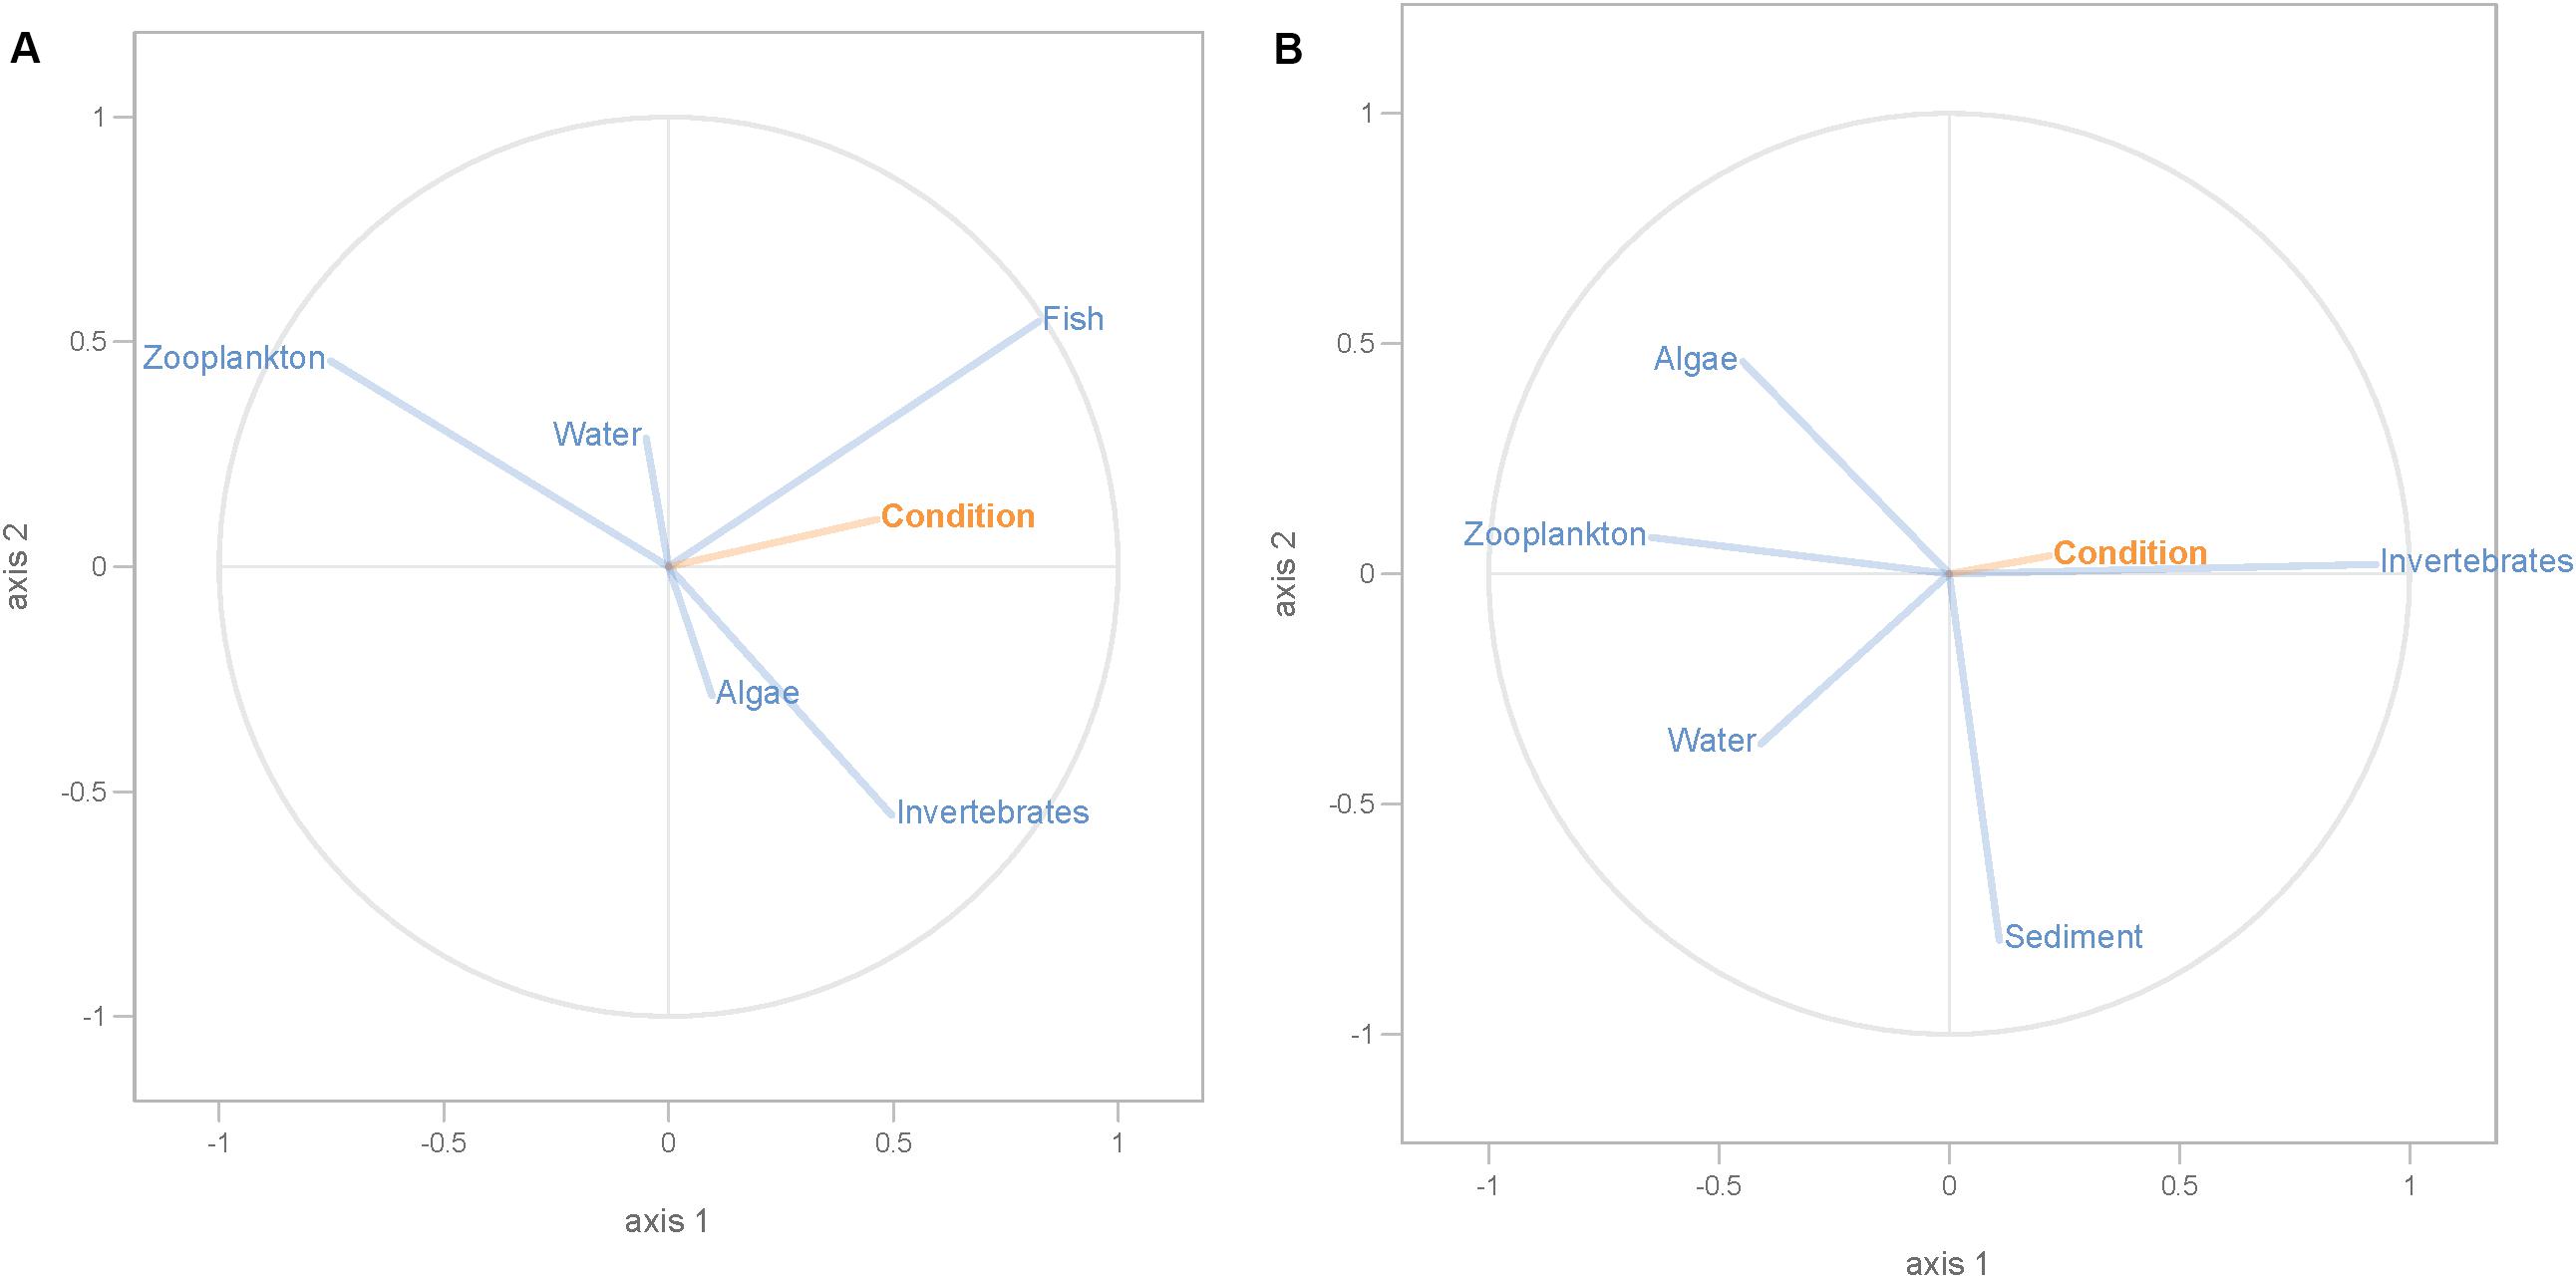
Figure 6. PLS regression analysis between fish body condition and dispersal factors. Fish body condition was response variable (orange lines), and dispersal factors were predictor variables (blue lines) in perch (A) and roach (B).
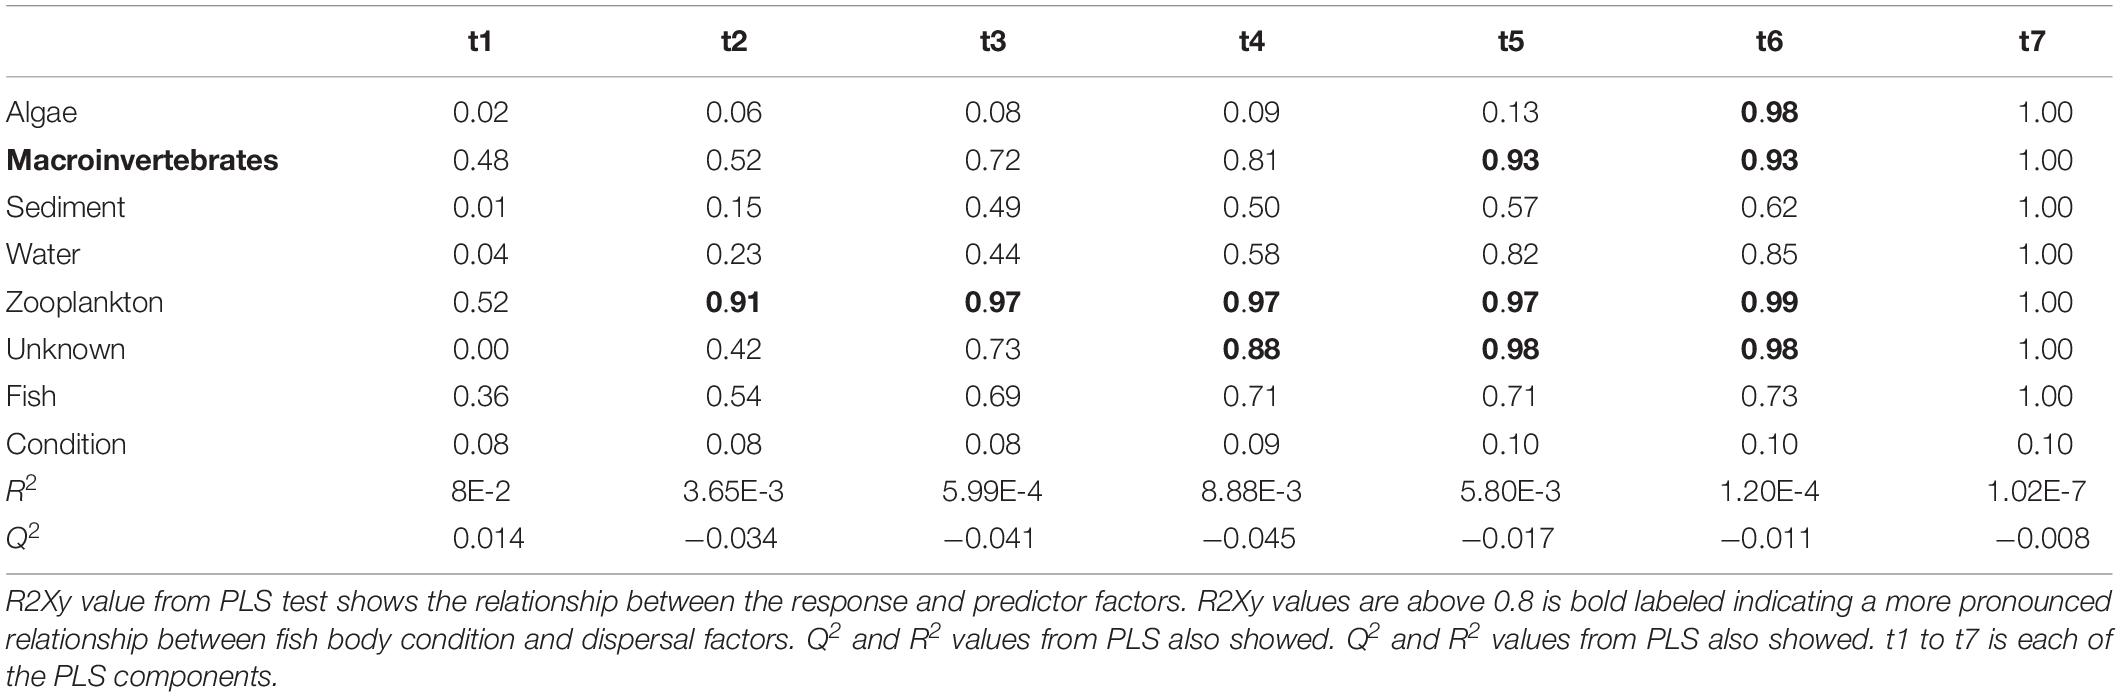
Table 2. Results from PLS model 1 tested relationship between fish body condition and dispersal factors.
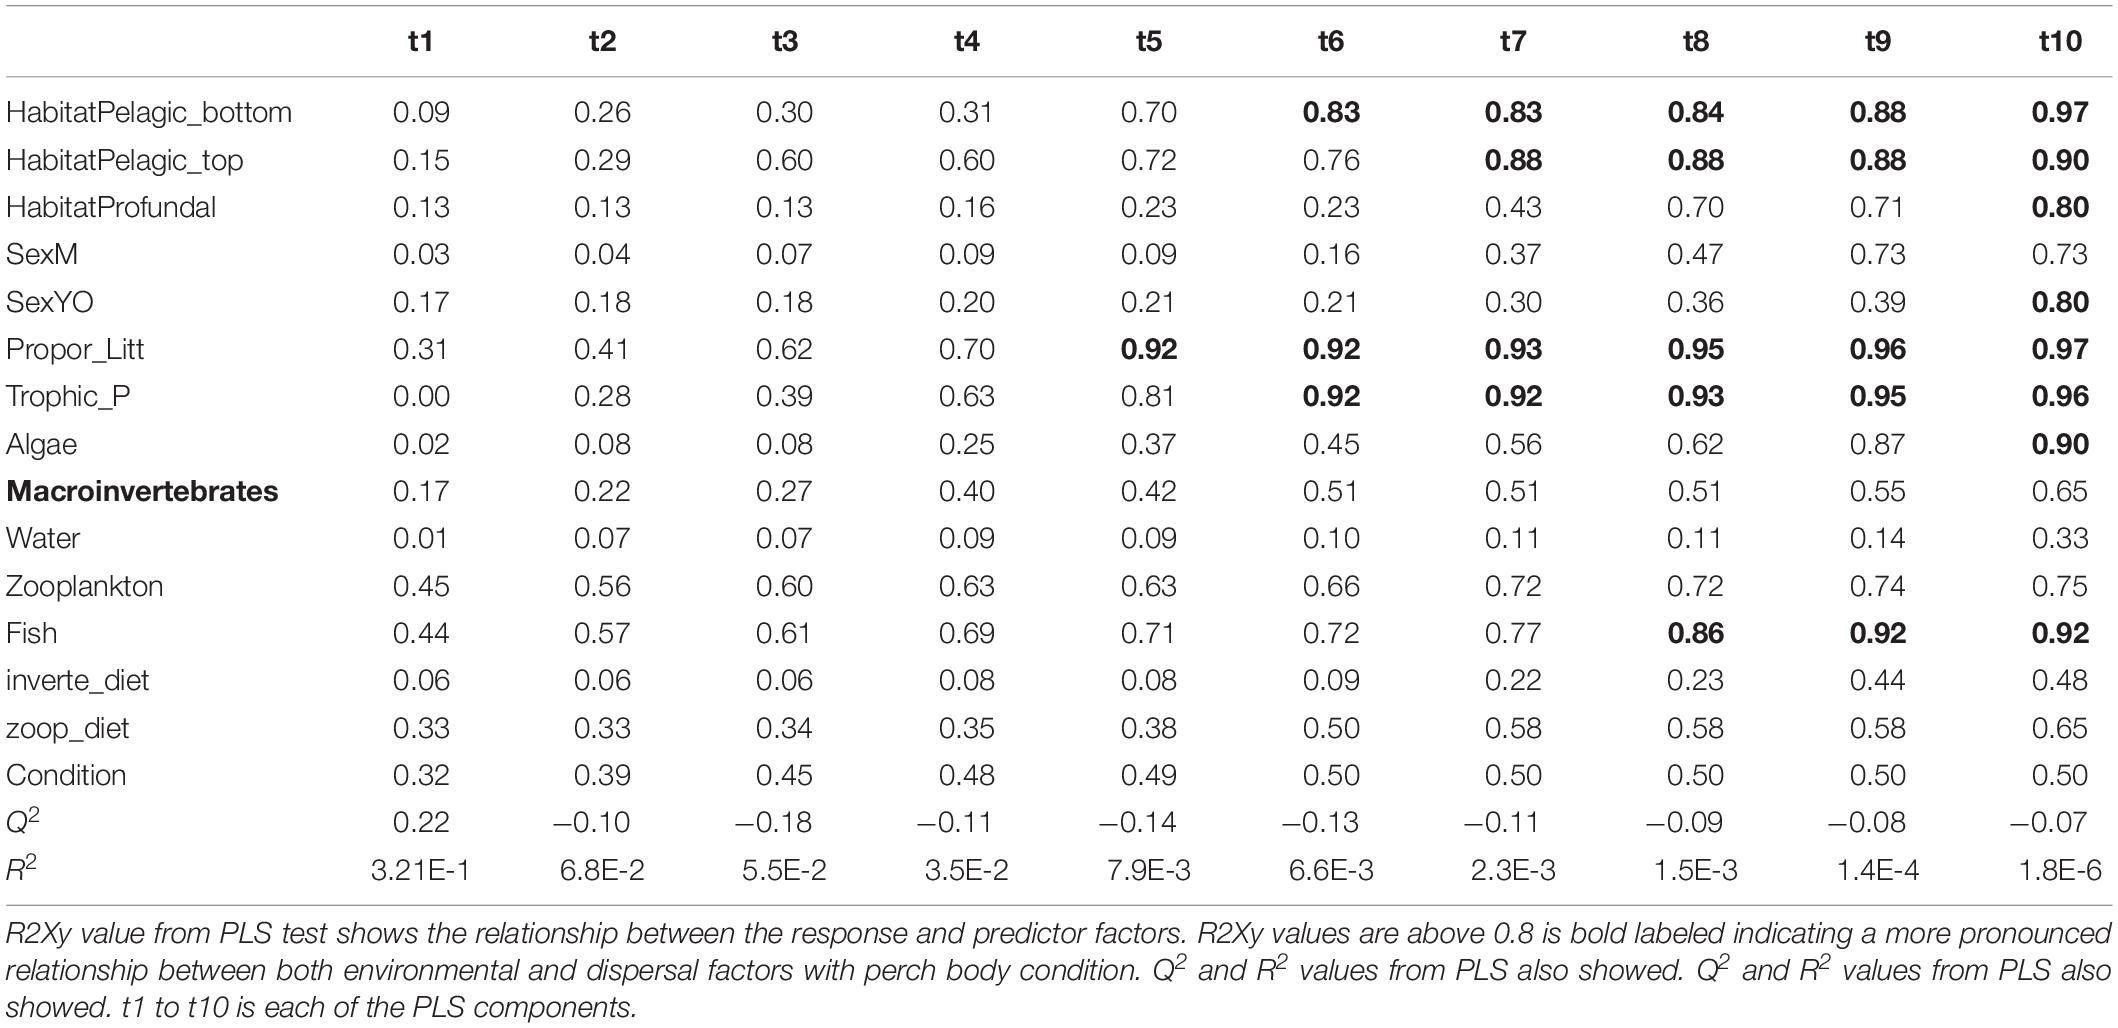
Table 3. Results from PLS model 2 tested relationship between perch body condition with both environmental and dispersal factors.
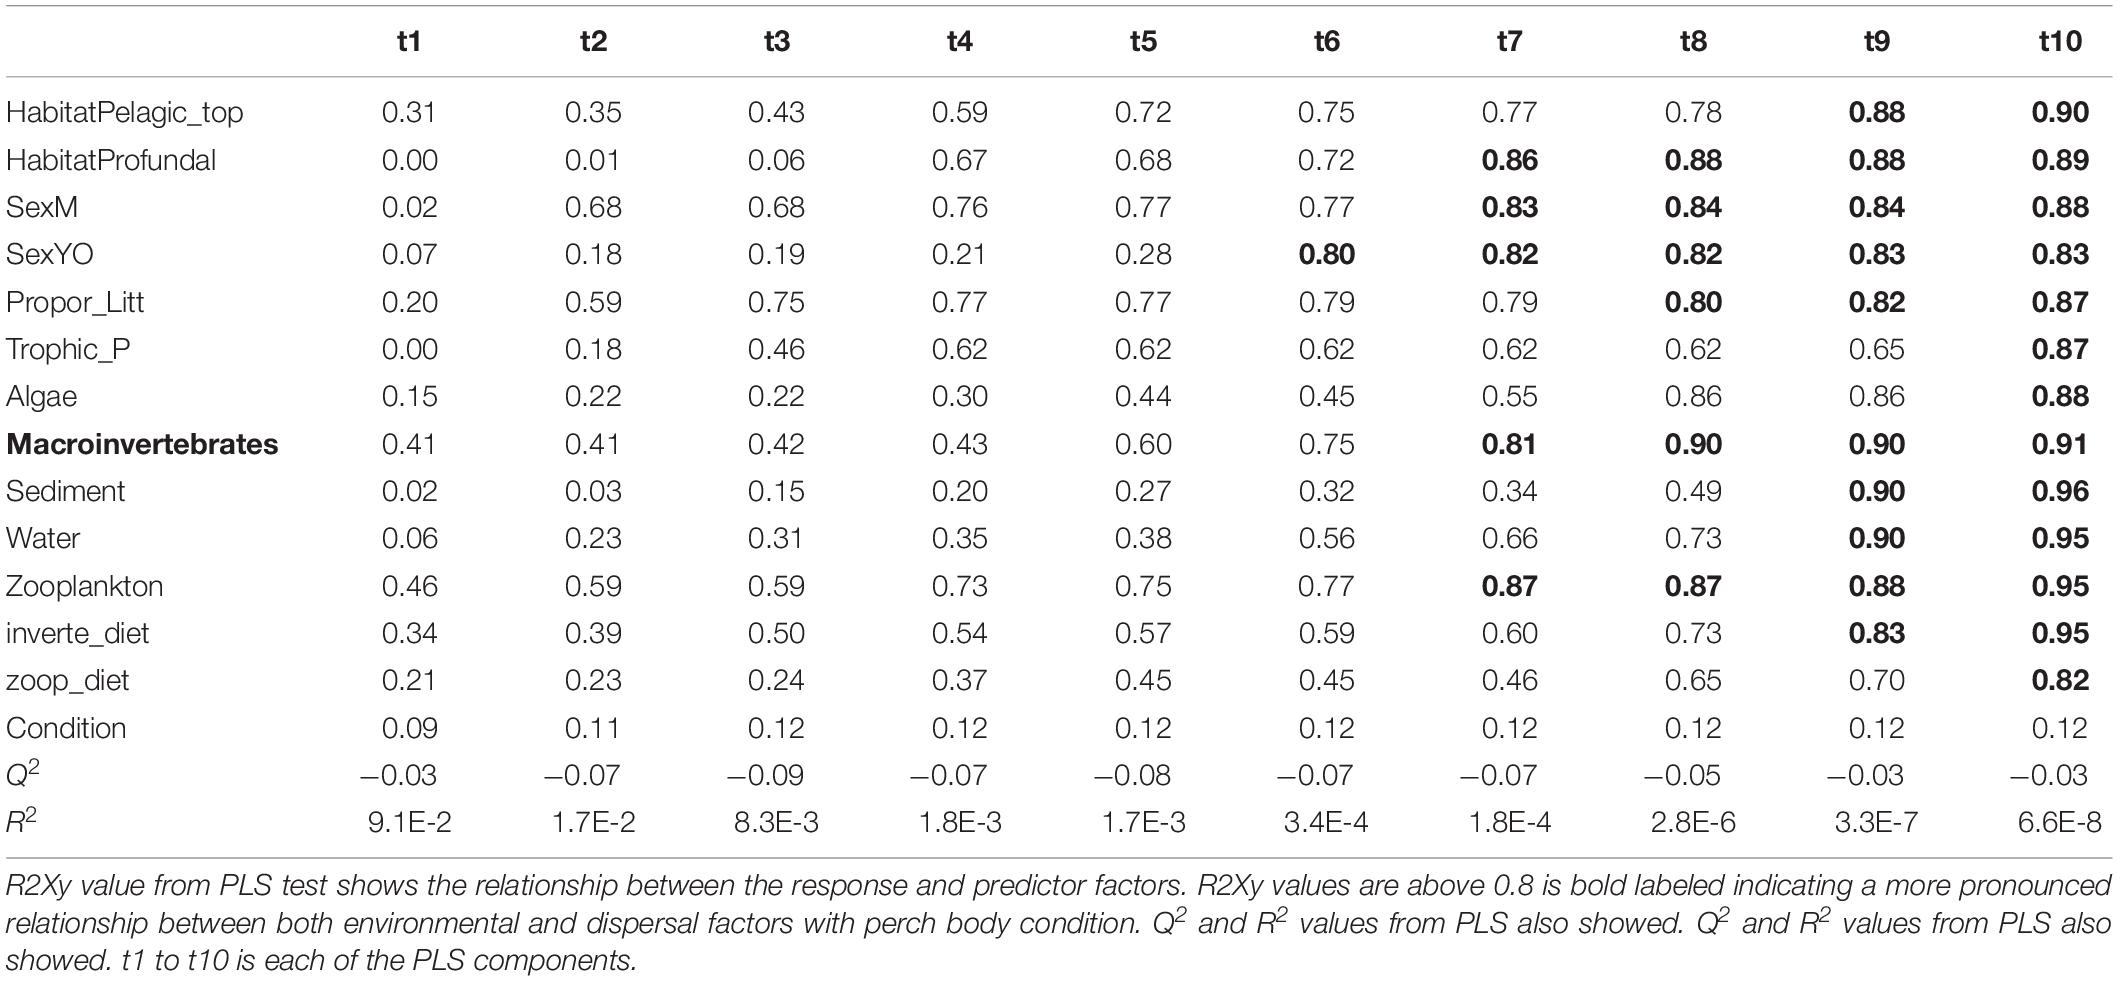
Table 4. Results from PLS model 2 tested relationship between roach body condition with both environmental and dispersal factors.
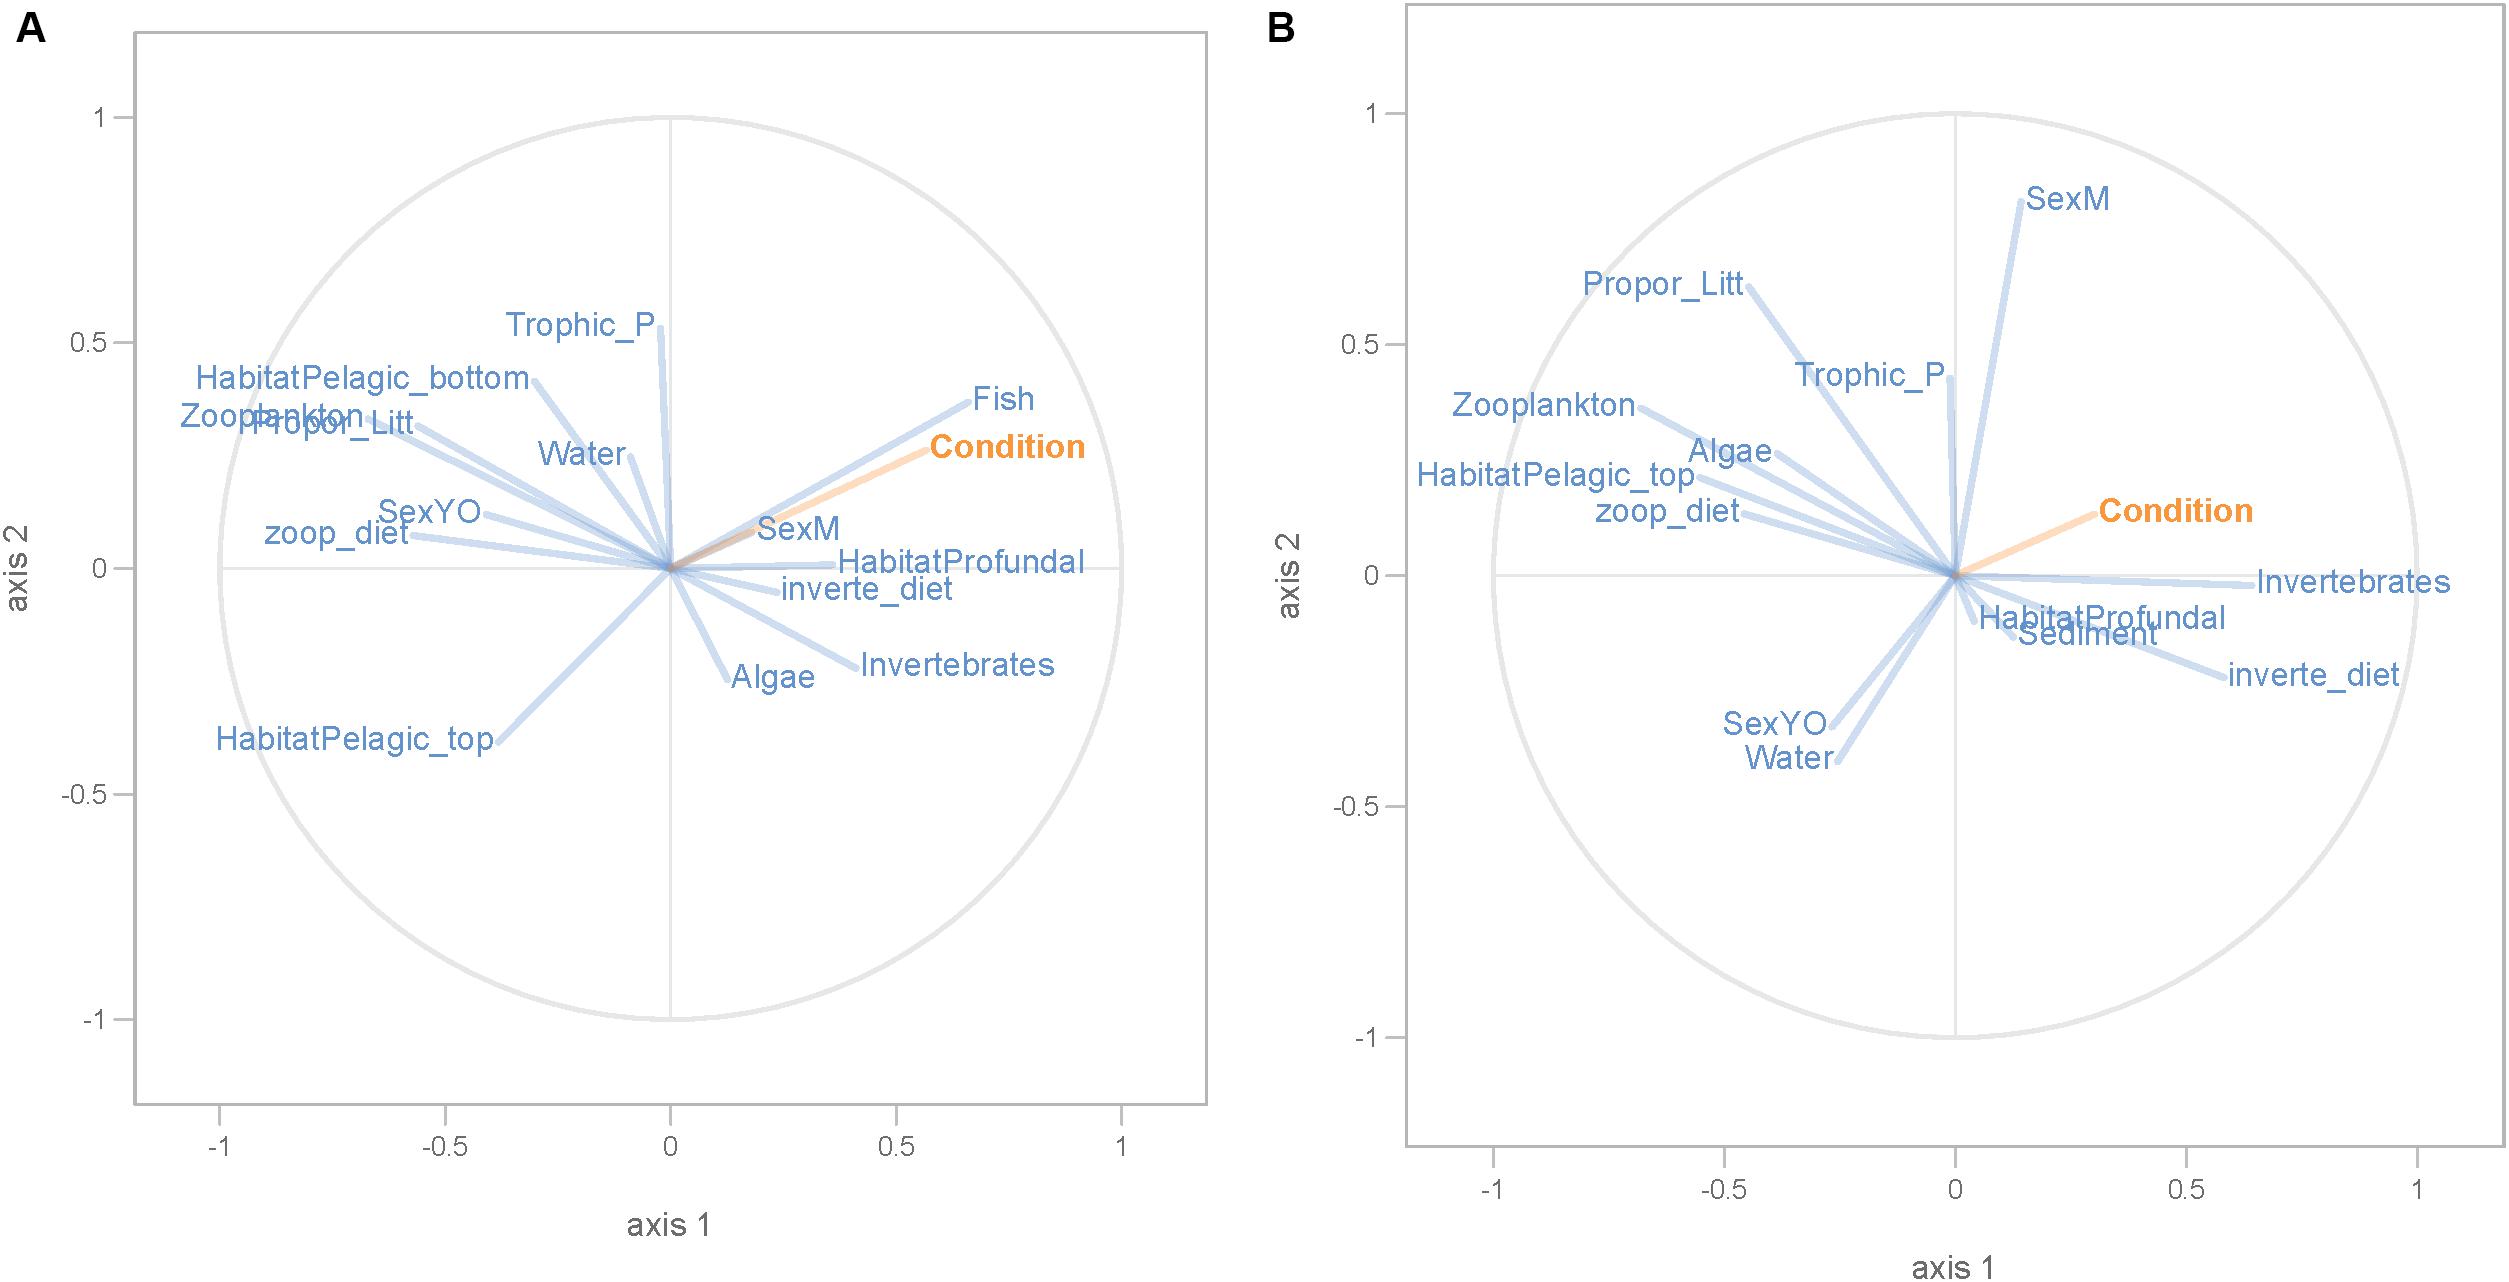
Figure 7. PLS regression analysis between fish body condition and environmental and dispersal factors. Fish body condition was used as response variable (orange lines), whereas dispersal and environmental factors were used as predictor variables (blue lines) in perch (A) and roach (B).
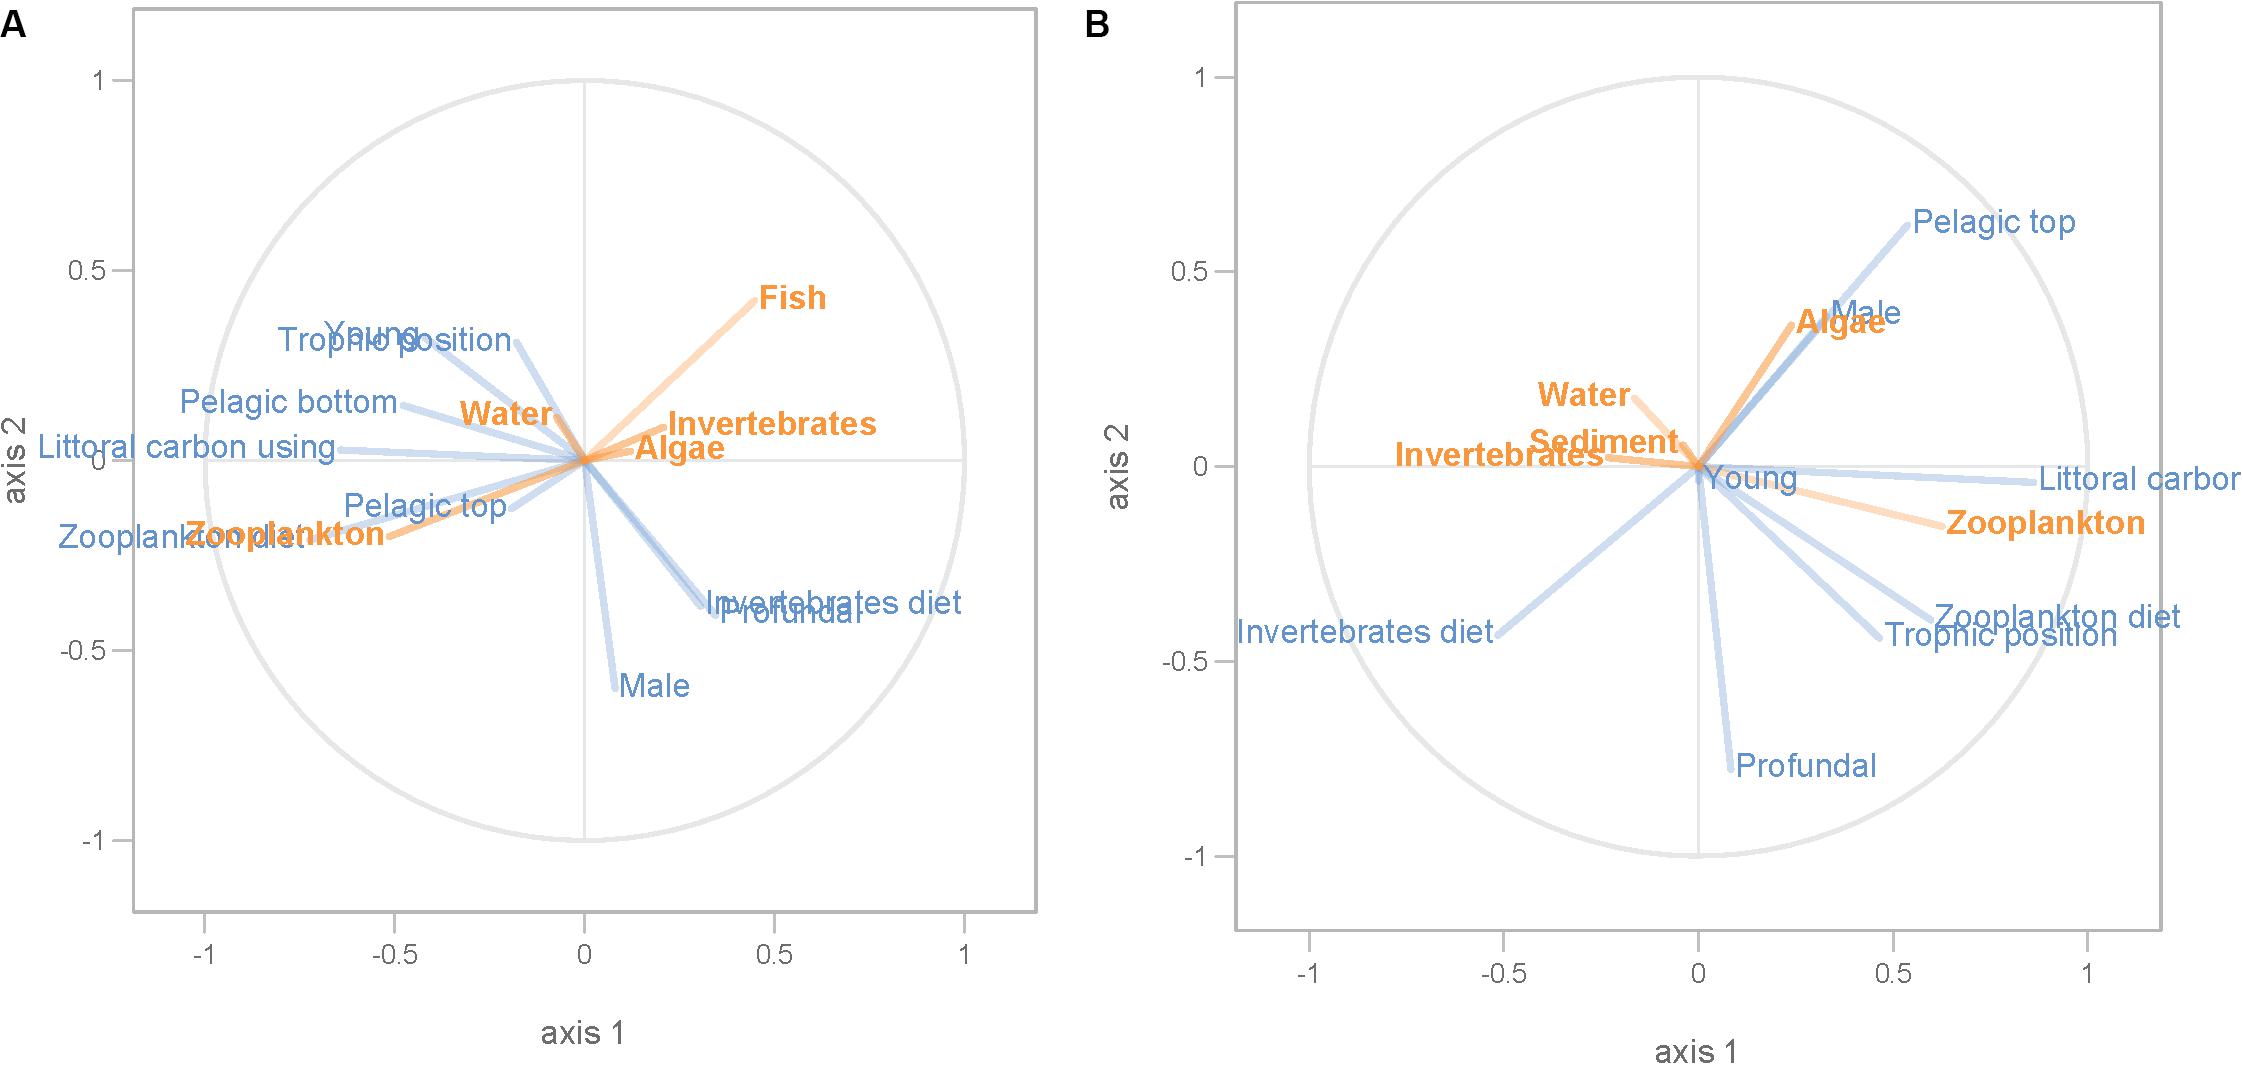
Figure 8. PLS regression analysis between environmental and dispersal factors. Dispersal factors were used as response variable (orange lines), whereas environmental factors were used as predictor variables (blue lines) in perch (A) and roach (B).
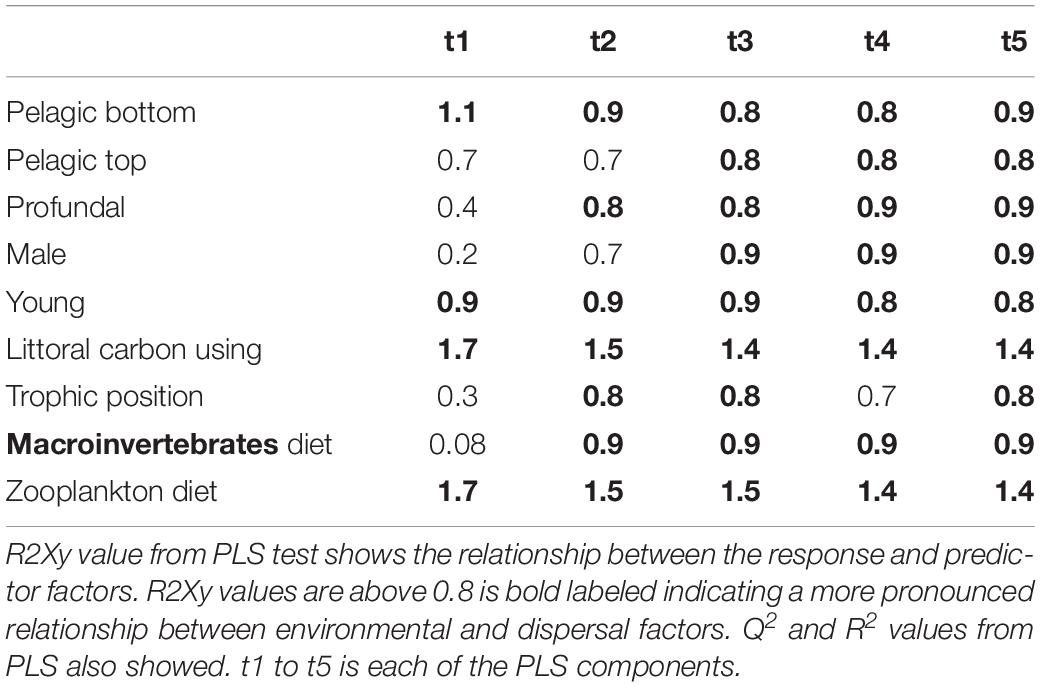
Table 5. Results from PLS model 3 tested relationship between environmental and dispersal factors in perch.
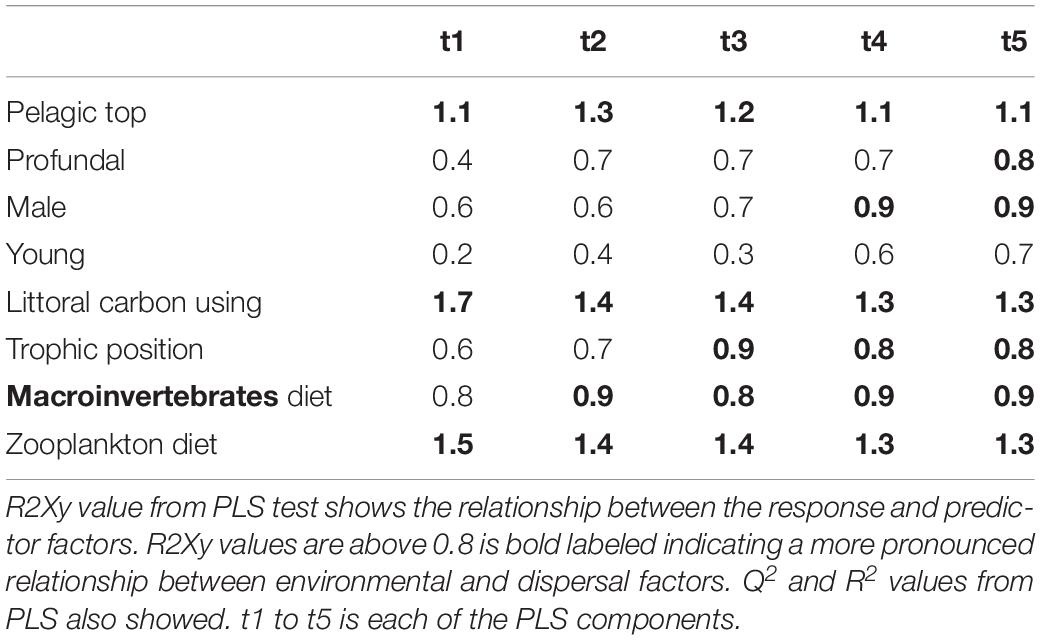
Table 6. Results from PLS model 3 tested relationship between environmental and dispersal factors in roach.
Discussion
The composition and diversity of intestinal microbial communities can directly or indirectly affect hosts’ health (Bäckhed, 2011; Li et al., 2013; Shapira, 2016). Therefore, the understanding of how intestinal microbes assemble in their hosts, and what factors contribute to the assembly is of great importance (Miller et al., 2018). In this field study, by sampling the gut microbiota of two different fish species as well as the multiple origins of the microbial species pool, we found an equal contribution of environmental selection, dispersal and ecological drift, contributed to the assembly of intestinal microbial communities in roach, whereas the dominant factor in perch was ecological drift. Berg et al. (2016) showed that in the free-living nematode Caenorhabditis elegans the assembly of gut microbiota communities is controlled by deterministic processes (host and interaction between microbiota members). Burns et al. (2016) on the other hand showed that neutral processes can explain a large part of the variation in microbiota composition in zebrafish. Possible reason for these differences in assembly processes between species can be hosts’ habitat choice, which results in differences in environmental settings, food choice and anatomy (i.e., design of the digestive system).
Here we caught both perch and roach at the same place, thus the differences in environmental conditions experienced by the two species should be minor. Genetic differences between perch and roach, which previously have been found to influence gut microbial communities (Benson et al., 2010; Koenig et al., 2011; Bolnick et al., 2014; Brooks et al., 2016), can therefore be one reason for differences in the assembly mechanisms. Another possible explanation could be the difference of the digestive system between perch and roach. In perch food passes through the stomach before it enters the intestine, while roach have no stomach, so food goes directly into the intestine. Studies on other vertebrates have shown that the stomach could work as an ecological barrier to filter microbial taxa before they enter into intestines due to the produced gastric acid (Martinsen et al., 2005; Beasley et al., 2015). Moreover, pH influence from the stomach could be an important factor to form gut microbial communities as it is for free-living microbes (Rousk et al., 2010). Thus, we would have expected environmental selection to be most important in perch, but our result was the opposite (Figure 3). The explanation for this could instead be that the stomach barrier leads to dispersal limitation, which would lead to more drift in perch than in roach. Still, further investigations are needed to confirm these speculations.
The results from the PLS analyses show that not all microbes associated with diet could establish themselves in the intestinal environment equally well. This is because the degree of macroinvertebrates as diet (obtained from gut analysis) was not related to the contribution of bacteria from macroinvertebrate to intestine microbiota (as obtained from SourceTracker analysis). This suggests that host’s intestinal environment could select for microbial communities that can locally adapt. One other reason for this pattern could be priority effects, which suggests that the colonization success of species is dependent on the order when they get into a site (Fukami, 2015). Juvenile perch usually feed on zooplankton, and when they get large enough they will switch to feed on macroinvertebrates and later on to fish (Svanbäck et al., 2015). Thus, when macroinvertebrate diet proportionally increases as perch grow, microbes attached to it will not increase as quickly in the intestine due to the pre-colonized microbes from zooplankton diet.
When foragers switch diets, as both perch and roach do with size (Svanbäck et al., 2008) this can both change the substrate diversity and amount of substrate for gut microbial communities. This could increase the competition between the bacteria attached to the new food intake and the original bacteria in the intestine if they have overlapping niche use. A change in diet use of the host might thus lead to invasion by bacterial species attached to the new food source into the niche of the original species (Mihaljevic, 2012), which will lead to variation in the local diversity among individual hosts. These processes could either decrease or increase the microbial beta diversity among fish individuals depending on how competitive the bacteria species are and if fish individuals could diverge in their use of food sources (Costello et al., 2012). In other words, dispersal of bacterial species can be an effective way of altering gut microbiota in fish both at the local (in individual fish) and regional (in fish populations of a lake) level.
The metacommunity dynamics of gut microbiota and the surrounding environment is probably governed by bi-directional dispersal between hosts and the surrounding environment (Miller et al., 2018). For example, Escalas et al. (2017) suggests that fish may be a source for environmental bacteria. This may be true for our study as well. Source Tracker assumes that the local community is the sink only (Knights et al., 2011), and in our analysis, the gut microbial community is only receiving microbes from the environment and not contributing. Some studies highlighted that macro-organisms can disperse their microbial communities into the environment indicating that they are also a source of environmental microbes (e.g., De Filippo et al., 2010; Zhang et al., 2016), which suggesting a bi-directional influence of microbes from environment to hosts and from hosts to environment. Such bi-directional dispersal can probably influence persistence of bacteria in the metacommunities. However, the occurrence of bidirectional dispersal needs to be investigated in controlled experiments.
Gut microbiota composition has been shown to affect host energy uptake (Bäckhed, 2011; Li et al., 2013; Shapira, 2016). For example, studies on mice and humans have revealed strong links between the gut microbiome composition and both energy harvest and energy storage in the host (Bäckhed, 2011; Li et al., 2013; Shapira, 2016). Previous findings, e.g., Bolnick et al. (2014) have shown that microbial diversity can be associated with fish fitness, though their results have not been consistent.
Similarly, our results revealed links between gut microbiome composition and fish body condition. Though, we went further by exploring the relationship between microbiome composition and fish body condition by differentiating the gut microbiome based on its sources. We show that while microbes from macroinvertebrates are less efficient at establishing in the intestinal environment, they still have a stronger association with fish body condition compared to zooplankton associated microbes. However, an increase in macroinvertebrate-associated microbiota could not be linked to the increased condition in perch and roach. Invertebrate diet compared to zooplankton diet, when given in the same amount, has been shown to lead to better growth in a previous study on perch (Borcherding et al., 2007). Furthermore, it has been shown that macroinvertebrates have access to better quality food during late summer and autumn in Lake Erken (our study lake) (Ahlgren et al., 1997), which potentially can lead to macroinvertebrates being of higher quality food for perch and roach. Thus, the association between macroinvertebrate and fish body condition can come from correlations between both invertebrate as diet and its associated microbiota. We found opposite associations of microbes attached to macroinvertebrates and zooplankton with fish body condition. This difference may be a result of the different metabolites produced by zooplankton and invertebrate associated microbes. If so, then this can be speculated to have consequences for the host, for example if poorer nutrients are produced by zooplankton associated microbes (Nicholson et al., 2012), which will lead to decreased fitness of their host.
In conclusion, by applying a metacommunity approach to investigate the assembly of intestinal microbiota communities, we show that both environmental selection and ecological drift have influences on community assembly of gut microbiota. Ecological drift was predicted to be more important in perch than roach leading to a smaller role for environmental interactions, including species-interactions in perch. Confirming previous studies, we infer using statistical means that environmental factors, such as fish diet and habitat choice can affect intestinal microbial communities. Both environment and dispersal factors contributed to the intestinal community composition but the relative contribution of these differed between perch and roach. This difference in assembly mechanisms may come from differences in the structure of the gut between perch and roach but also from genetic difference. Furthermore, we predict from our statistical analyses that fish body condition depends on bacterial dispersal sources, potentially affecting other traits such as immunity. While our understanding of how intestinal microbes assemble in their hosts, and what factors contribute to these processes has come a fair way, novel insights can be gained from comparative studies on natural animal populations as exemplified in our study.
Data Availability Statement
The datasets generated for this study can be found in the European Nucleotide Archive (ENA) under accession numbers ERS4181501 – ERS4181737.
Ethics Statement
The animal study was reviewed and approved by the ethical committee of Uppsala Djurförsöketiska Nämnd (permit number C80/13).
Author Contributions
YZ, RS, and EL designed the study. YZ and RS did the field work. YZ did the laboratory sample process, data analysis, and wrote the first draft of the manuscript. AE processed the sequencing data. All authors have contributed to the writing and revising of all the previous versions of the manuscript.
Funding
This work was supported by the Swedish Research Council (VR) to RS and Malméns Stiftelse to YZ.
Conflict of Interest
The authors declare that the research was conducted in the absence of any commercial or financial relationships that could be construed as a potential conflict of interest.
Acknowledgments
We would like to thank Konrad Karlsson, Johnny Malmberg, and Dandan Shen for their great help in the sampling at Erken. We are also grateful to Silke Langenheder, William Jones, Mathew Leibold and three reviewers for constructive comments on earlier version of this manuscript.
Supplementary Material
The Supplementary Material for this article can be found online at: https://www.frontiersin.org/articles/10.3389/fevo.2020.00152/full#supplementary-material
References
Ahlgren, G., Goedkoop, W., Markensten, H., Sonesten, L., and Boberg, M. (1997). Seasonal variations in food quality for pelagic and benthic invertebrates in Lake Erken - the role of fatty acids. Freshw. Biol. 38, 555–570.
Alves-Stanley, C. D., and Worthy, G. A. J. (2009). Carbon and nitrogen stable isotope turnover rates and diet-tissue discrimination in Florida manatees (Trichechus manatus latirostris). J. Exp. Biol. 212, 2349–2355. doi: 10.1242/jeb.027565
Bäckhed, F. (2011). Programming of host metabolism by the gut microbiota. Ann. Nutr. Metab. 58, 44–52. doi: 10.1159/000328042
Beasley, D. E., Koltz, A. M., Lambert, J. E., Fierer, N., and Dunn, R. R. (2015). The evolution of stomach acidity and its relevance to the human microbiome. PLoS One 10:e0134116. doi: 10.1371/journal.pone.0134116
Bender, L. C., Cook, J. G., Cook, R. C., and Hall, P. B. (2008). Relations between nutritional condition and survival of North American elk Cervus elaphus. Wildlife Biol. 14, 70–80.
Benson, A. K., Kelly, S. A., Legge, R., Ma, F., Low, S. J., Kim, J., et al. (2010). Individuality in gut microbiota composition is a complex polygenic trait shaped by multiple environmental and host genetic factors. Proc. Natl. Acad. Sci. U.S.A. 107, 18933–18938. doi: 10.1073/pnas.1007028107
Berg, M., Stenuit, B., Ho, J., Wang, A., Parke, C., Knight, M., et al. (2016). Assembly of the Caenorhabditis elegans gut microbiota from diverse soil microbial environments. ISME J. 10, 1998–2009. doi: 10.1038/ismej.2015.253
Berga, M., Östman, Ö., Lindström, E. S., and Langenheder, S. (2015). Combined effects of zooplankton grazing and dispersal on the diversity and assembly mechanisms of bacterial metacommunities. Environ. Microbiol. 17, 2275–2287. doi: 10.1111/1462-2920.12688
Bolnick, D. I., Snowberg, L. K., Hirsch, P. E., Lauber, C. L., Knight, R., Caporaso, J. G., et al. (2014). Individuals’ diet diversity influences gut microbial diversity in two freshwater fish (Threespine stickleback and Eurasian perch). Ecol. Lett. 17, 979–987. doi: 10.1111/ele.12301
Bolnick, D. I., Svanbäck, R., Fordyce, J. A., Yang, L. H., Davis, J. M., Hulsey, C. D., et al. (2003). The ecology of individuals: incidence and implications of individual specialization. Am. Nat. 161, 1–28. doi: 10.1086/343878
Borcherding, J., Hermasch, B., and Murawski, P. (2007). Field observations and laboratory experiments on growth and lipid content of young-of-the-year perch. Ecol. Freshw. Fish 16, 198–209.
Brooks, A. W., Kohl, K. D., Brucker, R. M., van Opstal, E. J., and Bordenstein, S. R. (2016). Phylosymbiosis: relationships and functional effects of microbial communities across host evolutionary history. PLoS Biol. 14:e2000225. doi: 10.1371/journal.pbio.2000225
Burns, A. R., Zac Stephens, W., Stagaman, K., Wong, S., Rawls, J. F., Guillemin, K., et al. (2016). Contribution of neutral processes to the assembly of gut microbial communities in the zebrafish over host development. ISME J. 10, 655–664. doi: 10.1038/ismej.2015.142
Cadotte, M., Cavender-Bares, J., Tilman, D., and Oakley, T. (2009). Using phylogenetic, functional and trait diversity to understand patterns of plant community productivity. PLoS One 4:e5695. doi: 10.1371/journal.pone.0005695
Campbell, J. H., Foster, C. M., Vishnivetskaya, T., Campbell, A. G., Yang, Z. K., Wymore, A., et al. (2012). Host genetic and environmental effects on mouse intestinal microbiota. ISME J. 6, 2033–2044. doi: 10.1038/ismej.2012.54
Chase, J. M., Kraft, N. J. B., Smith, K. G., Vellend, M., and Inouye, B. D. (2011). Using null models to disentangle variation in community dissimilarity from variation in α-diversity. Ecosphere 2:art24.
Costello, E. K., Stagaman, K., Dethlefsen, L., Bohannan, B. J. M., and Relman, D. A. (2012). The application of ecological theory toward an understanding of the human microbiome. Science 336, 1255–1262. doi: 10.1126/science.1224203
Davis, B. E., Afton, A. D., and Cox, R. (2011). Factors affecting winter survival of female mallards in the lower mississippi alluvial valley. Waterbirds 34, 186–194.
De Filippo, C., Cavalieri, D., Di Paola, M., Ramazzotti, M., Poullet, J. B., Massart, S., et al. (2010). Impact of diet in shaping gut microbiota revealed by a comparative study in children from Europe and rural Africa. Proc. Natl. Acad. Sci. U.S.A. 107, 14691–14696. doi: 10.1073/pnas.1005963107
Derrien, M., and van Hylckama Vlieg, J. E. T. (2015). Fate, activity, and impact of ingested bacteria within the human gut microbiota. Trends Microbiol. 23, 354–366. doi: 10.1016/j.tim.2015.03.002
Dethlefsen, L., Eckburg, P. B., Bik, E. M., and Relman, D. A. (2006). Assembly of the human intestinal microbiota. Trends Ecol. Evol. 21, 517–523.
Dominguez-Bello, M. G., Costello, E. K., Contreras, M., Magris, M., Hidalgo, G., Fierer, N., et al. (2010). Delivery mode shapes the acquisition and structure of the initial microbiota across multiple body habitats in newborns. Proc. Natl. Acad. Sci. U.S.A. 107, 11971–11975. doi: 10.1073/pnas.1002601107
Dutil, J. D., and Lambert, Y. (2000). Natural mortality from poor condition in Atlantic cod (Gadus morhua). Can. J. Fish. Aquat. Sci. 57, 826–836.
Dutton, R. J., and Turnbaugh, P. J. (2012). Taking a metagenomic view of human nutrition. Curr. Opin. Clin. Nutr. Metab. Care 15, 448–454. doi: 10.1097/MCO.0b013e3283561133
Edgar, R. C. (2013). UPARSE: highly accurate OTU sequences from microbial amplicon reads. Nat. Methods 10, 996–998. doi: 10.1038/nmeth.2604
Eriksson, L., Byrne, T., Johansson, E., Trygg, J., and Vikström, C. (2013). Multi-and Megavariate Data Analysis Basic Principles and Applications, Vol. 1. Umeå: Umetrics Academy.
Escalas, A., Troussellier, M., Yuan, T., Bouvier, T., Bouvier, C., Mouchet, M. A., et al. (2017). Functional diversity and redundancy across fish gut, sediment and water bacterial communities. Environ. Microbiol. 19, 3268–3282. doi: 10.1111/1462-2920.13822
Evan, S. (2016). Effects of dispersal and selection on stochastic assembly in microbial communities. Nat. Publ. 1–10. doi: 10.1038/ismej.2016.96
Ferreira, M. T., Franco, A., Catarino, L., Moreira, I., and Sousa, P. (1999). Environmental factors related to the establishment of algal mats in concrete irrigation channels. Hydrobiologia 415, 163–168.
Fine, P. V. A., and Kembel, S. W. (2011). Phylogenetic community structure and phylogenetic turnover across space and edaphic gradients in western Amazonian tree communities. Ecography 34, 552–565.
Fukami, T. (2015). Historical contingency in community assembly: integrating niches, species pools, and priority effects. Annu. Rev. Ecol. Evol. Syst. 46, 1–23. doi: 10.1111/nph.13362
Jacoby, J. M. (1985). Grazing effects on periphyton by Theodoxus fluviatilis (Gastropoda) in a lowland stream. J. Freshw. Ecol. 3, 265–274.
Knights, D., Kuczynski, J., Charlson, E. S., Zaneveld, J., Mozer, M. C., Collman, R. G., et al. (2011). Bayesian community-wide culture-independent microbial source tracking. Nat. Methods 8, 761–763. doi: 10.1038/nmeth.1650
Koenig, J. E., Spor, A., Scalfone, N., Fricker, A. D., Stombaugh, J., Knight, R., et al. (2011). Succession of microbial consortia in the developing infant gut microbiome. Proc. Natl. Acad. Sci. U.S.A. 108 (Suppl.), 4578–4585. doi: 10.1073/pnas.1000081107
Langenheder, S., Wang, J., Karjalainen, S. M., Laamanen, T. M., Tolonen, K. T., Vilmi, A., et al. (2017). Bacterial metacommunity organization in a highly-connected aquatic system. FEMS Micriobiol. Ecol. 93:fiw225. doi: 10.1093/femsec/fiw225
Lanzén, A., Jørgensen, S. L., Huson, D. H., Gorfer, M., Grindhaug, S. H., Jonassen, I., et al. (2012). CREST - classification resources for environmental sequence tags. PLoS One 7:e49334. doi: 10.1371/journal.pone.0049334
Legendre, P., and Gallagher, E. D. (2001). Ecologically meaningful transformations for ordination of species data. Oecologia 129, 271–280. doi: 10.1007/s004420100716
Leibold, M. A., Holyoak, M., Mouquet, N., Amarasekare, P., Chase, J. M., Hoopes, M. F., et al. (2004). The metacommunity concept: a framework for multi-scale community ecology. Ecol. Lett. 7, 601–613.
Ley, R. E., Lozupone, C. A., Hamady, M., Knight, R., and Gordon, J. I. (2008). Worlds within worlds: evolution of the vertebrate gut microbiota. Nat. Rev. Microbiol. 6, 776–788. doi: 10.1038/nrmicro1978
Li, L., and Ma, Z. (2016). Testing the neutral theory of. (Biodiversity)with human microbiome datasets. Sci. Rep. 6:31448. doi: 10.1038/srep31448
Li, X., Yan, Q., Xie, S., Hu, W., Yu, Y., and Hu, Z. (2013). Gut microbiota contributes to the growth of fast-growing transgenic common carp (Cyprinus carpio L.). PLoS One 8:e64577. doi: 10.1371/journal.pone.0064577
Lindström, E. S., and Langenheder, S. (2012). Local and regional factors influencing bacterial community assembly. Environ. Microbiol. Rep. 4, 1–9. doi: 10.1111/j.1758-2229.2011.00257.x
Lundvall, D., Svanbäck, R., Persson, L., and Byström, P. (1999). Size-dependent predation in piscivores: interactions between predator foraging and prey avoidance abilities. Can. J. Fish. Aquat. Sci. 56, 1285–1292.
Martinsen, T. C., Bergh, K., and Waldum, H. L. (2005). Gastric juice: a barrier against infectious diseases. Basic Clin. Pharmacol. Toxicol. 96, 94–102. doi: 10.1111/j.1742-7843.2005.pto960202.x
Matthews, B., Marchinko, K. B., Bolnick, D. I., and Mazumder, A. (2010). Specialization of trophic position and habitat use by sticklebacks in an adaptive radiation. Ecology 91, 1025–1034. doi: 10.1890/09-0235.1
Mihaljevic, J. R. (2012). Linking metacommunity theory and symbiont evolutionary ecology. Trends Ecol. Evol. 27, 323–329. doi: 10.1016/j.tree.2012.01.011
Miller, E. T., Svanbäck, R., and Bohannan, B. J. M. (2018). Microbiomes as metacommunities: understanding host associated microbes through metacommunity ecology. Trends Ecol. Evol. 33, 926–935. doi: 10.1016/j.tree.2018.09.002
Nelson, T. M., Rogers, T. L., Carlini, A. R., and Brown, M. V. (2013). Diet and phylogeny shape the gut microbiota of Antarctic seals: a comparison of wild and captive animals. Environ. Microbiol. 15, 1132–1145. doi: 10.1111/1462-2920.12022
Nemergut, D. R., Schmidt, S. K., Fukami, T., O’Neil, S. P., Bilinski, T. M., Stanish, L. F., et al. (2013). Patterns and processes of microbial community assembly. Microbiol. Mol. Biol. Rev. 77, 342–356. doi: 10.1128/MMBR.00051-12
Newsome, S. D., del Rio, C. M., Bearhop, S., and Philips, D. L. (2007). A niche for isotopic ecology. Front. Ecol. Environ. 5, 429–436. doi: 10.1890/060150.1
Nicholson, J. K., Holmes, E., Kinross, J., Burcelin, R., Gibson, G., Jia, W., et al. (2012). Host-gut microbiota metabolic interactions. Science 108, 1262–1268.
Persson, L., Diehl, S., Johansson, L., Andersson, G., and Hamrin, S. F. (1991). Shifts in fish communities along the productivity gradient of temperate lakes - patterns and the importance of size-structure interactions. J. Fish Biol. 38, 281–293.
Post, D. M. (2002). Using stable isotopes to estimate trophic position: models, methods, and assumptions. Ecology 83, 703–718. doi: 10.1890/0012-9658(2002)083[0703:USITET]2.0.CO;2
Price, M. N., Dehal, P. S., and Arkin, A. P. (2010). FastTree 2-approximately maximum-likelihood trees for large alignments. PLoS One 5:e9490. doi: 10.1371/journal.pone.0009490
Raup, D. M., and Crick, R. E. (1979). Measurement of faunal similarity in paleontology. J. Paleontol. 53, 1213–1227.
Ravussin, Y., Koren, O., Spor, A., and LeDuc, C. (2012). Responses of gut microbiota to diet composition and weight loss in lean and obese mice. Obesity 20, 738–747. doi: 10.1038/oby.2011.111
Round, J. L., and Mazmanian, S. K. (2009). The gut microbiota shapes intestinal immune responses during health and disease. Nat. Rev. Immunol. 9, 313–324. doi: 10.1038/nri2515
Rousk, J., Bååth, E., Brookes, P. C., Lauber, C. L., Lozupone, C., Caporaso, J. G., et al. (2010). Soil bacterial and fungal communities across a pH gradient in an arable soil. ISME J. 4, 1340–1351. doi: 10.1038/ismej.2010.58
Schmidt, V. T., Smith, K. F., Melvin, D. W., and Amaral-Zettler, L. A. (2015). Community assembly of a euryhaline fish microbiome during salinity acclimation. Mol. Ecol. 24, 2537–2550. doi: 10.1111/mec.13177
Shapira, M. (2016). Gut microbiotas and host evolution: scaling up symbiosis. Trends Ecol. Evol. 31, 539–549. doi: 10.1016/j.tree.2016.03.006
Sinclair, L., Osman, O. A., Bertilsson, S., and Eiler, A. (2015). Microbial community composition and diversity via 16S rRNA gene amplicons: evaluating the illumina platform. PLoS One 10:e0116955. doi: 10.1371/journal.pone.0116955
Skulason, S., and Smith, T. B. (1995). Resource polymorphisms in vertebrates. Trends Ecol. Evol. 10, 366–370.
Spor, A., Koren, O., and Ley, R. (2011). Unravelling the effects of the environment and host genotype on the gut microbiome. Nat. Rev. Microbiol. 9, 279–290. doi: 10.1038/nrmicro2540
Stegen, J. C., Lin, X., Fredrickson, J. K., Chen, X., Kennedy, D. W., Murray, C. J., et al. (2013). Quantifying community assembly processes and identifying features that impose them. ISME J. 7, 2069–2079. doi: 10.1038/ismej.2013.93
Stegen, J. C., Lin, X., Konopka, A. E., and Fredrickson, J. K. (2012). Stochastic and deterministic assembly processes in subsurface microbial communities. ISME J. 6, 1653–1664. doi: 10.1038/ismej.2012.22
Stevens, C. E., and Hume, I. D. (1998). Contributions of microbes in vertebrate gastrointestinal tract to production and conservation of nutrients. Physiol. Rev. 78, 393–427. doi: 10.1152/physrev.1998.78.2.393
Stewart, J. A., Chadwick, V. S., and Murray, A. (2005). Investigations into the influence of host genetics on the predominant eubacteria in the faecal microflora of children. J. Med. Microbiol. 54, 1239–1242. doi: 10.1099/jmm.0.46189-0
Strayer, D. L., Caraco, N. F., Cole, J. J., Findlay, S., and Pace, M. L. (1999). Transformation of freshwater ecosystems by bivalves – A case study of Zebra mussels in the Hudson River. Bioscience 49, 19–27.
Sullam, K. E., Essinger, S. D., Lozupone, C. A., O’Connor, M. P., Rosen, G. L., Knight, R., et al. (2012). Environmental and ecological factors that shape the gut bacterial communities of fish: a meta-analysis. Mol. Ecol. 21, 3363–3378. doi: 10.1111/j.1365-294X.2012.05552.x
Svanbäck, R., Eklöv, P., Fransson, R., and Holmgren, K. (2008). Intra-specific competition drives multiple species trophic polymorphism in fish communities. Oikos 117, 114–124.
Svanbäck, R., and Persson, L. (2009). Population density fluctuations change the selection gradient in Eurasian perch. Am. Nat. 173, 507–516. doi: 10.1086/597223
Svanbäck, R., Quevedo, M., Olsson, J., and Eklöv, P. (2015). Individuals in food webs: the relationships between trophic position, omnivory and among-individual diet variation. Oecologia 178, 103–114. doi: 10.1007/s00442-014-3203-4
Theis, K. R., Dheilly, N. M., Klassen, J. L., Brucker, R. M., John, F., Bosch, T. C. G., et al. (2016). Getting the hologenome concept right: an eco-evolutionary framework for hosts and their microbiomes. bioRxiv [Preprint]. doi: 10.1101/038596
Veiga, P., Pons, N., Agrawal, A., Oozeer, R., Guyonnet, D., Faurie, J., et al. (2014). Changes of the human gut microbiome induced by a fermented milk product. Sci. Rep. 4:6328. doi: 10.1038/srep06328
Vellend, M. (2010). Conceptual synthesis in community ecology. Q. Rev. Biol. 85, 183–206. doi: 10.1086/652373
Wu, G. D., Chen, J., Hoffmann, C., Bittinger, K., Chen, Y.-Y., Keilbaugh, S. A., et al. (2011). Linking long-term dietary patterns with gut microbial enterotypes. Science 334, 105–108. doi: 10.1126/science.1208344
Yan, Q., Li, J., Yu, Y., Wang, J., He, Z., Van Nostrand, J. D., et al. (2016). Environmental filtering decreases with fish development for the assembly of gut microbiota. Environ. Microbiol. 18, 4739–4754. doi: 10.1111/1462-2920.13365
Keywords: intestinal microbial community, freshwater fish, metacommunity theory, environmental selection, dispersal, drift, fish body condition
Citation: Zha Y, Lindström ES, Eiler A and Svanbäck R (2020) Different Roles of Environmental Selection, Dispersal, and Drift in the Assembly of Intestinal Microbial Communities of Freshwater Fish With and Without a Stomach. Front. Ecol. Evol. 8:152. doi: 10.3389/fevo.2020.00152
Received: 29 September 2019; Accepted: 04 May 2020;
Published: 01 June 2020.
Edited by:
Mathew A. Leibold, University of Florida, United StatesReviewed by:
James Skelton, United States Geological Survey, United StatesCarly Rae Muletz-Wolz, National Zoological Park (SI), United States
Copyright © 2020 Zha, Lindström, Eiler and Svanbäck. This is an open-access article distributed under the terms of the Creative Commons Attribution License (CC BY). The use, distribution or reproduction in other forums is permitted, provided the original author(s) and the copyright owner(s) are credited and that the original publication in this journal is cited, in accordance with accepted academic practice. No use, distribution or reproduction is permitted which does not comply with these terms.
*Correspondence: Yinghua Zha, eWluZ2h1YS56aGEuZ290ZW1hbkBraS5zZQ==