 Joachim W. Dippner
- Department of Biological Oceanography, Leibniz Institute for Baltic Sea Research Warnemünde, Rostock, Germany
A Commentary on
Commentary: Lake or Sea? The Unknown Future of Central Baltic Sea Herring
by Meier, H. E. M., Börgel, F., Frauen, C., and Radtke, H. (2020). Front. Ecol. Evol. 8:55. doi: 10.3389/fevo.2020.00055
Recently (Dippner et al., 2019; hereafter D19) have applied the mediator concept (Dippner, 2006) to demonstrate that the mean weight of 3-year-old central Baltic Sea (BS) herring (Clupea harengus) is indirectly influenced by the Atlantic Multi-decadal Oscillation (AMO). The proposed mediator chain is increased sea surface temperature (SST) in the North Atlantic (NA), increased precipitation in the BS catchment area, increased river runoff, decreased surface layer salinity in the Baltic Proper, decreased marine zooplankton biomass of Pseudocalanus acuspes and herring weight. D19 addresses a comment (Meier et al., 2020; hereafter M20).
The reason for this comment is not clear because three of the four authors had recently published a paper (Börgel et al., 2018; hereafter B18) in which they showed that under anomalous warm NA SST, moisture is advected into the BS region leading to increased precipitation, increased river runoff, and decreased salinity in the BS. Aside from the biological aspect in D19, both papers B18 and D19 identify the same mechanism for the decrease in BS salinity, which has been identified by Vuorinen et al. (2015). The differences between B18 and D19 are first that B18 analyzed the output of a regional climate model run of 850 years whereas D19 analyzed observations. Secondly, the signal of climate variability occurred in different periods, on the decadal scale in D19 and on longer time scales in B18. The AMO index calculated from annual HadlSST data (Rayner et al., 2003) shows a peak around 64 years in the global wavelet spectrum and no significant peaks in shorter time scales (Figure 1 in M20). From this finding, the authors of M20 concluded that the time series in D19 are too short to verify a causal relationship between AMO and herring weight. This argument can be reduced to the simple question “What is wrong with the decadal scale?” and if we consider the Bjerknes hypothesis, to the extended question “Who drives whom?”
The AMO index is originally defined as monthly mean detrended NA SST anomalies in the region from 0° to 70°N (Kerr, 2000; Enfield et al., 2001). After filtering the AMO time series, a multi-decadal variation in SST with a period of 60–90 years appeared, which is of major interest for climatologists (e.g., Schlesinger and Ramankutty, 1994; Sutton and Hodson, 2005; Knight et al., 2006). However, this does not mean that no inter-annual or inter-decadal oscillatory modes exist. In fact, an examination of observed AMO data [Figure 2 in (Harris et al., 2014)] shows pronounced decadal variability with amplitudes in the same range as the 60–90 year oscillation. Lau and Weng (1995) presented a wavelet analysis of observed northern hemisphere SST and found significant oscillatory modes from inter-annual (2–5 years), inter-decadal (10–12, 20–25, and 40–60 years) and century to inter-century (90 and 180 years) scales at different periods of the data set. Furthermore, using the Comprehensive Oceans Atmosphere Data Set (COADS; Slutz et al., 1985; Woodruff et al., 1987), Chang et al. (1997) identified with a spectral analysis of the tropical Atlantic Ocean a dominant spectral peak at around 13 years.
Similar inter-decadal modes have also been identified in coupled ocean-atmosphere general circulation models. Zorita and Frankignoul (1997) identified in a 325-years integration of the ECHAM1/LSG model two distinct oscillatory modes in the NA SST with dominant periods of 10 and 20 years. The 20-years mode is the most energetic, but it is not seen in the atmosphere. The 10-years mode can be found in the temperature variation of the upper ocean and is also detected in the atmosphere, and thus appears to be a coupled ocean-atmosphere mode. Based on results from another numerical model integration, Timmermann et al. (1998) detected a Northern Hemisphere coupled air-sea mode with a 35-years period.
This is evidence that inter-annual and inter-decadal variability exists in the NA SST, in observations as well as in model results. It is not clear why these periods do not exist in the global wavelet spectrum of M20. Furthermore, Mehta et al. (2000) demonstrated in an atmosphere only model, driven by observed SST and sea-ice boundary conditions, that the North Atlantic Oscillation [NAO, (Hurrell, 1995)] exhibits multiple variations from inter-annual to multi-decadal time scales. The quintessence of this paper is the existence of inter-annual, inter-decadal, multi-decadal, century, and inter-century periods in both modes, AMO and NAO, an aspect which is completely ignored by M20.
A complaisant consideration of the M20 argument leads to the Bjerknes “who drives whom” conjecture. Bjerknes (1964) suggested that the character of large-scale air-sea interaction over the mid-latitude NA differs with time scales, such that the atmosphere directly drives most short-term SST variability and the ocean contributes significantly to long-term SST and atmospheric variability. Gulev et al. (2013) have recently investigated the characteristic time scales over which these drivers dominate. They provide observational evidence that in the mid-latitude NA and on time scales longer than 10 years, surface turbulent heat fluxes are driven by the ocean and may force the atmosphere. On shorter time scales the opposite is true. From this confirmation of the Bjerknes hypothesis it can be concluded that AMO is the driver of the air-sea system on time scales longer than 10 years in the NA.
The following points in the M20 comment need a detailed inspection.
1) The authors of M20 argue that the observational records are too short, specifically mentioning the time series of herring weight. It is correct that the time series of herring weight covers 35 years. However, the authors ignore in their argumentation that most of the time series cover 63 years (see Table 1 in D19), which allows the resolution of oscillatory modes on the inter-annual scale of 2–5 years and inter-decadal modes around 10 and 20 years.
2) The authors of M20 picked out a sentence from the D19 abstract, “This observed trend is also projected for the future in regional climate change scenarios,” and argue that “past correlations between multi-decadal climate variations and herring weight should not be extrapolated into the future.” This is a misinterpretation. It is important to note that in D19 no extrapolation into the future is presented. The paper deals with climate variability only and not with climate change.
In the D19 abstract, the sentence before reads, “Observations show that the mean weight of central BS herring, a quantity unbiased by fisheries, is indirectly influenced by the AMO via a complex mediator chain, in which a transition from a marine to a freshwater state plays a major role.” That means that “the observed trend” is clearly related to salinity, i.e., the transition from a marine to a freshwater state. This aspect is further outlined in the discussion of D19: “The trend of reducing salinity might continue into the future. Different climate change emissions scenarios (IPCC SRES A2 or B2) with regional climate models for the BS (Meier et al., 2006; BACC author team, 2008) project a decline in salinity of between 8 and 50%.” These climate change projections were calculated by the first author of M20.
3) M20 mentioned that “correlations between high-pass filtered (or unfiltered) NA SSTs and precipitation or river runoff data are statistically not significant.” However, based on unfiltered monthly observations, D19 showed significant correlations between these time series (Table 1 in D19). An obvious difference between D19 and M20 may result from the different precipitation data. M20 used the HiResAFF data set (Schenk and Zorita, 2012) for the area 9.6° to 32°E and 52.4° to 67.4°N. The disadvantage of this area is the northwest corner, which covers a part of the Norwegian Sea and the Norwegian coast. Both areas are characterized by high precipitation and do not belong to the BS catchment area. In contrast, D19 used NCEP/NCAR reanalysis data (Kalnay et al., 1996) of monthly mean precipitation rate. The area of BS catchment was constructed in a sophisticated way by dividing the catchment area into 10 slabs, which ensure the highest possible accuracy in resolution of the BS catchment area. Details were given in D19. The use of different data sets and areas might cause the different results.
4) M20 mentioned that “variations of precipitation and river runoff on time scales smaller than 35 years cannot be explained by variations of NA SST” and speculated that the driving mechanism, which transports moisture into the BS region, is the NAO. Using NCEP/NCAR reanalysis data (Kalnay et al., 1996), un-lagged and unfiltered monthly mean precipitation over the BS catchment area for the period 1950–2000 is correlated to the AMO index and the NAO index (Figure 1). Precipitation is significantly positively correlated to the AMO index, indicating a link of positive NA SST anomalies to higher rainfall, whereas NAO is negatively correlated to precipitation. Both results do not support the argument of M20.
5) The authors of M20 avoid a discussion on the link between marine zooplankton and herring weight. Nevertheless, they present some arguments on declining weight-at age (Cardinale and Arrhenius, 2000), fishing gear selectivity, food web interaction, predation and competition (Casini et al., 2010). These arguments would be important if herring recruitment was being considered, but the subject of D19 is the mean weight of 3-years-old central BS herring. In contrast to recruitment, mean weight is an unbiased quantity. Furthermore, Casini et al. (2010) clearly stated that salinity is the main driver of herring growth variations and not competition. The mentioned declining weight-at-age (Cardinale and Arrhenius, 2000) is related to cod and not to herring.
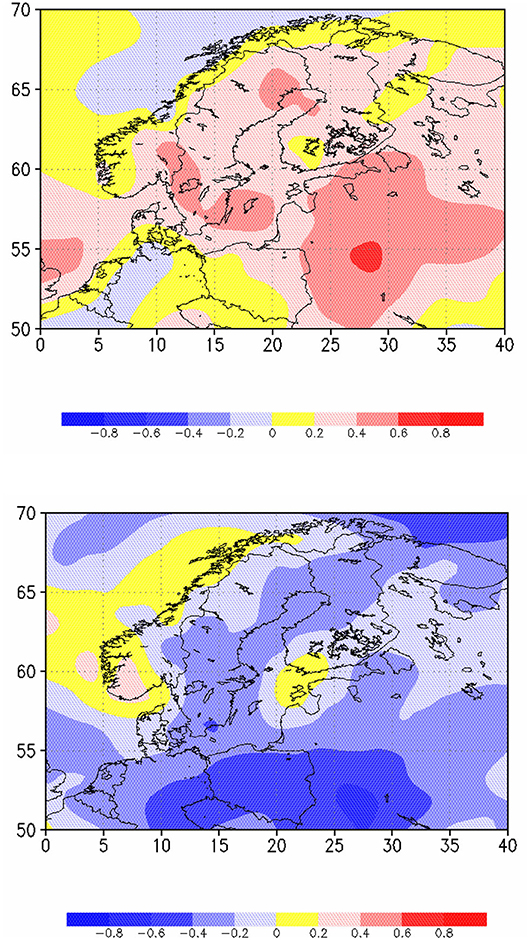
Figure 1. Correlation between AMO and precipitation rate (Upper) and NAO and precipitation rate (Lower). The correlation is based on un-lagged, unfiltered monthly mean anomalies for the period 1950–2000.
Author Contributions
The author confirms being the sole contributor of this work and has approved it for publication.
Funding
This study was supported by the Open Access Fund of the Leibniz Association.
Conflict of Interest
The author declares that the research was conducted in the absence of any commercial or financial relationships that could be construed as a potential conflict of interest.
Acknowledgments
NCEP Reanalysis data provided by the NOAA/OAR/ESRL PSD, Boulder, Colorado, USA, from their Web site at https://www.esrl.noaa.gov/psd/.
References
BACC author team (2008) Assessment of Climate Change in the Baltic Sea Basin. Regional Climate Studies. Heidelberg: Springer Verlag 473. doi: 10.1007/978-3-540-72786-6
Bjerknes, J. (1964). Atlantic air-sea interaction. Adv. Geophys. 10, 1–82. doi: 10.1016/S0065-26870860005-9
Börgel, F., Frauen, C., Neumann, T., Schimanke, S., and Meier, H. E. M. (2018). Impact of the Atlantic multidecadal oscillation on Baltic sea variability. Geophys. Res. Lett. 45, 9880–9888. doi: 10.1029/2018GL078943
Cardinale, M., and Arrhenius, F. (2000). The influence on stock structure and environmental conditions on the recruitment process of Baltic cod estimated using a generalized additive model. Can. J. Fish. Aquat. Sci. 57, 2402–2409. doi: 10.1139/f00-221
Casini, M., Bartolino, V., Molinero, J. C., and Kornilovs, G. (2010). Linking fisheries, trophic interactions and climate: threshold dynamics drive herring Clupea harengus growth in the central Baltic Sea. Mar. Ecol. Prog. Ser. 413, 241–252. doi: 10.3354/meps08592
Chang, P., Ji, L., and Li, H. (1997). A decadal climate variation in the tropical Atlantic Ocean from thermodynamic air-sea interaction. Nature 385, 516–518. doi: 10.1038/385516a0
Dippner, J. W. (2006). Future aspects in marine ecosystem modelling. J. Mar. Syst. 61, 246–267. doi: 10.1016/j.jmarsys.2005.06.005
Dippner, J. W., Fründt, B., and Hammer, C. (2019). Lake or Sea? The unknown future of Central Baltic Sea Herring. Front. Ecol. Evol. 7:143. doi: 10.3389/fevo.2019.00143
Enfield, D. B., Mestas-Nunez, A. M., and Trimble, P. J. (2001). The Atlantic multidecadal oscillation and its relation to rainfall and river flows in the continental U. S. Geophys. Res. Lett. 28, 2077–2080. doi: 10.1029/2000GL012745
Gulev, S. K., Latif, M., Keenlyside, N., Park, W., and Koltermann, K. P. (2013). North Atlantic Ocean control on surface heat flux on multidecadal time scales. Nature 499, 464–467. doi: 10.1038/nature12268
Harris, V., Edwards, M., and Olhede, S. C. (2014). Multidecadal Atlantic climate variability and its impact on marine pelagic communities. J. Mar. Syst. 133, 55–69. doi: 10.1016/j.jmarsys.2013.07.001
Hurrell, J. W. (1995). Decadal trends in the North Atlantic Oscillation: regional temperatures and precipitation. Science 269, 676–679. doi: 10.1126/science.269.5224.676
Kalnay, E., Kanamitsu, M., Kistler, R., Collins, W., Deaven, D., Gandin, L., et al. (1996). The NCEP/NCAR Reanalysis 40-year Project. Bull. Am. Meteorol. Soc. 77, 437–471.doi: 10.1175/1520-0477(1996)077<0437:TNYRP>2.0.CO;2
Kerr, E. A. (2000). A North Atlantic pacemaker for the centuries. Science 288, 1984–1986. doi: 10.1126/science.288.5473.1984
Knight, J. R., Folland, C. K., and Scaife, A. A. (2006). Climate impact of the Atlantic Multidecadal Oscillation. Geophys. Res. Lett. 33:L17706. doi: 10.1029/2006GL026242
Lau, K.-M., and Weng, H. (1995). Climate signal detection using wavelet transform. How to make a time series sing. Bull. Am. Meteorol. Soc. 76, 2391–2402.doi: 10.1175/1520-047719950762391:CSDUWT2.0.CO;2
Mehta, V. M., Suarez, M. J., Mangello, J. V., and Delworth, T.L. (2000). Oceanic influence on the North Atlantic Oscillation and associated Northern Hemisphere climate variations: 1959–1993. Geophys. Res. Lett. 27, 121–124. doi: 10.1029/1999GL002381
Meier, H. E. M., Börgel, F., Frauen, C., and Radtke, H. (2020). Commentary: lake or sea? The unknown future of Central Baltic Sea herring. Front. Ecol. Evol. 8:55. doi: 10.3389/fevo.2020.00055
Meier, H. E. M., Kjellström, E., and Graham, L. P. (2006). Estimating uncertainties of projected Baltic Sea salinity in the late 21st century. Geophys. Res. Lett. 33:L15705. doi: 10.1029/2006GL026488
Rayner, N. A., Parker, D. E., Horton, E. B., Folland, C. K., Alexander, L. V., Rowell, D. P., et al. (2003). Global analyses of sea surface temperature, sea ice, and night marine air temperature since the late nineteenth century. J. Geophys. Res. Atmos. 108:4407. doi: 10.1029/2002JD002670
Schenk, F., and Zorita, E. (2012). Reconstruction of high resolution atmospheric fields for Northern Europe using analog-upscaling. Clim. Past 8:1681. doi: 10.5194/cp-8-1681-2012
Schlesinger, M. E., and Ramankutty, N. (1994). An oscillation in the global climate system of period 65-70 years. Nature 367, 723–726. doi: 10.1038/367723a0
Slutz, R. J., Lubker, S. J., Hiscox, D. J., Woodruff, S. D., Jenne, R. L., Joseph, D. H., et al. (1985). Comprehensive Ocean–Atmosphere Data Set; Release 1. Boulder, CO: NOAA Environmental Research Laboratories, Climate Research Program, 268.
Sutton, R. T., and Hodson, D. R. L. (2005). Atlantic Ocean forcing of North American and European summer climate. Science 309, 115–118. doi: 10.1126/science.1109496
Timmermann, A., Latif, M., Voss, R., and Grötzner, A. (1998). Northern Hemisphere interdecadal variability: a coupled air-sea mode. J. Clim. 11, 1906–1931. doi: 10.1175/1520-0442-11.8.1906
Vuorinen, I., Hänninen, J., Rajasilta, M., Laine, P., Eklund, J., Montesino-Pouzols, F., et al. (2015). Scenario simulations of future salinity and ecological consequences in the Baltic Sea and adjacent North Sea areas – implications for environmental monitoring. Ecol. Indic. 50, 196–205. doi: 10.1016/j.ecolind.2014.10.019
Woodruff, S. D., Slutz, R. J., Jenne, R. L., and Steurer, P. M. (1987). A comprehensive ocean–atmosphere data set. Bull. Am. Meteorol. Soc. 68, 1239–1250.doi: 10.1175/1520-047719870681239:ACOADS2.0.CO;2
Keywords: Atlantic Multidecadal Oscillation (AMO), North Atlantic Oscillation (NAO), climate variability, Baltic Sea, central Baltic Sea herring
Citation: Dippner JW (2020) Response: Commentary: Lake or Sea? The Unknown Future of Central Baltic Sea Herring. Front. Ecol. Evol. 8:229. doi: 10.3389/fevo.2020.00229
Received: 08 April 2020; Accepted: 23 June 2020;
Published: 04 August 2020.
Edited by:
Vimal Mishra, Indian Institute of Technology Gandhinagar, IndiaReviewed by:
Xander Wang, University of Prince Edward Island, CanadaNickolai Shadrin, A.O. Kovalevsky Institute of Marine Biological Research, Russia
Copyright © 2020 Dippner. This is an open-access article distributed under the terms of the Creative Commons Attribution License (CC BY). The use, distribution or reproduction in other forums is permitted, provided the original author(s) and the copyright owner(s) are credited and that the original publication in this journal is cited, in accordance with accepted academic practice. No use, distribution or reproduction is permitted which does not comply with these terms.
*Correspondence: Joachim W. Dippner, ZGlwcG5lckBpby13YXJuZW11ZW5kZS5kZQ==