 Colin Tucker
 Scott Ferrenberg
 Sasha C. Reed
- 1Southwest Biological Science Center, United States Geological Survey, Moab, UT, United States
- 2USDA Forest Service Northern Research Station, Houghton, MI, United States
- 3Department of Biological Sciences, New Mexico State University, Las Cruces, NM, United States
Biological soil crusts (biocrusts) on the Colorado Plateau may fuel carbon (C) and nitrogen (N) cycling of soil heterotrophic organisms throughout the region. Late successional moss and lichen biocrusts, in particular, can increase soil C and N availability, but some data suggest these biocrust types will be replaced by early successional cyanobacterial biocrusts as the region undergoes warming and aridification. In this study, we evaluated the short-term interactive effects of biocrust successional state and elevated temperature on soil heterotrophic C and N cycling (specifically, soil respiration, N2O emissions, microbial biomass C and N, and soluble C and N). We collected soils following an 87-day greenhouse mesocosm experiment where the soils had been topped with different biocrust successional states (moss-dominated, cyanobacteria-dominated, or no biocrust) and had experienced different temperatures (ambient and warmed), under an artificial precipitation regime. Following this pre-incubation mesocosm phase, the soils were assessed using a short-term (2-day) laboratory incubation to determine the cumulative effect of the elevated temperature and altered biocrust successional state on the temperature sensitivity of soil heterotrophic C and N cycling. We found that there were interactive effects of biocrust successional state and exposure to warmer temperatures during the mesocosm phase under greenhouse conditions on the rate and temperature sensitivity of soil heterotrophic C and N cycling in laboratory incubations. Soils collected from beneath late successional biocrusts exhibited higher C and N cycling rates than those from beneath early successional crusts, while warming reduced both the magnitude and the temperature sensitivity of C and N cycling. The inhibiting effect of warming, was most evident in soils from beneath late successional biocrusts, which, during the mesocosm phase, also exhibited the greatest reductions in gross primary production and respiration in response to the warming treatment. Taken together, these data suggest that an overall effect of climate warming may be increasing resource limitation of the soil heterotrophic C and N cycles in the region, which may magnify alterations associated with the changes in biocrust community structure documented in previous studies. Overall, results from this study suggest that soil heterotrophic biogeochemical cycling is affected by interactions between temperature and the biocrust community that lives atop the mineral soil, with important implications for C and N cycling into the future.
Introduction
Biological soil crusts (biocrusts) are fundamental members of dryland ecosystems (Weber et al., 2016b), and affect ecosystem functions of dryland soils in ways that vary with biocrust community composition and exposure to altered climate (e.g., Belnap et al., 2016; Reed et al., 2016). Biocrust community composition within a particular ecosystem tends to develop in predictable sequences (Weber et al., 2016a), such that ecological succession can be a useful, if somewhat simplified approach for evaluating and forecasting changes in biocrust function in response to perturbation (Housman et al., 2006; Langhans et al., 2010; Lan et al., 2013; Read et al., 2016). Recent evidence suggests climate changes in many deserts may result in a systemic shift from a ‘later’ successional-state community of mosses and lichens toward an ‘earlier’ successional-state community, primarily composed of cyanobacteria (Escolar et al., 2012; Ferrenberg et al., 2015; Maestre et al., 2015; Reed et al., 2016), similar to changes induced by physical disturbance (e.g., vehicle and livestock trampling; Weber et al., 2016a). These effects of climate change and land-use intensification on biocrust communities may extend to the global scale (Rodriguez-Caballero et al., 2018). Because biocrust succession – which in many drylands is a progression from bare soil to cyanobacterial biocrust to lichen, and/or moss biocrust – causes soil stability to increase dramatically (Pietrasiak et al., 2013; Gao et al., 2020), along with soil carbon (C) and nitrogen (N) inputs and pools (e.g., Housman et al., 2006; Guo et al., 2008; Zhou et al., 2020), alterations of biocrust successional state in response to a warmer climate may have significant effects on belowground soil processes.
The Colorado Plateau maintains notable biocrust communities reported to play myriad critical roles in ecosystem function (Belnap et al., 2016). Biocrusts are particularly important at lower to mid-elevations (i.e., 900–2,100 m) within the Colorado Plateau Desert, where biocrust-dominated interspaces between vascular plants can represent a large to dominant category of land cover (>60% e.g., Torres-Cruz et al., 2018). Biocrust functions include regulating fertility of soils beneath crusts (e.g., Ferrenberg et al., 2018) and climate-induced losses of moss and lichen biocrusts have been linked to shifts in soil C and N pools (Reed et al., 2012; Maestre et al., 2013). The heterotrophic microbial communities that live below biocrust also play fundamental roles in ecosystem function (e.g., Castillo-Monroy et al., 2011), however, our understanding of the relationship between aboveground biocrust physiology and belowground heterotrophic biogeochemistry is notably poor. An improved understanding of these linkages is critical considering that altered biocrust function as a result of warming may induce a cascade of changes related to soil fertility (Beraldi-Campesi et al., 2009), plant community structure (Havrilla et al., 2019), C storage and efflux (Darrouzet-Nardi et al., 2015, 2018), hydrology (Eldridge et al., 2020), and soil stability (Gao et al., 2020) - all of which could have substantial negative effects on dryland function. This region has warmed ∼1°C over the previous 50 years, and is projected to warm between 2 and 5°C over the remainder of the 21st century (IPCC, 2013). While precipitation forecasts are much more variable, this warming is predicted to drive an increase in soil dryness (Schlaepfer et al., 2017). Thus, predicting soil biogeochemistry in response to altered climate in these landscapes will require an improved understanding of soil biogeochemical pools and fluxes associated with biocrust and climate-induced changes to their community composition.
A substantial portion of the organisms found in biocrust communities are photoautotrophic and, similar to vascular plants, these photoautotrophs provide organic C to heterotrophs in soils via exudation and turnover. Photosynthetic rates per unit area of biocrust vary widely in relation to the dominant autotroph present, with biocrust mosses exhibiting photosynthetic rates comparable to vascular plants (e.g., max = 3.8 μmol CO2 m–2 s–1), while uptake of CO2 in biocrusts dominated by lightly-pigmented cyanobacteria can be barely distinguishable from bare soil fluxes (e.g., max = 1.1 μmol CO2 m–2 s–1) (Tucker et al., 2019). Some fraction of the CO2 fixed by biocrust organisms may be incorporated in the soil organic matter (SOM) pool via exudation and leaching (Swenson et al., 2018), litter inputs, and herbivory by soil invertebrates (Vaculik et al., 2004) among other possible pathways. Given these input pathways, C originating in biocrusts may provide the main growth and respiration substrate for heterotrophic soil microbes living in and beneath the biocrust. In these cases, changes to C inputs, either via shifts in biocrust community structure or via changes in physiology of dominant biocrust autotrophs, may result in alternate patterns and temperature sensitivity of soil heterotrophic C cycling.
The role of biocrusts in soil N cycling may be somewhat more complex than in C cycling (Barger et al., 2016). Globally, semi-arid ecosystems, including the Colorado Plateau in the southwestern United States, tend to have relatively low concentrations of soil N (Post et al., 1985). Biocrusts provide a primary input of N to these ecosystems (e.g., Evans and Ehleringer, 1993), in large part because N2-fixing biocrust organisms release substantial amounts of both inorganic and organic N into the soil (e.g., Johnson et al., 2007), especially in response to wetting after a dry period (see Barger et al., 2016 for a review of biocrust N release into soil). Some biocrust organisms are highly effective N2-fixers (e.g., Collema spp. lichens, and later successional biocrust in general), while others show much lower rates and are likely acquiring most of their N from the soil environment (Hawkes, 2003; Yeager et al., 2004; Housman et al., 2006; Torres-Cruz et al., 2018). Biocrusts may also lead to accelerated loss of soil N via emission of N2O, NO2, and HONO (Barger et al., 2005; Strauss et al., 2012; Abed et al., 2013; Weber et al., 2015). Furthermore, soil heterotrophic C and N cycling are likely to vary significantly as a function of this input of N (Schaeffer and Evans, 2005). While the importance of biocrust for N cycling in the uppermost soil layers (<5 mm depth below the biocrust) has been documented, the contribution of biocrusts to N cycling in the bulk soil is less well understood (Johnson et al., 2007; Castillo-Monroy et al., 2010; Delgado-Baquerizo et al., 2013; Barger et al., 2016; Zhou et al., 2020), as is our understanding of how biocrust type and physiology affect soil heterotrophic N cycling.
Here, we aimed to improve our understanding of the linkage between biocrusts and soil C and N cycling driven by heterotrophic microbes, especially with regard to the temperature sensitivity of these pools and their fluxes. In particular, we assessed how respiration and N2O emissions from soil heterotrophic organisms, alongside changes of pools of C and N within the soil, were related to the biocrust organisms at the soil surface, and to the temperature regime these organisms experience. Our goal was to elucidate a set of mechanisms underlying the effects of climate warming (and resultant altered hydration) and associated changes in biocrust community on soil C and N cycling. We evaluated heterotrophic C and N cycling for soils collected from a mesocosm experiment focused on ambient and warmed (+5°C) soils of three cover types: bare soil, lightly-pigmented cyanobacterial ‘early successional’ biocrusts (e.g., Microcoleus spp.), and moss-dominated ‘late successional’ biocrusts (described in Tucker et al., 2019). Soils collected from beneath biocrusts that experienced distinct temperature treatments were subjected to a series of short-term laboratory incubations to assess the rates and temperature sensitivity of soil respiration, N2O emission, depletion of soluble organic C and N, and changes in microbial biomass C and N. We hypothesized that late successional (i.e., moss-dominated) biocrust would support higher rates of soil heterotrophic C and N cycling compared to early successional (i.e., cyanobacterial) biocrust, which, in turn, would be higher than bare soil. In contrast, we hypothesized that, overall, the warming treatment would slow soil heterotrophic C and N cycling, and this reduction would be greatest under late successional biocrust, which have been shown to be more negatively affected by warming in the field (Ferrenberg et al., 2015). We further hypothesized that, as soil heterotrophic organisms are exposed to warmer temperatures, they would become less sensitive to increased temperature (apparent acclimation or adaptation), which is a notable feature of soil microbial respiration across drylands globally (Dacal et al., 2019), and that these effects would be at least partially driven by a reduction of C substrate availability. It is important to note that during the mesocosm phase of study, the warming treatment resulted in a suite of changes, including reduction of biocrust activity and a 13–32% reduction of the duration of hydration (Tucker et al., 2019), which could have equal or greater impact on the soil heterotrophic community than the direct impact of warming. Thus, in this paper we are evaluating responses to this suite of warming associated changes, rather than exclusively the response to warming.
Materials and Methods
Greenhouse Mesocosms
The biocrust physiological and modeling data from this mesocosm are described in Tucker et al. (2019), and complete experimental details can be found there. Briefly, samples were collected from a cool desert ecosystem on the Upper Colorado Plateau (36.675 N, -109.416 W; near Castle Valley, UT, United States). MAT for the surrounding area is 13°C and MAP is 269 mm (based on 1981–2010 data; Western Regional Climate Center 2014). Soils are shallow and classified as sandy loam, calcareous, Rizno series Aridisols, and vegetation is dominated by the native perennial grasses Achnatherum hymenoides and Pleuraphis jamesii, the perennial shrub Atriplex confertifolia, and the exotic annual grass Bromus tectorum. Biocrust communities at the site are dominated by the cyanobacterium Microcoleus spp., the moss Syntrichia caninervis, and the cyanolichens Collema tenax and C. coccophorum. These species are common in drylands worldwide and represent widespread biocrust functional types (Bowker et al., 2016).
For the initial mesocosm phase (Figure 1; Tucker et al., 2019), we assembled mesocosms from biocrust and soil collected from multiple locations within a single drainage with biocrust communities clearly dominated by either early or late successional communities (i.e., communities dominated by lightly-pigmented cyanobacteria or by moss, respectively). Early cyanobacterial crusts were distinguished from bare soil based on three factors (1) the soil formed a distinct crust layer, (2) inspection of plates of this crust revealed numerous filaments hanging from the base of the crust, and (3) this crust layer exhibited some cohesion when wetted. Biocrusts representing early or late successional states were carefully separated from sub-crust soil by inserting a thin metal plate <1 cm below the identified bottom of the biocrust. The sub-crust soil was collected to a depth of 5 cm and homogenized across both successional categories. Homogenized soil was added to a depth of 6 cm to a total of 150 plastic pots (8.5 l × 8.5 w × 7 h cm) with holes in the bottom to allow water to freely drain, and with mesh screen to prevent soil loss with drainage. The soil was then covered by either early or late biocrust or was left bare (Bare soil) (n = 50 for each cover type). Mesocosms were then transferred to the research greenhouse at the US Geological Survey office in Moab, UT, United States. Once inside the greenhouse, mesocosms were watered to holding capacity for 2 days and then allowed to dry for 8 days under a common temperature regime.
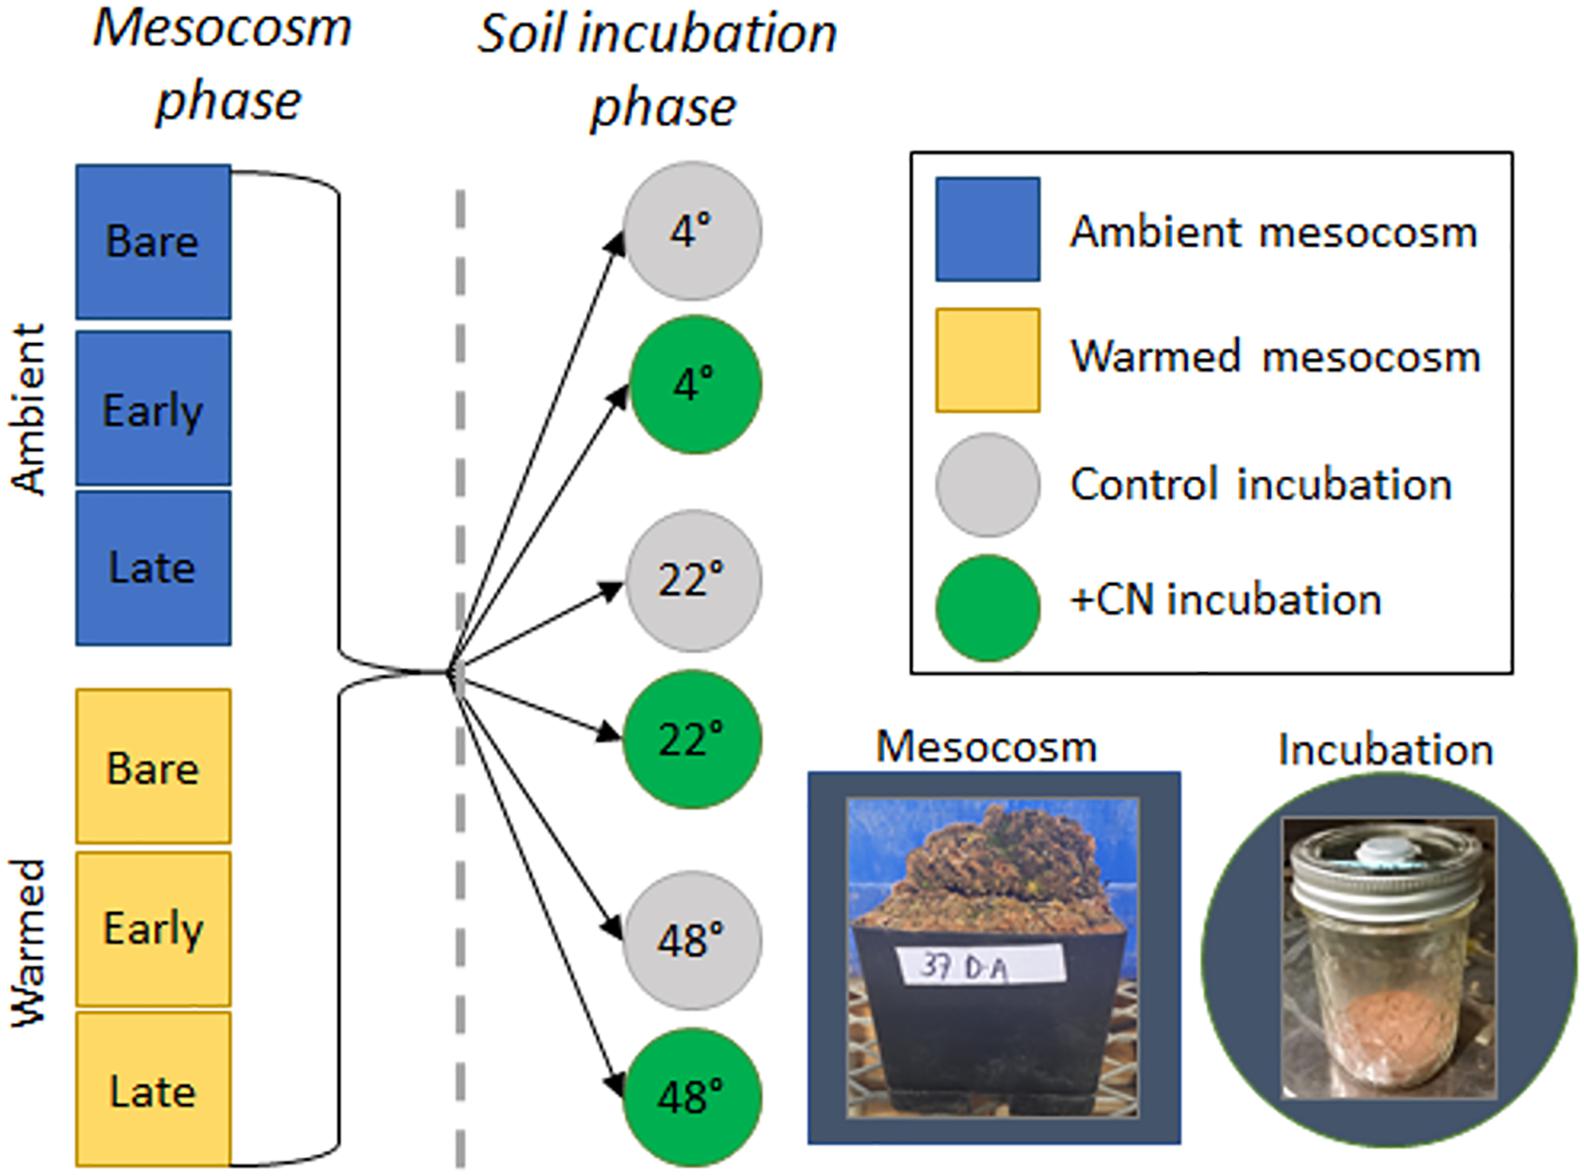
Figure 1. Depiction of the overall experimental design. During the 87-day mesocosm phase, biocrust mesocosms, which represented a homogenous mineral soil covered with no biocrust (Bare), cyanobacteria-dominated biocrusts (Early succession), or moss-dominated biocrusts (Late succession), were maintained in a greenhouse under Ambient or Warmed (∼5°C above ambient) conditions. Following this mesocosm phase (for which results are presented in Tucker et al., 2019), a 2-day soil incubation phase was used to assess the temperature and substrate response of soil heterotrophic C and N cycling to the prior mesocosm treatments. In the incubation phase, soil sampled from beneath the biocrust layer for each of five replicate mesocosms from each treatment level was incubated at one of three temperatures (4, 22, and 48°C) either with +CN as glucose and ammonium nitrate or as an unamended control. Soil respiration, N2O efflux, K2SO4-extractable C and N, and microbial biomass C and N concentrations were measured for each sample.
Mesocosm Conditions and Warming Treatment
Following the 8-day acclimation period, 25 mesocosms of each of the 3 cover types were randomly assigned to the Warmed vs. Ambient temperature treatments (Figure 1 ‘mesocosm phase’) (Tucker et al., 2019). Warming was implemented using electric and propane heaters (exhausted outside the greenhouse) with thermostatic control was used to maintain a Warmed air temperature ∼7°C above Ambient and a Warmed soil temperature ∼5°C above the Ambient. Throughout this paper the terms “Ambient” and “Warmed” are used to refer to the mesocosm treatments, not to the temperatures used in the following incubation phase described below (Figure 1). During the first week of the experiment (September 16–22, 2015) the Warmed soil temperature range (mean [min, max]) was 29.2 [19.0, 45.3]°C while the Ambient range was 26.0 [16.9, 40.1]°C. By the final week (December 2–8, 2015), the Warmed soil temperature range was 9.0 [1.5, 31.4] °C while the Ambient range was 3.5 [−2.0, 18.7]°C. The maximum soil temperature measured in this study (50.3°C) was lower than the maximum measured at the field site (57.2°C). Mesocosms were watered with 120 ml of DI water once per week throughout the mesocosm phase. A detailed description of the rationale for the watering regime is provided by Tucker et al. (2019).
On December 09, 2015, after 87 days under the experimental treatments in the greenhouse, the mesocosms that had not been destructively sampled during the mesocosm phase were harvested [n = 5 per biocrust (3 levels) and temperature (2 levels) treatment, for a total of 30 harvested mesocosms]. Based on the criteria stated above for distinguishing Bare soil from Early successional biocrusts, none of the Bare mesocosms had formed a biocrust over the course of the incubation, however, we recognize that some cyanobacterial colonization may have occurred. Biocrusts were separated from the sub-crust soils, and the sub-crust soils were then sieved to homogenize and then air-dried for 1 week. Dry soil was refrigerated at 4°C until incubations were initiated on January 11, 2016.
Incubations
From each of the harvested mesocosms (n = 30 based on 2 greenhouse temperatures × 3 biocrust types × 5 replicates), 6 soil samples were collected and were incubated at one of 3 incubation temperatures (4, 22, or 48°C) and one of 2 substrate levels (control, +CN; Figure 1). Thus, 180 individual samples were incubated as follows. Air-dried soil (30 g each) was added to 236 ml glass jars with rubber septa ports installed in the lids for collection of headspace gas samples. Soils were then returned to the refrigerator for 1 day to allow them to settle. Soil samples were incubated at either 4, 22, or 48°C for 1 h prior to the addition of C and N amendments and water (Figure 1 ‘soil incubation phase’). Amendments were added as glucose + ammonium nitrate (+CN; 5 mg glucose-C and 1.5 mg ammonium nitrate-N/g dry soil in DI water), or unamended control (DI water only). Incubation trials were conducted prior to the start of this experiment to determine appropriate levels of glucose and ammonium nitrate at which soil respiration would reach maximum (i.e., saturating levels of each amendment). Amendments were added in solution, with 6 ml of deionized H2O added per incubation jar, bringing each air-dried soil sample to ∼20% gravimetric water content. Each jar was then sealed, flushed with compressed zero grade breathing air (76.5–80.5% N2 and 19.5–23.5% O2), and incubated at the respective incubation temperature for 1 h, at which point two headspace air samples were collected for analysis of CO2 and N2O concentrations. The jars were then unsealed to allow free exchange with the atmosphere and returned to their respective incubation temperature for 3 h, when a subsequent round of headspace gas sampling occurred. This process was repeated at 24 and 48 h. Headspace [CO2] was measured on a Sable Systems CA-10 CO2 Infrared Gas Analyzer (Sable Systems International, Las Vegas, NV, United States). Headspace [N2O] was measured on a Shimadzu GC-14a Gas Chromatograph (Shimadzu Corp., Kyoto, Japan).
Immediately prior to the incubation, and again at 48 h, microbial biomass C and N (MBC and MBN), as well as K2SO4-extractable dissolved organic C (DOC) and total dissolved N (TN) were measured via the chloroform fumigation-extraction protocol (Vance et al., 1987). In brief, soil samples were divided into three subsamples: one each for measurement of soil water content, dissolved organic C and total dissolved N concentration, and post-fumigation dissolved organic C and total dissolved N concentration. Chloroform fumigation was conducted for 48 h. Samples were extracted in 0.5 M K2SO4 for 1 h and then filtered using Whatman 42 filter paper. Total dissolved organic C and total N of the extracts were measured on a Shimadzu TOC/TN-VCSH analyzer (Shimadzu Corp., Kyoto, Japan). MBC and MBN were determined as the difference between initial and fumigated samples, corrected by a 0.35 extraction efficiency factor (Voroney et al., 2008).
Statistical Analyses
Cumulative respiration and N2O efflux were calculated as the weighted sum of flux rates × time across all 4 time points. Exponential temperature sensitivity of trace gas fluxes was evaluated by fitting the log-transformed cumulative flux to a linear function of incubation temperature as equation 1 logZ = αZ×T + βZ, where Z is either cumulative respiration or cumulative N2O efflux, using the glm() function in R statistical software. Q10 temperature sensitivity was then calculated as equation 2 Q10 = e10αz. Linear temperature sensitivity of changes in the microbial biomass and soil pools of C and N was evaluated by first calculating the change in pool size for each sample as equation 3 ΔX = Xfinal − Xinitial, where X is either MBC, MBN, DOC, or TN, and then evaluating that change as a linear function of temperature via equation 4 ΔX = αX × T + βX. Thus, αx represents the slope of the change in pool X to a change in soil temperature. We do not account for exponential growth or turnover in this analysis; therefore the microbial biomass response should only be interpreted as a change in biomass, and not a growth rate, and thus is not well-suited for calculating growth efficiency. All pool and flux data were analyzed via permutational analysis of variance after testing revealed violations of assumptions for traditional ANOVA: most response variables (log-transformed in the case of cumulative respiration and N2O efflux) passed Levene’s test for equality of variance, but most fluxes violated Shapiro test for normality of residuals. Therefore, permutational ANOVA was implemented using the aovp function in the lmPerm package in R. Temperature sensitivity estimates (Q10 from equation 2 and αx from equation 4) were also compared using a standard ANOVA after verifying that they met assumptions of normality and equal variance. Post hoc pairwise comparisons were conducted using pairwise T-test with a Holm adjustment for multiple comparisons using the pairwise t-test function in R. Significant differences are reported at α = 0.05, and marginally significant differences are reported at 0.05 < α < 0.1. All data analyses were conducted using R statistical software version 3.5.3 ‘Great Truth’ (release 3/11/2019).
Results
Soil C and N Pools Before Incubation
At the end of the mesocosm phase and prior to soil incubations, soil microbial biomass C (MBC) was marginally higher (23%; p = 0.089) in Late successional biocrust mesocosms at Ambient temperature (Figure 2A and Table 1) compared with Bare soil mesocosms at Ambient temperatures, no other differences were significant. Microbial biomass N (MBN) was 55.7 and 32.8% higher in Late relative to Early biocrust or Bare soil mesocosms, respectively (p < 0.001 for each; Figure 2B and Table 1), respectively, but not different among mesocosm temperature treatments. Extractable dissolved organic C (DOC) was not different among treatments. Soil extractable total N (TN) was 96 and 70% higher under Late relatively to Early biocrust or Bare soil treatments, respectively (p = 0.0075 and 0.0018, respectively), and was enhanced 42.4% by mesocosm Warming (p = 0.022), particularly under Late biocrust (Figure 2D and Table 1) [i.e., TN in Late successional-Warmed treatments was 71% higher compared with in Late successional-Ambient treatments (p = 0.047)].
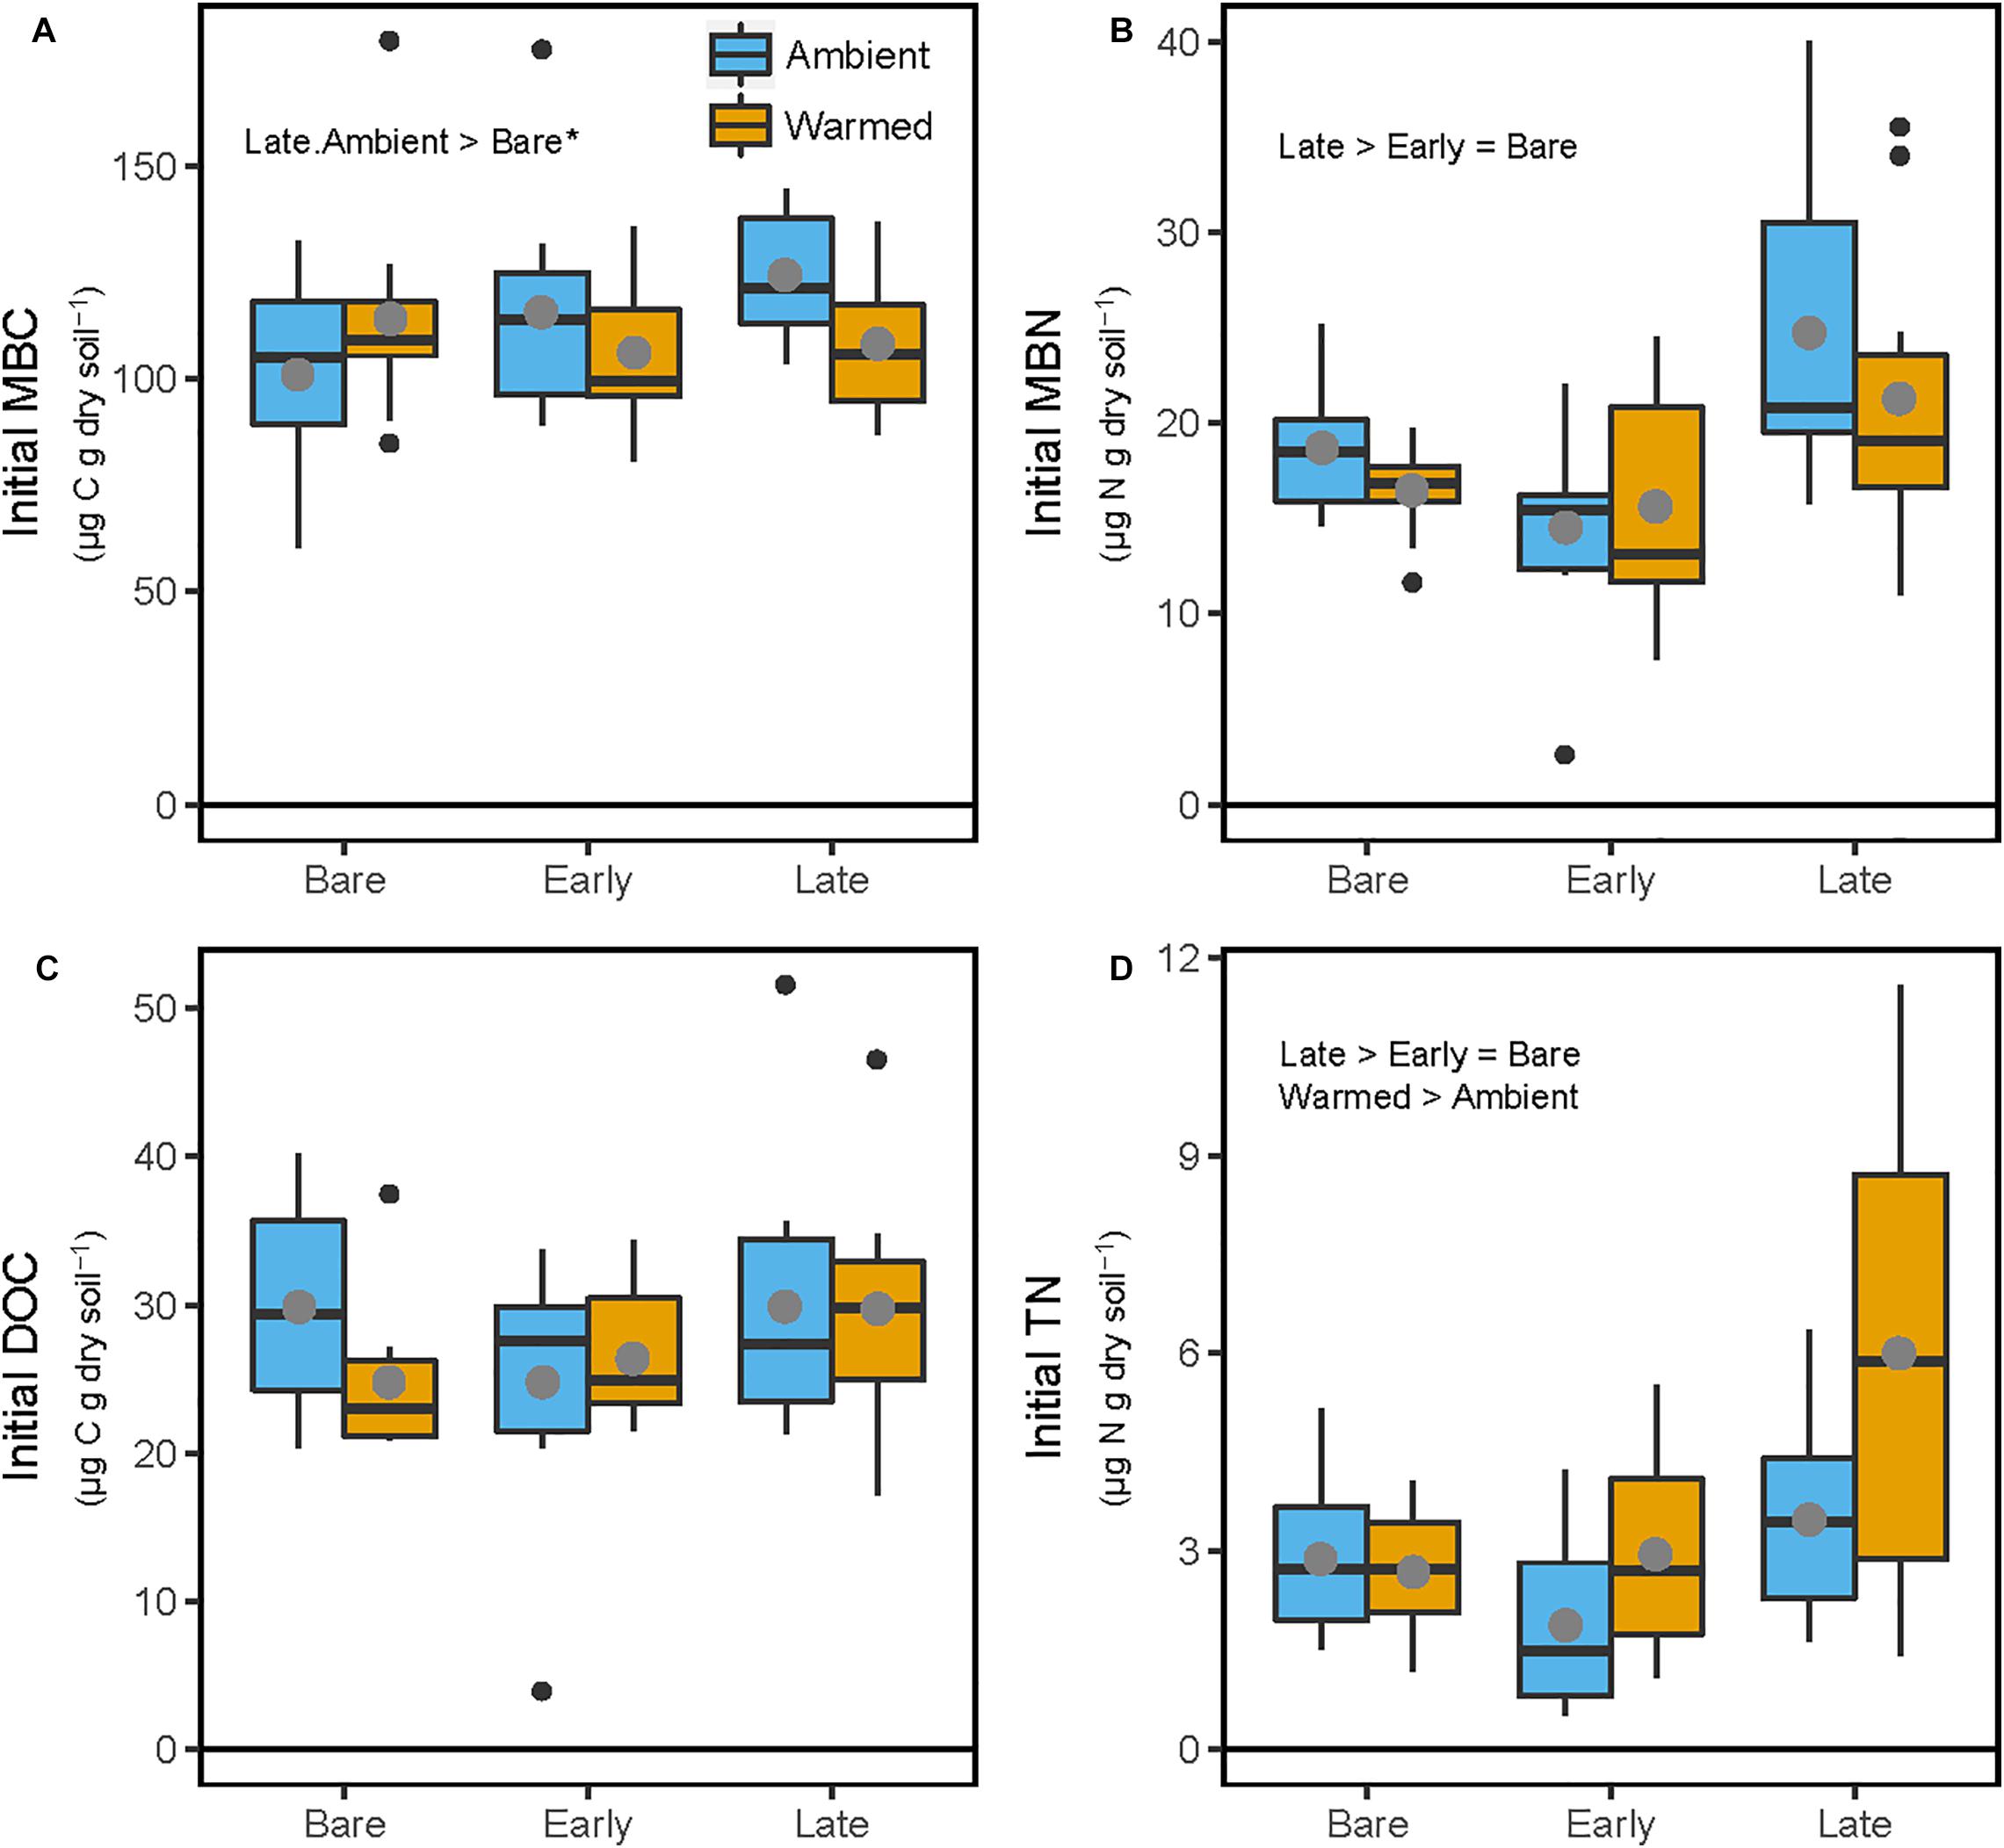
Figure 2. Soil C and N pools following 87-day greenhouse mesocosm incubation, where soils were maintained beneath Bare, Early, or Late successional biocrust states under either ‘Ambient’ or ‘Warm’ (+5°C) conditions. (A) Microbial biomass C (MBC), (B) microbial biomass N (MBN), (C) K2SO4-extractable dissolved organic C (DOC), (D) K2SO4-extractable total dissolved N (TN). These values are considered ‘Initial’ because they represent the conditions prior to the incubation study. Each box represents the median and first (Q1) and third (Q3) quartiles, while bars represent the minimum (Q1 – 1.5 × interquartile range) and maximum (i.e., Q3 + 1.3 × interquartile range), and solid gray circles represent the treatment mean (n = 5). Black dots represent outlier points. Significant differences between prior mesocosm temperature or biocrust successional state treatments are presented using ‘>’ or ‘<’ within each panel. Statistics are presented within the text and in Table 1. An asterisk after the comparison signifies a marginal difference (0.1 > α > 0.05).
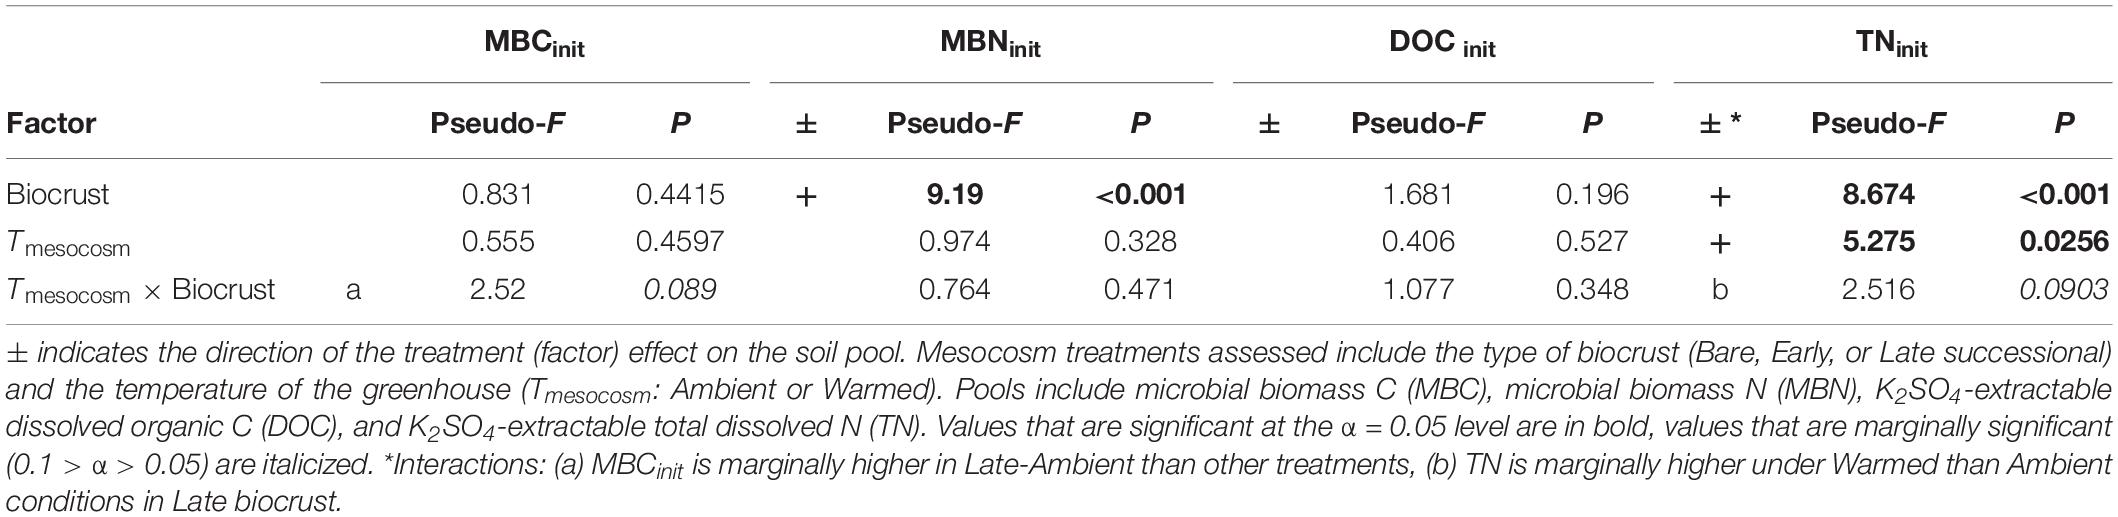
Table 1. ANOVA table for soil C and N pools immediately following the mesocosm phase, prior to the incubation phase.
Unamended Control Soil C and N Pools and Cumulative Fluxes Following Incubation
In the unamended controls, respiration was 100 and 140% greater in soils from Late successional mesocosm soils compared with Early successional or Bare soil mesocosms, respectively (p = 0.033 and 0.043), but respiration was not affected by either mesocosm or incubation temperature (Figure 3 and Table 2). In the unamended control N2O efflux increased with increasing incubation temperature (p = 0.0026), but was not affected by other factors (Figure 3 and Table 2). Post-incubation MBC was 67% higher in the mesocosm Ambient compared with Warmed soils, and decreased by 65% at the hottest incubation temperature (p < 0.001, Figure 3 and Table 2). Post-incubation MBN was 41.8% greater in Late successional mesocosms compared with Bare (p = 0.0357), and decreased by 63% at the hottest incubation temperature (p < 0.001). Post-incubation extractable DOC was 103% greater in soils from Late-Ambient than Bare-Ambient mesocosms (p = 0.026) and decreased with increasing incubation temperature (p = 0.032). Post-incubation extractable TN was 45 and 29% higher in soils from Late compared with Early successional or Bare mesocosms [p = 0.019 and 0.097, respectively, and increased with increasing incubation temperature (p < 0.001)].
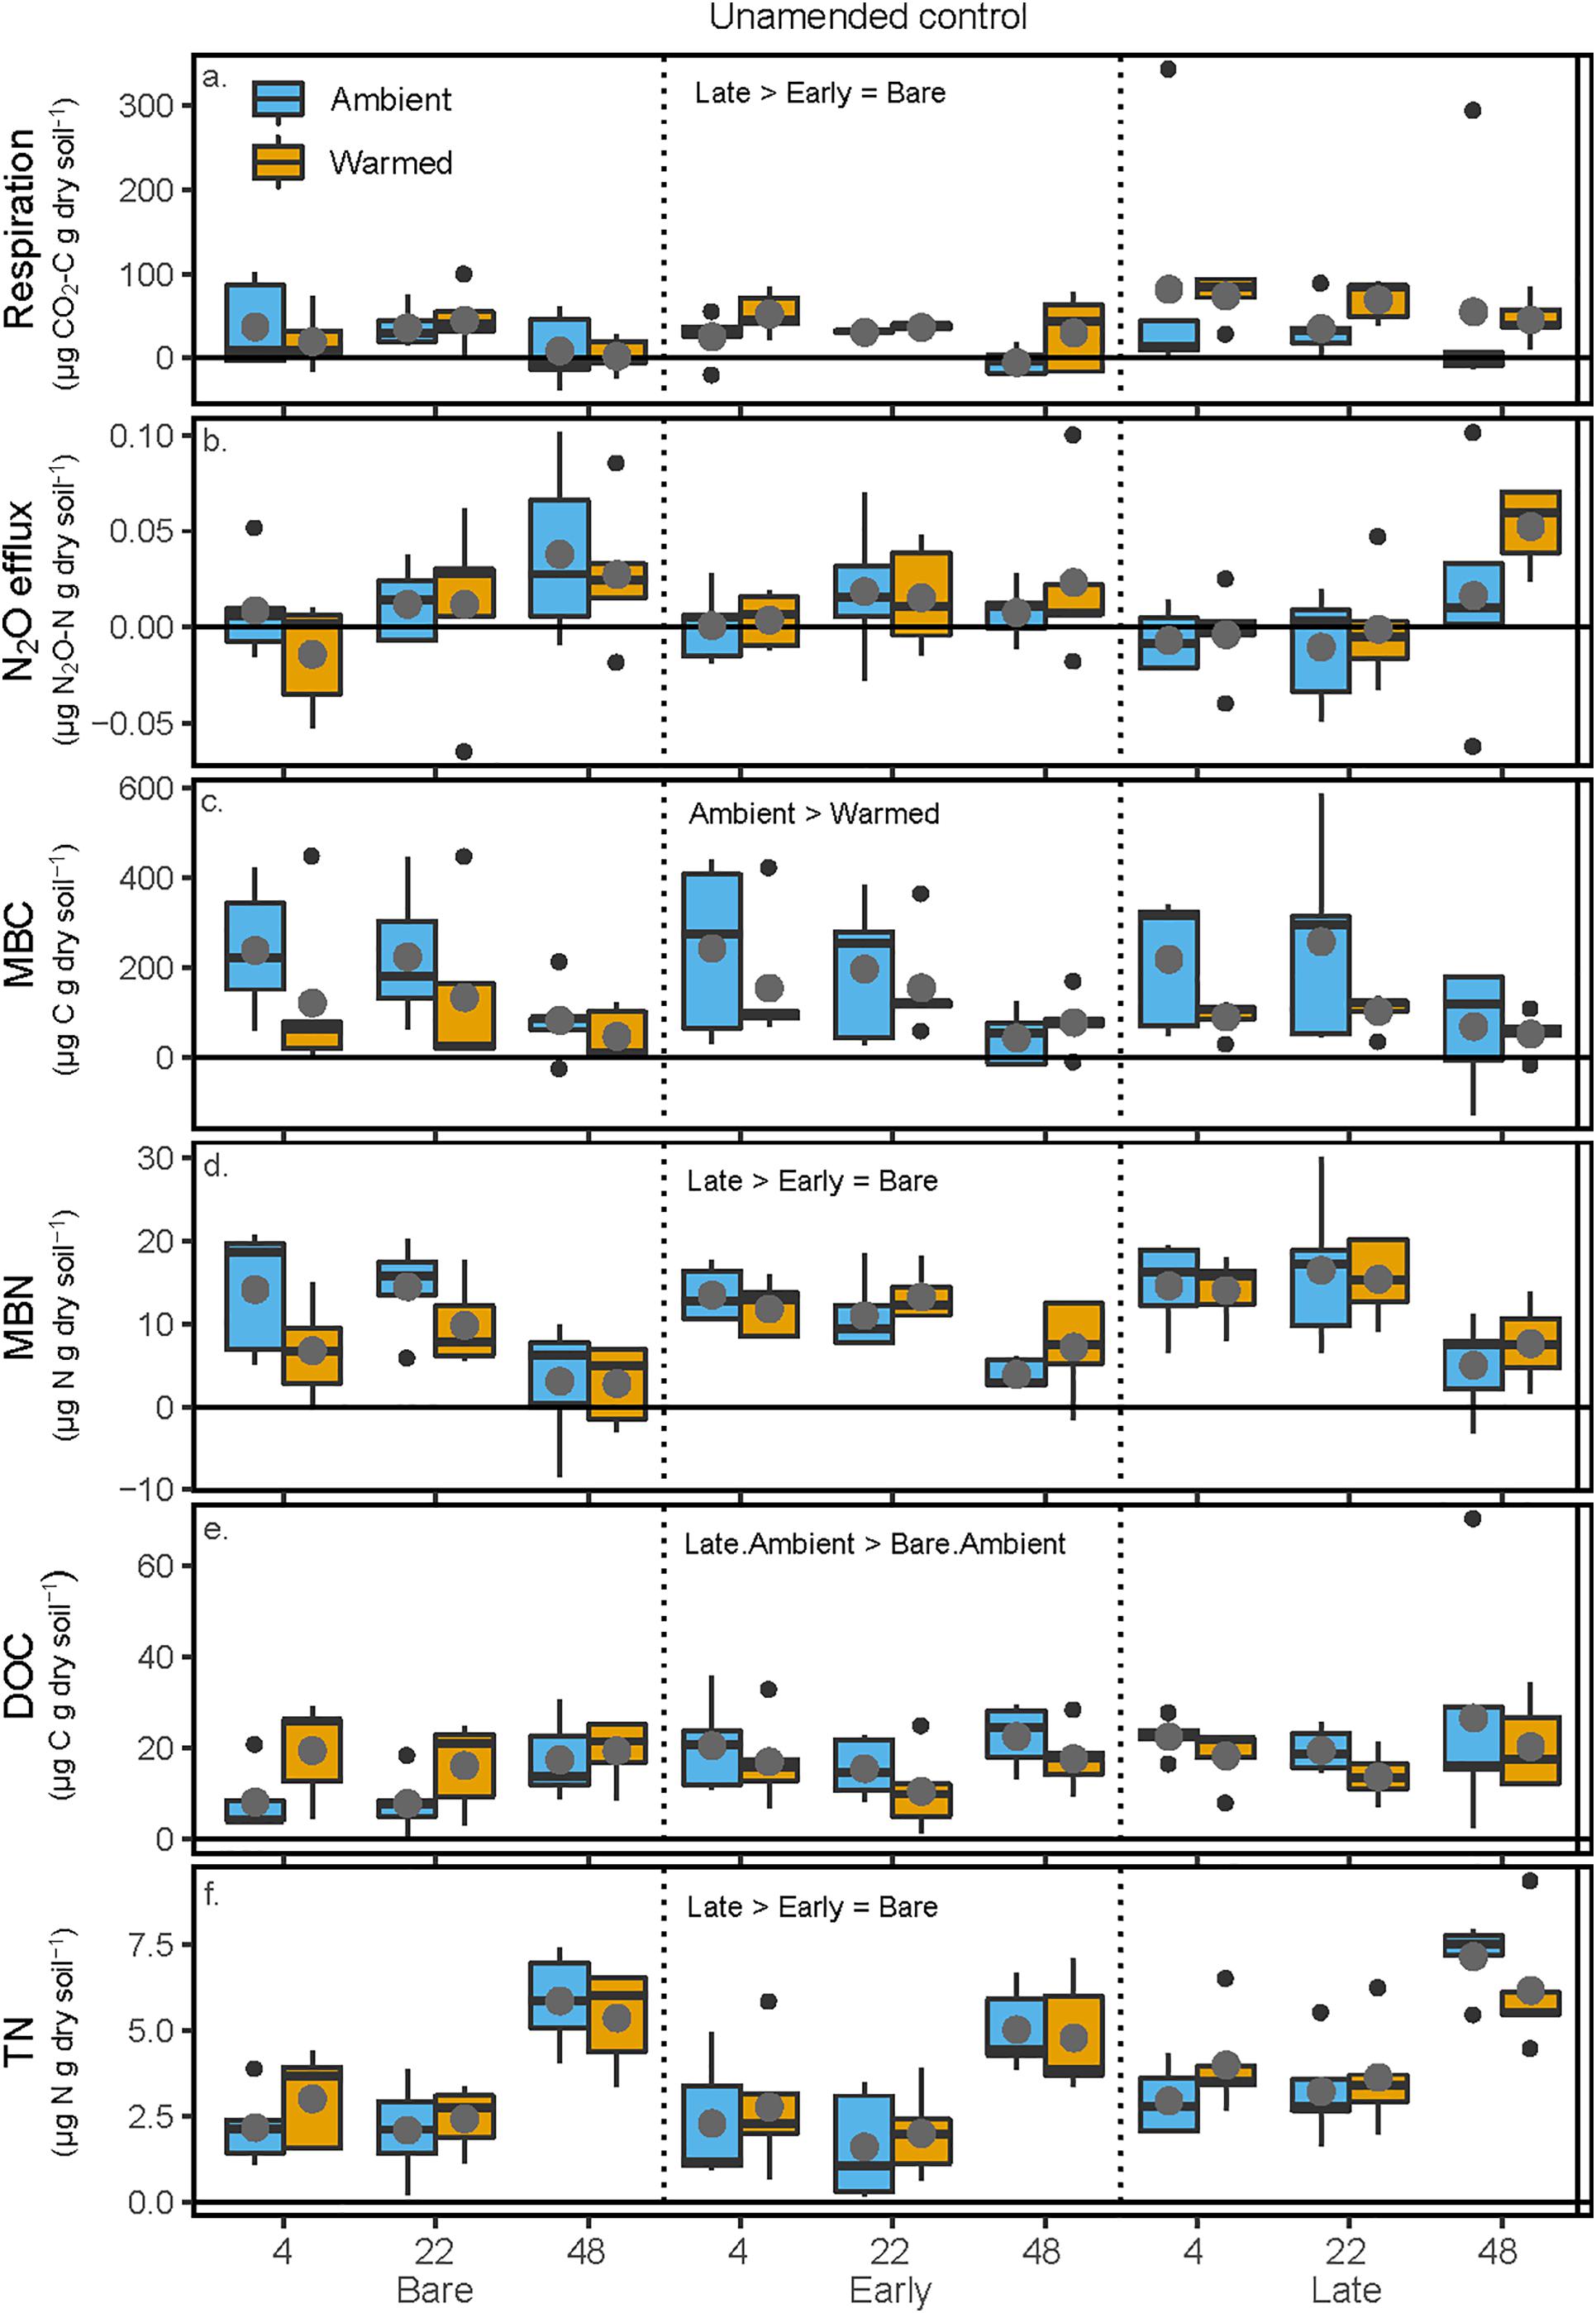
Figure 3. Carbon and N pools and fluxes in soils to which no +CN amendment was added during the soil incubation phase. Shown are (a) soil respiration, (b) soil N2O efflux, (c) microbial biomass C (MBC) concentrations, (d) microbial biomass N (MBN) concentrations, (e) K2SO4-extractable dissolved organic C (DOC), and (f) K2SO4-extractable total dissolved N (TN). The x-axis is arranged with incubation temperature (4, 22, and 48°C) grouped within the mesocosm biocrust successional treatments (Bare, Early, and Late). Blue boxes show fluxes and pools for the soils from Ambient temperature during the mesocosm phase, while orange boxes are mesocosm Warmed soils. Each box represents the median and first (Q1) and third (Q3) quartiles, while bars represent the minimum (Q1 – 1.5 × interquartile range) and maximum (i.e., Q3 + 1.3 × interquartile range). Gray circles represent mean values (n = 5) and black dots represent outlier points. Significant differences between prior mesocosm temperature or biocrust successional state treatments are presented using ‘>’ or ‘<’ within each panel and statistics are presented within the text and in Table 2.
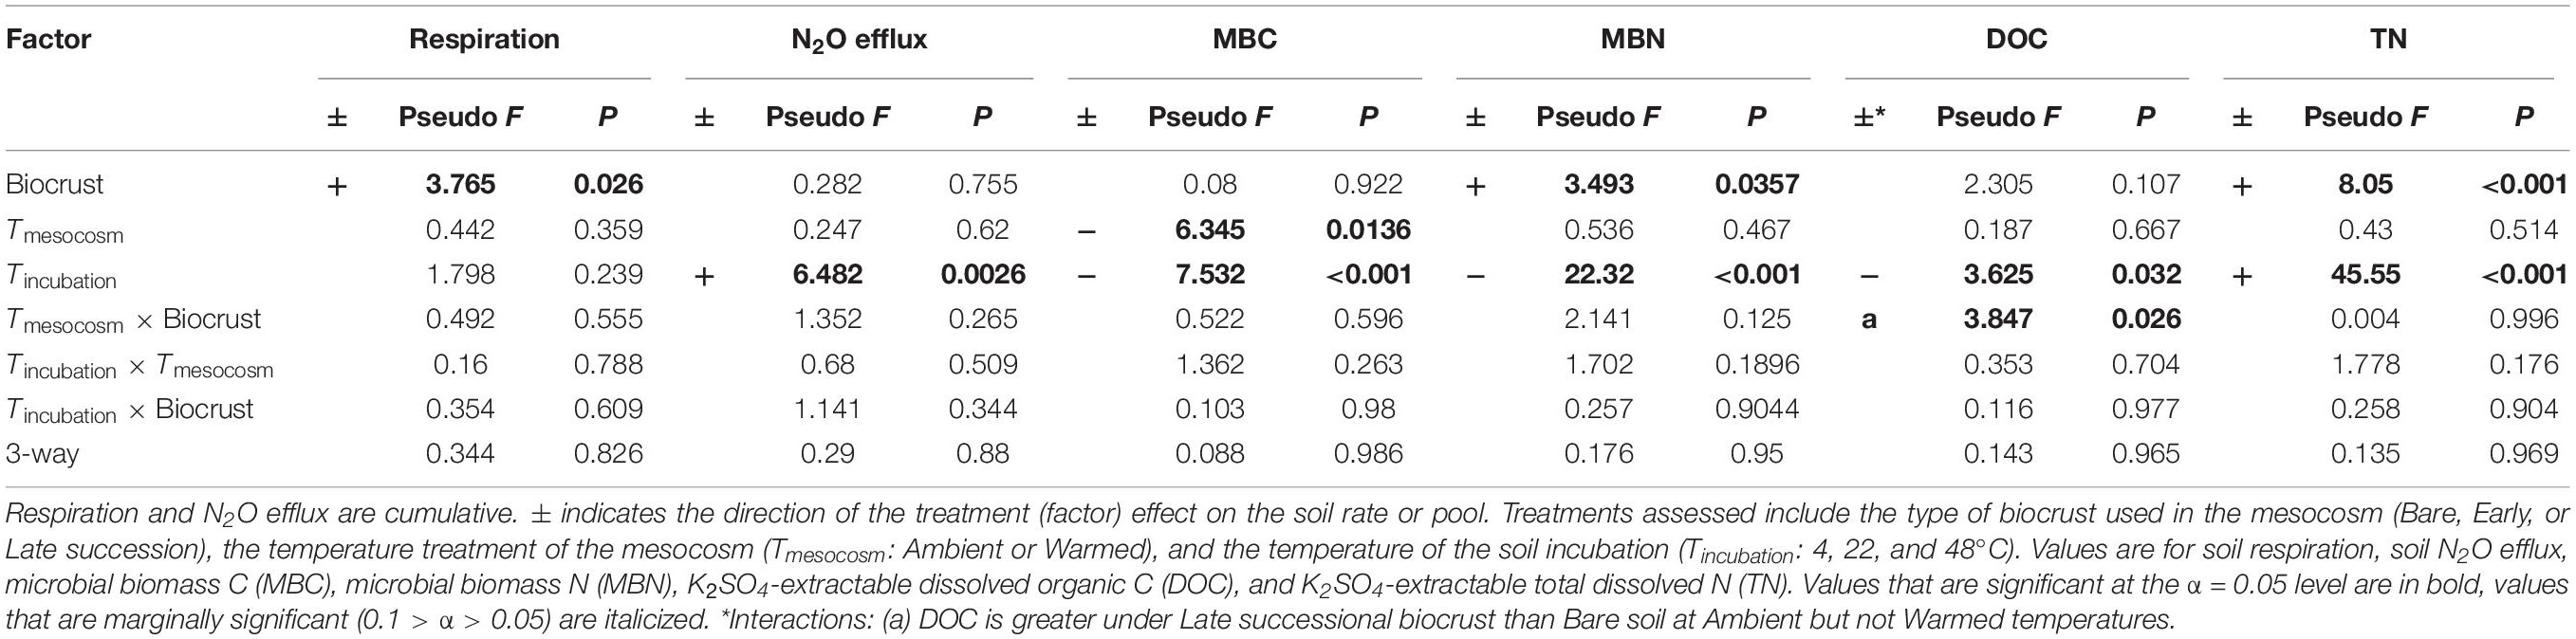
Table 2. ANOVA table for soil C and N pools and fluxes following the soil incubations in unamended control soils.
+CN Treatment Soil C and N Pools and Cumulative Fluxes Following Incubation
All pools and fluxes of C and N showed significant increases with the addition of glucose and ammonium nitrate. Cumulative soil respiration was overall 850% higher (p < 0.001) in the +CN incubations relative to the unamended controls (p < 0.001). In the +CN treatment, respiration increased exponentially with increasing incubation temperature (p < 0.001), and respiration at 48° was reduced by 53 and 60.3% between Ambient and Warmed treatments under Late and Early successional biocrust (p = 0.0011 and 0.00255), respectively. There was no difference between Ambient and Warmed respiration under Bare soils (Figure 4 and Table 3). N2O efflux was 482% higher in the +CN incubations than in the unamended control (p < 0.001). Cumulative N2O efflux similarly increased with increasing incubation temperature (p < 0.001), and N2O efflux at 48°C was 44% lower in the Warmed compared with Ambient mesocosms (p < 0.00135), while no other factor was significant. In the +CN treatment, MBC decreased by 85% at 48°C (p < 0.001) compared with the low temperatures, and was not responsive to other factors. No significant effects of any treatments were apparent in MBN, due to the very high uncertainty in estimates of MBN from soils to which inorganic N was added. DOC declined with increasing incubation temperature (p < 0.001), and DOC was marginally higher at lower incubation temperatures in soils from the Ambient compared to the Warmed mesocosms (p = 0.062). TN was lower at higher incubation temperatures (p < 0.001) and was marginally higher in Ambient compared with Warmed mesocosms (p = 0.098).
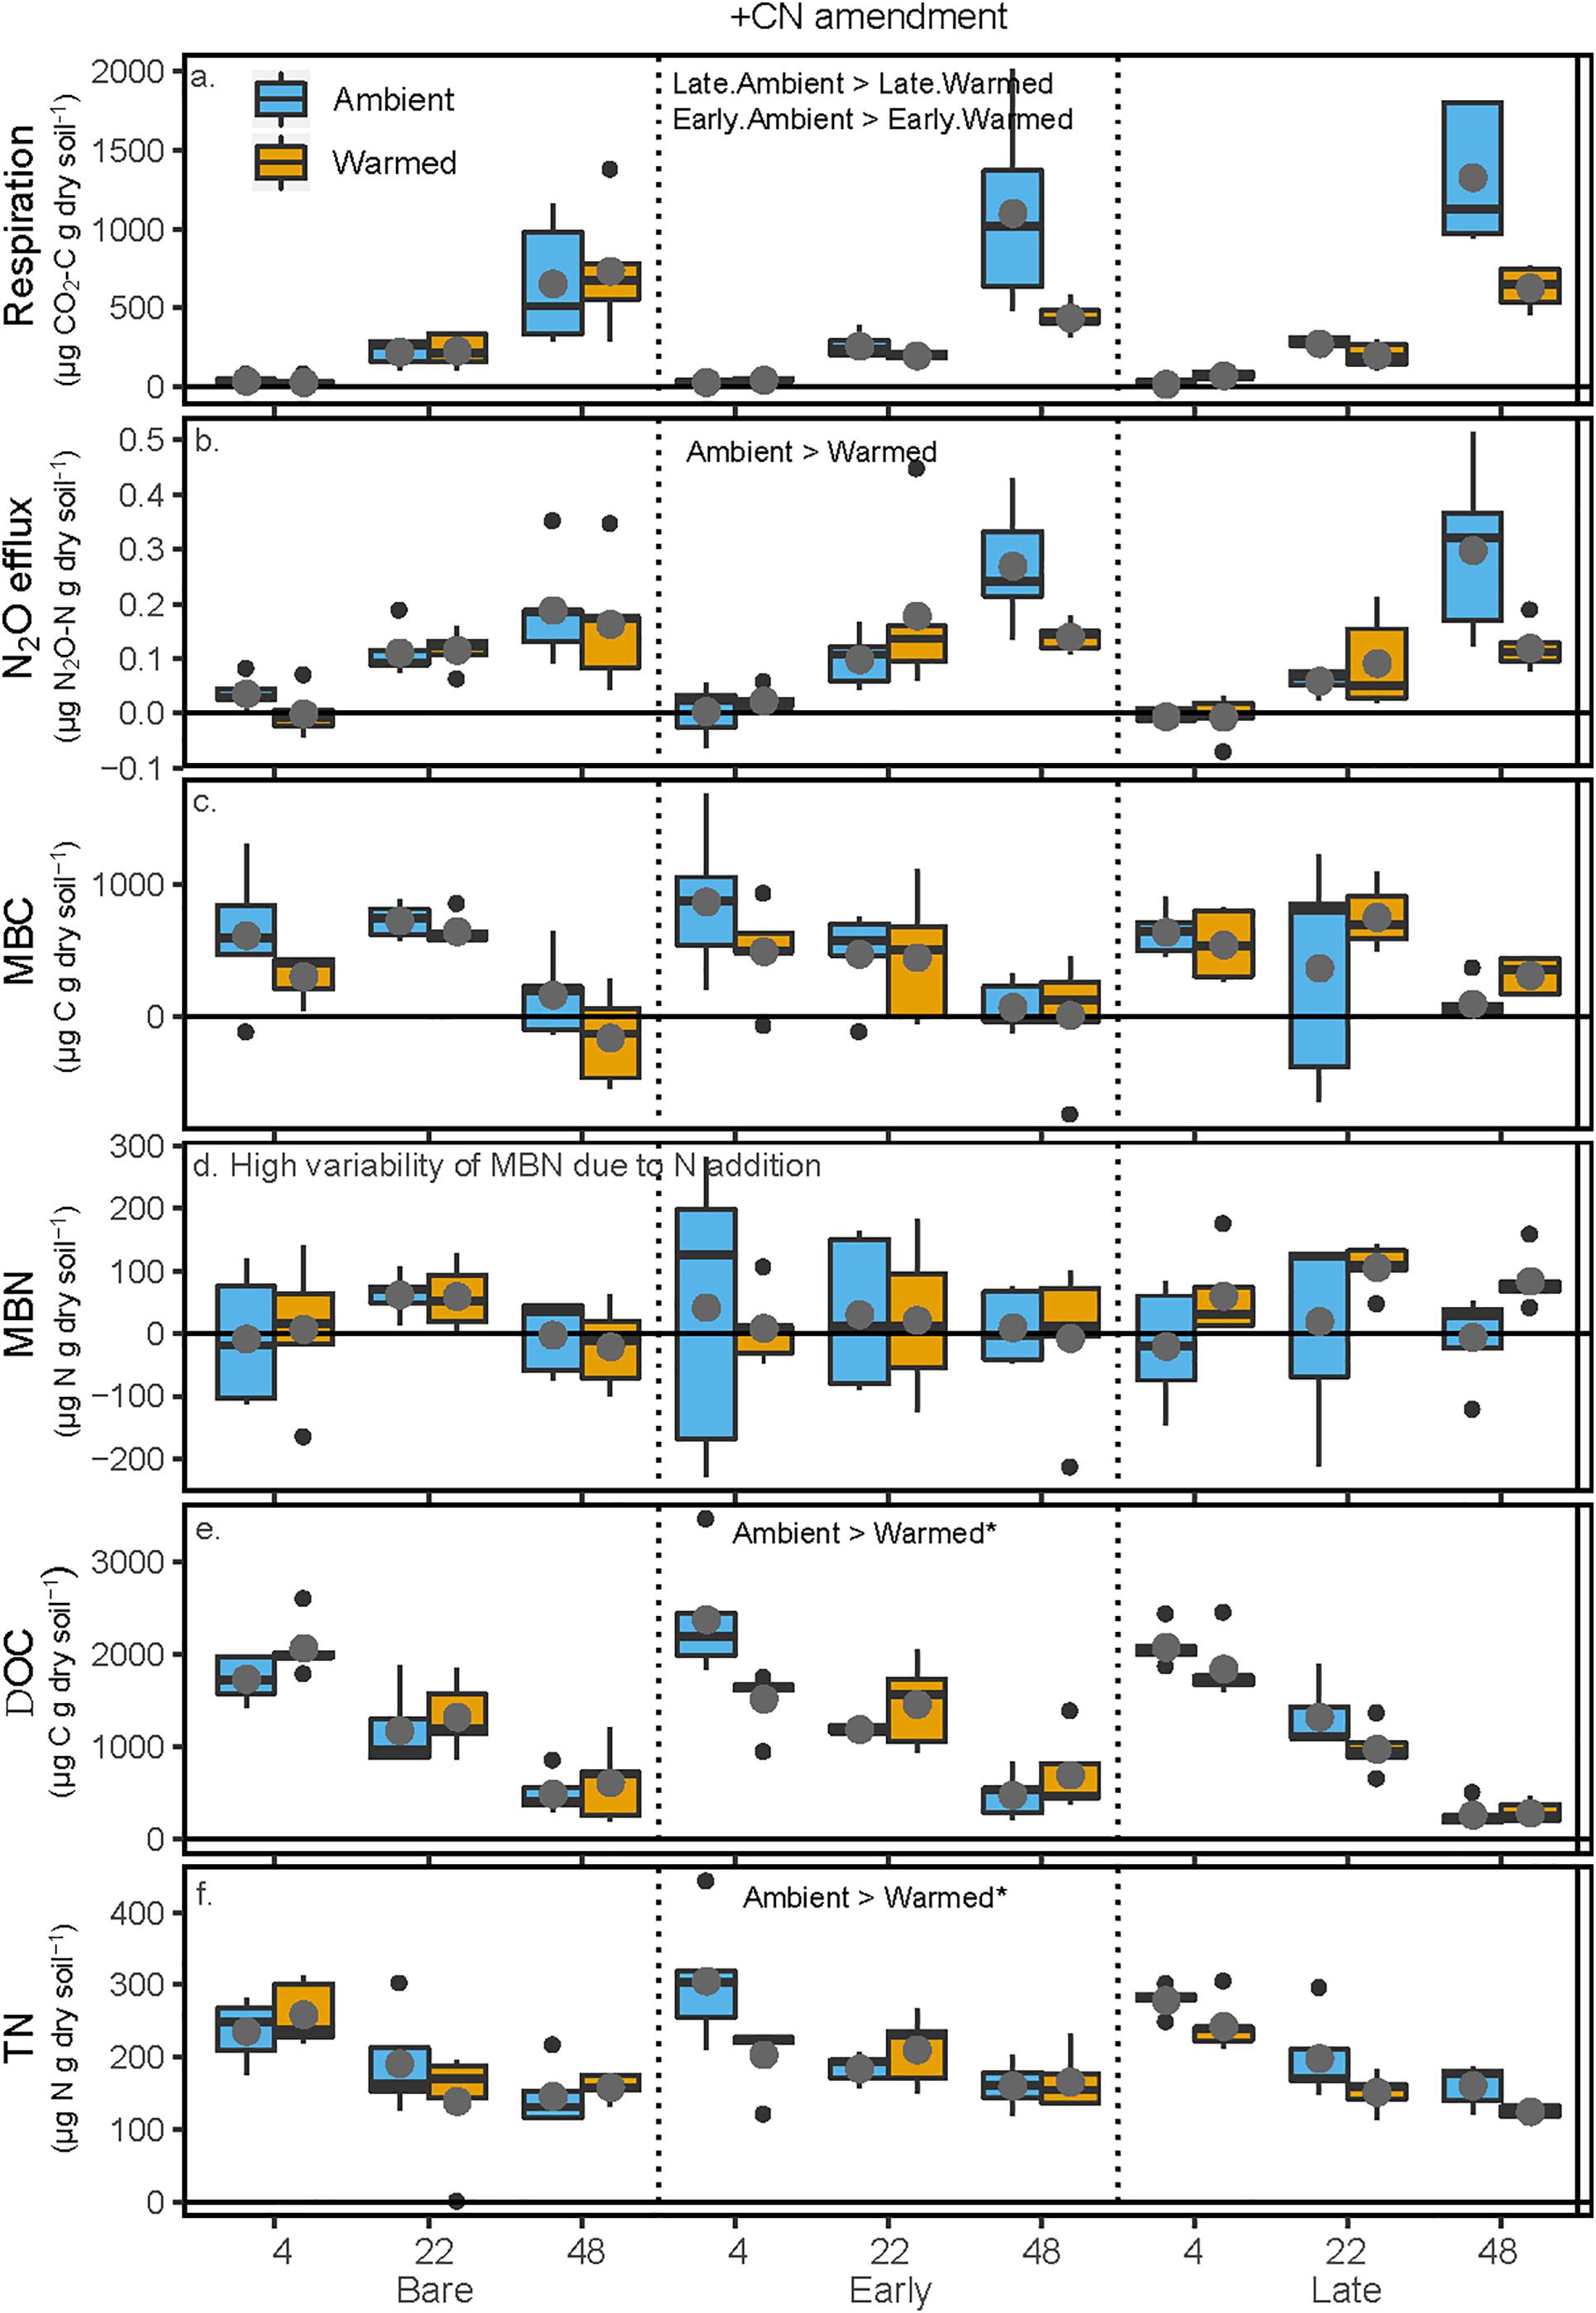
Figure 4. Carbon and N pools and fluxes in soils to which glucose and ammonium nitrate (+CN) were added following the soil incubation phase. Shown are (a) soil respiration, (b) soil N2O efflux, (c) microbial biomass C (MBC) concentrations, (d) microbial biomass N (MBN) concentrations, (e) K2SO4-extractable dissolved organic C (DOC), and (f) K2SO4-extractable total dissolved N (TN). The x-axis is arranged with incubation temperature (4, 22, and 48°C) grouped by the mesocosm biocrust successional treatments (Bare, Early, and Late). Blue boxes show fluxes and pools for the soils from Ambient temperature during the mesocosm phase, while orange boxes are mesocosm Warmed soils. Each box represents the median and first (Q1) and third (Q3) quartiles, while bars represent the minimum (Q1 – 1.5 × interquartile range) and maximum (i.e., Q3 + 1.3 × interquartile range). Gray circles represent the mean (n = 5) and black dots represent outlier points. Significant differences between prior mesocosm temperature or biocrust successional state are presented using ‘>’ or ‘<’ within each panel. Statistics are presented within the text and in Table 3. An asterisk after the comparison signifies a marginal difference (0.1 > α > 0.05).
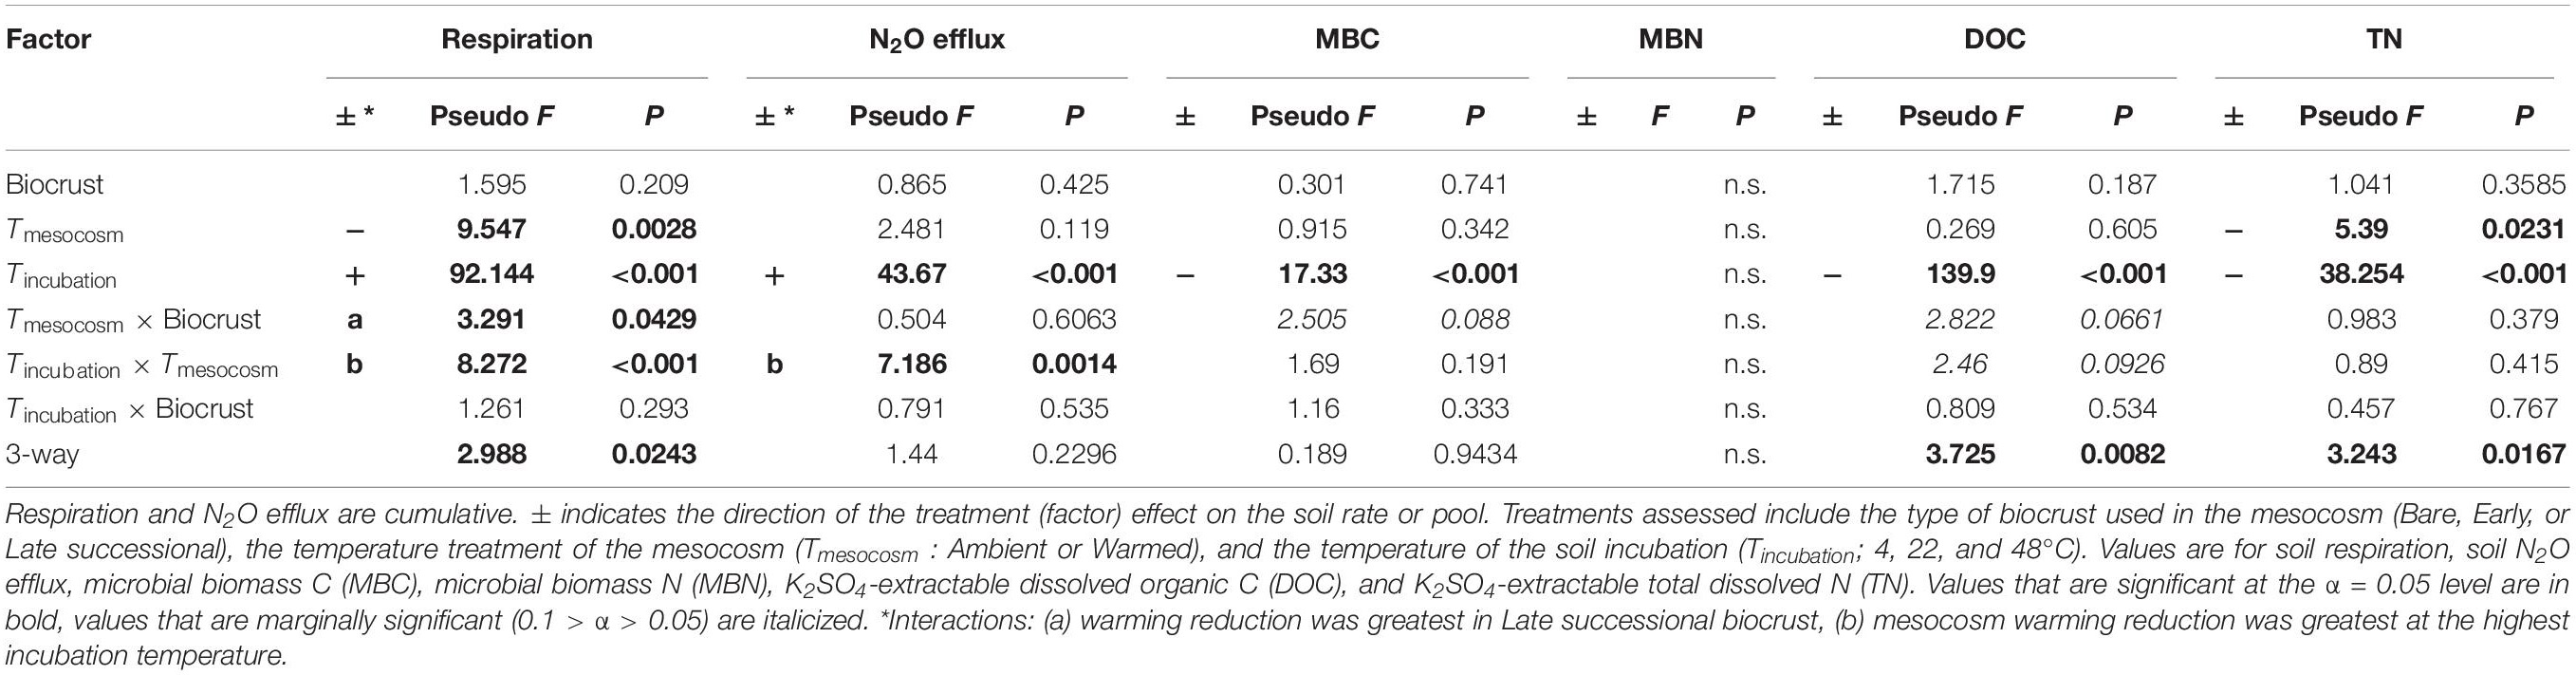
Table 3. ANOVA table for soil C and N pools and fluxes following the soil incubations in soils to which glucose + ammonium nitrate (+CN) was added.
Temperature Sensitivity of Pool Changes and Trace Gas Fluxes
Overall, the temperature sensitivity of CO2 and N2O fluxes and changes in the pool sizes of C and N was much greater (in either the positive or negative direction) for soils subjected to the +CN treatment than the no-amendment controls (Figures 5, 6). The temperature sensitivity of soil respiration (Q10R) was 25.5% lower in soils from Warmed than Ambient mesocosms in the +CN treatment for Late successional biocrust (p = 0.03), but this difference was not significant for other biocrust types (Figure 5 and Table 4). There was no effect of mesocosm warming on Q10R in the unamended controls (Figure 5 and Table 4). The temperature sensitivity of soil N2O efflux (Q10N) was not significantly affected by either mesocosm temperature or biocrust successional state (Figures 5, 6). Microbial biomass declined with increasing incubation temperature, thus the temperature sensitivities of microbial biomass (αMBC, αMBN) were negative (Figures 5, 6). The temperature sensitivity of the changes in the MBC pool (αMBC) was reduced (that is, the pool declined less rapidly) in the Warmed mesocosms compared to the Ambient in the unamended control soils (p = 0.006) – the same trend was apparent in the +CN treatment, however, was not significant (Figures 5, 6 and Table 4). The temperature sensitivity of the change in microbial biomass N (αMBN) was reduced by mesocosm warming (p = 0.0033) in the unamended controls but not the +CN treatment, but was not responsive to the biocrust successional state (Figure 5). In the +CN treatment the DOC pool showed reduced temperature sensitivity (i.e., αDOC was less negative) in response to mesocosm warming (p = 0.037), while the soil TN pool showed marginally reduced temperature sensitivity in response to warming, mostly evident in soil collected from under Early successional biocrust (Figure 5 and Table 4).
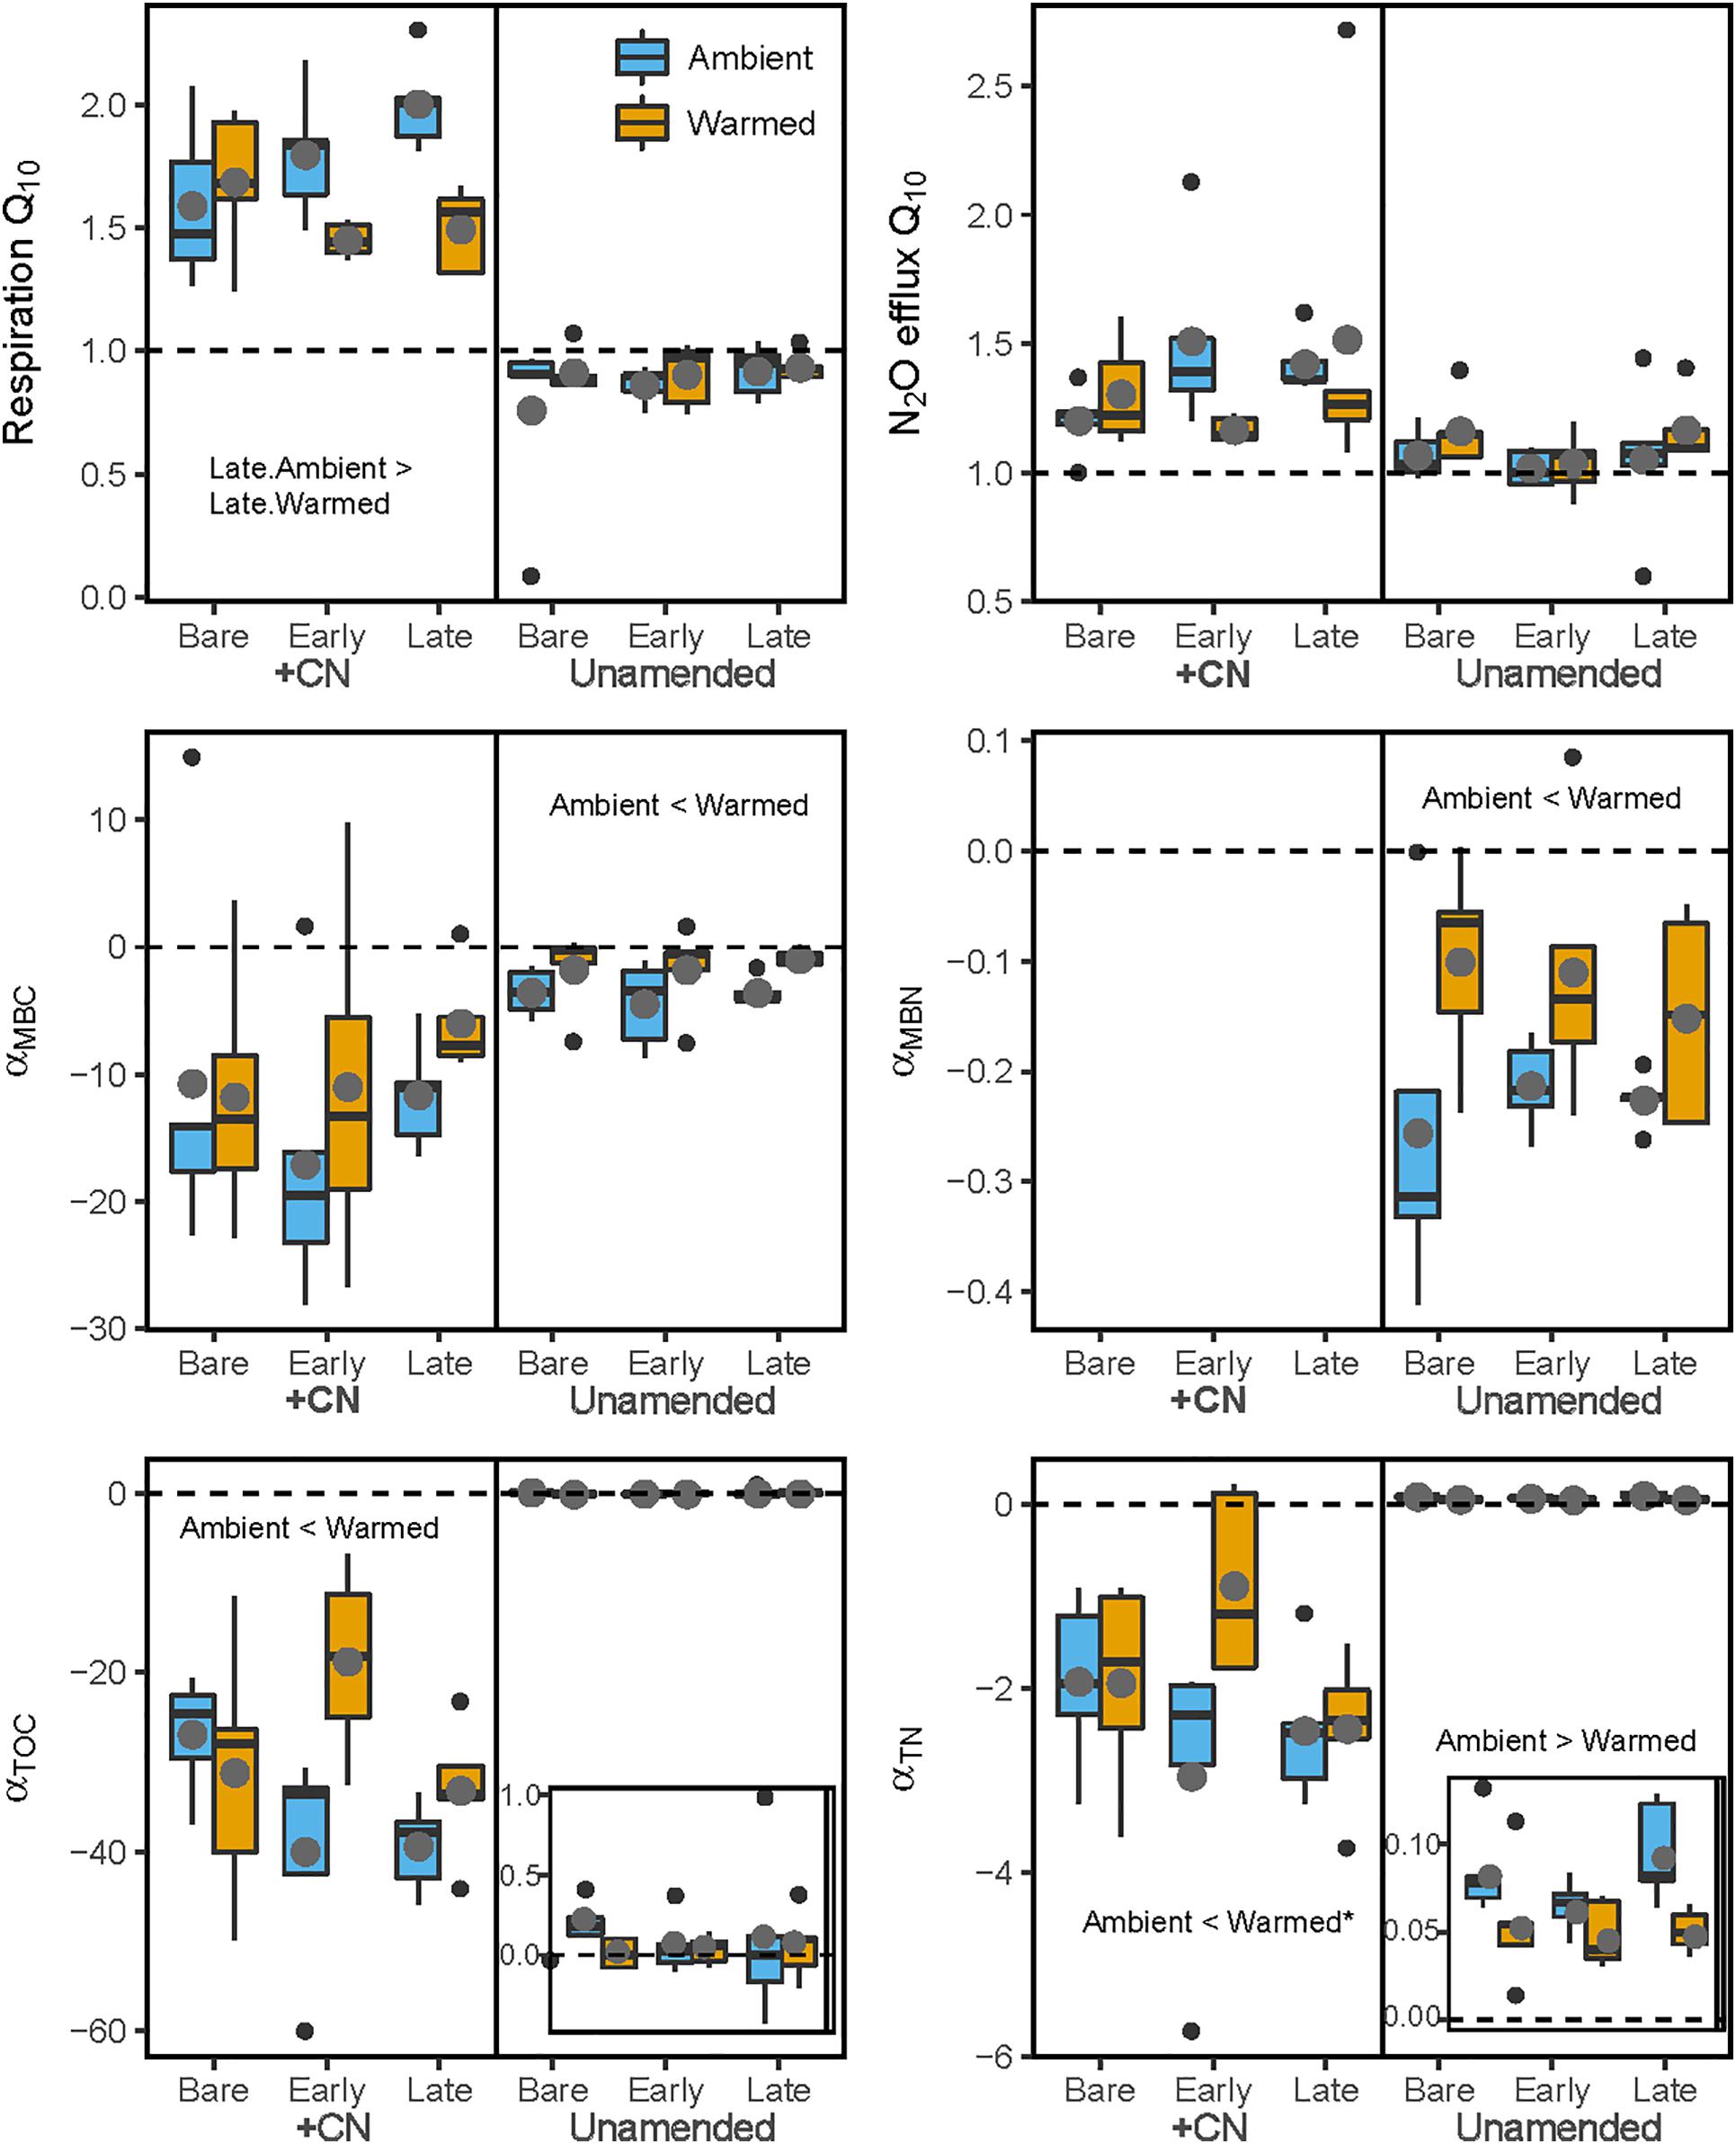
Figure 5. Temperature sensitivity of soil heterotrophic C and N cycling in laboratory incubations. The (left) panels represent values for samples with the +CN amendment, while the (right) panels shows unamended controls. Blue bars represent Ambient conditions, and orange bars represent the Warmed treatment. Bare, Early, and Late refer to biocrust successional state. Q10 refers to the Q10 temperature sensitivity of respiration or N2O efflux, while α(MBC, MBN, DOC, or TN) refers to the linear temperature sensitivity of changes in soil microbial biomass C (MBC), microbial biomass N (MBN), K2SO4-extractable dissolved organic C (DOC), and K2SO4-extractable total dissolved N (TN) pools. Dashed horizontal lines represent the baseline of no temperature sensitivity (either Q10 = 1 or α = 0). Each box represents the median and first (Q1) and third (Q3) quartiles, while bars represent the minimum (Q1 – 1.5 × interquartile range) and maximum (i.e., Q3 + 1.3 × interquartile range). Gray circles represent the mean (n = 5), and black dots represent outlier points. Insets in the lower two panels magnify the values for unamended control soils. Significant differences between prior mesocosm temperature or biocrust successional state within each amendment level are presented using ‘>’ or ‘<’ within each panel; these are described in the text and presented in Table 4.
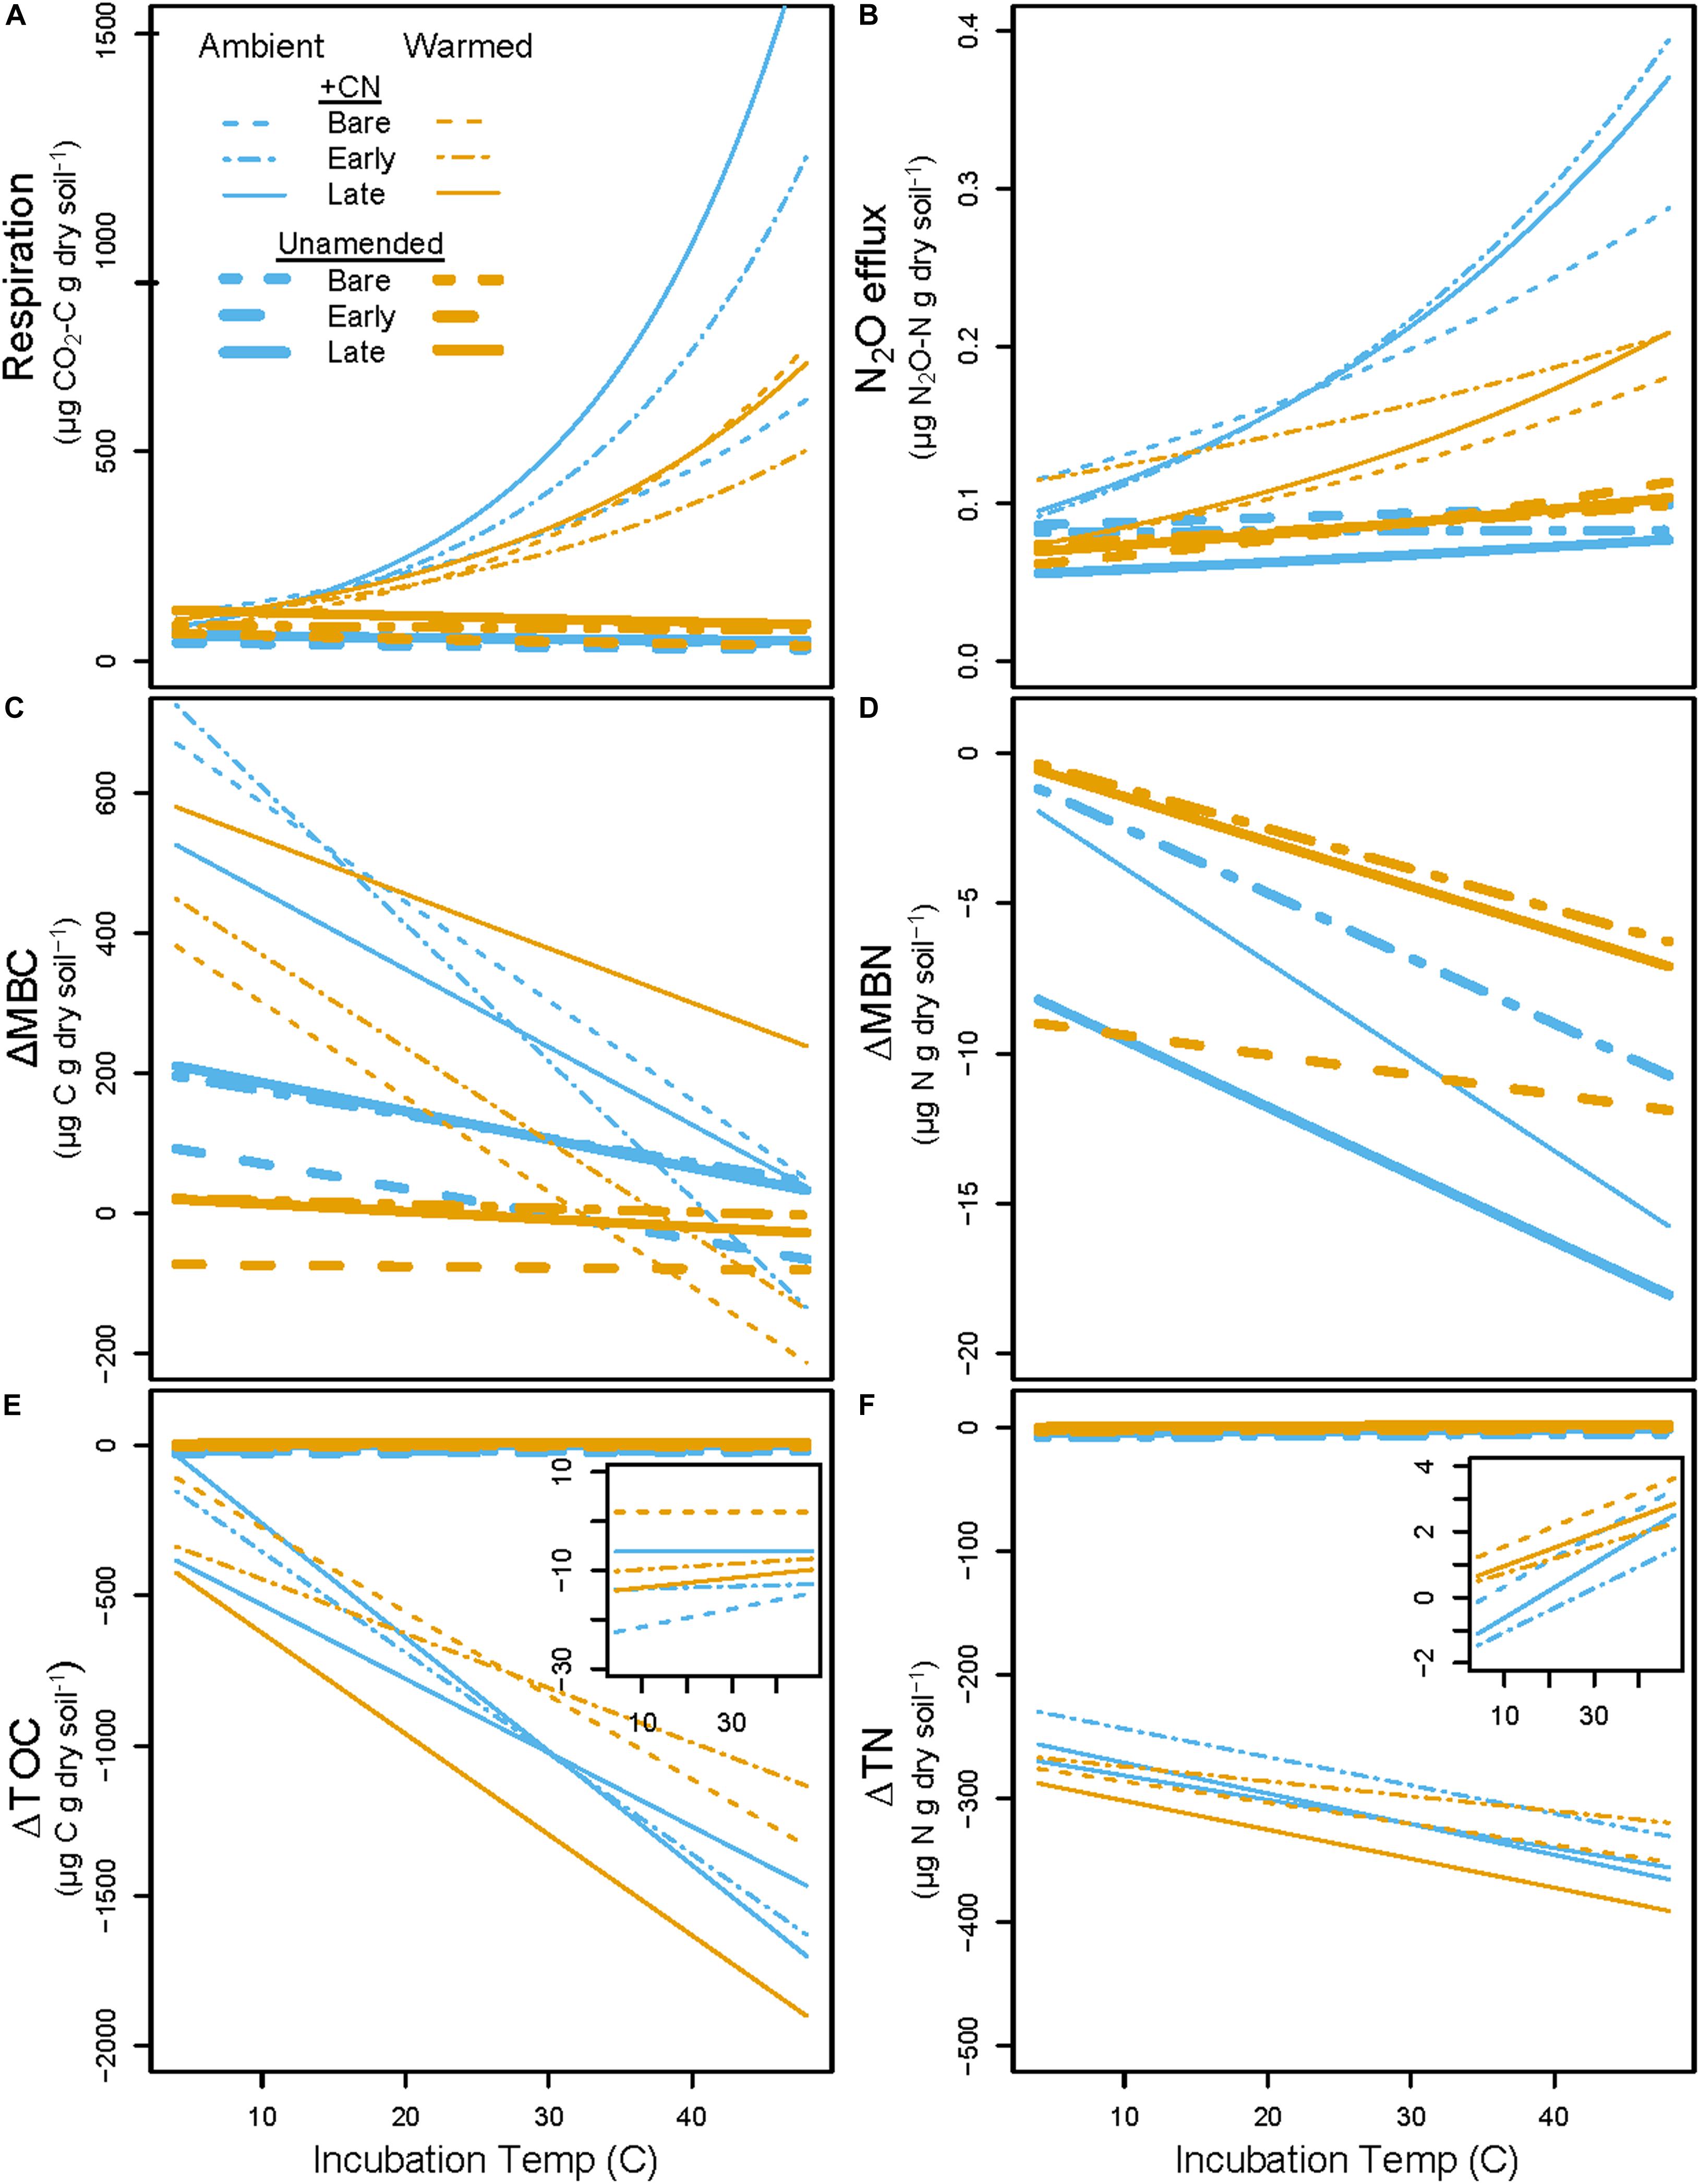
Figure 6. Predicted CO2 and N2O cumulative gas fluxes (A,B) and changes in pools (Final – Initial; C–F) across the range of incubation temperatures based on parameters from exponential and linear regressions. Blue lines represent Ambient treatment values, while orange lines represent Warmed treatment values. Thin lines are +CN soils while thick lines are unamended controls. Dashed lines are Bare, dot-dashed are Early, and solid lines are Late successional biocrust treatments. Inset plots in (E,F) show patterns in K2SO4-extractable dissolved organic C (ΔDOC) and K2SO4-extractable total dissolved N (ΔTN) in the unamended control with a smaller scale. Data used to generate these figures are previously presented as boxplots in Figures 2–4, and the differences in slopes between these lines are presented and evaluated in Figure 5 and Table 4. Individual data points and statistics are excluded from this figure to highlight the overall pattern.
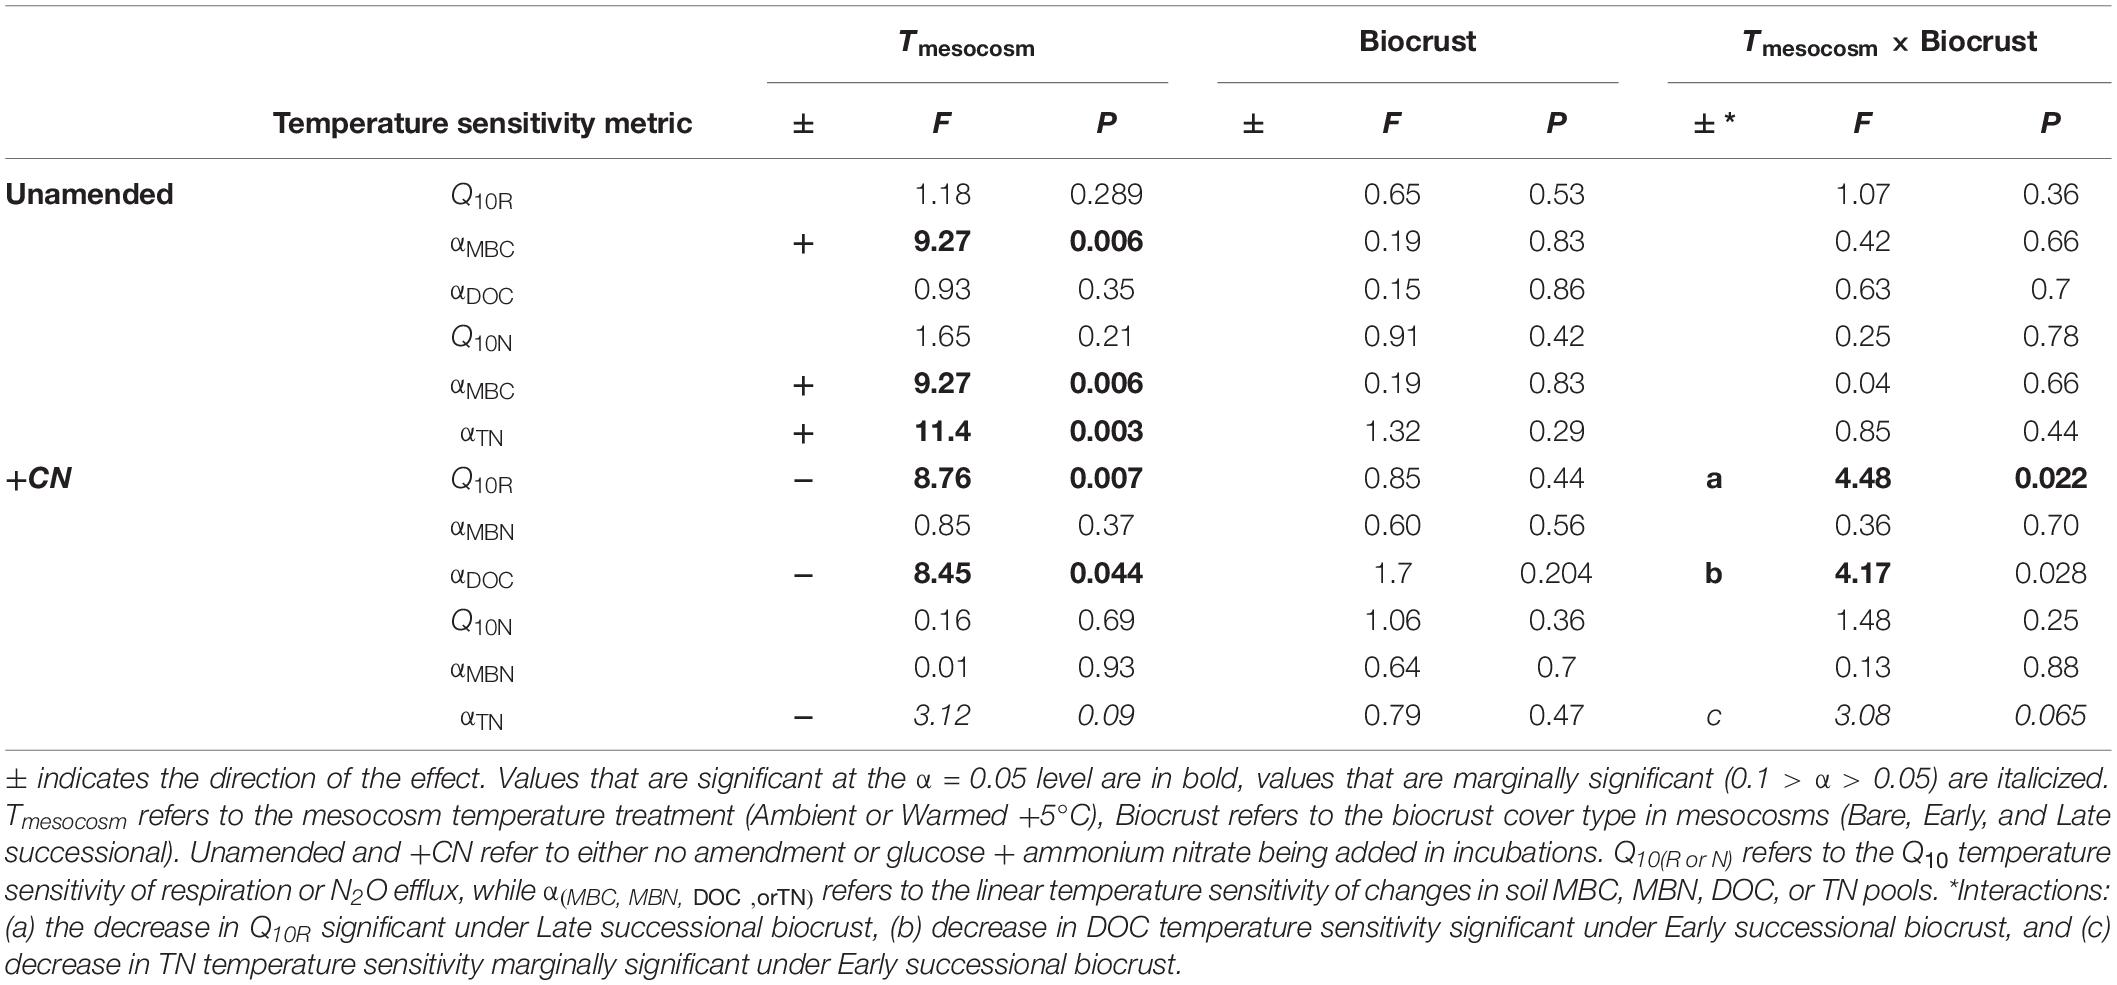
Table 4. ANOVA table for temperature sensitivity of soil CO2 and N2O fluxes and changes in C and N pools during incubations.
Discussion
Overall Findings Related to Hypotheses
During the mesocosm phase of the study, warming and associated drying significantly reduced both CO2 uptake via photosynthesis and loss via respiration, driving an overall negative C balance and resulting in C starvation, especially for Late successional biocrusts (Tucker et al., 2019). Here we used a set of follow-up soil incubations to determine how these effects shape key soil biogeochemical fluxes and pools by applying a range of incubation temperatures and C and N substrates (Figure 1). Interestingly, the prior biocrust cover type (Bare, Early successional, and Late successional; as experienced during the Mesocosm phase; Figure 1) and the prior temperature regime (Ambient vs. Warmed) remained significantly related to soil respiration and N2O efflux rates in soil collected from beneath the biocrust even after these past treatments were removed, as did the temperature sensitivity of these fluxes. These effects were modest when compared with the effect of soil incubation temperature, or the addition of C (as glucose) and N (as ammonium nitrate), however, the residual effects of biocrust cover and temperature treatment in the mesocosm did interact with the incubation treatments in ways that help us consider how shifting environments could affect biogeochemical cycles in drylands. Overall, past mesocosm warming reduced both the magnitude and the temperature sensitivity of soil heterotrophic C and N cycling. Late successional biocrust increased C and N pools and fluxes, yet the magnitude of the negative mesocosm warming effect was also greatest beneath Late successional biocrust. Thus, the strongly negative impacts on biocrusts of the warming and watering treatment during the mesocosm phase resulted in a reduced capacity for metabolic activity of a resource-limited soil microbial biomass. These results are consistent with observations of reduced CO2 cycling by Late biocrusts in response to warming (Darrouzet-Nardi et al., 2015, 2018; Tucker et al., 2019), and reduction of soil and biocrust function in response to warming or altered precipitation observed at the field site from which these soils and biocrusts originated (Reed et al., 2012; Zelikova et al., 2012; Ferrenberg et al., 2015).
Mechanisms Underlying C Cycle Response
The observed responses of the soil heterotrophic C cycle during the soil incubations reflect patterns of CO2 exchange observed in the greenhouse over the preceding 87-day mesocosm phase (Tucker et al., 2019), when both gross primary production and respiration were inhibited by warming, especially in the Late successional biocrust. Under Ambient conditions, Late successional biocrust mesocosms exhibited a shift to net uptake of CO2 1 month prior to the end of the mesocosm phase, while Bare soil and Early successional mesocosms, as well as all Warmed mesocosms, continued to experience net CO2 loss (Tucker et al., 2019). We hypothesized that Late successional biocrust would generate higher rates of heterotrophic soil respiration and larger soil C pools, but that these effects would be diminished under warming. Overall, later successional biocrusts with higher primary productivity would be expected to result in a larger and more active soil heterotrophic community, as was observed. Conversely, the dampened CO2 exchange that occurred with warming was associated with lower microbial biomass C, a reduced extractable soil C pool, lower respiration rates, and lower temperature sensitivity of respiration. Importantly, these reductions were not simply a function of reduced soil C availability and quality; the overall response of C pools and fluxes to incubation temperature was mostly evident under the +CN treatment (Figure 6). Thus, in contrast to our hypothesis, the data suggest these patterns were not directly driven by C limitation resulting from inhibited Late successional biocrust productivity. This suggests that subsequent C inputs into the system would have different fates depending on how warming had affected the soil heterotrophic community. These results align with those seen in other ecosystems (Bradford, 2013), and fit within the context of climate change representing a novel effect for biocrusts and the soil beneath them in the dryland biome. Taken together, the data support an emerging understanding of temperature adaptation across dryland ecosystems (Dacal et al., 2019).
In incubations where no amendment C and N was added, CO2 fluxes were very low and were less sensitive to changes in temperature, indicating that soil heterotrophs were essentially C and/or N-limited, even under Late successional biocrusts, which is consistent with work done at a nearby site (Schaeffer and Evans, 2005). Nevertheless, beneath Late successional biocrusts the soil microbial biomass was larger, more temperature sensitive, and respired at higher rates. We suggest this pattern is linked to Late successional biocrusts providing more substrate throughout the mesocosm phase, given their higher rates of photosynthesis (Tucker et al., 2019). However, this result appears to present a paradox as, during the incubations, soil C cycling appeared very low and minimally responsive to temperature across all biocrust levels in the absence of added C and N. It seems likely that soil microbes rapidly processed the small inputs of C and N derived from biocrust throughout the mesocosm phase, such that, regardless of the biocrust successional state, the soil microbial community persistently depleted C and N inputs. Nonetheless, the microbial community from beneath Late successional biocrusts was able to respond opportunistically to increased resource availability more than were the soil microbes growing beneath Early successional biocrust or Bare soil.
The reduction in temperature sensitivity is consistent with observations of thermal acclimation (e.g., Tucker et al., 2013) or adaptation (e.g., Dacal et al., 2019) in other studies, but we suggest that a different mechanism caused the observed response. Because this pattern was most apparent in the +CN incubations, the data suggest the responses are not a direct function of substrate availability at the moment of measurement, but rather of cumulative substrate availability, which would support a more active or larger opportunistic microbial system to process resources when they do arrive. It is also possible that the physiology of soil respiration changed in response to warming in a way that induced this acclimation-like response (Luo et al., 2001; Tucker et al., 2013), but in this study we did not measure mass-specific respiration, C-use efficiency, or turnover rates in a way that could address this question (e.g., Walker et al., 2018). It is worth noting that microbial biomass decreased in response to increased temperatures in both the mesocosm and incubation phases of this study. Furthermore, microbial biomass in soils from previously warmed mesocosms declined at a reduced rate under higher incubation temperatures compared to biomass in soils from the ambient temperature mesocosms. There are multiple possible explanations of this response, with one of the simplest being that we have observed different phases of an exponential decay curve. Alternatively, the microbial biomass grown under warmed conditions may have a higher temperature optimum for growth and thus experience fewer negative effects under the higher incubation temperatures (Lipson, 2015). Deciding among these potential mechanisms, or others not considered here, remains a topic in need of further study.
Mechanisms Underlying N Cycle Response
Nitrogen cycling may represent a critical biotic feedback to anthropogenic disturbances in drylands (Schlesinger et al., 1990; Reed et al., 2012). In this study, soil N varied in response to warming and biocrust successional state in ways that may have important implications for dryland responses to future climate change. After the mesocosm phase, soil microbial biomass N concentrations were highest beneath Late successional biocrust but, in contrast with our hypothesis that warming-induced inhibition of Late successional biocrust would reduce microbial N, microbial N concentrations were not reduced by warming. Additionally, total extractable N was highest in Late successional biocrust, and actually increased with mesocosm warming, again contrasting with our hypothesis that soil N would be lost due to warming. Previous work has demonstrated that biocrusts can be a significant source of N to microbes in the soil immediately below the crust (Johnson et al., 2007) and that climate change manipulations can drastically change the quantity and composition of soil N beneath biocrusts (Reed et al., 2012) partly as a function of altered biocrust composition and cover, and presumably changes to new N inputs by biocrusts. During the incubation phase, MBN in the no-amendment treatment was resistant to incubation temperature and not different among mesocosm treatments; the differences among mesocosm treatment levels observed initially were not evident after a 48-h incubation. However, the change in the MBN pool was less sensitive to temperature in the soils that were Warmed during the mesocosm phase compared to the Ambient soils. This result is similar to what was observed with regard to microbial biomass C. Interestingly, soil extractable N increased with warming in the soils to which no amendment had been added, similar to the increase observed in response to mesocosm warming. This was the only soil pool of C or N that increased with warming, and the increase may have been due to the mineralization of the microbial biomass (Figure 5).
Gaseous loss of N to the atmosphere is the principal pathway of soil N loss in generally N-limited dryland ecosystems (Peterjohn and Schlesinger, 1990; Schlesinger et al., 1990; Hooper and Johnson, 1999; McCalley and Sparks, 2009; Liu D. et al., 2017). The increased cumulative flux and temperature sensitivity of N2O emissions we observed when glucose and ammonium nitrate were added to the soil is in line with other studies (e.g., Morley and Baggs, 2010). N2O emissions from soil occurs via a wide range of biotic pathways, although denitrification is the dominant pathway in most systems (Butterbach-Bahl et al., 2013). N2O emissions in soils to which no glucose and ammonium nitrate were added were negligible, yet the soil microbial community was able to respond rapidly (<24 h) to these inputs. The amount of N emitted as N2O (at most 0.5 μg N g dry soil–1) from the +CN treatment was trivial compared to the amount of N added (1.5 mg N g dry soil–1), but when compared to the much smaller pool of extractable N (∼2–4 μg N g dry soil–1) in the initial samples, this flux may represent a substantial potential loss pathway from this ecosystem under the right conditions (Eberwein et al., 2020). This result may partially help to explain the observation that repeated addition of ammonium nitrate over multiple years had minimal impact on the soil microbial community and soil N pools at a nearby site (McHugh et al., 2017).
Conclusion: Consequences for Ecosystem Function in Response to Disturbance and Climate Change
The suite of soil characteristics that changed with warming during an 87-day greenhouse mesocosm experiment induced a reduction of the magnitude and temperature sensitivity of heterotrophic soil C and N cycling, which may signal significant changes to future ecosystem function. Late successional biocrusts, which under ambient temperatures enhanced soil C and N cycling relative to Early successional biocrusts and Bare soil, exhibited the most negative response to warming. Experimental and observational evidence, although from a limited number of sites, suggests that the moss-lichen community composing late successional biocrust is highly vulnerable to warming (Ferrenberg et al., 2015; Maestre et al., 2015; Reed et al., 2016; Mallen-Cooper et al., 2018). Overall then, we might predict a dampened soil C and N cycle in response to warming over time, which would be likely to affect broader ecosystem functions such as plant growth, water retention in soils, as well as influence feedbacks between these soils and the broader climate system. Warming during the 87-day mesocosm phase resulted in reduced magnitude and temperature sensitivity of CO2 and N2O emissions from soil during the incubation phase, even in the presence of excess substrate availability. This result likely indicates a reduced capacity for metabolic activity of a resource-limited soil microbial biomass, consistent with the observation of depressed soil C and N cycling in response to warming over time. It is worth noting that soil dissolved N actually increased with warming under Late successional biocrust during the mesocosm phase, likely due to increased mineralization and reduced microbial biomass N uptake, which could in the short term shift N from soils to plants, but could also result in long-term reductions in total soil N storage. While the results described here are from a highly controlled mesocosm and incubation experiment, they nonetheless support a growing understanding, from multiple lines of evidence, that the contribution of Late successional biocrusts to soil ecological functions is reduced by climate warming (Elbert et al., 2012; Reed et al., 2012; Maestre et al., 2013; Liu Y. R. et al., 2017; Ouyang and Hu, 2017; Darrouzet-Nardi et al., 2018; Rodriguez-Caballero et al., 2018; Eldridge and Delgado-Baquerizo, 2019). These results have broader implications for land management across the study region: as ecosystems are increasingly under pressure due to a changing climate, actions that degrade otherwise intact biocrust communities may accelerate loss of this important component of the soil ecosystem at a time when it is already vulnerable (Weber et al., 2016a), and thus further diminish soil C and N cycling across the region.
Data Availability Statement
The datasets generated for this study are available on request to the corresponding author.
Author Contributions
CT, SF, and SR designed the study. CT and SF conducted the experiments. CT conducted data analysis. CT, SF, and SR wrote the manuscript. All authors contributed to the article and approved the submitted version.
Funding
This material is based upon work supported by United States Department of Energy Office of Science, Office of Biological and Environmental Research Terrestrial Ecosystem Sciences Program, under Award Number DE-SC-0008168 and the USGS Ecosystems and Land Change Science Mission Areas.
Conflict of Interest
The authors declare that the research was conducted in the absence of any commercial or financial relationships that could be construed as a potential conflict of interest.
Acknowledgments
We are grateful to the many USGS technicians who worked on this project, including Hilda Smith, who ran the gas chromatograph, Armin Howell and Robin Reibold who assisted with laboratory incubations, and Rose Egelhoff and Paige Austin who assisted with the greenhouse phase and soil extraction phase of the study. Any use of trade, product, or firm names is for descriptive purposes only and does not imply endorsement by the United States Government.
References
Abed, R. M. M., Lam, P., de Beer, D., and Stief, P. (2013). High rates of denitrification and nitrous oxide emission in arid biological soil crusts from the Sultanate of Oman. ISME J. 7, 1862–1875. doi: 10.1038/ismej.2013.55
Barger, N. N., Belnap, J., Ojima, D. S., and Mosier, A. (2005). NO gas loss from biologically crusted soils in Canyonlands National Park, Utah. Biogeochemistry 75, 373–391. doi: 10.1007/s10533-005-1378-9
Barger, N. N., Weber, B., Garcia-Pichel, F., Zaady, E., and Belnap, J. (2016). “Patterns and controls on nitrogen cycling of biological soil crusts,” in Biological Soil Crusts: An Organizing Principle in Drylands, eds B. Weber, B. Budel, and J. Belnap (Cham: Springer), 257–285. doi: 10.1007/978-3-319-30214-0_14
Belnap, J., Weber, B., and Budel, B. (2016). Biological Soil Crusts as an Organizing Principle in Drylands. Cham: Springer.
Beraldi-Campesi, H., Hartnett, H. E., Anbar, A., Gordon, G. W., and Garcia-Pichel, F. (2009). Effect of biological soil crusts on soil elemental concentrations: implications for biogeochemistry and as traceable biosignatures of ancient life on land. Geobiology 7, 348–359. doi: 10.1111/j.1472-4669.2009.00204.x
Bowker, M. A., Belnap, J., Büdel, B., Sannier, C., Pietrasiak, N., Eldridge, D. J., et al. (2016). “Controls on distribution patterns of biological soil crusts at micro-to global scales,” in Biological Soil Crusts: An Organizing Principle in Drylands, eds B. Weber et al. (Cham: Springer), 173–197. doi: 10.1007/978-3-319-30214-0_10
Bradford, M. A. (2013). Thermal adaptation of decomposer communities in warming soils. Front. Microbiol. 4:333. doi: 10.3389/fmicb.2013.00333
Butterbach-Bahl, K., Baggs, E. M., Dannenmann, M., Kiese, R., and Zechmeister-Boltenstern, S. (2013). Nitrous oxide emissions from soils: how well do we understand the processes and their controls? Philos. Trans. R. Soc. B Biol. Sci. 368:20130122. doi: 10.1098/rstb.2013.0122
Castillo-Monroy, A. P., Bowker, M. A., Maestre, F. T., Rodriguez-Echeverria, S., Martinez, I., Barraza-Zepeda, C. E., et al. (2011). Relationships between biological soil crusts, bacterial diversity and abundance, and ecosystem functioning: insights from a semi-arid Mediterranean environment. J. Veg. Sci. 22, 165–174. doi: 10.1111/j.1654-1103.2010.01236.x
Castillo-Monroy, A. P., Maestre, F. T., Delgado-Baquerizo, M., and Gallardo, A. (2010). Biological soil crusts modulate nitrogen availability in semi-arid ecosystems: insights from a Mediterranean grassland. Plant Soil 333, 21–34. doi: 10.1007/s11104-009-0276-7
Dacal, M., Bradford, M. A., Plaza, C., Maestre, F. T., and García-Palacios, P. (2019). Soil microbial respiration adapts to ambient temperature in global drylands. Nat. Ecol. Evol. 388, 232–238. doi: 10.1038/s41559-018-0770-5
Darrouzet-Nardi, A., Reed, S. C., Grote, E. E., and Belnap, J. (2015). Observations of net soil exchange of CO2 in a dryland show experimental warming increases carbon losses in biocrust soils. Biogeochemistry 126, 363–378. doi: 10.1007/s10533-015-0163-7
Darrouzet-Nardi, A., Reed, S. C., Grote, E. E., and Belnap, J. (2018). Patterns of longer-term climate change effects on CO2 efflux from biocrusted soils differ from those observed in the short term. Biogeosciences 15, 4561–4573. doi: 10.5194/bg-15-4561-2018
Delgado-Baquerizo, M., Maestre, F. T., and Gallardo, A. (2013). Biological soil crusts increase the resistance of soil nitrogen dynamics to changes in temperatures in a semi-arid ecosystem. Plant Soil 366, 35–47. doi: 10.1007/s11104-012-1404-3
Eberwein, J. R., Homyak, P. M., Carey, C. J., Aronson, E. L., and Jenerette, G. D. (2020). Large nitrogen oxide emission pulses from desert soils and associated microbiomes. Biogeochemistry 149, 239–250. doi: 10.1007/s10533-020-00672-9
Elbert, W., Weber, B., Burrows, S., Steinkamp, J., Budel, B., Andreae, M. O., et al. (2012). Contribution of cryptogamic covers to the global cycles of carbon and nitrogen. Nat. Geosci. 5, 459–462. doi: 10.1038/ngeo1486
Eldridge, D. J., and Delgado-Baquerizo, M. (2019). The influence of climatic legacies on the distribution of dryland biocrust communities. Glob. Chang Biol. 25, 327–336. doi: 10.1111/gcb.14506
Eldridge, D. J., Reed, S., Travers, S. K., Bowker, M. A., Maestre, F. T., Ding, J., et al. (2020). The pervasive and multifaceted influence of biocrusts on water in the world’s drylands. Glob. Change Biol. 26, 6003–6014. doi: 10.1111/gcb.15232
Escolar, C., Martinez, I., Bowker, M. A., and Maestre, F. T. (2012). Warming reduces the growth and diversity of biological soil crusts in a semi-arid environment: implications for ecosystem structure and functioning. Philos. Trans. R. Soc. B Biol. Sci. 367, 3087–3099. doi: 10.1098/rstb.2011.0344
Evans, R. D., and Ehleringer, J. R. (1993). A break in the nitrogen cycle in aridlands? Evidence from δp15N of soils. Oecologia 94, 314–317. doi: 10.1007/bf00317104
Ferrenberg, S., Faist, A. M., Howell, A., and Reed, S. C. (2018). Biocrusts enhance soil fertility and Bromus tectorum growth, and interact with warming to influence germination. Plant Soil 429, 77–90. doi: 10.1007/s11104-017-3525-1
Ferrenberg, S., Reed, S. C., and Belnap, J. (2015). Climate change and physical disturbance cause similar community shifts in biological soil crusts. Proc. Natl. Acad. Sci. U.S.A. 112, 12116–12121. doi: 10.1073/pnas.1509150112
Gao, L., Bowker, M. A., Sun, H., Zhao, J., and Zhao, Y. (2020). Linkages between biocrust development and water erosion and implications for erosion model implementation. Geoderma 357:113973. doi: 10.1016/j.geoderma.2019.113973
Guo, Y., Zhao, H., Zuo, X., Drake, S., and Zhao, X. (2008). Biological soil crust development and its topsoil properties in the process of dune stabilization, Inner Mongolia, China. Environ. Geol. 54, 653–662. doi: 10.1007/s00254-007-1130-y
Havrilla, C. A., Chaudhary, V. B., Ferrenberg, S., Antoninka, A. J., Belnap, J., Bowker, M. A., et al. (2019). Towards a predictive framework for biocrust mediation of plant performance: A meta-analysis. J. Ecol. 107, 2789–2807. doi: 10.1111/1365-2745.13269
Hawkes, C. V. (2003). Nitrogen cycling mediated by biological soil crusts and arbuscular mycorrhizal fungi. Ecology 84, 1553–1562. doi: 10.1890/0012-9658(2003)084%5B1553:ncmbbs%5D2.0.co;2
Hooper, D. U., and Johnson, L. (1999). Nitrogen limitation in dryland ecosystems: responses to geographical and temporal variation in precipitation. Biogeochemistry 46, 247–293. doi: 10.1007/978-94-011-4645-6_12
Housman, D. C., Powers, H. H., Collins, A. D., and Belnap, J. (2006). Carbon and nitrogen fixation differ between successional stages of biological soil crusts in the Colorado Plateau and Chihuahuan Desert. J. Arid Environ. 66, 620–634. doi: 10.1016/j.jaridenv.2005.11.014
IPCC (2013). Climate Change 2013: The Physical Science Basis. Contribution of Working Group I to the Fifth Assessment Report of the Intergovernmental Panel on Climate Change. Cambridge: Cambridge University Press.
Johnson, S. L., Neuer, S., and Garcia-Pichel, F. (2007). Export of nitrogenous compounds due to incomplete cycling within biological soil crusts of arid lands. Environ. Microbiol. 9, 680–689. doi: 10.1111/j.1462-2920.2006.01187.x
Lan, S. B., Wu, L., Zhang, D. L., and Hu, C. X. (2013). Assessing Level of Development and Successional Stages in Biological Soil Crusts with Biological Indicators. Microb. Ecol. 66, 394–403. doi: 10.1007/s00248-013-0191-6
Langhans, T. M., Storm, C., and Schwabe, A. (2010). Regeneration processes of biological soil crusts, macro-cryptogams and vascular plant species after fine-scale disturbance in a temperate region: recolonization or successional replacement? Flora 205, 46–60. doi: 10.1016/j.flora.2008.12.001
Lipson, D. A. (2015). The complex relationship between microbial growth rate and yield and its implications for ecosystem processes. Front. Microbiol. 6:615. doi: 10.3389/fmicb.2015.00615
Liu, D., Zhu, W., Wang, X., Pan, Y., Wang, C., Xi, D., et al. (2017). Abiotic versus biotic controls on soil nitrogen cycling in drylands along a 3200 km transect. Biogeosciences 14, 989–1001. doi: 10.5194/bg-14-989-2017
Liu, Y. R., Delgado-Baquerizo, M., Trivedi, P., He, J. Z., Wang, J. T., and Singh, B. K. (2017). Identity of biocrust species and microbial communities drive the response of soil multifunctionality to simulated global change. Soil Biol. Biochem. 107, 208–217. doi: 10.1016/j.soilbio.2016.12.003
Luo, Y., Wan, S., Hui, D., and Wallace, L. L. (2001). Acclimatization of soil respiration to warming in a tall grass prairie. Nature 413, 622–625. doi: 10.1038/35098065
Maestre, F. T., Escolar, C., Bardgett, R. D., Dungait, J. A., Gozalo, B., and Ochoa, V. (2015). Warming reduces the cover and diversity of biocrust-forming mosses and lichens, and increases the physiological stress of soil microbial communities in a semi-arid Pinus halepensis plantation. Front. Microbiol. 6:865. doi: 10.3389/fmicb.2015.00865
Maestre, F. T., Escolar, C., de Guevara, M. L., Quero, J. L., Lázaro, R., Delgado-Baquerizo, M., et al. (2013). Changes in biocrust cover drive carbon cycle responses to climate change in drylands. Glob. Change Biol. 19, 3835–3847. doi: 10.1111/gcb.12306
Mallen-Cooper, M., Eldridge, D. J., and Delgado-Baquerizo, M. (2018). Livestock grazing and aridity reduce the functional diversity of biocrusts. Plant Soil 429, 175–185. doi: 10.1007/s11104-017-3388-5
McCalley, C. K., and Sparks, J. P. (2009). Abiotic gas formation drives nitrogen loss from a desert ecosystem. Science 326, 837–840. doi: 10.1126/science.1178984
McHugh, T. A., Morrissey, E. M., Mueller, R. C., Gallegos-Graves, L. V., Kuske, C. R., and Reed, S. C. (2017). Bacterial, fungal, and plant communities exhibit no biomass or compositional response to two years of simulated nitrogen deposition in a semiarid grassland. Environ. Microbiol. 19, 1600–1611. doi: 10.1111/1462-2920.13678
Morley, N., and Baggs, E. (2010). Carbon and oxygen controls on N2O and N2 production during nitrate reduction. Soil Biol. Biochem. 42, 1864–1871. doi: 10.1016/j.soilbio.2010.07.008
Ouyang, H., and Hu, C. (2017). Insight into climate change from the carbon exchange of biocrusts utilizing non-rainfall water. Sci. Rep. 7, 1–13. doi: 10.1007/978-3-642-40455-9_15-1
Peterjohn, W. T., and Schlesinger, W. H. (1990). Nitrogen loss from deserts in the southwestern United States. Biogeochemistry 10, 67–79.
Pietrasiak, N., Regus, J. U., Johansen, J. R., Lam, D., Sachs, J. L., and Santiago, L. S. (2013). Biological soil crust community types differ in key ecological functions. Soil Biol. Biochem. 65, 168–171. doi: 10.1016/j.soilbio.2013.05.011
Post, W. M., Pastor, J., Zinke, P. J., and Stangenberger, A. G. (1985). Global patterns of soil nitrogen storage. Nature 317, 613–616. doi: 10.1038/317613a0
Read, C. F., Elith, J., and Vesk, P. A. (2016). Testing a model of biological soil crust succession. J. Veg. Sci. 27, 176–186. doi: 10.1111/jvs.12332
Reed, S. C., Coe, K. K., Sparks, J. P., Housman, D. C., Zelikova, T. J., and Belnap, J. (2012). Changes to dryland rainfall result in rapid moss mortality and altered soil fertility. Nat. Clim. Change 2, 752–755. doi: 10.1038/nclimate1596
Reed, S. C., Maestre, F. T., Ochoa-Hueso, R., Kuske, C. R., Darrouzet-Nardi, A., Oliver, M., et al. (2016). “Biocrusts in the Context of Global Change,” in Biological Soil Crusts: An Organizing Principle in Drylands, eds B. Weber, B. Büdel, and J. Belnap (Cham: Springer), 451–476.
Rodriguez-Caballero, E., Belnap, J., Büdel, B., Crutzen, P. J., Andreae, M. O., Pöschl, U., et al. (2018). Dryland photoautotrophic soil surface communities endangered by global change. Nat. Geosci. 11, 185–189. doi: 10.1038/s41561-018-0072-1
Schaeffer, S. M., and Evans, R. (2005). Pulse additions of soil carbon and nitrogen affect soil nitrogen dynamics in an arid Colorado Plateau shrubland. Oecologia 145, 425–433. doi: 10.1007/s00442-005-0140-2
Schlaepfer, D., Bradford, J., Lauenroth, W., Seth, M. M., Sonja, A. H., Scott, D. W., et al. (2017). Climate change reduces extent of temperate drylands and intensifies drought in deep soils. Nat. Commun. 8:14196.
Schlesinger, W. H., Reynolds, J. F., Cunningham, G. L., Huenneke, L. F., Jarrell, W. M., Virginia, R. A., et al. (1990). Biological feedbacks in global desertification. Science 247, 1043–1048. doi: 10.1126/science.247.4946.1043
Strauss, S. L., Day, T. A., and Garcia-Pichel, F. (2012). Nitrogen cycling in desert biological soil crusts across biogeographic regions in the Southwestern United States. Biogeochemistry 108, 171–182. doi: 10.1007/s10533-011-9587-x
Swenson, T. L., Karaoz, U., Swenson, J. M., Bowen, B. P., and Northen, T. R. (2018). Linking soil biology and chemistry in biological soil crust using isolate exometabolomics. Nat. Commun. 9:19.
Torres-Cruz, T. J., Howell, A. J., Reibold, R. H., McHugh, T. A., Eickhoff, M. A., and Reed, S. C. (2018). Species-specific nitrogenase activity in lichen-dominated biological soil crusts from the Colorado Plateau, USA. Plant Soil 429, 113–125. doi: 10.1007/s11104-018-3580-2
Tucker, C. L., Bell, J., Pendall, E., and Ogle, K. (2013). Does declining carbon-use efficiency explain thermal acclimation of soil respiration with warming? Glob. Change Biol. 19, 252–263. doi: 10.1111/gcb.12036
Tucker, C. L., Ferrenberg, S., and Reed, S. C. (2019). Climatic sensitivity of Dryland Soil CO2 fluxes differs dramatically with biological soil crust successional state. Ecosystems 22, 15–32. doi: 10.1007/s10021-018-0250-4
Vaculik, A., Kounda-Kiki, C., Sarthou, C., and Ponge, J. F. (2004). Soil invertebrate activity in biological crusts on tropical inselbergs. Eur. J. Soil Sci. 55, 539–549. doi: 10.1111/j.1365-2389.2004.00615.x
Vance, E. D., Brookes, P. C., and Jenkinson, D. S. (1987). An extraction method for measuring soil microbial biomass C. Soil Biol. Biochem. 19, 703–707. doi: 10.1016/0038-0717(87)90052-6
Voroney, R. P., Brookes, P. C., and Beyaert, R. P. (2008). “Soil Microbial Biomass C, N, P, and S,” in Soil Sampling and Methods of Analysis, 2 Edn, eds M. R. Carter and E. G. Gregorich (Boca Raton, FL: CRC Press).
Walker, T. W. N., Kaiser, C., Strasser, F., Herbold, C. W., Leblans, N. I. W., Woebken, D., et al. (2018). Microbial temperature sensitivity and biomass change explain soil carbon loss with warming. Nat. Clim. Change 8, 885–889. doi: 10.1038/s41558-018-0259-x
Weber, B., Bowker, M., Zhang, Y., and Belnap, J. (2016a). “Natural recovery of biological soil crusts after disturbance, in Biological Soil Crusts: An Organizing Principle in Drylands, eds B. Weber, B. Budel, and J. Belnap (Cham: Springer), 479–498. doi: 10.1007/978-3-319-30214-0_23
Weber, B., Budel, B., and Belnap, J. (eds) (2016b). “Biological soil crusts: an organizing principle in Drylands,” in Ecological Studies (Cham: Springer). doi: 10.1007/978-3-319-30214-0
Weber, B., Dianming, W., Alexandra, T., Nina, R., Rodriguez-Caballero, E., Joerg, S., et al. (2015). Biological soil crusts accelerate the nitrogen cycle through large NO and HONO emissions in drylands. Proc. Natl. Acad. Sci. U.S.A. 112, 15384–15389. doi: 10.1073/pnas.1515818112
Yeager, C. M., Kornosky, J. L., Housman, D. C., Grote, E. E., Belnap, J., and Kuske, C. R. (2004). Diazotrophic community structure and function in two successional stages of biological soil crusts from the Colorado plateau and Chihuahuan desert. Appl. Environ. Microbiol. 70, 973–983. doi: 10.1128/aem.70.2.973-983.2004
Zelikova, T. J., Housman, D. C., Grote, E. E., Neher, D. A., and Belnap, J. (2012). Warming and increased precipitation frequency on the Colorado Plateau: implications for biological soil crusts and soil processes. Plant Soil 355, 265–282. doi: 10.1007/s11104-011-1097-z
Keywords: biological soil crust, climate change, soil respiration, N2O emission, microbial biomass, carbon, nitrogen, temperature sensitivity
Citation: Tucker C, Ferrenberg S and Reed SC (2020) Modest Residual Effects of Short-Term Warming, Altered Hydration, and Biocrust Successional State on Dryland Soil Heterotrophic Carbon and Nitrogen Cycling. Front. Ecol. Evol. 8:467157. doi: 10.3389/fevo.2020.467157
Received: 20 April 2019; Accepted: 29 September 2020;
Published: 28 October 2020.
Edited by:
Vincent John Martin Noah Linus Felde, University of Kassel, GermanyReviewed by:
Kusum J. Naithani, University of Arkansas, United StatesMaik Veste, Brandenburg University of Technology Cottbus-Senftenberg, Germany
Copyright © 2020 Tucker, Ferrenberg and Reed. This is an open-access article distributed under the terms of the Creative Commons Attribution License (CC BY). The use, distribution or reproduction in other forums is permitted, provided the original author(s) and the copyright owner(s) are credited and that the original publication in this journal is cited, in accordance with accepted academic practice. No use, distribution or reproduction is permitted which does not comply with these terms.
*Correspondence: Colin Tucker, Y29saW4udHVja2VyQHVzZGEuZ292