 Mariana Nagy-Reis1*†
 Melanie Dickie1*†
 Péter Sólymos2,3
 Sophie L. Gilbert4
 Craig A. DeMars1
 Robert Serrouya1
 Stan Boutin1,2
- 1Caribou Monitoring Unit, Alberta Biodiversity Monitoring Institute, University of Alberta, Edmonton, AB, Canada
- 2Department of Biological Sciences, University of Alberta, Edmonton, AB, Canada
- 3Science Centre, Alberta Biodiversity Monitoring Institute, University of Alberta, Edmonton, AB, Canada
- 4Department of Fish & Wildlife Sciences, University of Idaho, Moscow, ID, United States
A recurring challenge for resource managers and decision makers is quantifying the trade-offs associated with alternative recovery actions for threatened species. Structured decision-making approaches can help evaluate such complex problems by formalizing objectives and constraints into functions that quantify the benefits and costs associated with each action. Yet, many of the scientific tools necessary to implement structured decision making require extensive literature review and often involve complex algorithms that make them inaccessible to managers. To address these issues, we integrated available information and developed a decision-support tool that managers can readily use to compare costs and benefits associated with alternative recovery actions for threatened species. Our software can be used to quantitatively estimate and compare the costs and demographic benefits of recovery actions for an iconic threatened species, woodland caribou (Rangifer tarandus caribou). While we use caribou as a case study, our approach to developing this management tool is transferable to other threatened taxa. The tool consists of a generalized matrix population model that is parametrized based on information from the published literature or ongoing experiments. Users can input population parameters (e.g., population size and survival rates) or choose from pre-set caribou subpopulations to estimate changes to populations from implementing recovery actions. The tool estimates the trade-offs associated with seven alternative recovery actions: linear feature restoration (LFR), linear feature deactivation (LFD), maternal penning (MP), conservation breeding (CB), predator exclosure (PE), wolf reduction (WR), and moose reduction (MR). We demonstrate our software by comparing recovery actions for the East Side Athabasca River caribou subpopulation and discuss how this tool can be used under a structured decision-making framework. This case study suggests that our open-source tool can be useful to guide wildlife conservation decisions by explicitly estimating costs and benefits associated with recovery actions, which ultimately helps to bridge the gap between management and science via increased accessible application of current knowledge.
Introduction
Over 16,000 animal species are currently at risk of extinction around the globe due to human-related activities (International Union for Conservation of Nature [IUCN], 2020). Despite legal protections and recovery planning, successful re-establishment and recovery of at-risk species remain rare (Boersma et al., 2001; Bottrill et al., 2011; Favaro et al., 2014). A primary challenge to species recovery arises in part from the complexity of evaluating trade-offs across alternative actions, which is a recurring sticking point for wildlife managers and decision makers. A classic trade-off example involves balancing conservation objectives (e.g., maximize species recovery) and cost objectives (e.g., minimize costs), in which decision makers have to evaluate how much one objective can be “given up in order to achieve gains on another objective” (Gregory et al., 2012).
A formal means of understanding such trade-offs is to use structured decision-making (SDM) approaches. The SDM framework explicitly compares the outcomes of alternative actions across a range of relevant dimensions including ecological, social, and economic spheres while building support for implementation via the SDM collaborative process itself (Gregory and Long, 2009; Gregory et al., 2012; Schneider, 2019). Ideally, SDM facilitates optimal solutions by formalizing objectives and constraints into a function that quantifies the trade-offs (e.g., benefits and costs) associated with each action in a transparent manner (Nichols et al., 2014; Bolam et al., 2019; Schneider, 2019). In practice, however, many of the scientific approaches necessary to implement SDM are inaccessible to managers, highlighting the need for tools that can be readily used to evaluate trade-offs associated with recovery actions.
We developed a tool to evaluate alternative recovery actions for threatened species, which could allow for broader implementation of an SDM framework through increased accessibility for managers, stakeholders, and decision makers. Using our software, users can quantify and compare the demographic benefits and financial costs associated with different recovery actions for woodland caribou (Rangifer tarandus caribou). Most woodland caribou populations are considered either Endangered (Committee on the Status of Endangered Wildlife in Canada [COSEWIC], 2014; United States Fish and Wildlife Service, 2019) or Threatened (Schedule 1 of Species at Risk Act; Government of Canada, 2002) and continue to decline across North America (Festa-Bianchet et al., 2011; Hervieux et al., 2013). Population declines are almost certainly a result of apparent competition, a phenomenon that affects many threatened taxa (Roemer et al., 2002; DeCesare et al., 2010) and which can be induced by broad-scale human-related activities. In the case of woodland caribou, human landscape alterations, especially from forestry and agricultural activities, combined with climate warming, have increased the abundance and/or distribution of white-tailed deer (Odocoileus virginianus) and moose (Alces alces) in caribou ranges (Wittmer et al., 2007; Latham et al., 2011; Serrouya et al., 2011; Dawe and Boutin, 2016), which then increases predator density in those areas. The resulting wolf (Canis lupus) predation risk seems to lead to long-term decline of woodland caribou in altered landscapes (Fryxell et al., 2020). Alterations such as linear features (e.g., seismic lines), in particular, further increase predator access to caribou ranges as well as hunting efficacy (Moffatt, 2012; Apps et al., 2013; Dickie et al., 2017; DeMars and Boutin, 2018). These linear features can take decades or longer to recover on their own (van Rensen et al., 2015), so active restoration is advocated as a means of accelerating their recovery.
Because habitat loss is a major cause of population declines and species endangerment (Kerr and Cihlar, 2004; Kerr and Deguise, 2004; Venter et al., 2006), most species-at-risk legislations focus on habitat conservation and restoration as mechanisms for species recovery (Adamowicz, 2016). In addition to such long-term habitat management actions, short-term recovery actions involving predator-prey management (e.g., predator reductions and/or reduction of competitor species) have also been employed across several taxa to halt precipitous population declines (e.g., Tattoni et al., 2006; Smith et al., 2010; Diller et al., 2014). Demographic augmentation efforts also represent an increasingly important response to the extinction crisis and are extensively practiced to re-establish or supplement wild populations globally (Magin et al., 1994).
In the case of woodland caribou, habitat management actions have mostly entailed the restoration (i.e., returning forest cover via silviculture) or deactivation (i.e., reducing predator use and/or speed via physical blocking) of linear features (Bentham and Coupal, 2015; Tattersall et al., 2020). Predator-prey management involves wolf and moose reductions (WR and MR, respectively), which have succeeded in stabilizing or even increasing some caribou populations (Hervieux et al., 2014; Serrouya et al., 2017b, 2019). A demographic augmentation method particularly relevant for caribou recovery is maternal penning (MP), which are small fenced areas (< 10 ha) where pregnant and post-parturient individuals and their calves are housed for the spring to reduce predation risk (Serrouya et al., 2015b; McNay, 2018; Adams et al., 2019). Conservation breeding (CB) programs and predator exclosures (PEs), which are methods widely used for species recovery (Magin et al., 1994; Hayward and Kerley, 2009), have also been considered for caribou (Antoniuk et al., 2012; Serrouya et al., 2015a; Hayek et al., 2016). Contrarily to conservation breeding programs, PEs and other fencing techniques (a.k.a. ‘safe havens’; Ringma et al., 2018) have the potential to achieve conservation at a landscape-level, particularly if they encompass extensive areas that hold large populations (Hayward and Kerley, 2009).
To compare this wide array of options, our software includes two habitat management actions [linear feature restoration (LFR) and linear feature deactivation (LFD)], two predator-prey management actions (WR and MR), and three demographic augmentation actions (MP, CB, and PE; see Figure 1 for conceptual model). Habitat management is intended to address the ultimate cause of population declines while predator-prey management and population augmentation are considered an interim tool to halt precipitous population declines while habitat recovers. The software links recovery actions to demographic benefits and financial costs and can be used to optimize caribou recovery. We believe that some components of this framework are transferable to other mammalian threatened taxa (see section “Conclusion”).
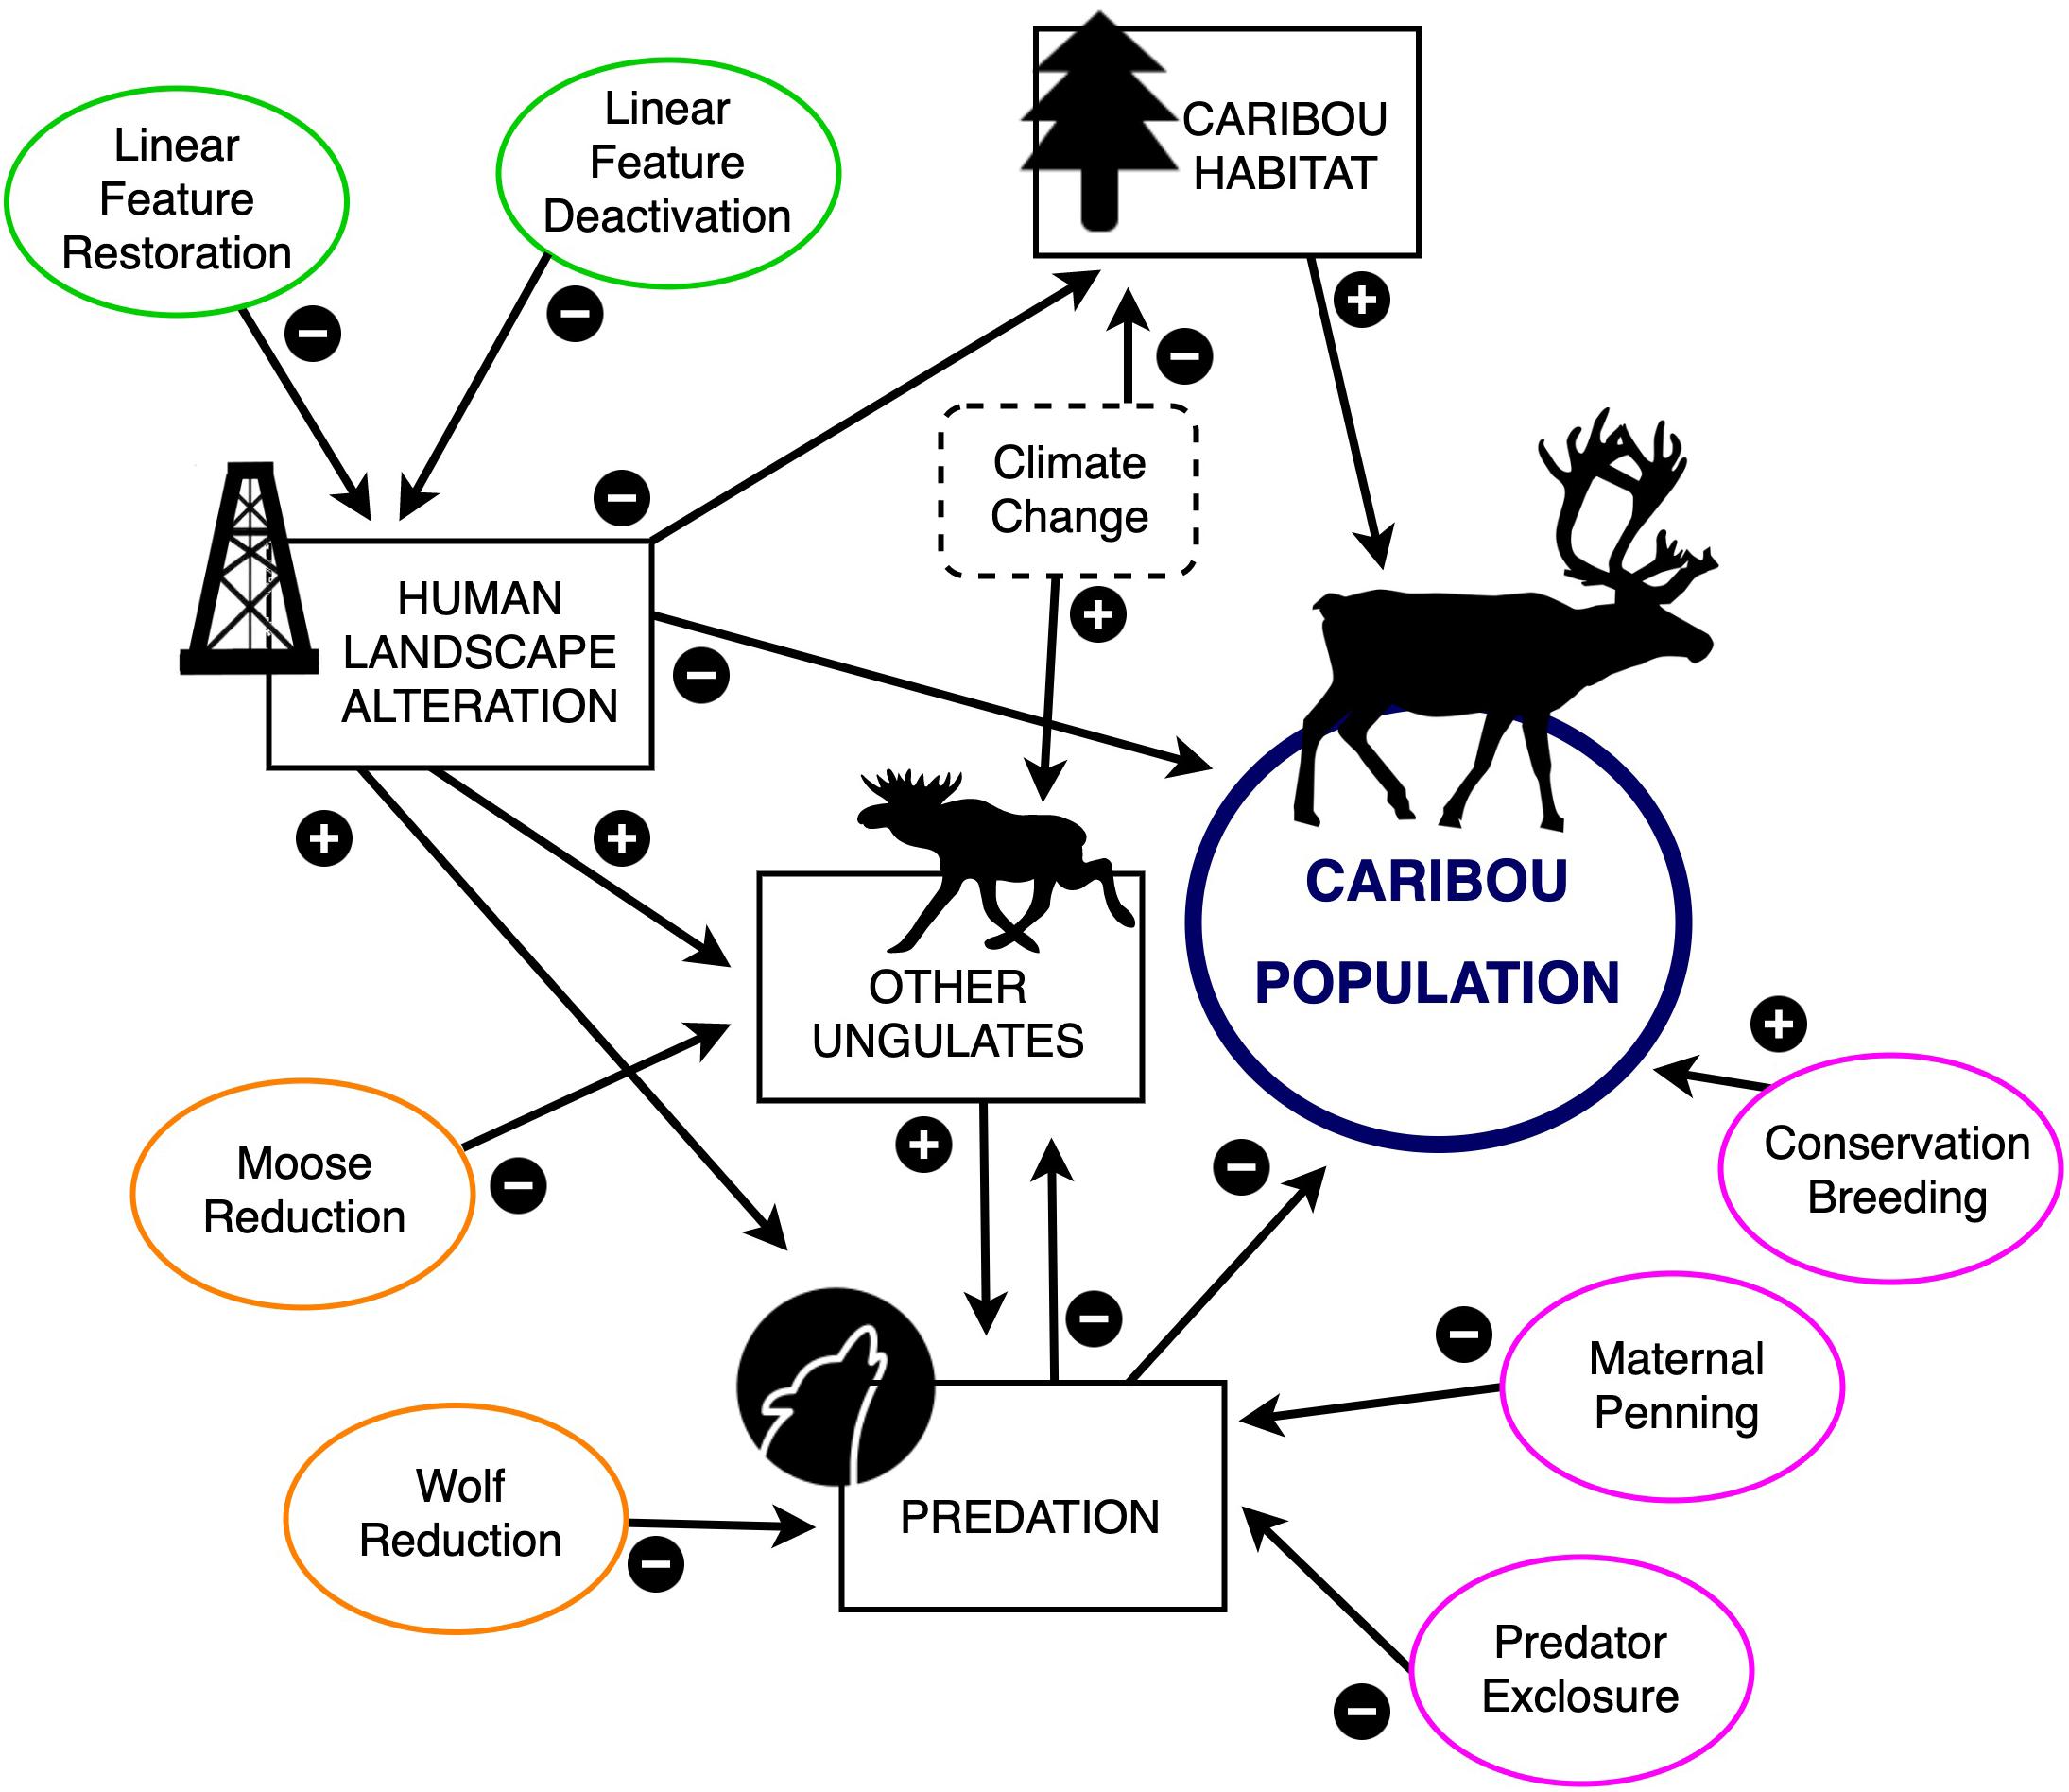
Figure 1. Conceptual model linking caribou populations to alternative recovery actions (green = habitat management actions; pink = demographic augmentation actions; orange = predator-prey population management actions), intermediate factors (rectangles), and stochastic factors (dashed rectangles). Arrows indicate positive (“+”) or negative (“–”) relationships. Demographic benefits and financial costs associated with each recovery action can be calculated using ‘WildLift.’
Software Framework
‘Wildlift’ is an R (R Core Team, 2018) extension package (Solymos et al., 2020) and web application developed using the Shiny framework (Chang et al., 2019) in R. The software allows users to implement a variety of recovery actions, and to estimate the resulting populations over time and associated costs, visualizing their scenario of interest within the applications user interface. The software can be run online1. Alternatively, the package can be installed by running install.packages(‘WildLift’, repos = c(‘http://cran.rstudio.com’, ‘https://ABbiodiversity.github.io/drat/’), dependencies = TRUE) the Shiny app can be then launched by WildLift::run_app(). Instructions about running functions in the command line interface can be found in the help pages [help(package = “WildLift”)].
Population Model
‘WildLift’ estimates population growth rate (λ; Caughley, 1977) using a post-breeding stage-based generalized matrix population model in which λ is the matrix dominant eigenvalue (Caswell, 2001). We considered four stage classes, each being a female stage cohort: calf (0–1 years), yearling (1–2 years), juvenile (2–3 years), and adult (3+ years) females. The model structure is that of a linear matrix population model,
where Nt is a vector containing the number of females in each stage class at time t. This may be written in full detail as
where F is the fecundity (i.e., pregnancy rate) and S is annual survival for each female stage cohort. The subscript t implies that the value of the parameter varies over time.
The model assumes an even sex ratio of birthed calves (0.5) but only tracks the female population. The model also assumes that yearlings, juveniles, and adults survive at the same rate (i.e., Sy = Sj = Sa) but reproduction does not occur until they are 3+ years old. The annual calf survival rate (Sc) is the product of summer calf survival and winter calf survival.
We used a simplified model to facilitate its use by managers to contrast the effectiveness of different recovery actions that manipulate key demographic parameters. Our model did not include demographic or environmental stochasticity, or density dependence due to the increasing complexity of fitting such models coupled with limited data to do so. Recent caribou-based population models have incorporated stochasticity, but trends relative to deterministic projections were unaffected (Serrouya et al., 2015c). Demographic and environmental variation can be accounted for outside of the modeling exercise by including it as part of monitoring operational population management actions (e.g., monitoring weather conditions). Such variation may also be considered in assessing the effectiveness of actions, by acknowledging that stochasticity may in some cases decrease the effectiveness of an action.
Model Parameters
We provide default parameters for wild and treated caribou subpopulations (see Supplementary Tables S1, S2). Alternatively, users can either adjust parameters with interactive sliders or use a drop-down menu to specify that the model uses vital rates recently measured in specific wild caribou subpopulations or select an average subpopulation, which was obtained by averaging the parameters of all subpopulations (Supplementary Table S1). Demographic parameters for treated populations either come from empirical values obtained from recovery projects or were estimated using the best knowledge available (see Supplementary Material for details).
The default starting population is distributed across ages so that it is at a stable age distribution (i.e., the proportion of each population stage class at asymptotic conditions). The default starting population size is set at 100 adult females (i.e., similar in size to many wild woodland caribou subpopulations; Serrouya et al., 2017a) and the default population simulation length is set at 20 years. However, the initial population size can be set up to 1,000 animals and the simulation length up to 50 to facilitate usage for other species.
Estimating Benefits and Costs of Recovery Actions
Demographic benefits are measured by the number of additional individuals produced by each recovery action over “status quo” (i.e., “baseline” population with no action taken) as well as the maximum annual rate of population growth (λ). Economic costs are summarized in 2020 Canadian ($CAD) dollars per individual gained and total cost of the recovery action over the years. Cost components (e.g., initial set up, yearly maintenance, etc.), the intensity of effort associated with each action (e.g., percent of females penned, linear feature length, number of wolves to be removed, etc.), and population parameters can all be adjusted by the user with interactive sliders. A table showing trade-offs associated with each recovery action and how they compare to the status quo is displayed as the application output.
Habitat Management
Habitat management actions include LFD and LFR. We assumed habitat management actions to have a direct positive effect on the population growth rate (λ). We used an empirically derived two-variable linear regression equation developed for woodland caribou (methods outlined in Schneider et al., 2010 and Hauer et al., 2018; see Supplementary Material for details):
Where, Young forest is the percentage (%) of a caribou range made up of any habitat that has been burned or cut within the last 30 years. Linear feature density (km/km2) is calculated by summing the length of roads, pipelines, and conventional seismic lines (i.e., all linear features except for low-impact seismic lines) within the caribou range (km) and dividing it by the area of the range (km2).
A core assumption of this recovery strategy is that, to be effective, all conventional seismic lines within a given caribou range have to be effectively restored (Serrouya et al., 2020). Users must enter the total length of linear features (i.e., roads, pipelines, and seismic lines, except low-impact seismic lines; km) and percentage of young forest within target ranges. Users also provide the area of the caribou range (km2) and the total length of conventional seismic lines (km). The models assume that only conventional seismic lines can be deactivated or restored. Pipelines, access roads, power lines, main roads, and young forest are assumed to affect population growth rate (λ) but cannot be removed/restored. Low-impact seismic lines are not included in the simulation because they are currently poorly captured by remote sensing and habitat-alteration inventories across many regions. The models assume that young forest remains unchanged and no new linear features are added for the entire simulation period. Default values of linear feature length and percentage of young forest are available for three subpopulations (East Side Athabasca River, West Side Athabasca River, and Cold Lake; obtained from the Alberta Biodiversity Monitoring Institute’s Wall-to-Wall Human Footprint; Alberta Biodiversity Monitoring Institute [ABMI], 2017).
We estimated costs of habitat management at $12,000/km of conventional seismic line to be treated ($CAD), a conservative estimate based on industrial implementation. Lastly, we highlight that because costs of habitat management were assumed to be fixed (i.e., restoration or deactivation was a one-time expense), the starting size of the caribou population has a strong influence on the economic efficiency of habitat management (Supplementary Figure S2).
Linear Feature Deactivation (LFD)
Linear feature deactivation is designed to reduce wolf use of and/or traveling speed on linear features (Keim et al., 2019). Treatments could include line blocking using coarse woody material, tree-felling, soil mounding, or fencing on conventional seismic lines. A key assumption is that wolf use of deactivated linear features, along with wolf-caused caribou mortality, was reduced immediately following treatment. The default settings assume that conventional seismic lines are deactivated by year 5 of simulation (i.e., they are considered removed from the linear feature calculation at year 5).
Linear Feature Restoration (LFR)
Linear feature restoration aims to restore vegetation to its natural condition using treatments such as tree planting, soil mounding, and other silvicultural techniques. All other assumptions were the same as for LFD, with the exception that we assumed a 10-year period for vegetation regrowth to become effective at reducing wolf use and/or speed (Dickie et al., 2017; Tattersall et al., 2020; see Supplementary Material for details). This means that at year 15, conventional seismic lines are considered removed, as opposed to year 5 for LFD. This re-growth lag is likely an underestimate of the true time to recovery, which may take over 35 years (Lee and Boutin, 2006). LFR also assumes that restoration treatments reduce wolf use of, and/or speed on conventional seismic lines after a 10-year period.
Demographic Augmentation
Demographic augmentation includes three recovery actions: MP, CB, and PE. Benefits from demographic augmentation are calculated using empirically informed assumptions about vital rates (Supplementary Tables S1, S2). The assumption made under all demographic augmentation actions is that these recovery actions increase both calf and adult survival of penned/captive individuals (Adams et al., 2019). Once captive animals are released to the wild, their vital rates are reduced to baseline levels observed in the wild, under current landscape conditions. Overall population parameters for MP and PE are calculated using the mean parameters from within-enclosure (“captive”) and wild populations, weighted by the proportion of the population housed inside enclosures, which are then averaged to calculate annual λ for the entire population. For these two recovery strategies, the model also calculates the ‘breakeven’ point as the proportion of the population penned needed to achieve stable population growth (i.e., λ = 1). Captive individuals under MP and PE and their respective wild populations are tracked as one population with a proportion affected by the enclosures because these two recovery actions occur within the population in question. Conversely, the captive and wild populations are tracked separately for CB because the captive individuals act as their own distinct population that can be released to various recipient subpopulations. Economic costs are likewise calculated for each action (see Supplementary Material for details).
Maternal Penning (MP)
Maternal penning involves temporarily protecting adult female caribou and their calves from predation, with 10–50 females cohabiting in each 0.06–0.12-km2 pen (0.002–0.003 km2/adult female; Adams et al., 2019; Serrouya et al., 2020). Adult females are typically captured about a month before parturition and they are released back to the wild when calves reach about a month old (Adams et al., 2019). Calves are most vulnerable to predation during the first few weeks of life, and protection from birth through one month of age can increase annual survival rates threefold (Adams et al., 2019; see Supplementary Material for further discussion).
We estimated that the initial set-up cost for one maternal pen would be $500,000 CAD, the total annual costs would be $630,000 CAD (Supplementary Table S3), and that each pen would house up to 35 adult females.
Conservation Breeding (CB)
The purpose of a CB program is to develop a stable captive population from which animals can be regularly released to supplement existing populations or to reintroduce populations. Wild-born individuals of the species of concern are captured and brought into captivity for reproduction under controlled conditions. Once the captive population (called “Inside facility” in ‘WildLift’) reaches a level of stability, the population restoration phase can be initiated, and animals of reproductive age can be released into the wild. A stable population inside the breeding facility can be achieved by setting different values in the ‘Proportion of juvenile females transferred’ slider once all other demographic inputs have been set.
The CB tab simultaneously estimates a population within a CB facility (i.e., captive population) and a recipient wild population by tracking the number of adult females that are transferred into the CB facility and the number of juvenile females that are transferred out of the facility (i.e., are released to the wild). The recipient population is then compared to the same population without receiving these juvenile females (i.e., status quo). For this recovery action, the population model considers five stage classes (0–1, calves; 1–2, yearlings; 2–3, juveniles; 3–4, subadults; 4+ adults), which allows managers to track more age classes. Age at first reproduction is set at 3, though users can change it to 2, but doing so reduces the fecundity rate at age 2 (Adams et al., 2019). Using the ‘WildLift’ R package’s command line interface, one can further define how many 1-year age classes to track and the maximum age in which individuals are considered calves.
Costs for CB were estimated based on values reported by CB experts (Hayek et al., 2016). Initial set-up cost for one CB facility with capacity to house approximately 40 adult females was estimated at $9,000,000 CAD and total annual costs at $410,000 CAD (Supplementary Table S3).
Predator Exclosure (PE)
Predator exclosures are large enclosed areas (approximately 30–40 km2) that house female individuals year-round, plus a small number of males for breeding. Predators [wolves, bears (Ursus spp.), lynx (Lynx Canadensis), and wolverine (Gulo gulo)] and alternative prey (deer and moose) are removed from within the fenced area. Calves would remain in the enclosure until 1-year old, then released back in the surrounding population. Such PE areas have not yet been implemented but are feasible (Antoniuk et al., 2012) based on an exclusion area that has been piloted at a small scale in the boreal forest (Serrouya et al., 2015a). We set the maximum to 35 adult females per PE area to maintain a density of up to approximately 1/km2.
Costs for PE are highly dependent on the type of materials used for construction. For instance, whether the basic metal fencing includes an additional physical barrier or an electrical barrier to discourage predator incursions. In the software, costs are calculated considering electrical barriers, with initial set-up costs for a single PE of $1,868,000 CAD, the total annual costs would be $960,000 CAD (Supplementary Table S3), and that each facility would house up to 35 individuals.
Predator-Prey Population Management
Predator-prey population management involves actions to reduce the population of main predators and/or competitor species (e.g., WR and MR). Benefits associated with predator-prey population management actions are also calculated using empirically informed assumptions about vital rates (Supplementary Tables S1, S2). Economic costs are likewise calculated for each recovery action (see Supplementary Material for details).
Wolf Reduction (WR)
A direct approach to reduce caribou mortality is to reduce the primary predator populations, as higher predator densities on the landscape are linked to higher predation rates on caribou (Seip, 1992; Wittmer et al., 2005). Two assumptions were made for WR. First that, WR is only effective (i.e., increase caribou survival) if wolf densities within caribou ranges are reduced below 2 wolves/1,000 km2 (Bridger, 2019; Serrouya et al., 2020). Users must enter the annual number of wolves to be removed within target ranges to achieve that threshold (i.e., 2 wolves/1,000 km2). The default value was set to 105 wolves (average annual number of wolves removed to achieve < 2 wolves/1,000 km2; Hervieux et al., 2014) but because the number of wolves to be removed is dynamic and varies across years and ranges, this slider should be adjusted by users. The second assumption is that WR increases both calf and adult survival (by about 73 and 13%, respectively; Supplementary Tables S1, S2; Hervieux et al., 2014). We estimated that the total annual costs of WR would be $5,100 CAD/wolf with no initial set-up cost (Bridger, 2019; Supplementary Table S3).
Moose Reduction (MR)
Moose reduction consists of reducing moose densities to historic levels, which results in lower predator densities within caribou ranges (Serrouya et al., 2011, 2017b). We assumed MR to increase adult female survival (Serrouya et al., 2017b). Outcomes should be interpreted as conservative because parameters come from a subpopulation where MR was not applied to fullest extent and intensity possible (Serrouya et al., 2011, 2017b). Because MR can be achieved by increasing moose hunter harvest (Serrouya et al., 2017b), this action has a minimal cost, if any, to be implemented and, therefore, we did not add a cost calculation for this action.
Multiple Recovery Actions
We also included scenarios with combined effects of recovery actions (i.e., multiple levers), which has been suggested to best improve caribou recovery (Serrouya et al., 2019; Winder et al., 2020). We assumed that combinations between demographic augmentations (i.e., MP, PE, and CB) and predator-prey population management (i.e., WR and MR) would result in simple additive effects on populations. Parameters for non-captive individuals were derived from average subpopulation response to either WR or MR. Parameters for PE or CB captive individuals were derived from average response to these actions in isolation because individuals are in enclosures year-round, or in the case of CB the captive population is independent of the recipient population. For MP, captive individuals are penned for a portion of the year only, and as such, annual survival rates reflect both MP and predator-prey management. While WR and MR decrease predator density outside the enclosures, additional effects of MP over WR and MR include protecting individuals against other predators (e.g., bears and cougars) and improving nutritional conditions (Adams et al., 2019). We assumed that the additive increase in captive adult female survival as a result of MP in combination with WR or MR was 1/2 of the MP-only effect over status quo survival rates. We assumed the same additive increase on captive calf survival under WR + MP. Captive survival under MP + MR was kept the same as calf survival under MP-only because MR is assumed to affect adult female survival only (Serrouya et al., 2017b; see Supplementary Table S3 for specific parameters used and demographic modeling approach). Users can modify population parameters to obtain subpopulation-specific simulations or to adjust the intensity of additive effects. Because there are no specific empirical vital rates on multiple levers, we have not extrapolated outcomes to other subpopulations. We have also not included combinations with habitat management or multiple predator-prey management actions due to high uncertainty associated with their outcomes and mechanisms producing them (e.g., compensatory vs. additive effects). Users can simulate these additional combinations by making their own assumptions on changes in parameters using the interactive sliders. Results using multiple levers are extrapolated based on knowledge from locations where single levers were studied, and need to be treated with caution.
Example
To demonstrate our software, we focused on the East Side Athabasca River caribou subpopulation as a case-study and simulated population response to all seven recovery actions available on ‘WildLift’ (Table 1 and Figure 2). Given the uncertainty in parameter estimation, we also conducted a sensitivity analysis (Caswell, 2001) to evaluate how our conclusions would be affected by varying all parameters (see Supplementary Material for details and results).
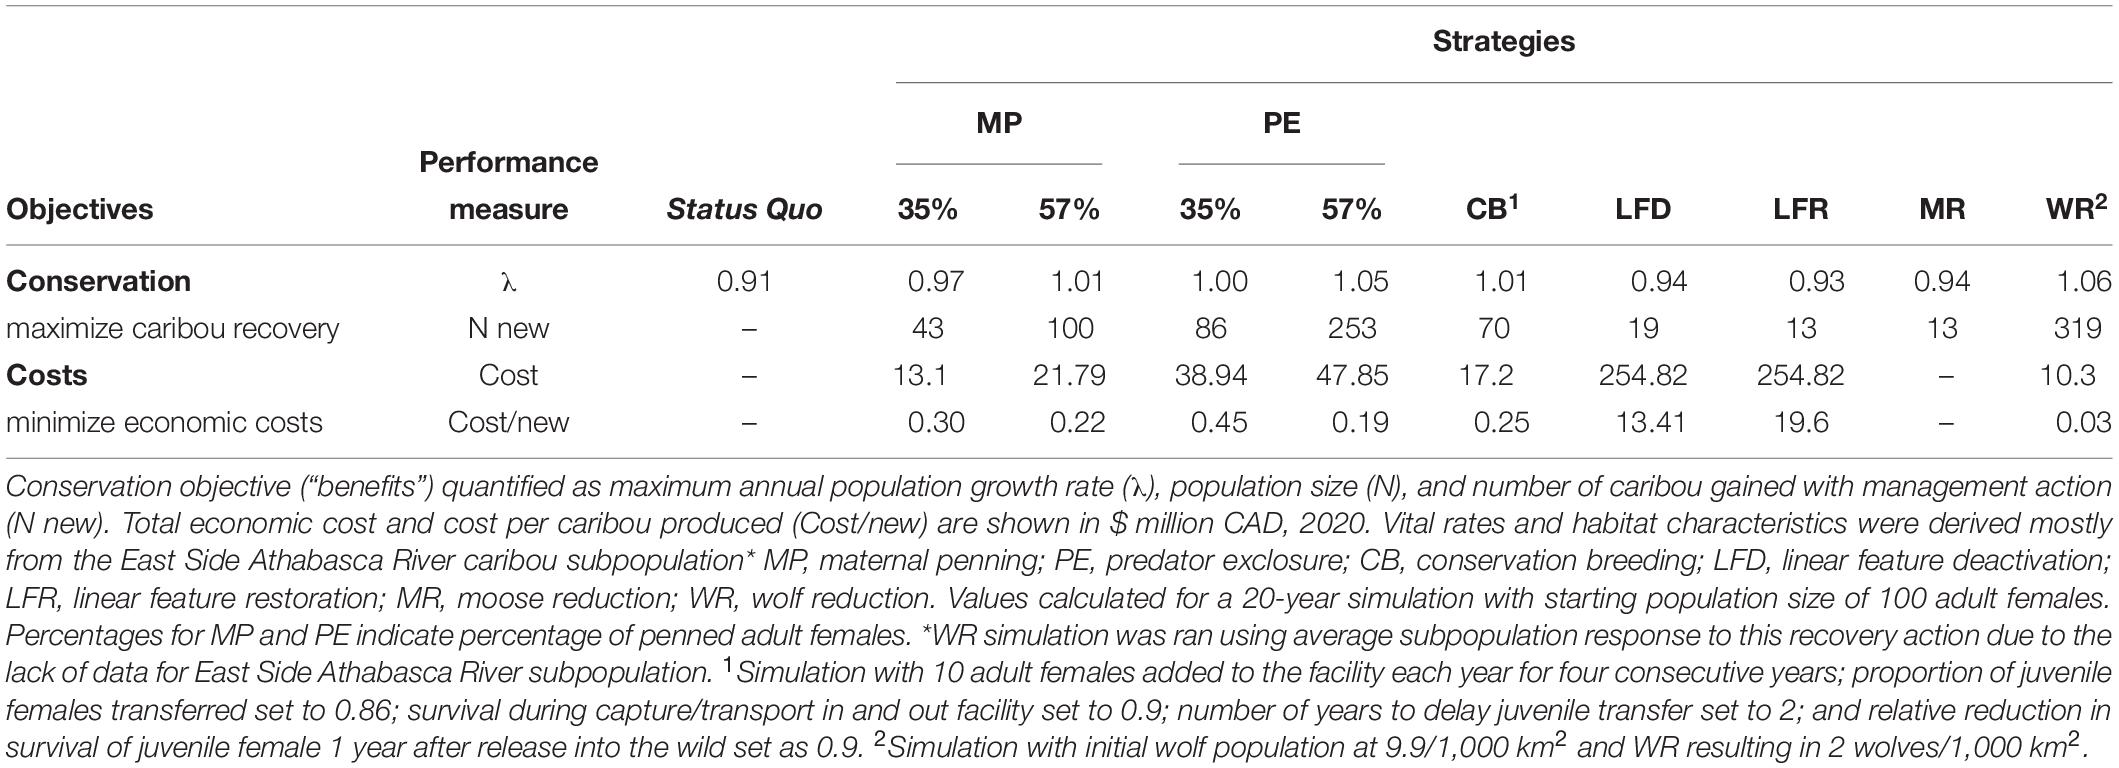
Table 1. Consequence table showing trade-offs among conservation and economic objectives associated with seven recovery actions for woodland caribou.
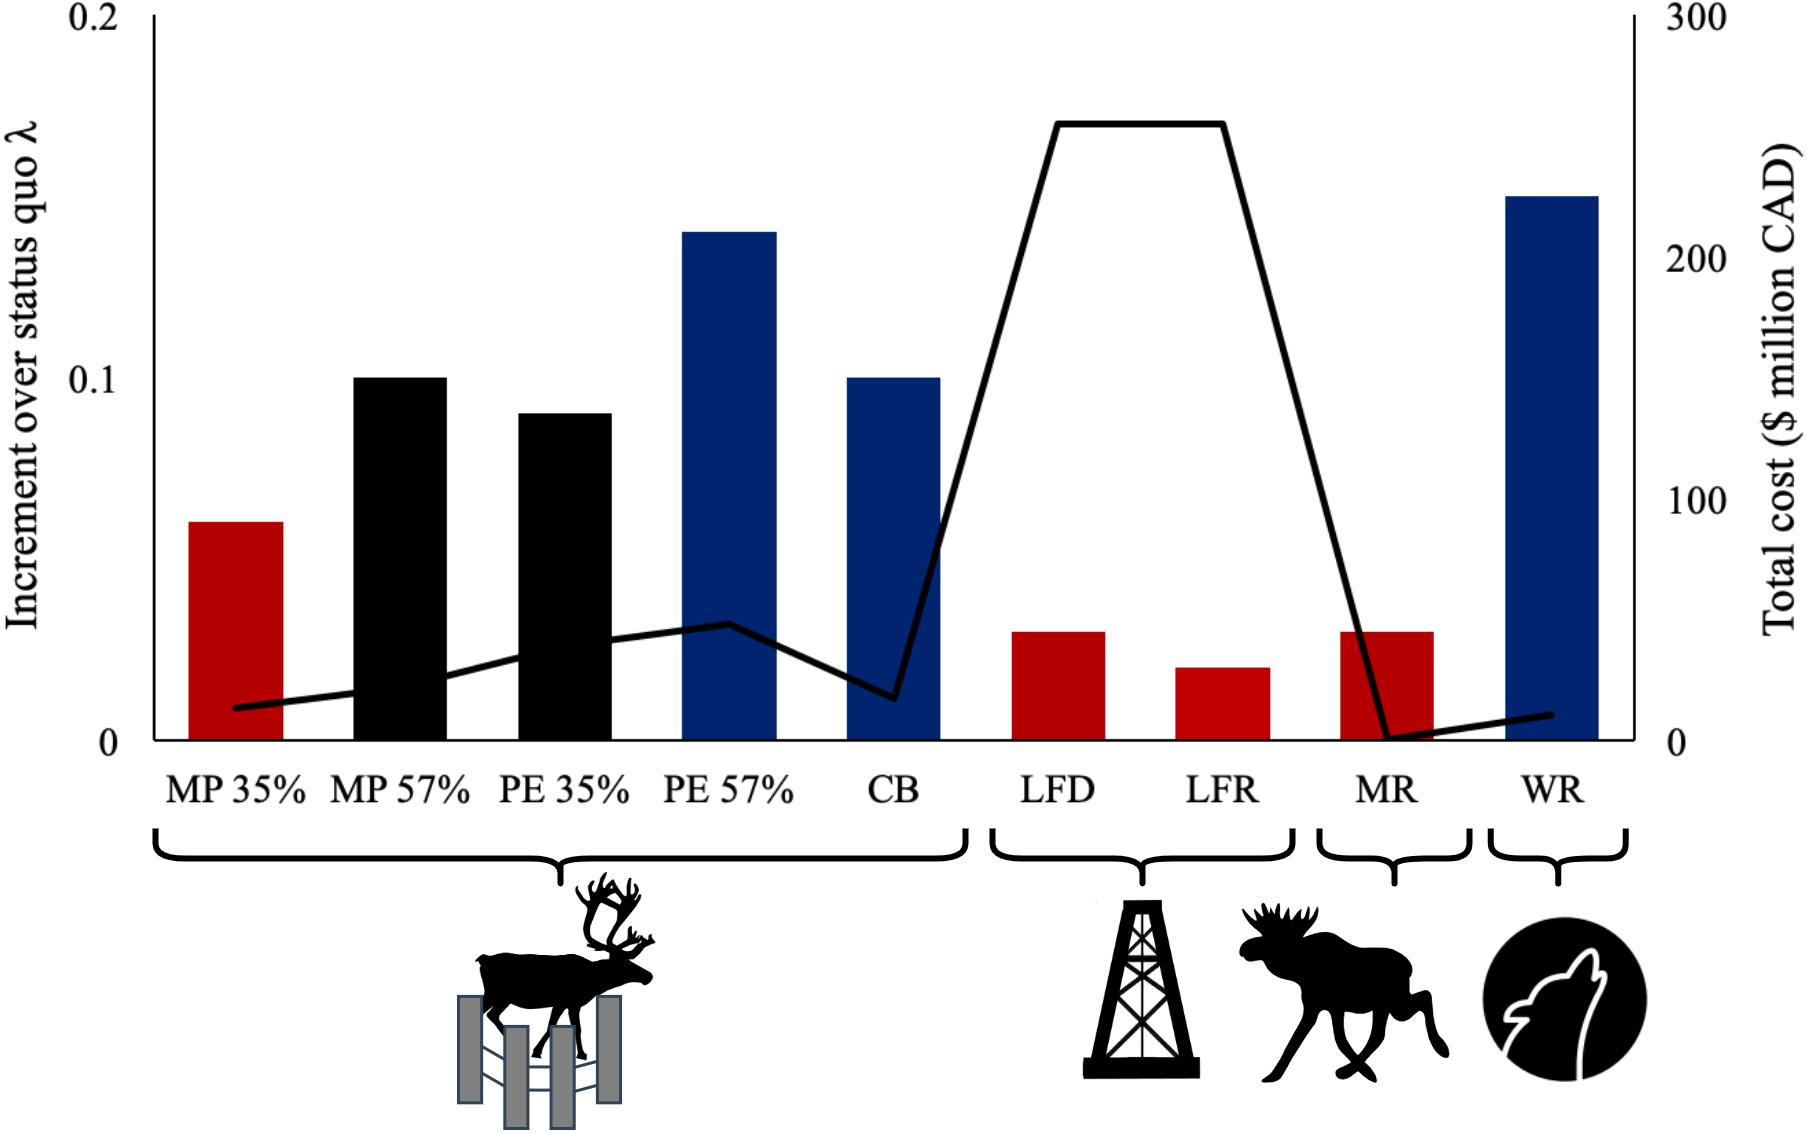
Figure 2. Increment over status quo population growth rate (λ; bars) and total cost (line) associated with seven recovery actions for woodland caribou. Demographic augmentation actions: MP, maternal penning; PE, predator exclosure; and CB, conservation breeding (percentages for MP and PE indicate percentage of penned adult females). Habitat management actions: LFD, linear feature deactivation and LFR, linear feature restoration. Predator-prey population management actions: MR = moose reduction and WR = wolf reduction. Red = declining population (λ < 1); black = stable population (λ = 1); blue = growing population (λ > 1). See footnotes in Table 1 for details on simulations.
Our simulations showed that the costs and benefits associated with recovery actions for woodland caribou can vary considerably (Table 1 and Figure 2). Although intensive MP (i.e., ≥57% of adult females penned) resulted in population stability, the only recovery actions that resulted in population growth (λ > 1) were CB, intensive PE (i.e., ≥57% of adult females penned), and WR (Table 1 and Figure 2). Habitat management actions did not produce much increment over status quo population growth rate (λ) and was the most expensive recovery action (Table 1 and Figure 2). To place the magnitude of this challenge in context, there are > 350,000 km of seismic lines in caribou ranges in the boreal forest of Alberta and British Columbia, and at 12,000$/km to recover these lines, costs could exceed 4.2 billion dollars, possibly at the expense of other recovery actions. With no cost associated with the implementation of MR, this action was the least expensive, followed by WR. MP, PE, and CB all had similar long-term costs (Table 1).
Conclusion
Choosing recovery actions for threatened species is a complex challenge because it involves evaluating trade-offs of multiple objectives. Here we present a tool that can be readily used under a structural decision-making framework to estimate and compare costs and benefits associated with seven alternative recovery actions, which ultimately helps to bridge the gap between management and science.
Our example illustrates how trade-offs associated with recovery actions for threatened species can vary considerably. The fundamental objective of most recovery plans is to achieve self-sustaining populations (i.e., λ ≥ 1), but given constraints in economic resources, minimizing costs is typically a competing objective when choosing recovery actions (see Gregory and Long, 2009; Converse et al., 2012). A central action in recovery planning is often habitat protection and restoration, which address the ultimate cause of species endangerment (i.e., habitat loss; Venter et al., 2006; International Union for Conservation of Nature [IUCN], 2020). In our simulations with woodland caribou, habitat management, MR, and partial MP (i.e., ≤ 35% of adult females penned) did not generate population growth or stability. Moreover, habitat management actions were at least three times more expensive than any other recovery action. CB, intensive PE (i.e., ≥ 57% of adult females penned), and WR (which was also one of the least expensive recovery actionsand see Johnson et al., 2019) were the only actions that resulted in population growth. Although CB and intensive PE produce similar cost per additional caribou in the long term, CB requires a much higher upfront investment ($9 million vs. $500 thousand CAD) and is usually associated with several additional limitations (see Snyder et al., 1996). This method is especially problematic for species with naturally low reproductive rates (e.g., caribou and many other large mammals) because achieving stable captive populations becomes a challenge and/or a high number of captive animals are needed to sustain translocation and reintroduction efforts (Snyder et al., 1996). Fencing methods such as PEs, on the other hand, can achieve landscape-scale conservation if sufficiently large populations are fenced (Hayward and Kerley, 2009).
Similarly to our software, other population viability analysis (PVA) tools project population trajectories through simulation models (see Lacy, 2019 for a review on PVA). Individual-based PVA and matrix models seem to produce similar outcomes for woodland caribou, which suggests that are both useful tools for comparing caribou response to alternative scenarios (Fryxell et al., 2020). The main advantages of our software in relation to other PVA tools are that it is open access, it includes costs calculations, and it has already been parameterized for woodland caribou. PVA typically requires a lot of data on population demography and environmental conditions, which can constrain its usefulness in management decisions (Lacy, 2019). While we used woodland caribou as a case study, some components of our modeling framework are transferable to other threatened taxa – as long as parameters are adjusted to the target species. For instance, the predator-prey management actions and population augmentation simulations found in our software could be particularly relevant for other threatened ungulates [e.g., desert bighorn sheep (Ovis canadensis nelsoni)]. Likewise, our population augmentation simulations could be useful for threatened species that are currently being managed through CB [e.g., Vancouver Island marmot (Marmota vancouverensis; Jackson et al., 2016) and black-footed ferret (Mustela nigripes; Jachowski et al., 2011)]. Regardless of the target species, given the complexity of evaluating trade-offs across alternative actions and the high level of uncertainty associated with parameter estimation, closely monitoring the outcomes of implemented actions is a fundamental subsequent step. This step provides insight into the validly of the model assumptions and predictions (Schneider, 2019) and it allows us to refine future actions by improving learning and reducing uncertainty over time (Gregory et al., 2012). We also highlight that PVA analysis, including matrix models such as the one used here, assumes geographic closure. This assumption is likely violated when modeling individual caribou ranges (Wilson et al., 2020). Although we have not incorporated elements of population spatial structure, such extensions can be added to WildLift, given the open source nature of the package (for details about how to contribute and extend the methodology see https://github.com/ABbiodiversity/WildLift).
It is important to emphasize that short-term recovery actions such as predator-prey management and population augmentation do not address habitat loss, which is the ultimate cause of population declines and species endangerment (Kerr and Cihlar, 2004; Kerr and Deguise, 2004; Venter et al., 2006). Therefore, these actions should be viewed as a last resort and should always be integrated with simultaneous long-term actions such as habitat protection and restoration (Snyder et al., 1996), which may also benefit other conservation objectives. In fact, previous simulations have demonstrated that caribou populations under short-term recovery actions return to decline as soon as actions are interrupted, suggesting that these recovery actions are only stopgap measures for preventing the further decline or extirpation of small endangered populations (Johnson et al., 2019).
We call attention to the fact that simulations built under ‘WildLift’ depict an optimistic scenario because landscapes are deteriorating over time (Theobald et al., 2020). Moreover, the habitat management predictions are inherently conservative because our assumption of a 10-year lag until linear features function as undisturbed forest is likely underestimated (Lee and Boutin, 2006), as is the assumption that all conventional seismic lines within a given range could be treated in 5 years with no net addition of seismic lines. Despite these assumptions, our approach was designed to broadly contrast different recovery actions for caribou and similar threatened species. Our models are simple, yet the order of magnitude of difference in cost and benefits between the main approaches is unlikely to change much with any added complexity.
Despite standardizing the forecasting horizon across simulations, temporal components were not explicitly included as response metrics in our analyses. The time taken for population recovery should also be considered when dealing with small populations because they are more susceptible to stochastic events and the longer their recovery takes, the higher is their extinction risk (e.g., Hebblewhite et al., 2010). Actions such as WR are more likely to increase the population size soon after implementation, which has been shown empirically (Bridger, 2019; Serrouya et al., 2019; but see Hervieux et al., 2014). CB on the other hand, takes approximately 15 years to increase back to the starting population size under an optimistic assumption of 0.95 adult female survival inside the facility. If adult female survival, a highly sensitive parameter (Supplementary Figure S3), is changed to 0.90, the population never recovers to its initial size. Furthermore, under the default settings, with 40–50 adult females and subadults in the facility, only up to nine female calves can be exported per year while maintaining a stable population in the facility, thus providing limited ability to supplement more than one population.
The ethics of conservation actions for threatened species are complex. First, demographic augmentation approaches typically result in individuals produced by the enclosures being released into poor habitat conditions (i.e., a population sink). Further, habitat management alone may not result in self-sustaining populations, due to irreversible habitat disturbance in some areas, as demonstrated in our example. Indeed, continuous demographic augmentation may be needed regardless of habitat conditions to help the recovery of species that are also facing impacts from climate change (e.g., Povilitis and Suckling, 2010). Lastly, lethal predator population management impacts many social values (Russell, 2010; Hervieux et al., 2015), which have not been considered here. Alternatively, managing prey populations (e.g., moose and deer) can help reduce predator numbers (Serrouya et al., 2017b) through less controversial means while offering opportunities for recreational hunting at no cost to be implemented.
Economic methods and technical models such as the ones presented here can play a major role in informing a decision by transparently quantifying trade-offs to maximize cost-effectiveness. Nonetheless, we emphasize that maximizing cost-effectiveness do not in itself constitute the decision-making framework (Gregory et al., 2012). Structured decision making relies not only on conservation-related values but also on social values affected by the decision (Gregory et al., 2012; Schneider, 2019). Here, maximizing caribou recovery was defined as a fundamental objective and minimizing costs associated with recovery actions was included as a competing objective (Table 1). Whereas predicting outcomes is heavily dependent on science, the selection of the recovery actions (i.e., the decision) is a social choice (Schneider, 2019) and needs to account for any other component affected by the recovery actions (e.g., Indigenous peoples, industry, and any other values in the social, ecological, and economic spheres). Although our software does not incorporate additional trade-offs such as societal acceptance, ease of practical implementation, nor temporal components related to the cost-effectiveness of each action, we believe that the software can be used to facilitate discussions between government, industry, Indigenous communities and the public. For instance, objectives from other groups (e.g., timber flow and Indigenous hunting opportunities), can be evaluated outside our software to accommodate multi-stakeholder settings. This can be done by formalizing those other objectives into the SDM framework, by explicitly incorporating landscape models (e.g., timber supply models), as well as by weighting societal acceptance of various actions and by contrasting short-term benefits/costs against long-term outcomes.
Data Availability Statement
All datasets generated in this study are included in the article/Supplementary Material.
Author Contributions
MD, RS, and SB designed the project. MD and RS collected data and supervised the project. PS and SG wrote the software R code. MN-R and SG ran the simulations. MD and MN-R designed and revised software framework. MN-R interpreted the simulation results, elaborated the figures, and drafted the manuscript. MD, PS, CD, RS, and SB critically reviewed the manuscript and contributed to writing. All authors read and approved the submitted version.
Funding
Funding for this work was provided by the Government of British Columbia and Canada’s Oil Sands Innovation Alliance.
Conflict of Interest
The authors declare that the research was conducted in the absence of any commercial or financial relationships that could be construed as a potential conflict of interest.
Acknowledgments
We would like to thank Tyler Muhly for continued discussions on implementation and improvements to ‘WildLift’ (originally designated ‘CaribouBC’), Scott McNay for inputs on maternal penning, and Drs. Amélie Mathieu and Helen Schwantje for inputs on conservation breeding.
Supplementary Material
The Supplementary Material for this article can be found online at: https://www.frontiersin.org/articles/10.3389/fevo.2020.564508/full#supplementary-material
Footnotes
References
Adamowicz, W. L. (2016). Economic analysis and species at risk: lessons learned and future challenges. Can. J. Agric. Econ. 64, 21–32. doi: 10.1111/cjag.12098
Adams, L. G., Farnell, R., Oakley, M. P., Jung, T. S., Larocque, L. L., Lortie, G. M., et al. (2019). Evaluation of maternal penning to improve calf survival in the Chisana caribou herd. Wildl. Monogr. 204, 5–46. doi: 10.1002/wmon.1044
Alberta Biodiversity Monitoring Institute [ABMI] (2017). Wall-to-Wall Human Footprint Inventory. Available online at: https://www.abmi.ca/home/data-analytics/da-top/da-product-overview/Human-Footprint-Products/HF-inventory.html (accessed May 5, 2018).
Antoniuk, T., McNeil, L., Nishi, J., and Manuel, K. (2012). Caribou Protection and Recovery Program Technical Guidance. Oil Sands Leadership Initiative, Land Stewardship Working Group. Available online at: https://salmoconsulting.files.wordpress.com/2012/11/caribou-protection-and-recovery-program-2012.pdf (accessed June 15, 2018).
Apps, C. D., McLellan, B. N., Kinley, T. A., Serrouya, R., Seip, D. R., and Wittmer, H. U. (2013). Spatial factors related to mortality and population decline of endangered mountain caribou. J. Wildl. Manage. 77, 1409–1419. doi: 10.1002/jwmg.601
Bentham, P., and Coupal, B. (2015). Habitat restoration as a key conservation lever for woodland caribou: a review of restoration programs and key learnings from Alberta. Rangifer 35, 123–147. doi: 10.7557/2.35.2.3646
Boersma, P. D., Kareiva, P., Fagan, W. F., Clark, J. A., and Hoekstra, J. M. (2001). How good are endangered species recovery plans? Bioscience 51, 643–649. doi: 10.1641/0006-3568(2001)051[0643:hgaesr]2.0.co;2
Bolam, F. C., Grainger, M. J., Mengersen, K. L., Stewart, G. B., Sutherland, W. J., Runge, M. C., et al. (2019). Using the value of information to improve conservation decision making. Biol. Rev. 94, 629–647. doi: 10.1111/brv.12471
Bottrill, M. C., Walsh, J. C., Watson, J. E. M., Joseph, L. N., Ortega-Argueta, A., and Possingham, H. P. (2011). Does recovery planning improve the status of threatened species? Biol. Conserv. 144, 1595–1601. doi: 10.1016/j.biocon.2011.02.008
Bridger, M. (2019). South Peace Caribou Recovery Following Five Years of Experimental Wolf Reduction. BC Ministry of Forests, Lands, Natural Resource Operations and Rural Development. Available online at: https://www2.gov.bc.ca/assets/gov/environment/plants-animals-and-ecosystems/wildlife-wildlife-habitat/caribou/south_peace_caribou_recovery_following_five_years_of_experimental_wolf_reduction.pdf (accessed May 10, 2018).
Chang, W., Cheng, J., Allaire, J. J., Xie, Y., and McPherson, J. (2019). Shiny: Web Application Framework for R. R package version 1.4.0. Available online at: https://CRAN.R-project.org/package=shiny (accessed January 7, 2018).
Committee on the Status of Endangered Wildlife in Canada [COSEWIC] (2014). COSEWIC Annual Report 2013-2014. Available online at: https://wildlife-species.canada.ca/species-risk-registry/virtual_sara/files/cosewic/CESCC_1014_e.pdf (accessed March 7, 2018).
Converse, S. J., Moore, C. T., Folk, M. J., and Runge, M. C. (2012). A matter of tradeoffs: reintroduction as a multiple objective decision. J. Wildl. Manage. 77, 1145–1156. doi: 10.1002/jwmg.472
Dawe, K. L., and Boutin, S. (2016). Climate change is the primary driver of white-tailed deer (Odocoileus virginianus) range expansion at the northern extent of its range; land use is secondary. Ecol. Evol. 6, 6435–6451. doi: 10.1002/ece3.2316
DeCesare, N. J., Hebblewhite, M., Robinson, H. S., and Musiani, M. (2010). Endangered, apparently: the role of apparent competition in endangered species conservation. Anim. Conserv. 13, 353–362. doi: 10.1111/j.1469-1795.2009.00328.x
DeMars, C. A., and Boutin, S. (2018). Nowhere to hide: effects of linear features on predator-prey dynamics in a large mammal system. J. Anim. Ecol. 87, 274–284. doi: 10.1111/1365-2656.12760
Dickie, M., Serrouya, R., McNay, R. S., and Boutin, S. (2017). Faster and farther: wolf movement on linear features and implications for hunting behaviour. J. Appl. Ecol. 54, 253–263. doi: 10.1111/1365-2664.12732
Diller, L. V., Dumbacher, J. P., Bosch, R. P., Bown, R. R., and Gutiérrez, R. J. (2014). Removing barred owls from local areas: techniques and feasibility. Wildl. Soc. Bull. 38, 211–216. doi: 10.1002/wsb.381
Favaro, B., Claar, D. C., Fox, C. H., Freshwater, C., Holden, J. J., Roberts, A., et al. (2014). Trends in extinction risk for imperiled species in Canada. PLoS One 9:e113118. doi: 10.1371/journal.pone.0113118
Festa-Bianchet, M., Ray, J. C., Boutin, S., Côté, S. D., and Gunn, A. (2011). Conservation of caribou (Rangifer tarandus) in Canada: an uncertain future. Can. J. Zool. 89, 419–434.
Fryxell, J. M., Avgar, T., Liu, B., Baker, J. A., Rodgers, A. R., Shuter, J., et al. (2020). Anthropogenic disturbance and population viability of woodland caribou in Ontario. J. Wildl. Manage. 84, 636–650. doi: 10.1002/jwmg.21829
Government of Canada (2002). Species at Risk Act, SC 2002, c29. Available online at: https://laws-lois.justice.gc.ca/eng/acts/s-15.3/ (accessed February 2, 2020).
Gregory, R., Failing, L., Harstone, M., Long, G., McDaniels, T., and Ohlson, D. (2012). Structured Decision Making: a Practical Guide to Environmental Management Choices. Hoboken, NJ: John Wiley & Sons.
Gregory, R., and Long, G. (2009). Using structured decision making to help implement a precautionary approach to endangered species management. Risk Anal. 29, 518–532. doi: 10.1111/j.1539-6924.2008.01182.x
Hauer, G., Adamowicz, W. L., and Boutin, S. (2018). Economic analysis of threatened species conservation: the case of woodland caribou and oilsands development in Alberta, Canada. J. Environ. Manage. 218, 103–117. doi: 10.1016/j.jenvman.2018.03.039
Hayek, T., Stanley Price, M. R., Ewen, J. G., Lloyd, N., Saxena, A., and Moehrenschlager, A. (2016). An Exploration of Conservation Breeding and Translocation Tools to Improve the Conservation Status of Boreal Caribou Populations in Western Canada. Calgary: Centre for Conservation Research, Calgary Zoological Society.
Hayward, M. W., and Kerley, G. I. H. (2009). Fencing for conservation: restriction of evolutionary potential or a riposte to threatening processes? Biol. Conserv. 142, 1–13. doi: 10.1016/j.biocon.2008.09.022
Hebblewhite, M., White, C., and Musiani, M. (2010). Revisiting extinction in national parks: mountain caribou in Banff. Conserv. Biol. 24, 341–344. doi: 10.1111/j.1523-1739.2009.01343.x
Hervieux, D., Hebblewhite, M., Decesare, N. J., Russell, M., Smith, K., Robertson, S., et al. (2013). Widespread declines in woodland caribou (Rangifer tarandus caribou) continue in Alberta. Can. J. Zool. 91, 872–882. doi: 10.1139/cjz-2013-0123
Hervieux, D., Hebblewhite, M., Stepnisky, D., Bacon, M., and Boutin, S. (2014). Managing wolves (Canis lupus) to recover threatened woodland caribou (Rangifer tarandus caribou) in Alberta. Can. J. Zool. 92, 1029–1037. doi: 10.1139/cjz-2014-0142
Hervieux, D., Hebblewhite, M., Stepnisky, D., Bacon, M., and Boutin, S. (2015). Addendum to “Managing wolves (Canis lupus) to recover threatened woodland caribou (Rangifer tarandus caribou) in Alberta”. Can. J. Zool. 93, 245–247. doi: 10.1139/cjz-2015-0012
International Union for Conservation of Nature [IUCN] (2020). The IUCN Red List of Threatened Species. Version 2020–1. Available online at: http://www.iucnredlist.org (accessed March, 20 2020).
Jachowski, D. S., Gitzen, R. A., Grenier, M. B., Holmes, B., and Millspaugh, J. J. (2011). The importance of thinking big: large-scale prey conservation drives black-footed ferret reintroduction success. Biol. Conserv. 144, 1560–1566. doi: 10.1016/j.biocon.2011.01.025
Jackson, C. L., Schuster, R., and Arcese, P. (2016). Release date influences first-year site fidelity and survival in captive-bred Vancouver Island marmots. Ecosphere 7:e01314.
Johnson, C. J., Mumma, M. A., and St-Laurent, M. H. (2019). Modeling multispecies predator-prey dynamics: predicting the outcomes of conservation actions for woodland caribou. Ecosphere 10:e02622. doi: 10.1002/ecs2.2622
Kerr, J. T., and Cihlar, J. (2004). Patterns and causes of species endangerment in Canada. Ecol. Appl. 14, 743–753. doi: 10.1890/02-5117
Kerr, J. T., and Deguise, I. (2004). Habitat loss and the limits to endangered species recovery. Ecol. Lett. 7, 1163–1169. doi: 10.1111/j.1461-0248.2004.00676.x
Keim, J. L., Lele, S. R., DeWitt, P. D., Fitzpatrick, J. J., and Jenni, N. S. (2019). Estimating the intensity of use by interacting predators and prey using camera traps. J. Anim. Ecol. 88, 690–701. doi: 10.1111/1365-2656.12960
Lacy, R. C. (2019). Lessons from 30 years of population viability analysis of wildlife populations. Zoo Biol. 38, 67–77. doi: 10.1002/zoo.21468
Latham, A. D. M., Latham, M. C., Mccutchen, N. A., and Boutin, S. (2011). Invading white-tailed deer change wolf-caribou dynamics in northeastern Alberta. J. Wildl. Manage. 75, 204–212. doi: 10.1002/jwmg.28
Lee, P., and Boutin, S. (2006). Persistence and developmental transition of wide seismic lines in the western Boreal Plains of Canada. J. Environ. Manage. 78, 240–250. doi: 10.1016/j.jenvman.2005.03.016
Magin, C. D., Johnson, T. H., Groombridge, B., Jenkins, M., and Smith, H. (1994). “Species extinctions, endangerment and captive breeding,” in Creative Conservation: Interactive Management of Wild and Captive Animals, eds P. J. S. Olney, G. M. Mace, and A. T. C. Feistner (Dordrecht: Springer), 3–31. doi: 10.1007/978-94-011-0721-1_1
McNay, S. (2018). Maternal Penning to Enhance Survival of Caribou within the Klinse-za Herd. Mackenzie: Wildlife Infometrics Inc.
Moffatt, S. (2012). Time to Event Modelling: Wolf Search Efficiency in Northern Ontario. Doctoral dissertation. Guelph (ON): University of Guelph.
Nichols, J. D., Eaton, M. J., and Martin, J. (2014). “Thresholds for conservation and management: structured decision making as a conceptual framework,” in Application of Threshold Concepts in Natural Resource Decision Making, ed. G. R. Guntenspergen (New York, NY: Springer), 9–28. doi: 10.1007/978-1-4899-8041-0_2
Povilitis, A., and Suckling, K. (2010). Addressing climate change threats to endangered species in U.S. recovery plans. Conserv. Biol. 24, 372–376. doi: 10.1111/j.1523-1739.2010.01447.x
R Core Team (2018). R: A Language and Environment for Statistical Computing. Vienna: R Foundation for Statistical Computing.
Ringma, J., Legge, S., Woinarski, J., Radford, J., Wintle, B., and Bode, M. (2018). Australia’s mammal fauna requires a strategic and enhanced network of predator-free havens. Nat. Ecol. Evol. 2, 410–411. doi: 10.1038/s41559-017-0456-4
Roemer, G. W., Donlan, C. J., and Courchamp, F. (2002). Golden eagles, feral pigs, and insular carnivores: how exotic species turn native predators into prey. Proc. Natl. Acad. Sci. U.S.A. 99, 791–796. doi: 10.1073/pnas.012422499
Russell, D. (2010). A Review of Wolf Management Programs in Alaska, Yukon, British Columbia, Alberta, and Northwest Territories. Yukon Wolf Conservation and Management Plan Review Committee. Available online at: https://www.wrrb.ca/sites/default/files/Russell_2010_wolf_management.pdf (accessed Mar 15, 2020).
Schneider, R. R. (2019). Biodiversity Conservation in Canada: from Theory to Practice. Alberta: The Canadian Centre for Translational Ecology.
Schneider, R. R., Hauer, G., Adamowicz, W. L., and Boutin, S. (2010). Triage for conserving populations of threatened species: the case of woodland caribou in Alberta. Biol. Conserv. 143, 1603–1611. doi: 10.1016/j.biocon.2010.04.002
Seip, D. R. (1992). Factors limiting woodland caribou populations and their interrelationships with wolves and moose in southeastern British Columbia. Can. J. Zool. 70, 1494–1503. doi: 10.1139/z92-206
Serrouya, R., Boutin, S., Harding, R., and Bohm, A. (2015a). Testing Fence Designs to Provide a Predator-Free Area for Boreal Caribou: Phase 1 Reporting and Planning for Phase 2. Edmonton, AB: Alberta Biodiversity Monitoring Institute. Available online at: https://cmu.abmi.ca/wp-content/uploads/2020/09/REPORT_Serrouya-et-al-2015_Testing-fence-designs-to-provide-a-predator-free-area-for-boreal-caribou-Phase-1-reporting-and-planning-for-Phase-2.pdf (accessed September 16, 2020).
Serrouya, R., Dickie, M., DeMars, C., Wittmann, M. J., and Boutin, S. (2020). Predicting the effects of restoring linear features on woodland caribou populations. Ecol. Model. 416:108891. doi: 10.1016/j.ecolmodel.2019.108891
Serrouya, R., Furk, K., Bollefer, K., and Legebokow, C. (2015b). Maternal Penning in the Northern Columbia Mountains: Revelstoke Caribou Rearing in the Wild’s First-Year Pilot and Results of the 2015 Calf Census. Version 3.0. Revelstoke, BC: Revelstoke Caribou Rearing in the Wild Society.
Serrouya, R., Gilbert, S., McNay, R. S., McLellan, B. N., Heard, D. C., Seip, D. R., et al. (2017a). Comparing population growth rates between census and recruitment-mortality models. J. Wildl. Manage. 81, 297–305. doi: 10.1002/jwmg.21185
Serrouya, R., McLellan, B. N., Boutin, S., Seip, D. R., and Nielsen, S. E. (2011). Developing a population target for an overabundant ungulate for ecosystem restoration. J. Appl. Ecol. 48, 935–942. doi: 10.1111/j.1365-2664.2011.01998.x
Serrouya, R., McLellan, B. N., van Oort, H., Mowat, G., and Boutin, S. (2017b). Experimental moose reduction lowers wolf density and stops decline of endangered caribou. PeerJ 5:e3736. doi: 10.7717/peerj.3736
Serrouya, R., Seip, D. R., Hervieux, D., McLellan, B. N., McNay, R. S., Steenweg, R., et al. (2019). Saving endangered species using adaptive management. Proc. Natl. Acad. Sci. U.S.A. 116, 6181–6186.
Serrouya, R., Wittmann, M. J., McLellan, B. N., Wittmer, H. U., and Boutin, S. (2015c). Using predator-prey theory to predict outcomes of broadscale experiments to reduce apparent competition. Am. Nat. 185, 665–679. doi: 10.1086/680510
Smith, R. K., Pullin, A. S., Stewart, G. B., and Sutherland, W. J. (2010). Effectiveness of predator removal for enhancing bird populations. Conserv. Biol. 24, 820–829. doi: 10.1111/j.1523-1739.2009.01421.x
Snyder, N. F. R., Derrickson, S. R., Beissinger, S. R., Wiley, J. W., Smith, T. B., Toone, W. D., et al. (1996). Limitations of captive breeding in endangered species recovery. Conserv. Biol. 10, 338–348. doi: 10.1046/j.1523-1739.1996.10020338.x
Solymos, P., Dickie, M., Gilbert, S., Nagy-Reis, M., and Serrouya, R. (2020). WildLift: An Open-Source Tool to Guide Decisions for Wildlife Conservation. R package version 0.3.
Tattersall, E. R., Burgar, J. M., Fisher, J. T., and Burton, A. C. (2020). Mammal seismic line use varies with restoration: applying habitat restoration to species at risk conservation in a working landscape. Biol. Conserv. 241:108295. doi: 10.1016/j.biocon.2019.108295
Tattoni, C., Preatoni, D. G., Lurz, P. W. W., Rushton, S. P., Tosi, G., Bertolino, S., et al. (2006). Modelling the expansion of a grey squirrel population: implications for squirrel control. Biol. Invasions 8, 1605–1619. doi: 10.1007/s10530-005-3503-z
Theobald, D. M., Kennedy, C., Chen, B., Oakleaf, J., Baruch-Mordo, S., and Kiesecker, J. (2020). Earth transformed: detailed mapping of global human modification from 1990 to 2017. Earth Syst. Sci. Data Discuss. 12, 1953–1972. doi: 10.5194/essd-12-1953-2020
United States Fish and Wildlife Service (2019). Endangered and Threatened Wildlife; Endangered Species Status for Southern Mountain Caribou Distinct Population Segment. Available online at: https://www.govinfo.gov/content/pkg/FR-2019-10-02/pdf/2019-20459.pdf (accessed April 5, 2020).
van Rensen, C. K., Nielsen, S. E., White, B., Vinge, T., and Lieffers, V. J. (2015). Natural regeneration of forest vegetation on legacy seismic lines in boreal habitats in Alberta’s oil sands region. Biol. Conserv. 184, 127–135. doi: 10.1016/j.biocon.2015.01.020
Venter, O., Brodeur, N. N., Nemiroff, L., Belland, B., Dolinsek, I. J., and Grant, J. W. A. (2006). Threats to endangered species in Canada. Bioscience 56, 903–910. doi: 10.1641/0006-3568(2006)56[903:ttesic]2.0.co;2
Wilson, S., Sutherland, G., Larter, N., Kelly, A., McLaren, A., Hodson, J., et al. (2020). Spatial structure of boreal woodland caribou populations in northwest Canada. Rangifer 40, 1–14. doi: 10.7557/2.40.1.4902
Winder, R., Stewart, F. E. C., Nebel, S., McIntire, E. J. B., Dyk, A., and Omendja, K. (2020). Cumulative effects and boreal woodland caribou: how bow-tie risk analysis addresses a critical issue in Canada’s forested landscapes. Front. Ecol. Evol. 8:1–20. doi: 10.3389/fevo.2020.00001
Wittmer, H. U., McLellan, B. N., Seip, D. R., Young, J. A., Kinley, T. A., Watts, G. S., et al. (2005). Population dynamics of the endangered mountain ecotype of woodland caribou (Rangifer tarandus caribou) in British Columbia, Canada. Can. J. Zool. 83, 407–418. doi: 10.1139/z05-034
Keywords: conservation, management tool, software, species recovery, structured decision making, threatened species, trade-off, woodland caribou
Citation: Nagy-Reis M, Dickie M, Sólymos P, Gilbert SL, DeMars CA, Serrouya R and Boutin S (2020) ‘WildLift’: An Open-Source Tool to Guide Decisions for Wildlife Conservation. Front. Ecol. Evol. 8:564508. doi: 10.3389/fevo.2020.564508
Received: 21 May 2020; Accepted: 07 September 2020;
Published: 08 October 2020.
Edited by:
Gilles Guillot, International Prevention Research Institute, FranceReviewed by:
Tom Nudds, University of Guelph, CanadaMartin Drechsler, Helmholtz Centre for Environmental Research (UFZ), Germany
Copyright © 2020 Nagy-Reis, Dickie, Sólymos, Gilbert, DeMars, Serrouya and Boutin. This is an open-access article distributed under the terms of the Creative Commons Attribution License (CC BY). The use, distribution or reproduction in other forums is permitted, provided the original author(s) and the copyright owner(s) are credited and that the original publication in this journal is cited, in accordance with accepted academic practice. No use, distribution or reproduction is permitted which does not comply with these terms.
*Correspondence: Mariana Nagy-Reis, bmFneS5yZWlzQHVhbGJlcnRhLmNh; Melanie Dickie, bXZlemluYUB1YWxiZXJ0YS5jYQ==
†These authors have contributed equally to this work