 Andrew L. Macumber
 Helen M. Roe
 Stephen V. Prentice
 Carl D. Sayer
 Helen Bennion
 Jorge Salgado
- 1School of Natural and Built Environment, Queen’s University Belfast, Belfast, United Kingdom
- 2Pond Restoration Research Group, Environmental Change Research Centre, Department of Geography, University College London, London, United Kingdom
- 3Environmental Change Research Centre, Department of Geography, University College London, London, United Kingdom
- 4Facultad de Ingeniería, Universidad Católica de Colombia, Bogotá, Colombia
- 5School of Geography, University of Nottingham, Nottingham, United Kingdom
We review the potential for applying traits-based approaches to freshwater testate amoeba, a diverse protist group that are abundant in lakes and are valuable ecological indicators. We investigated the efficacy of geometric morphometric analysis to define Arcellinida test size and shape indices that could summarize freshwater testate amoeba community dynamics along a temporal gradient of eutrophication in Loch Leven, Scotland (United Kingdom). A cluster analysis of test size and shape indices yielded three clusters, each dominated by a single shape: elongate, spherical and ovoid. When plotted stratigraphically, we observed increases in spherical tests, decreases in elongate tests and shrinking of test size coeval with eutrophication in Loch Leven. Decreases in the elongate cluster may reflect benthic conditions with reduced oxygen levels, while increases in the spherical cluster are likely associated with an expanding macrophyte community that promoted pelagic and epibiotic life habits. Shrinking of test size may be a stress response to eutrophication and/or warming temperatures. Tracking community dynamics using test size and shape indices was found to be as effective as using species-based approaches to summarize key palaeolimnological changes, with the added benefits of being free from taxonomic bias and error. The approach thus shows significant potential for future studies of aquatic community change in nutrient impacted lakes.
Introduction
The ever-increasing impact of humans on their environment via urbanization, industrialization and climate change has led to an 80% decline in freshwater biodiversity in the last 50 years (Grooten and Almond, 2018). This emphasizes the need to model the trajectory of impacted natural freshwater systems. Lakes being complex natural systems are best understood by characterizing multiple proxies representing various levels of biological organization and assessing how their functional interactions vary through time and space (Blois et al., 2013).
Testate amoeba are a diverse protist group that enclose their cell body within a test (i.e., a hard shell) that can be used to identify species and preserves well in sediments. They are valuable ecological indicators due to their (1) abundance in freshwater, moist soils and wetlands; (2) sensitivity to environmental conditions; (3) high preservation potential; and (4) rapid generation times (Patterson and Kumar, 2002; Mitchell et al., 2008). In lakes, lobose testate amoeba dominate (i.e., Arcellinida) and have been used as indicators for: lake acidity (Kumar and Patterson, 2000; Patterson et al., 2013); land-use change (Patterson et al., 2002); industrial impacts (Nasser et al., 2016); water quality (Roe et al., 2010); ecosystem health and seasonal environmental change (Neville et al., 2011); nutrient loading (Patterson et al., 2012; Prentice et al., 2018); and climate change (McCarthy et al., 1995; Boudreau et al., 2005), amongst other variables.
Arcellinida studies typically present community dynamics by tracking the abundances of multiple species. The expertise required to identify Arcellinida species and associated taxonomic error and bias limits the comparability of the results (Lamentowicz et al., 2015). Summaries of the ecological function of the group (e.g., life habits, metabolism), as tracked by functional traits, has the potential to offer a complementary approach and potentially provide more robust predictions that could translate across time and space (Blois et al., 2013; Lamentowicz et al., 2015; Marcisz et al., 2020). The success of using functional traits, rather than species abundances, to track community dynamics is demonstrated by studies of peatland testate amoeba where researchers have modeled the response to drier climates (Fournier et al., 2015), autogenous plant succession from lake to bog (Lamentowicz et al., 2015) and peatland disturbance (Jassey et al., 2016; Marcisz et al., 2016). van Bellen et al. (2017) also demonstrated that water table depth reconstructions (i.e., transfer functions) based on functional traits were comparable to species-based reconstructions. Unlike their peatland counterparts, the functional ecology of lake Arcellinida is poorly understood.
Based on four morphological traits (pseudopod characteristics, presence of gas vacuoles, test compression and test composition) Arrieira et al. (2015) observed that functional diversity of Arcellinida communities from the upper Paraná River floodplain, Brazil were controlled by nutrient dynamics. Lansac-Tôha et al. (2014) characterized habitats of Guaraná Lake, Brazil (i.e., epipelic, epibiotic, and planktic) based on the relative abundance of three Arcellinida test morphologies: elongate, spherical and hemispherical. These modern ecological studies highlight the promise of using Arcellinida functional traits to summarize their ecological function in lakes. One property that both studies share with species-based approaches is they all transform a continuous variable (i.e., test morphology) in to a discrete one (i.e., groupings and labels). Morphological variability was shown to be effectively continuous, with many transitional forms blurring the boundaries between morphotypes (Bobrov and Mazei, 2004). It is still uncertain whether this inherent morphological plasticity (i.e., phenotypic plasticity) is completely random (Wanner, 1999), an adaptive response to variable environmental conditions (Bobrov and Mazei, 2004) or perhaps species specific. Thus, there is value in capturing morphological variation as a continuous variable to preserve potential environmental signals present in the many transitional forms.
Geometric morphometric analysis has been applied successfully to characterize continuous shape variation in a number of biological and paleontological studies (Zelditch et al., 2012; Adams et al., 2013), including for other shelled microfossil groups (e.g., diatoms; Beszteri, 2005). Macumber et al. (2020) used geometric morphometric analysis to demonstrate that two novel clades of Arcellinida could be differentiated based on test size. Shapes are defined by the geometric configuration of landmarks (fixed anatomically definable locations found on all specimens) and by boundary curves drawn between the landmarks (Zelditch et al., 2012). Geometric morphometric analysis of similarly shaped specimens (i.e., Arcellinida tests) models a morphological space where each test (i.e., shape) occupies a unique place, providing continuous measures of morphological variability (Zelditch et al., 2012). A generalized Procrustes analysis removes variation due to differences in size and orientation, capturing size variation as an independent variable. Multivariate statistical methods can test for shape differences among groups, covariation between shape and other continuous variables and visualize patterns of shape variation (Adams et al., 2013).
As the functional ecology of lake Arcellinida is poorly understood there is value in using continuous measures of morphological variation (i.e., geometric morphometric analysis) to highlight important Arcellinida test traits that are associated with environmental change. Highlighted traits could form the basis of future functional trait studies of lake Arcellinida. We investigated a previously described Arcellinida assemblage from a lake sediment core collected from Loch Leven, Scotland, a large shallow lake which has a well documented history of nutrient enrichment and associated biological change (Salgado et al., 2010; Prentice et al., 2018). Our aims were to (1) characterize test morphological variability in response to environmental change, specifically lake eutrophication induced shifts in the macrophyte community; (2) test the efficacy of geometric morphometric analysis in summarizing community dynamics as compared to conventional paleoecological (i.e., species- and assemblage based) approaches; (3) identify inter- and intraspecific variability in relation to the observed changes in test size and morphology; and (4) make basic inferences regarding the role of shape and size in Arcellinida ecology.
Materials and Methods
Study Site
Loch Leven situated in central Scotland (56°11′55″ N, 3°22′46″ W), is a large (13.3 km2), shallow (mean = 3.9 m, max = 25.4 m), lowland (107 m.a.s.l) freshwater lake (Figure 1). It is moderately eutrophic, with mean annual average total phosphorus and chlorophyll a concentrations (2008–2010) of 33 and 21 μg L–1, respectively (Dudley et al., 2012). There are four inflows sourcing water from farms, villages and the nearby town of Kinross (population ∼5000).
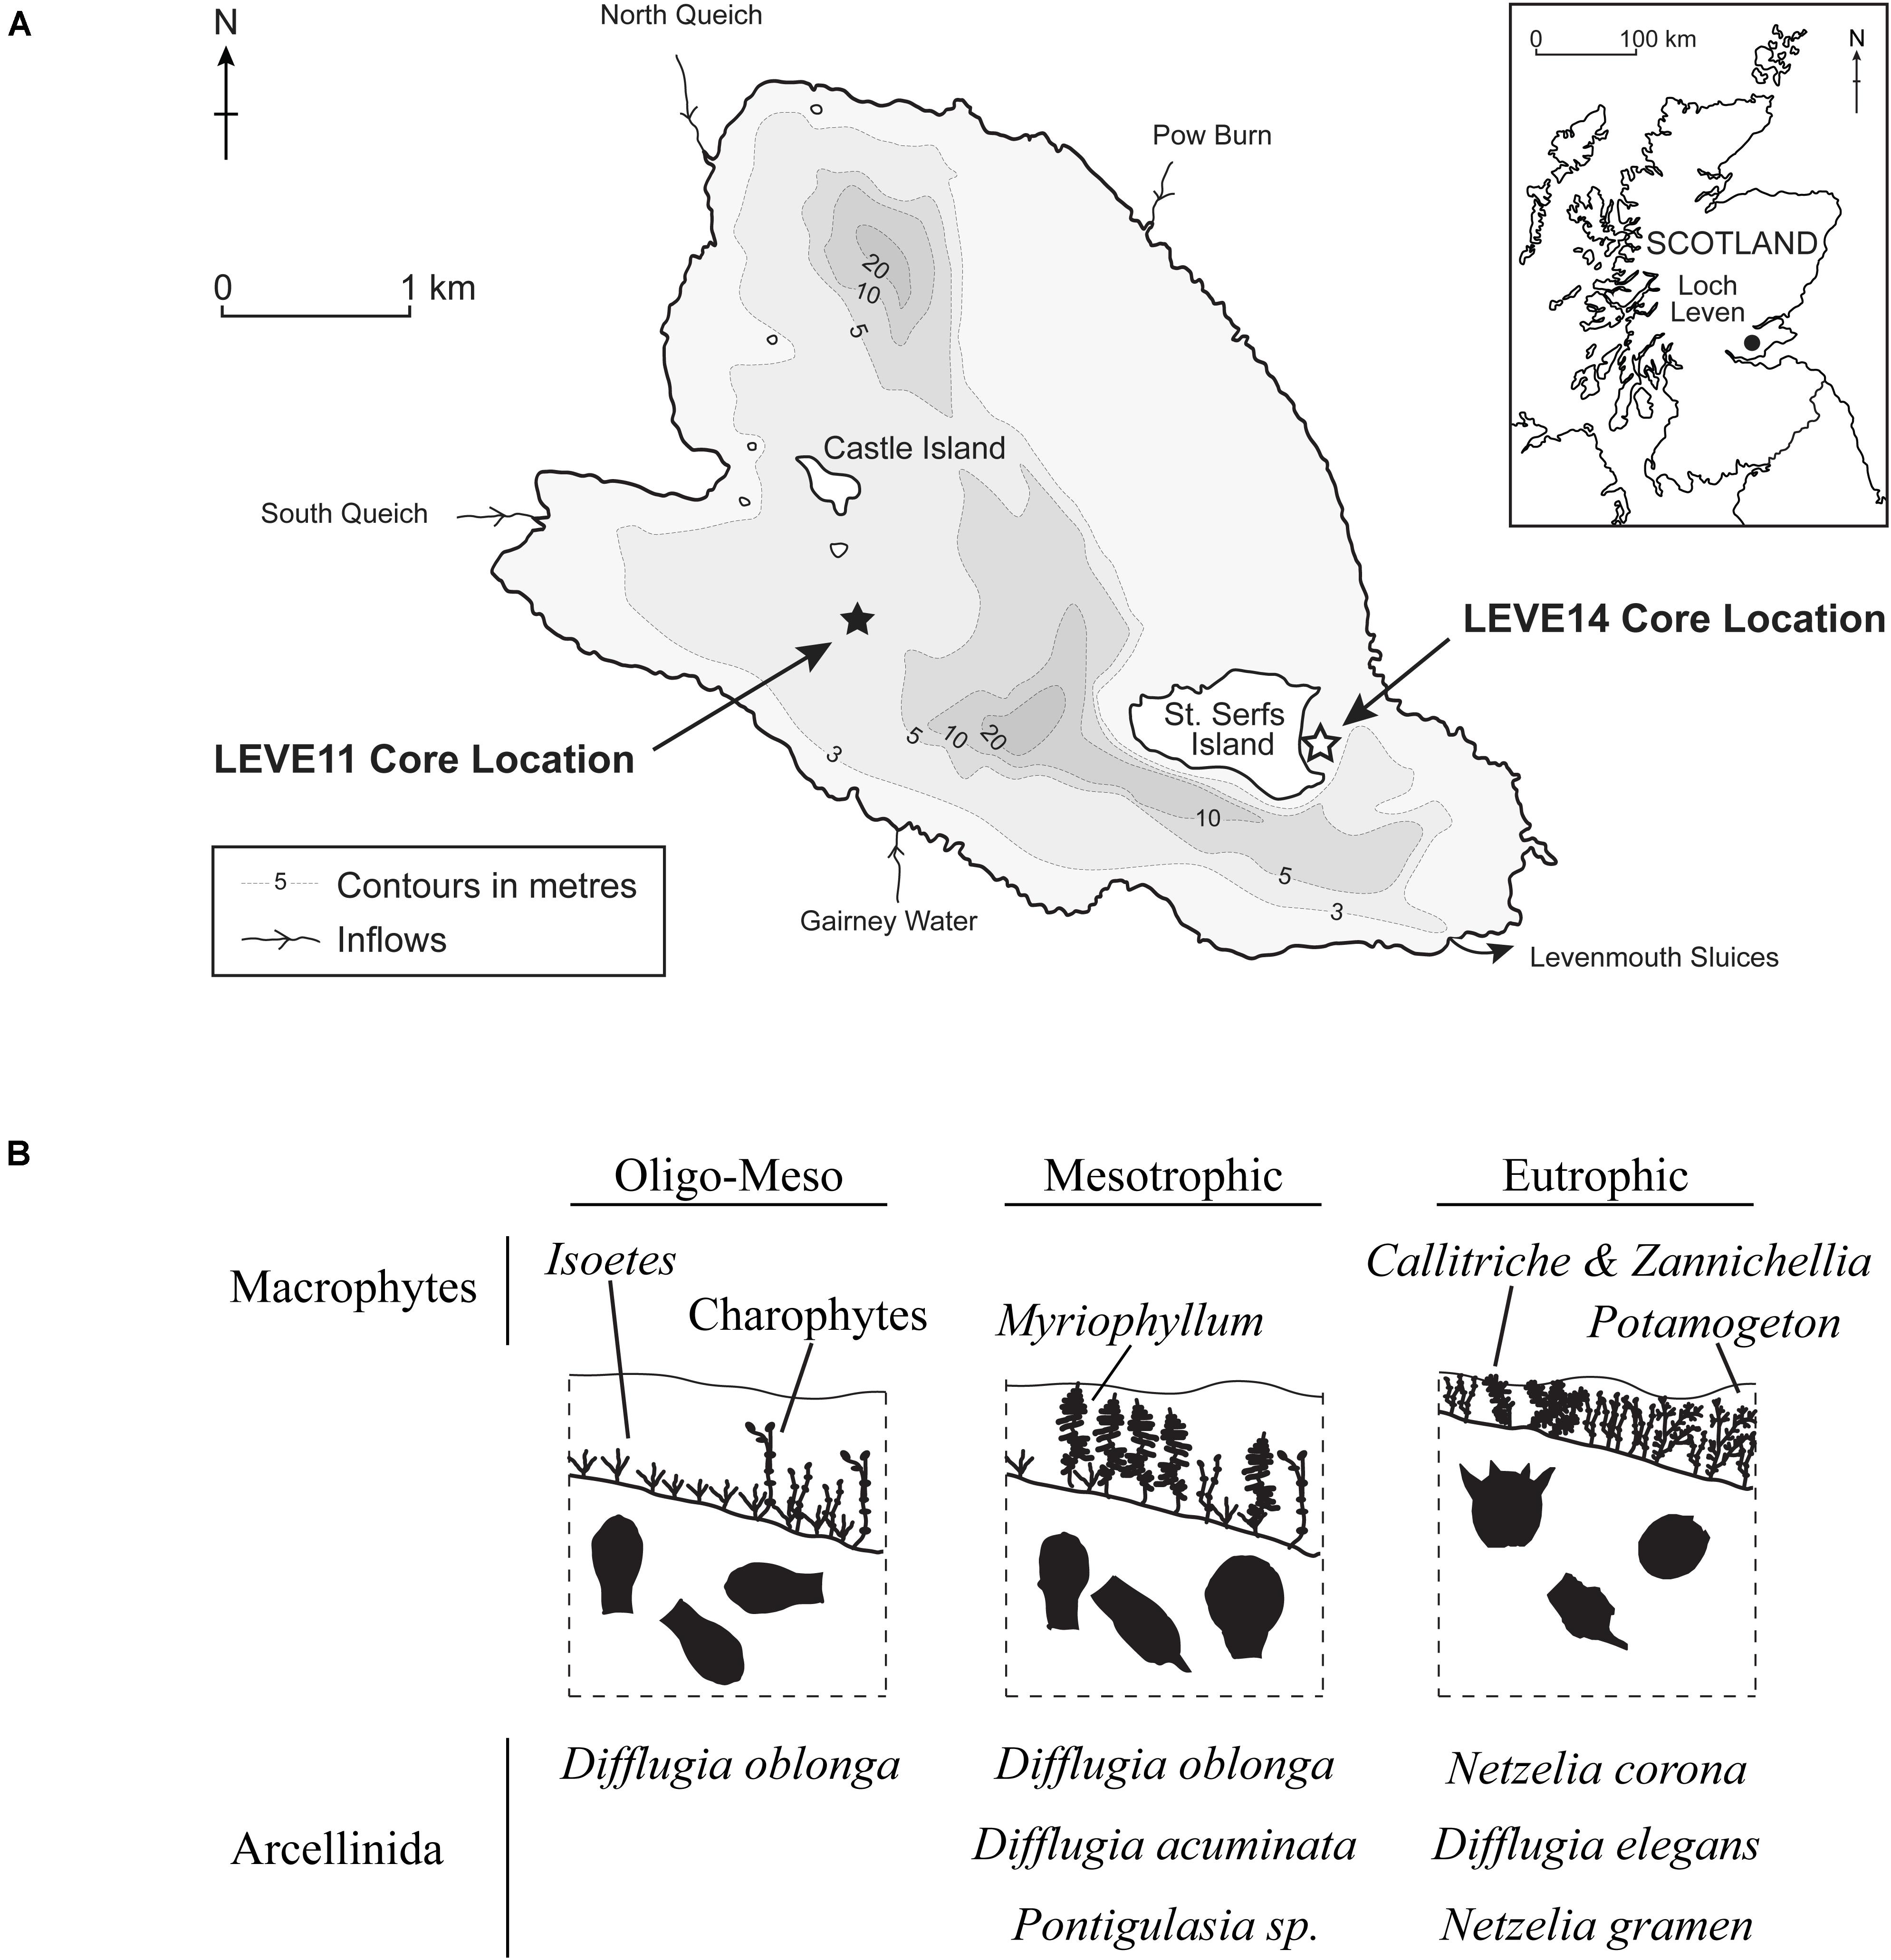
Figure 1. (A) Map showing the location and bathymetry of Loch Leven and the locations of sediment cores from previous studies of plant macrofossils (LEVE14) (Salgado et al., 2010), testate amoebae (LEVE14) (Prentice et al., 2018) and diatoms (LEVE11) (Bennion et al., 2012). Core LEVE14 is used in this study. (B) Three phases of progressive nutrient enrichment as inferred from plant macrofossils (Salgado et al., 2010) and testate amoeba (Prentice et al., 2018).
Core Collection
The sediment core LEVE14, previously studied by Salgado et al. (2010) and Prentice et al. (2018), was collected in shallow-water (depth = 2.2 m) using an adapted Livingstone (7.4 cm diameter) piston corer in May 2006 near the eastern shore of St. Serf’s Island in the southeast corner of Loch Leven (Figure 1). The 141-cm core was extruded (i.e., subsampled) in the field at 1-cm intervals.
Chronology
The core was dated radiometrically (210Pb, 226Ra, and 137Cs isotope analysis) using thirteen sediment samples from the top 60 cm (Salgado et al., 2010) using standard methods (Appleby and Oldfield, 1978). The 210Pb chronology suggests a constant sedimentation rate from the late 1920s through the late 1990s (0.29 cm year–1), although this increased to 1.1 cm year–1 from the early 2000s (Salgado et al., 2010). Extrapolation of this sedimentation rate would give a basal date of AD 1492 (Salgado et al., 2010).
To extend the age depth model, Prentice et al. (2018) obtained three samples for AMS 14C radiocarbon dating: bulk sediment from 68 to 69 cm (1882 ± 37 year BP), a charcoal sample from 96 to 97 cm (827 ± 34 year BP) and bulk sediment from 134 to 135 cm (2420 ± 34 year BP). The sedimentation rate based on the charcoal date (0.11 cm year–1) estimates a basal date of AD 828. Unfortunately, the AMS 14C dates do not correspond well with the extrapolated 210Pb chronology (see Prentice et al., 2018 for further discussion). Interpretation of the ages is further compounded by a lithostratigraphic change between 120 and 90 cm. Thus, estimating ages for depths greater than 90 cm in the core is contentious, but the basal part of the record is likely older than inferred by the 210Pb age-depth model.
Lithology
Fifty one samples were analyzed for loss-on-ignition (LOI) by Salgado et al. (2010) and an additional eighteen samples by Prentice et al. (2018), providing the relative abundance of organic carbon, inorganic carbon and unignitable minerogenic matter (Dean, 1974). Prentice et al. (2018) completed particle size analysis (% sand, silt, clay) of forty-two samples determined by laser diffraction using a Malvern Mastersizer-2000.
Study Design
Geometric morphometric analysis of Arcellinida tests requires more analytical time than conventional Arcellinida enumeration, thus our study was limited to a subset of the 42 Arcellinida samples counted from the LEVE14 core by Prentice et al. (2018). In order to examine morphological variability at key points of change in the sediment history of Loch Leven we targeted core depths immediately above and below CONISS zone boundaries (Grimm, 1987) defined by Prentice et al. (2018). We iteratively compared the CONISS zones based on sample subsets to the zones identified by Prentice et al. (2018) and continued to increase the number of samples in our subset until both agreed. This occurred with a subset of 14 samples (see Supplementary Table S1 and Supplementary Figure S1).
Arcellinida Identification
We enumerated Arcellinida tests from uncounted subsamples from core LEVE14 interval splits [see Prentice et al. (2018) for details of subsample preparation]. Arcellinida tests were quantified in aqueous solution using a Nikon light dissection binocular microscope at x50-93 magnification with reference to various identification keys and published images (Supplementary Table S2). Our taxonomic approach differs from Prentice et al. (2018) who employed a strain-based taxonomic approach (Patterson and Kumar, 2002). All specimens in our study were matched with a previously described species; this resulted in some inconsistencies and highlights some of the difficulties with species-based approaches (Supplementary Table S2). We identified individual specimens until our total counts were enough to pass the inflection points of the accumulation curves (see Supplementary Figure S1).
Geometric Morphometric Analysis
We used a modified geometric morphometric protocol based on MacLeod (2008) and Zelditch et al. (2012) to capture shape and size indices for the Arcellinida tests. Geometric morphometric analysis creates a shape space in which the morphology of each specimen in a dataset is represented as a unique point and every other point in the shape space represents a hypothetical transitional morphology. Trends in shape variation are reduced to principal components [via principal component analysis (PCA)], the scores from which can be illustrated as hypothetical shape models. It should be noted that because landmarks need to be consistently placed on each specimen (see Figure 2) only similarly shaped specimens could be included in the dataset. We therefore focused on Arcellinida species whose test have terminal apertures, and tests that could not be oriented in a consistent manner (e.g., Centropyxidae taxa which are characterized by angled apertures and a random distributions of spines) were excluded from the study.
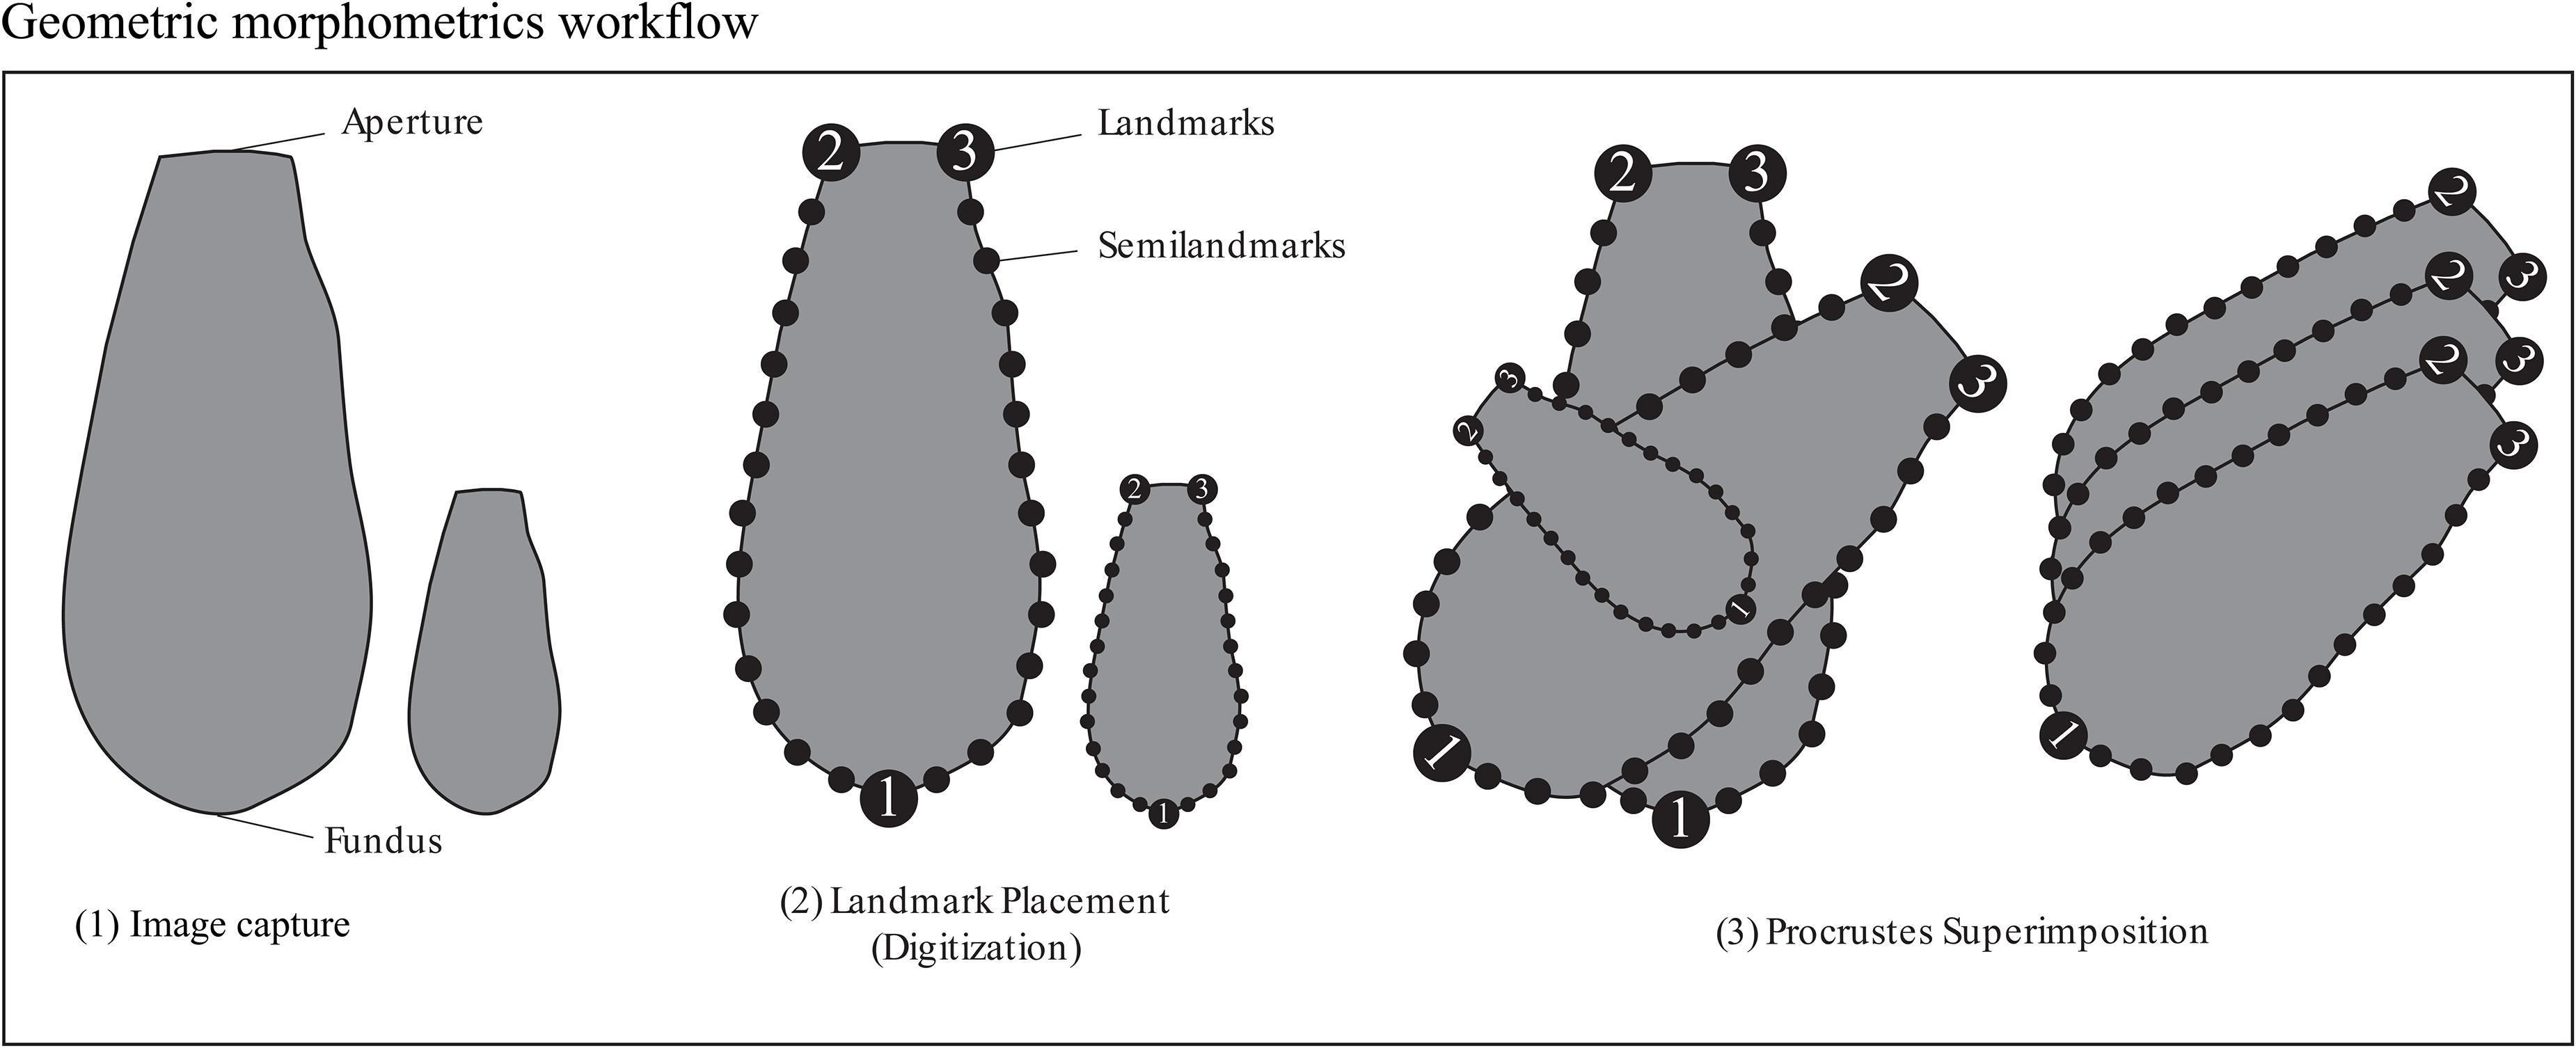
Figure 2. Figure illustrating placement of landmarks and semilandmarks for the geometric morphometric analyses Procrustes-PCA and Aperture-PCA. The line drawings are not to scale.
Arcellinida tests (n = 1505) were photographed in aqueous solution using a digital camera mounted to a Nikon binocular dissecting light microscope at x93 magnification. Images were digitized using the tps series of software (Rohlf, 2015). We chose three landmark locations on the outer wall of each specimen that could be consistently identified: (1) at the furthest point of the fundus away from the aperture, (2) the left edge of the aperture and (3) the right edge of the aperture (Figure 2). Semilandmarks can be anchored and equally spaced between landmarks and are ideal for tracking curves. Two sets of thirteen equally spaced semilandmarks were anchored between landmarks 1 and 2 and landmarks 1 and 3 (Figure 2). The combination of landmarks and semilandmarks were used to quantify variability related to test vertical elongation, horizontal widening and tapering.
Statistical Analysis
To capture size indices for the Arcellinida tests we carried out a Procrustes superimposition on the landmark and semilandmark coordinates (Figure 2) using sliders to align all specimens and isolate size variation as an independent variable (Zelditch et al., 2012; Rohlf, 2015). Size variation was quantified as the square root of the non-weighted sum of squared distances from the joint centroid (MacLeod, 2008).
To capture shape indices for the Arcellinida tests we modeled the Arcellinida test shape space through a PCA of the Procrustes superimposed landmarks using the “geomorph” R-package (Adams and Otarola-Castillo, 2013). We excluded all principal components that described less than 5% of the variance as this was less than the error of geometric morphometric analysis (see below).
We used a Procrustes ANOVA to characterize error and assess the repeatability of our imaging and landmark placement (Fruciano, 2016). We used Arcellinida tests isolated from a subsample at 80 cm core depth as our test group following the protocol illustrated in Supplementary Figure S2. To quantify the repeatability of our imaging method we compared the mean square error between image replicates (Supplementary Figure S2 and Supplementary Table S3). To quantify the repeatability of our landmark placement we compared the mean square error between landmark placement replicates (Supplementary Figure S2 and Supplementary Table S3). Both the imaging and landmark placement had repeatability measures greater than 95%.
To summarize the principal components of the Procrustes PCA into groupings based on shape indices, we visualized significant breaks in Procrustes principal component 1 and 2 scores using a Wards cluster analysis implemented with the “ward.D” method in the hclust function in the stats package (R Core Team, 2016). Before cluster analysis we created an Euclidean distance matrix using the vegdist function in the vegan package in R (Oksanen et al., 2017). Following Borcard et al. (2011), we constrained the number of clusters using the Rousseeuw quality index and the Mantel statistic. To compare within and between species trait variation (i.e., centroid size, PC1 and PC2 scores) we grouped specimens by species and displayed variance in their trait values as boxplots.
We defined temporal communities represented by the CONISS zones as defined by Prentice et al. (2018): Zone 1 (141–94 cm), Zone 2 (94–41 cm), Zone 3 (41–3 cm), and Zone 4 (3–0 cm). Using these temporal communities, we can investigate how shape (PC1 and PC2 scores) and size (centroid size) indices vary in response to eutrophication in a freshwater lake (Salgado et al., 2010; Prentice et al., 2018). To understand the contribution of intraspecific trait variance to the total within-community trait variance (sum of interspecific and intraspecific trait variance), we calculated the relative contribution of intraspecific trait variance to within-community trait variance as described by Siefert et al. (2015). To compare Arcellinida test shape (i.e., median PC1 scores) and size (i.e., median centroid size) to Arcellinida species dynamics (i.e., over time) we used a series of biplots, each representing specimen values from a temporal community representing different environmental conditions.
Results
Temporal Communities and Environmental Conditions
The palaeolimnological studies of Salgado et al. (2010) and Prentice et al. (2018) which utilized plant macrofossils and Arcellinida, respectively, identified three main long-term phases of ecological change in the Loch Leven (LEVE14) core in response to gradual eutrophication: (1) an early phase of oligo-mesotrophic conditions, (2) an intermediate phase of mesotrophic conditions which began after circa 1200 AD, and (3) an upper eutrophic phase. Prentice et al. (2018) observed a fourth phase in the testate amoeba assemblage captured in the uppermost two samples (0–3 cm). They observed a significant drop in species diversity with a coeval increase in test concentrations (tests/cc). We adopt the four phases (or zones) defined by Prentice et al. (2018) through CONISS analysis of the plant macrofossils and Arcellinida results. The four phases demarcate temporal communities each associated with different environmental conditions and hereafter referred to as Zones 1 to 4.
The sediments of Zone 1 (141–94 cm) are characterized by increasing sand content and decreasing organic matter (LOI = 1–11%) toward Zone 2. The oligo-mesotrophic conditions are characterized by tests of Difflugia oblonga Ehrenberg 1838 (Prentice et al., 2018) and isoetid (e.g., Isoetes lacustris) macrophytes (Salgado et al., 2010). Zone 2 (94–41 cm) is characterized by an increase in organic matter and decreased sand content in comparison to Zone 1. The mesotrophic conditions are characterized by a greater diversity in the Arcellinida assemblage with a decreasing trend in D. oblonga (Prentice et al., 2018) and a reduction in isoetids (Salgado et al., 2010). The sediments of Zone 3 (41–3 cm) become less sandy and continue to increase in organics toward Zone 4. The eutrophic conditions are characterized by tests of Cucurbitella tricuspis (Carter 1856) and Mediolus corona (Wallich 1864) Patterson et al., 2014 (i.e., Netzelia sp. see Supplementary Table S2), the disappearance of isoetid plants, and the proliferation of elodeid (e.g., Zannichellia palustris, Potamogeton pusillus) macrophytes. There is no change in the lithology for Zone 4 (3–0 cm) but there is a 15-fold increase in Arcellinida test concentrations compared to Zone 3 and Arcellinida diversity decreased substantially.
Geometric Morphometric Analysis
The Procrustes PCA yielded two axes of shape variation (Supplementary Table S4): principal component one (PC1) explained 72.3% and PC2 explained 13.5% of the test shape variation in the Loch Leven Arcellinida microfossil assemblages. We kept the first two principal components (PC1 and PC2) as all other principal components explained less than 5% of the shape variation, less than methodological error (Supplementary Table S3, S4).
Shape change in the Arcellinida tests along PC1 (Figure 3) represents the gradual transition from elongated specimens (negative values) to spherical specimens (positive values) as illustrated by the end-members found to the left (negative end member) and right (positive end member) of the panels in Figure 3. Important modes of change include compression of the vertical axis, widening of the horizontal axis, and the loss of a distinctive neck (Figure 3). Based on PC1 scores, the basal process-type taxa could be divided into an elongate-type (i.e., Difflugia protaeiformis Lamarck 1816 and Difflugia acuminata Ehrenberg, 1838) and the ovoid-type group (i.e., Difflugia distenda Ogden 1983 and Difflugia elegans Penard 1890). Shape change along PC2 varies between tests with wide bases and narrow apertures to tests with pointed bases and wide apertures, and effectively separates the basal process-type taxa from all other types.
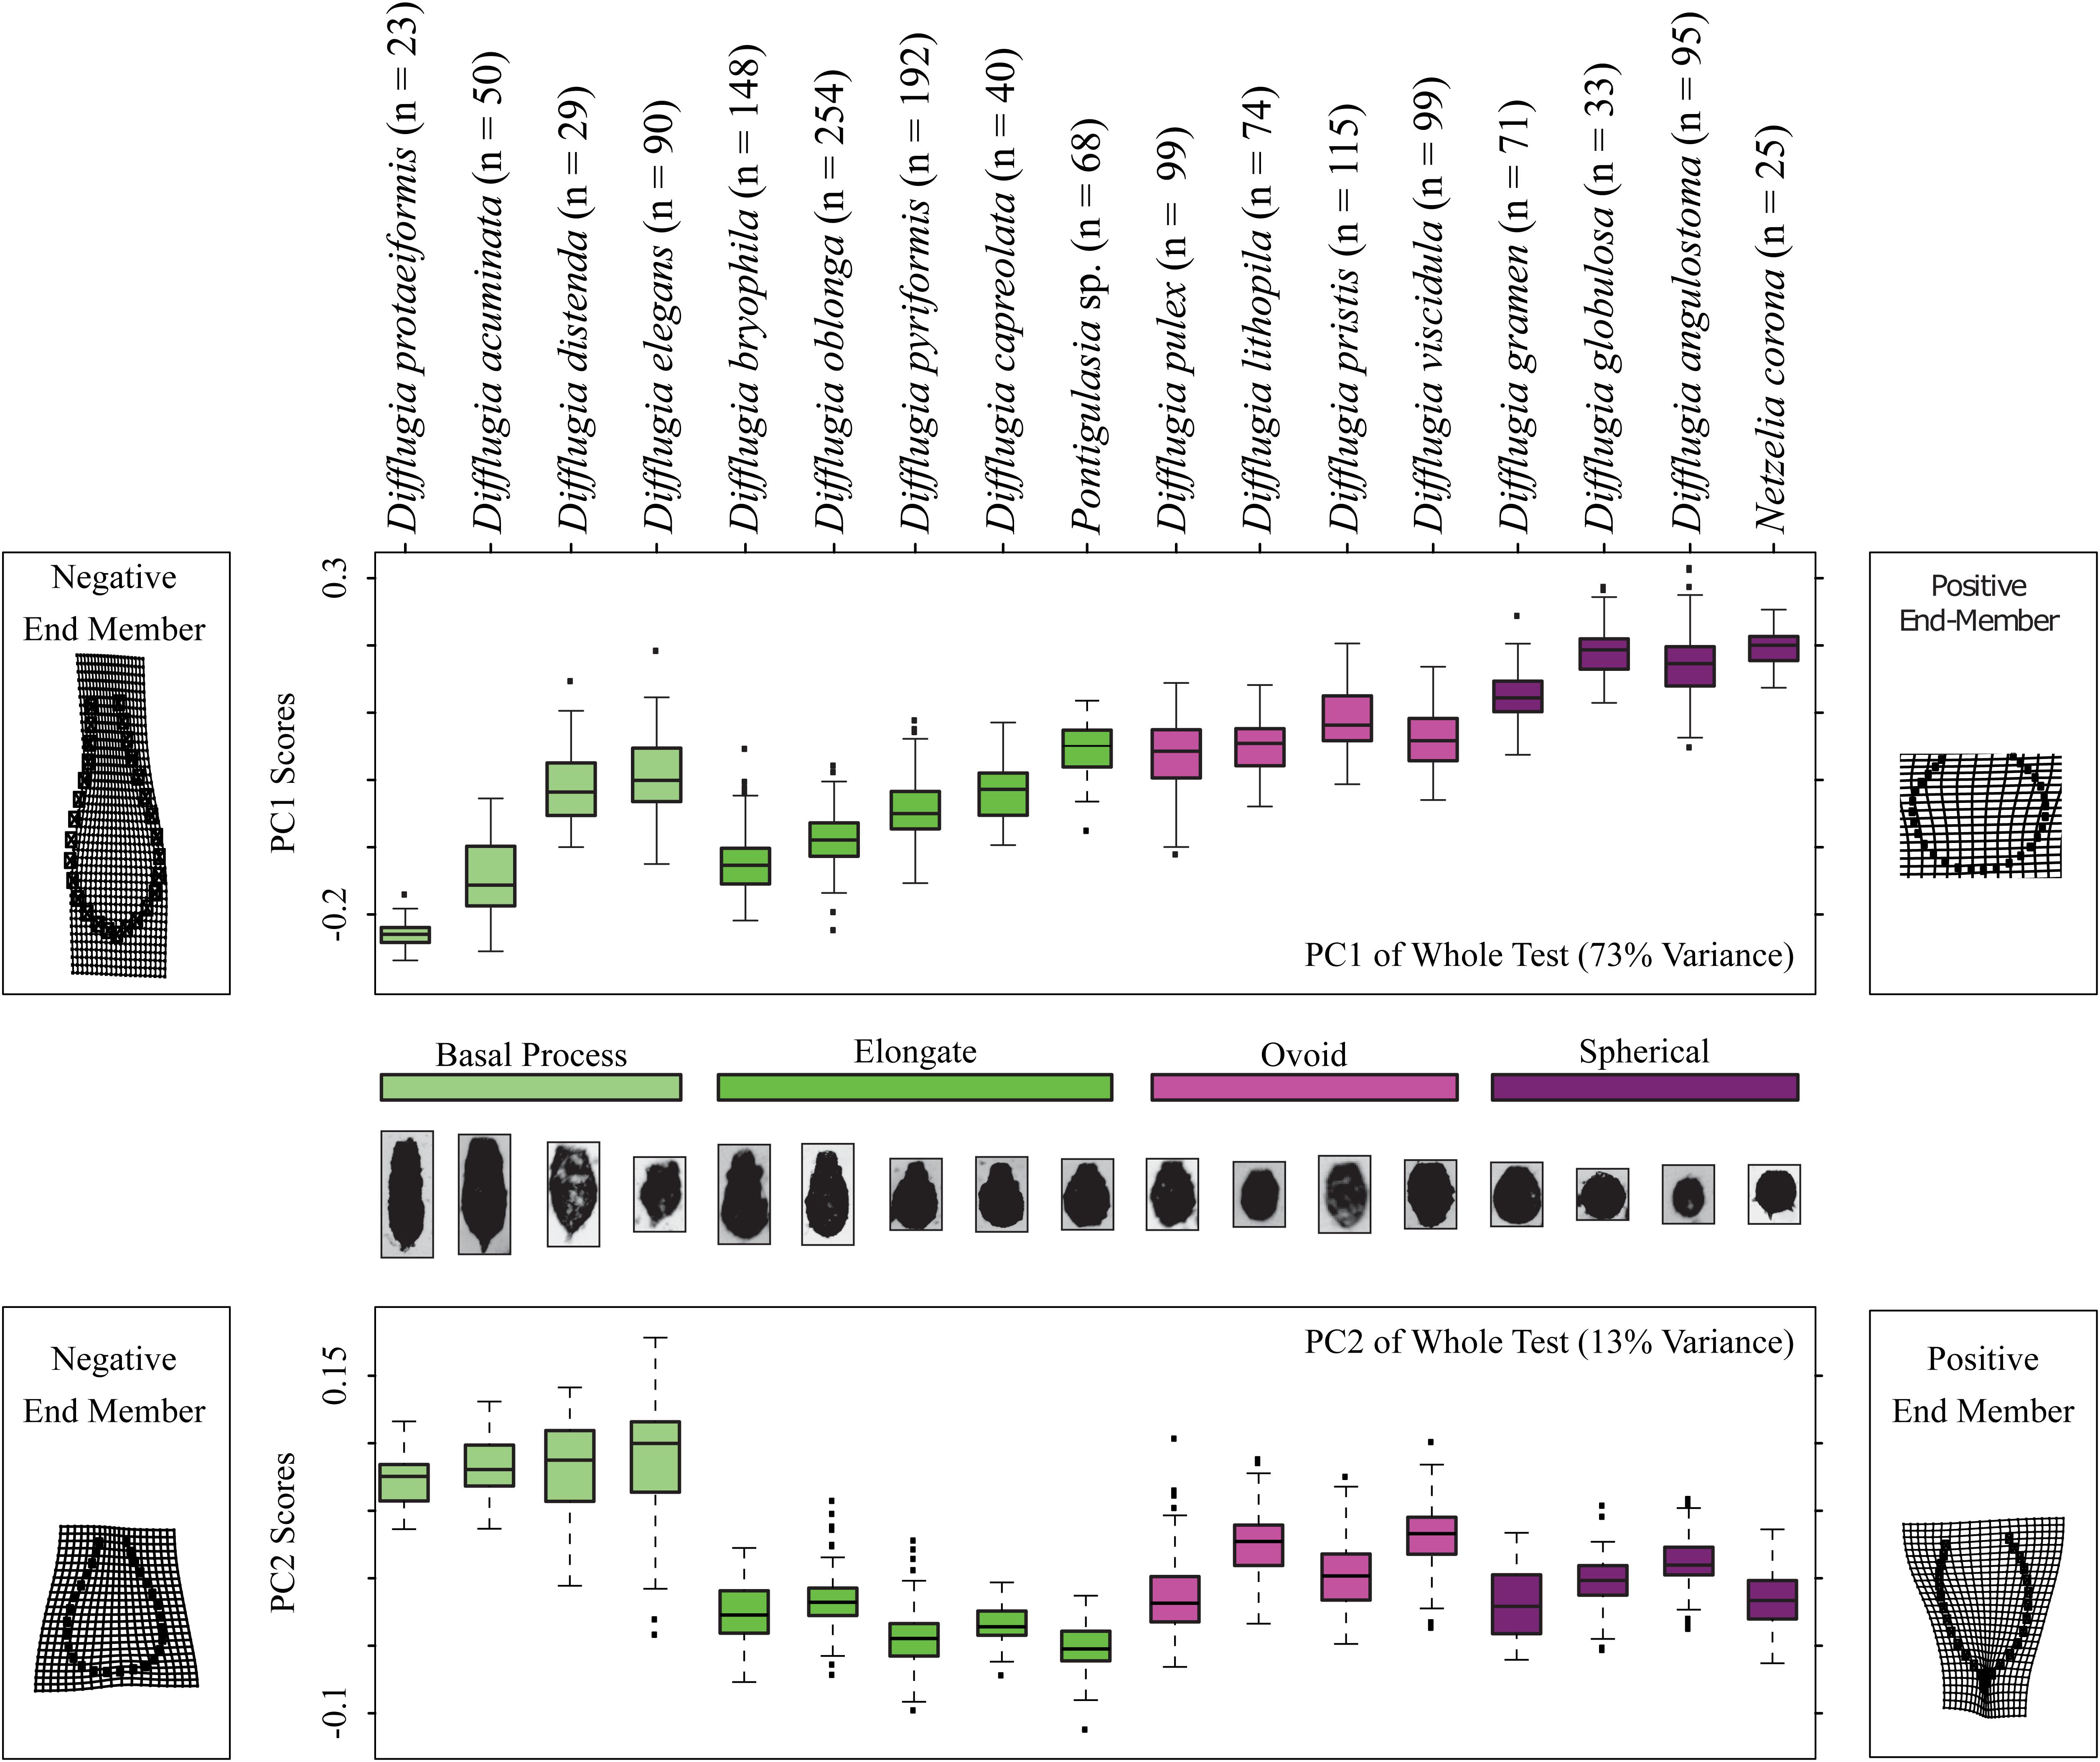
Figure 3. Boxplots showing the distributions of Procrustes Principal Component Analysis axis 1 and 2 scores, top and bottom panels, respectively, for each taxon and color coded by shape group. The models on the left and right sides of the diagrams illustrate shape end-members on deformation grids representing the deviation in shape from the mean shape. The number of specimens analyzed for each taxon is shown.
Not all taxa can be distinguished based on shape alone. For example, D. distenda and D. elegans or Difflugia lithophila Penard 1902 and Difflugia viscidula Penard 1902 can only be differentiated based on centroid size (Figure 4). Several taxa, especially the elongate type but also D. acuminata and Difflugia globulosa Dujardin 1837, have wide test centroid size ranges. The elongate-type taxa [except Difflugia bryophila (Penard 1902) Jung 1942] also have the largest test centroid sizes, as do D. protaeiformis, D. viscidula, and Netzelia corona (Wallich 1864) Gomaa et al., 2017. Ovoid-type taxa have narrow ranges and apart from D. viscidula have low mean test centroid sizes (Figure 4).
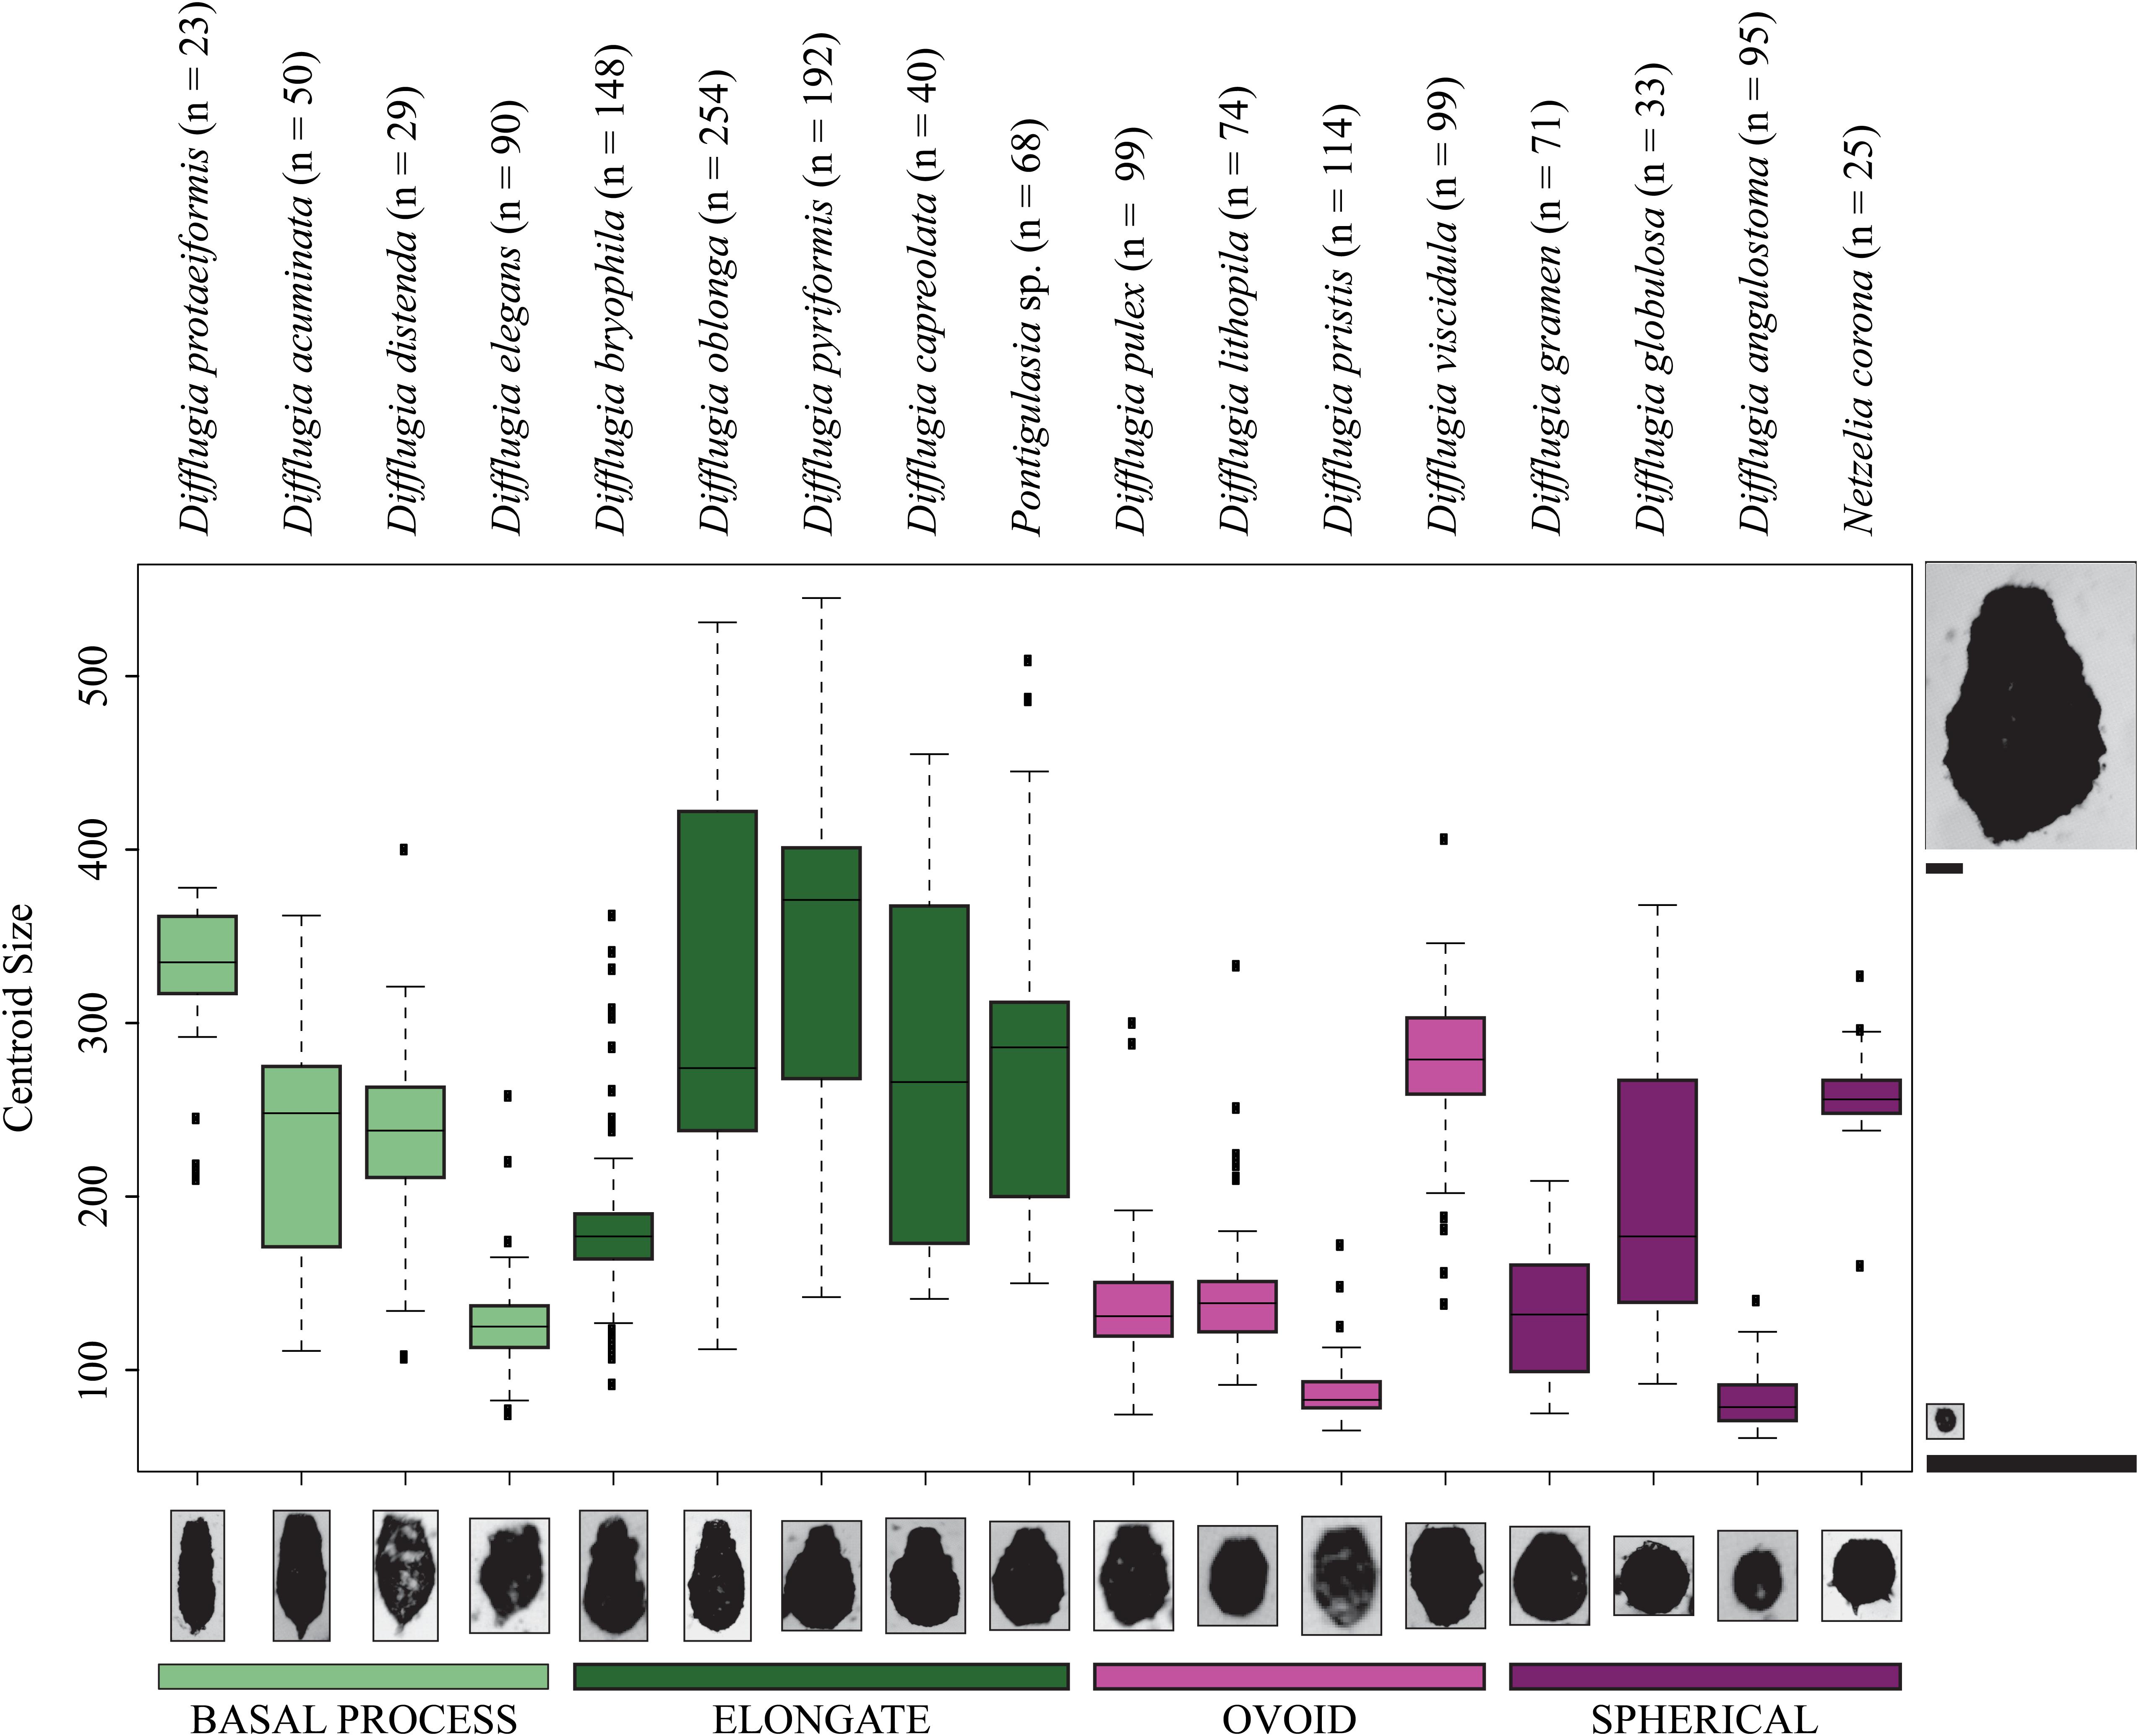
Figure 4. Boxplots showing the centroid size ranges for Arcellinida taxa. Color represents shape groups. The number of specimens analyzed for each taxon is given beside the taxon name. The images to the left and right of the figure are to scale relative to one another demonstrating the difference between the maximum and minimum centroid size. The taxon images shown along the x-axis are not to scale.
Intraspecific Trait Variation (ITV)
For each Arcellinida test trait (centroid size, PC1, PC2 scores), we calculated the contribution of intraspecific trait variation (ITV) to the total within community trait variation (i.e., the sum of intraspecific and interspecific trait variation; Figure 5).
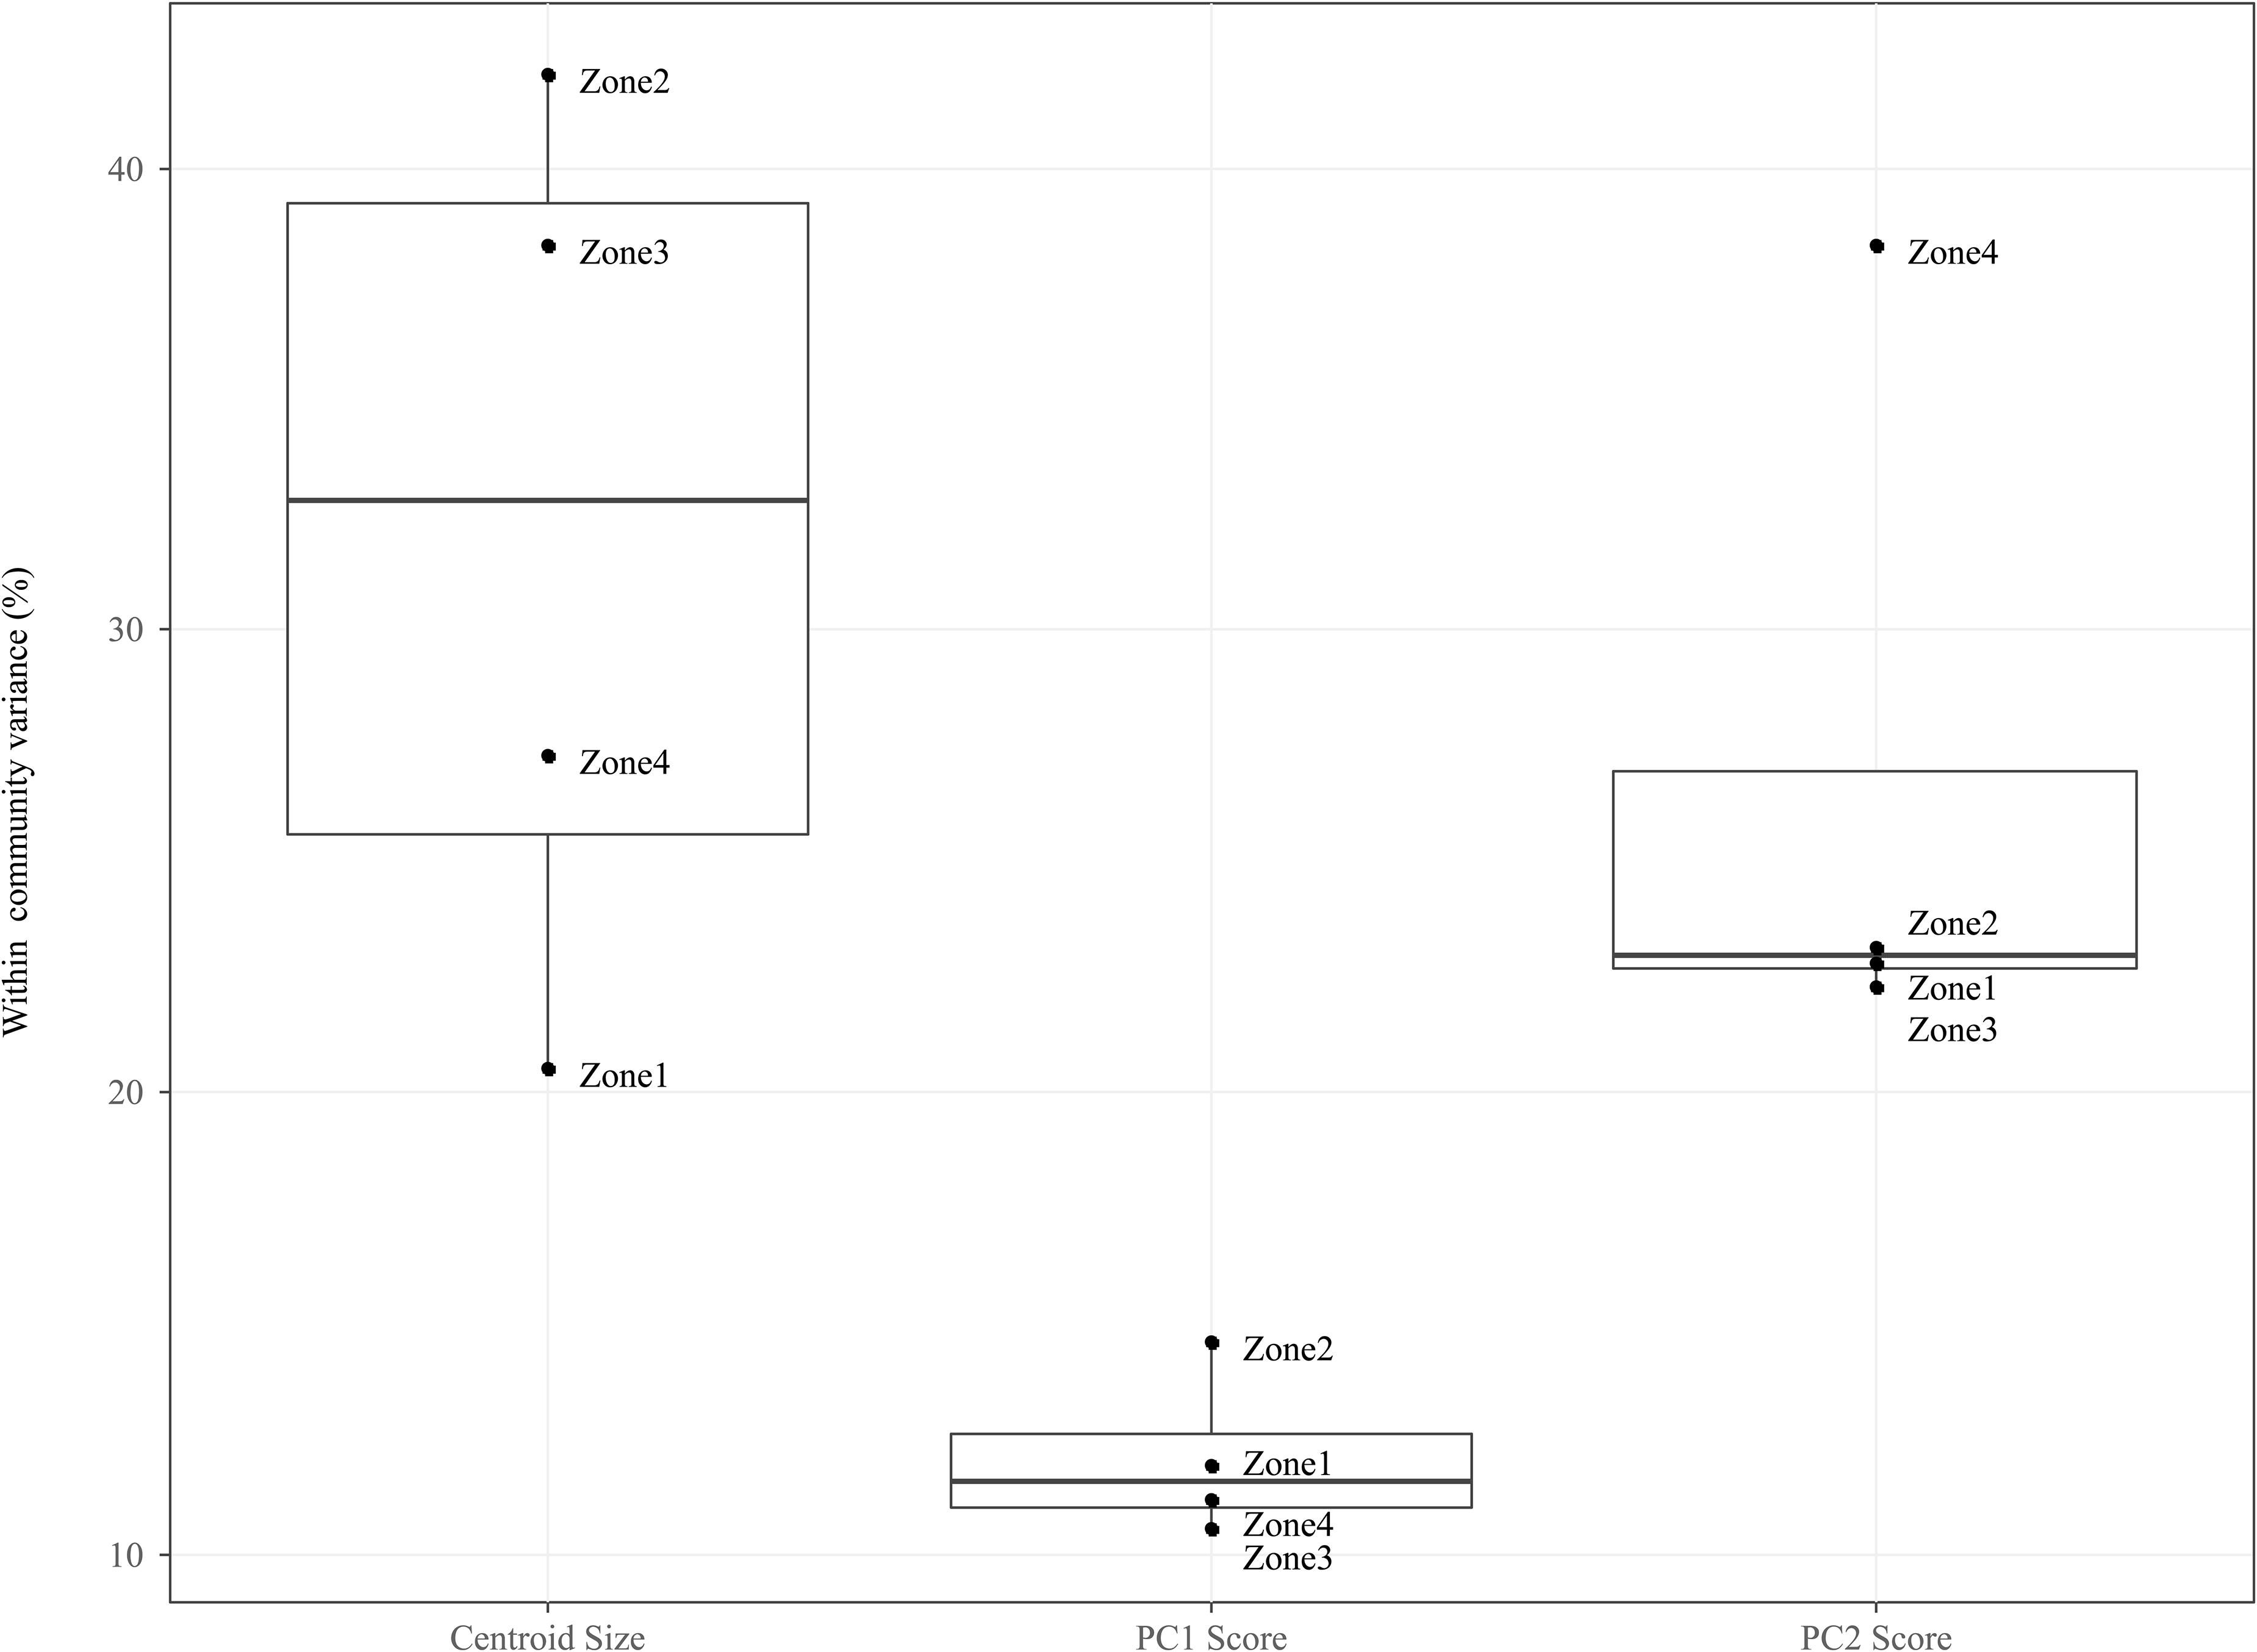
Figure 5. Boxplots comparing the mean of within community (i.e., CONISS zones) intraspecific variance grouped by traits: Centroid size, PC1 Scores and PC2 scores. For each trait we measured the intraspecific variance for each species within a temporal community and took the mean value for all species.
For the PC1 scores, ITV contributes relatively little variation to the total within community trait variation (median = 11.54%, mad = 0.01%), and this is true across all temporal communities. For the PC2 scores, ITV contribution is twice as large (median = 22.67%, mad = 0.01%) as compared to the PC1 scores, with the ITV in Zone 4 being significantly higher (mean = 38.36%) then all other communities that are clustered around the median.
When compared to the shape indices (i.e., PC1 and PC2), ITV was found to explain a greater amount of variation (median = 32.80%, mad = 10.92%) to total within community centroid size variation. In addition, the communities (i.e., Zone 1–4) form two groupings on either size of the median: Zones 1 and 4 (range = 20.52–27.29%) and Zones 2 and 3 (range = 38.32–42.01%).
Traits and Species Dynamics
Figure 6 displays the temporal communities (CONISS zones) as a series of biplots of Arcellinida species with median PC1 score along the x-axis and median centroid size along the y-axis. Interestingly, between Zone 1 to Zone 4 the average community test shape changes from a dominance of elongate-ovoid to ovoid-spherical shape types, while the average test size decreases. The greatest range in both centroid size and test shape is found in Zone 3, followed by Zone 2. Zone 1 is restricted, as compared to Zone 2 and 3, in its shape range, while Zone 4, as compared to all other zones, is restricted in both shape and size.
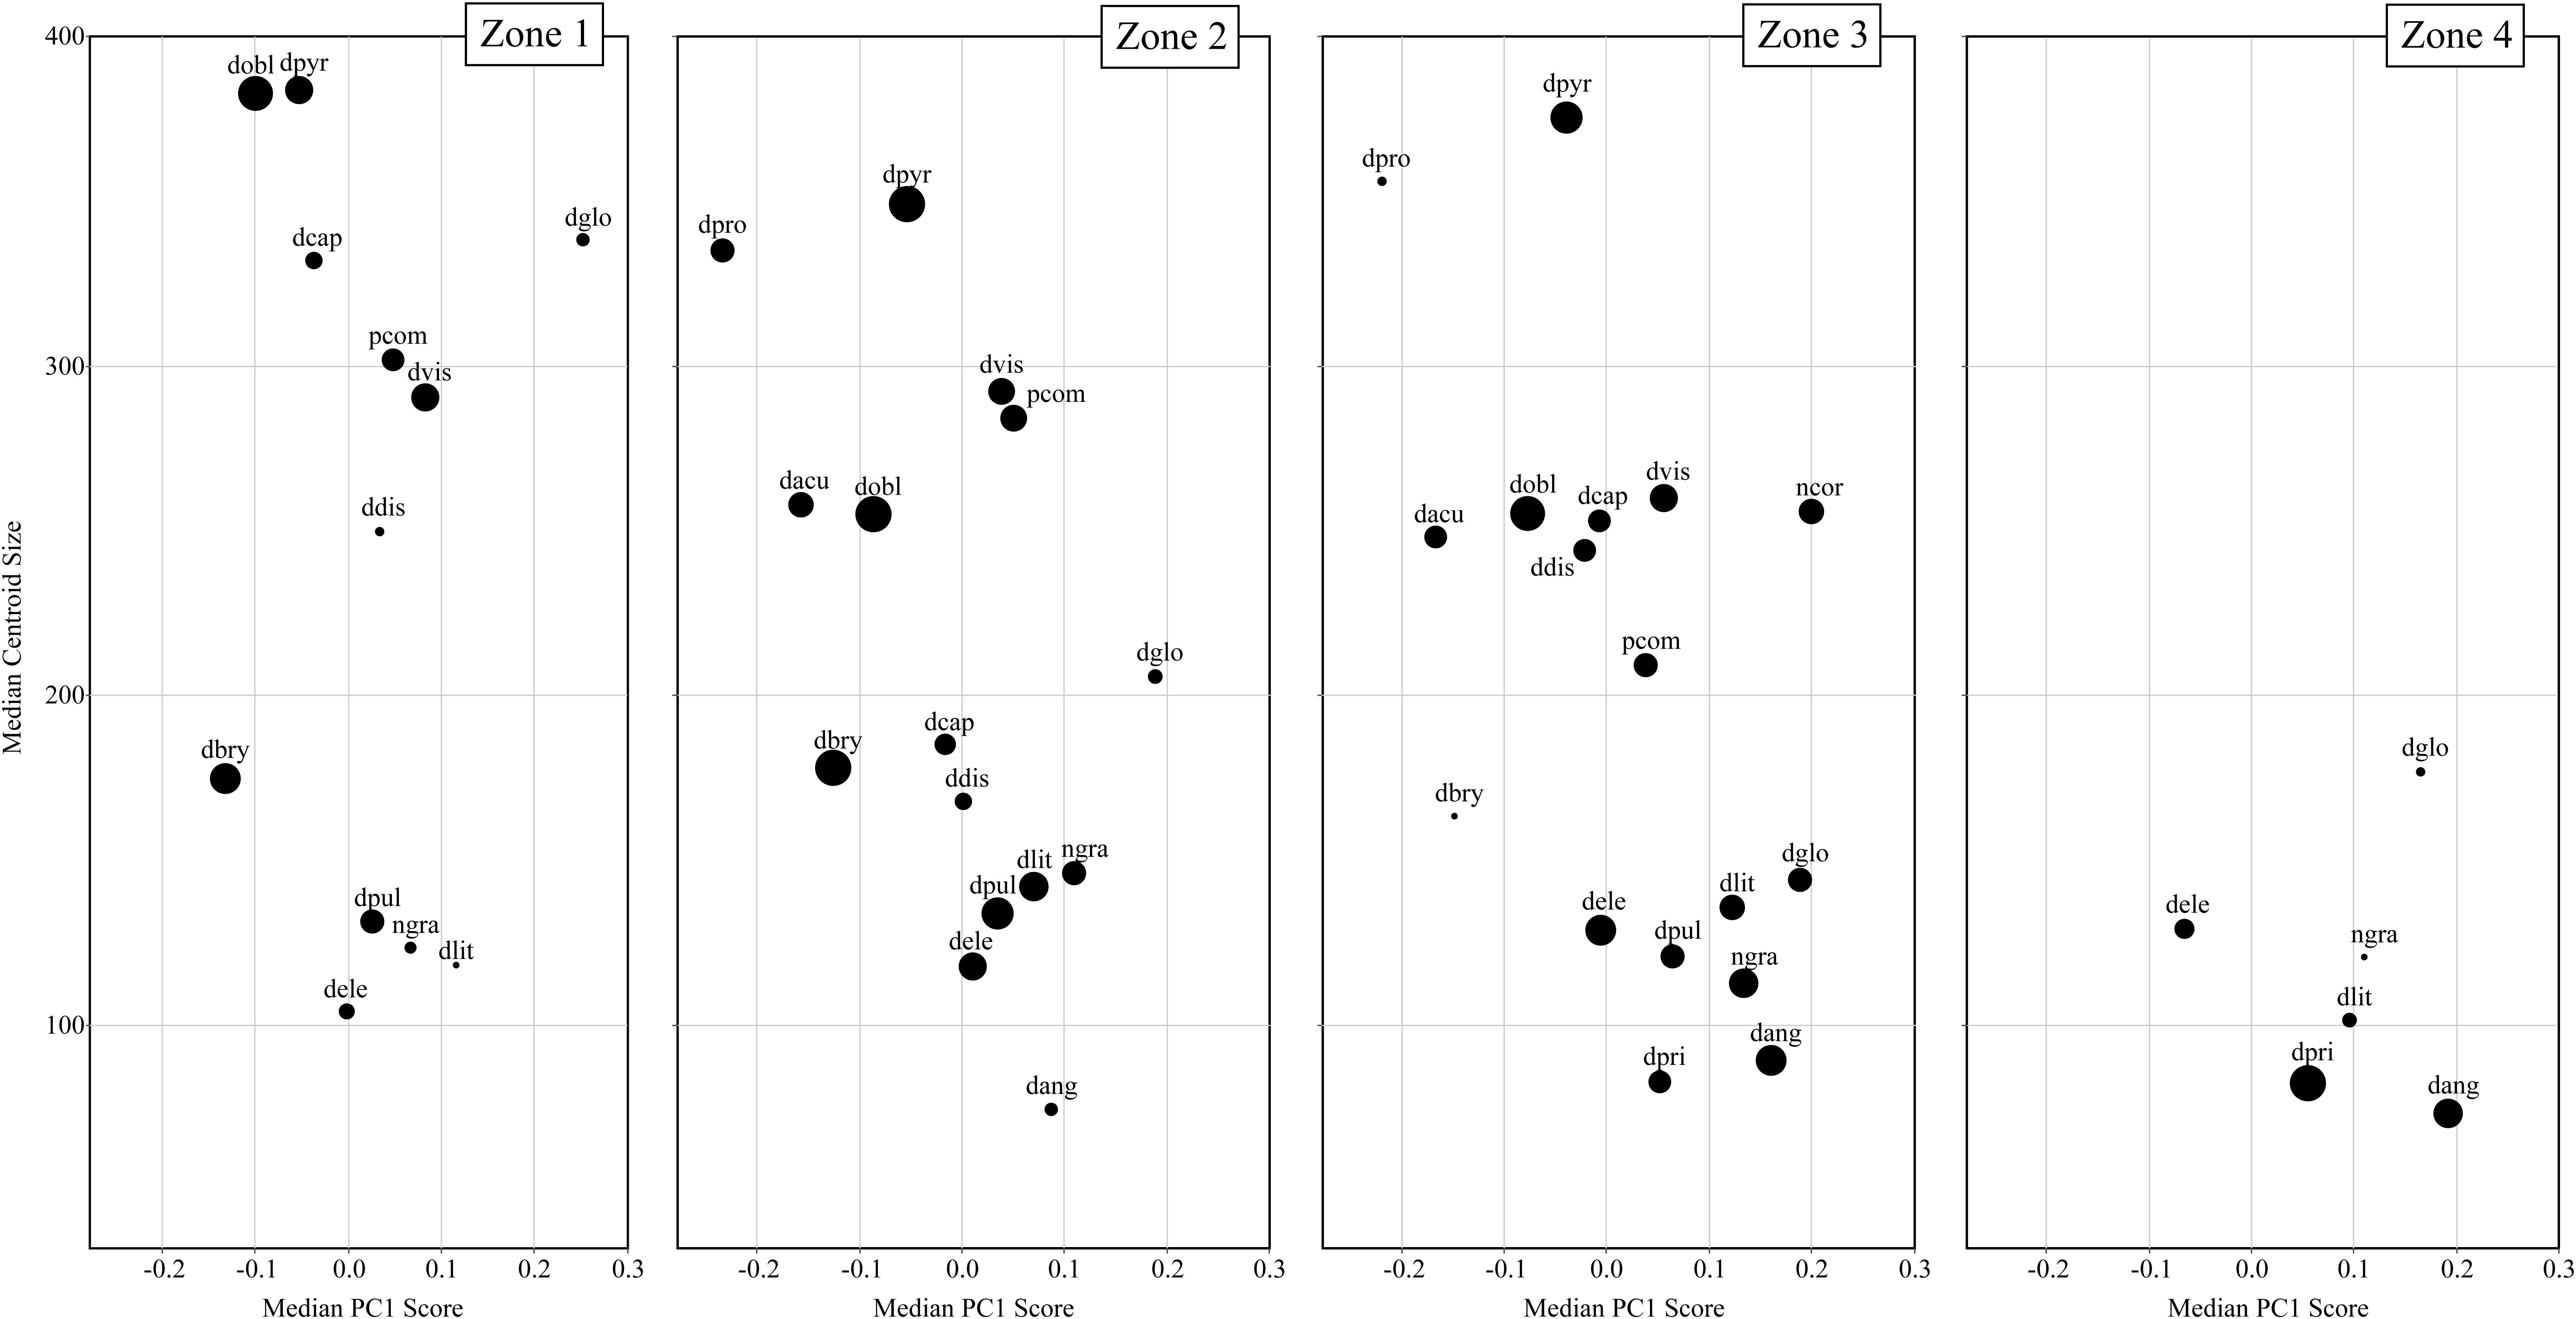
Figure 6. A series of biplots comparing median centroid size to median PC1 scores for each taxa. Each biplot is a different temporal community (i.e., CONISS zones). The size of the dots is relative to species abundance with larger dots reflecting greater relative abundances.
There are several taxa that display relatively large changes in median centroid size (e.g., Difflugia capreolata Penard 1902, D. distenda, D. globulosa and D. oblonga) as compared to the other taxa. The communities differ in their size structure, with Zone 1 comprising two groupings, large (>300) and small tests (<200); in Zone 2 there is the development of a medium test size (200–300), increased representation of the small test size and decrease in the large test size; Zone 3 continues the trend seen in Zone 2, with a further decrease in large tests and an increase in the number of medium sized taxa; finally in Zone 4 both large and medium tests are not found and only small tests remain.
Cluster Analysis
Cluster analysis on the Procrustes PC1 and PC2 scores divided the dataset into three test shape clusters (Figure 7). Each cluster is dominated (and so named) by a shape-group (i.e., Elongate, Ovoid and Spherical). The cluster analysis further divides the basal process shape group between the Elongate (30%) and Ovoid (69%) clusters. This distinction of taxa based on a simplified morphological descriptor reliably represented the cluster assignment (e.g., elongate-type taxa were assigned to the Elongate cluster); however, several exceptions exist: D. acuminata, D. capreolata, Netzelia gramen (Penard 1902) Gomaa et al. (2017), D. globulosa and Difflugia angulostoma Gauthier-Lièvre and Thomas (1958) (Figure 7). Cluster analysis divides these taxa into several clusters.
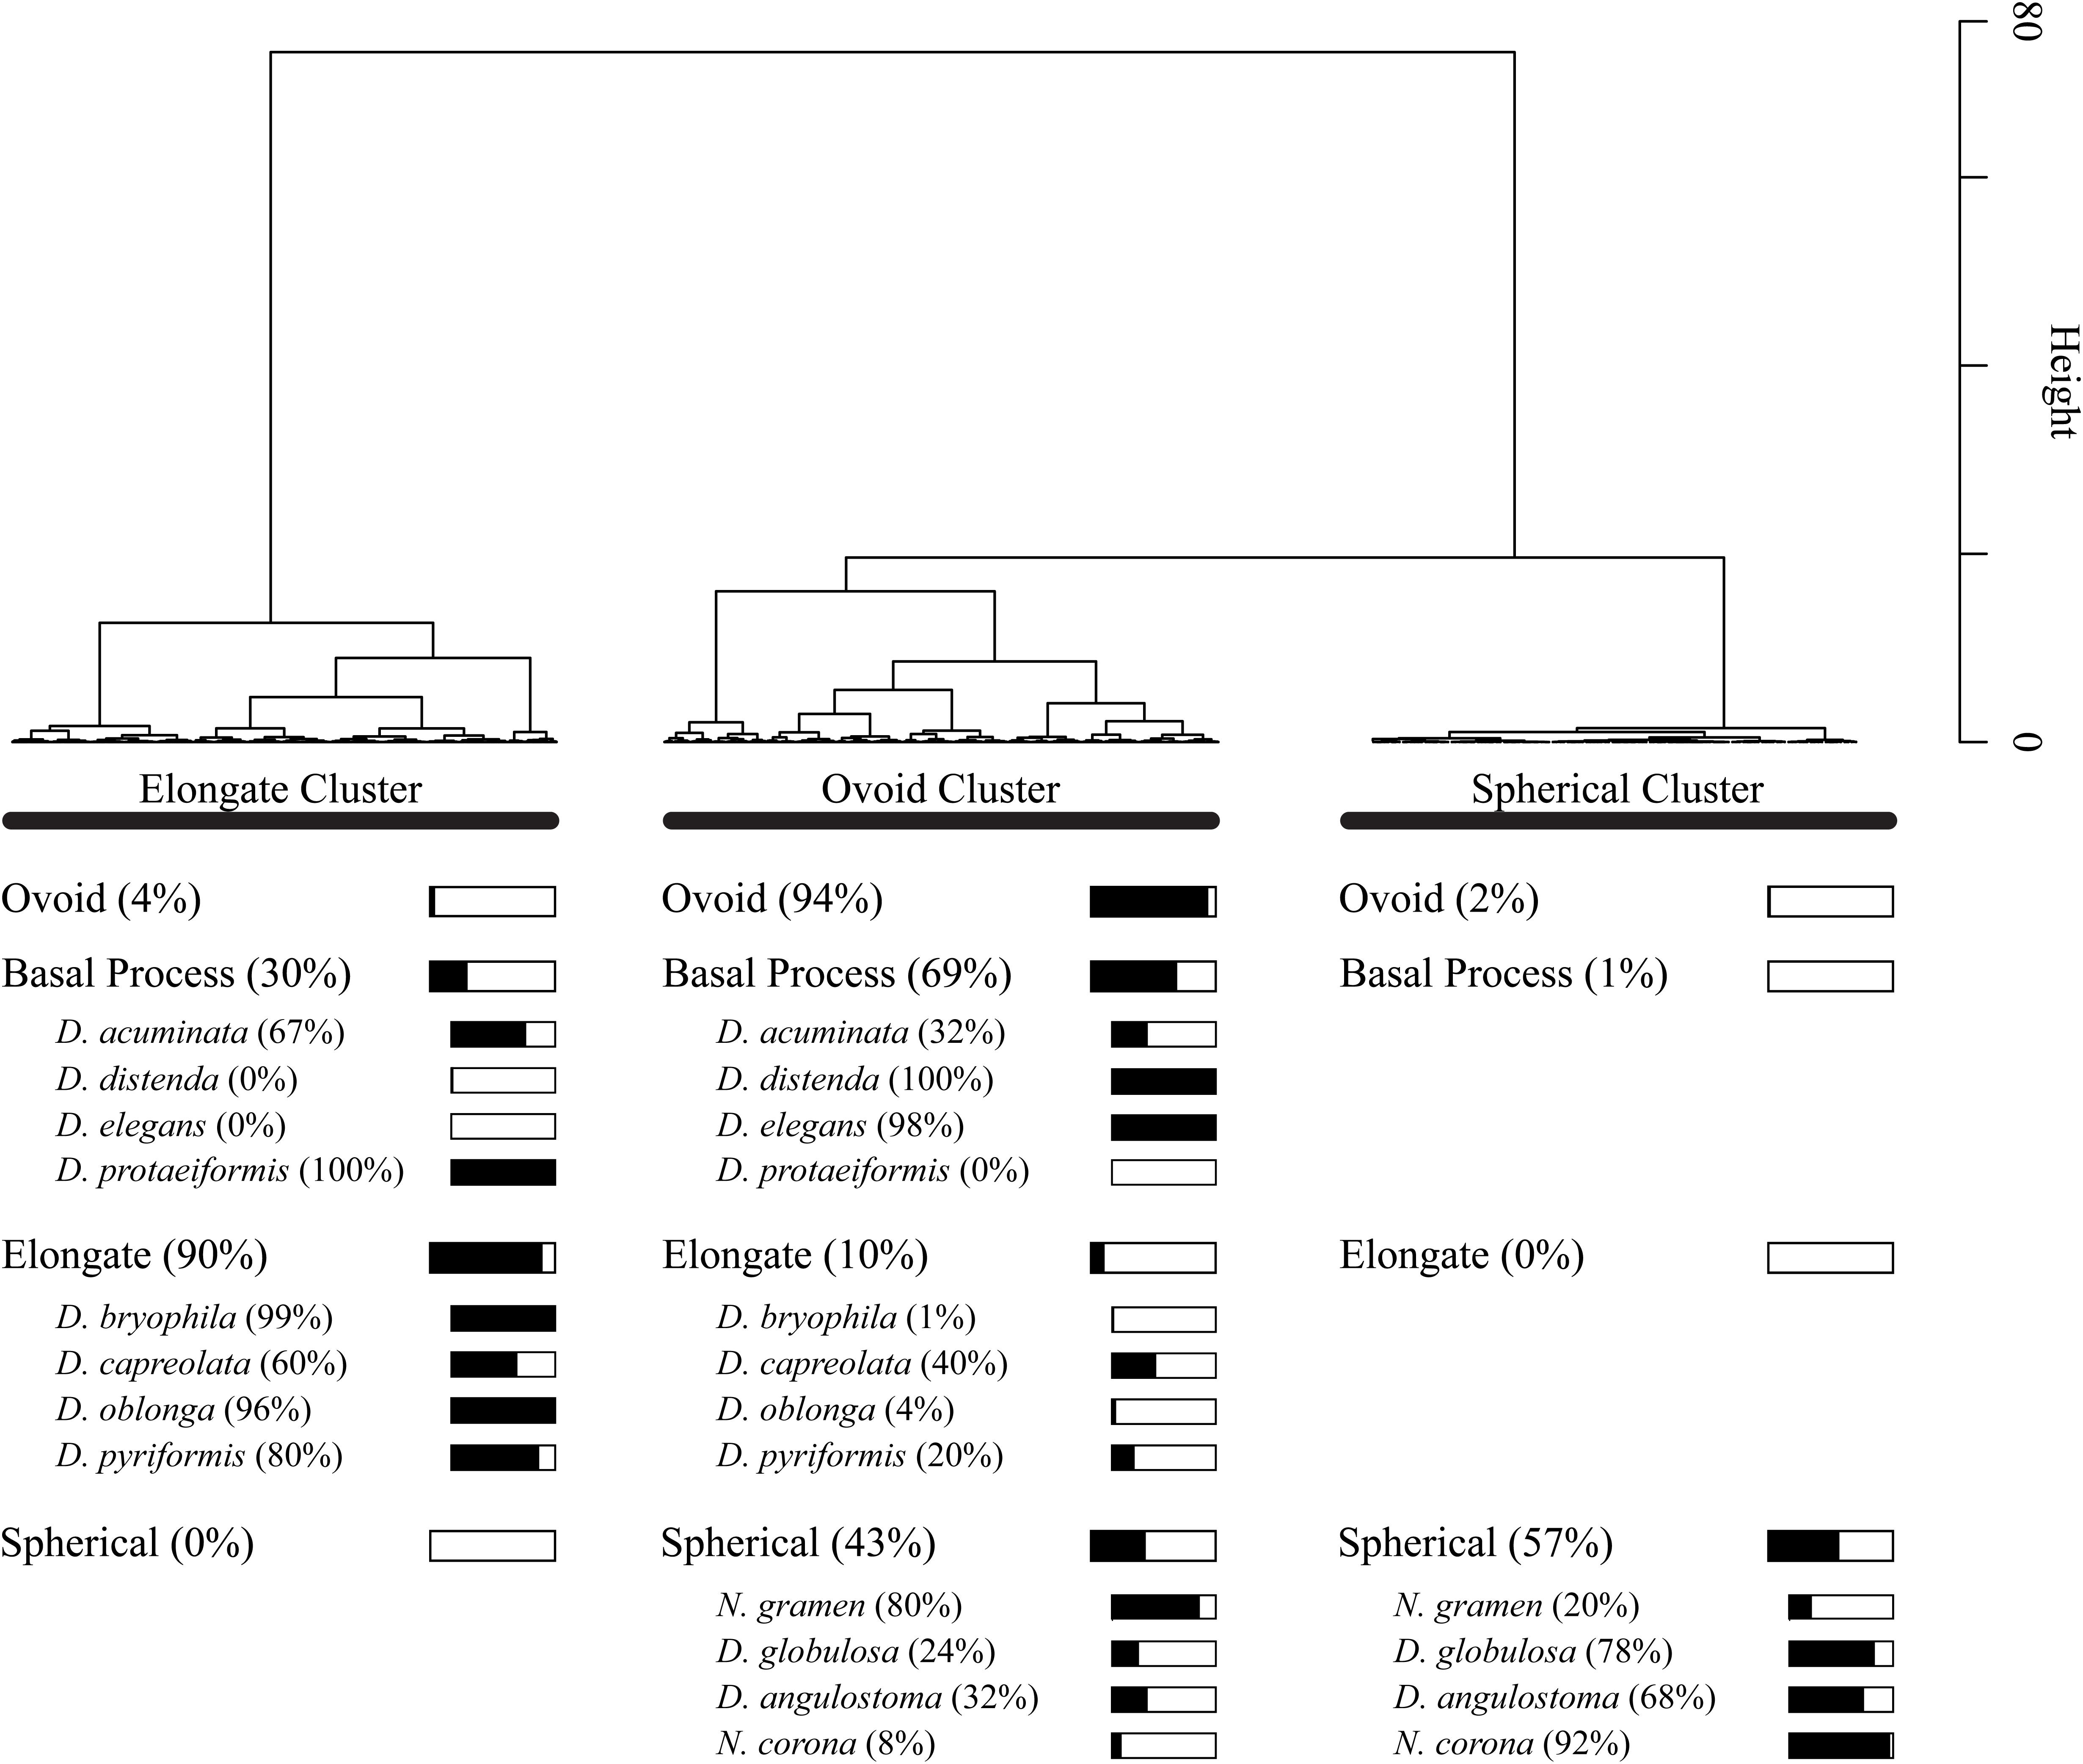
Figure 7. Dendrogram showing Wards cluster analysis of Principal Component Analysis PC1 and PC2 scores for all 1503 specimens. For each shape group, we show what percentage of the specimens are present within the cluster groups. For example, 57% of specimens in the spherical shape group are found in the Spherical Cluster.
Stratigraphic Variability
In Figure 8 we display the stratigraphic variation of our test size and shape data alongside the species-based results of the Salgado et al. (2010) plant macrofossil and the Prentice et al. (2018) Arcellinida studies. Significantly, our size and shape indices display stratigraphic trends that correspond with the CONISS zone boundaries defined by the testate amoeba and plant macrofossil datasets, especially the initiations of Zones 3 and 4 (Figure 8). We observed four phases of test shape cluster change: (1) a stable phase comprising only the elongate and ovoid tests through Zones 1 and 2; (2) the appearance of spherical tests at 40 cm (Zone 3); (3) the initiation of a decline in elongate tests at 36 cm; and (4) the disappearance of elongate tests above 6 cm (Zone 4). The median centroid size follows a similar stratigraphic pattern to the elongate tests, with a noticeable decrease in median centroid size above 6 cm.
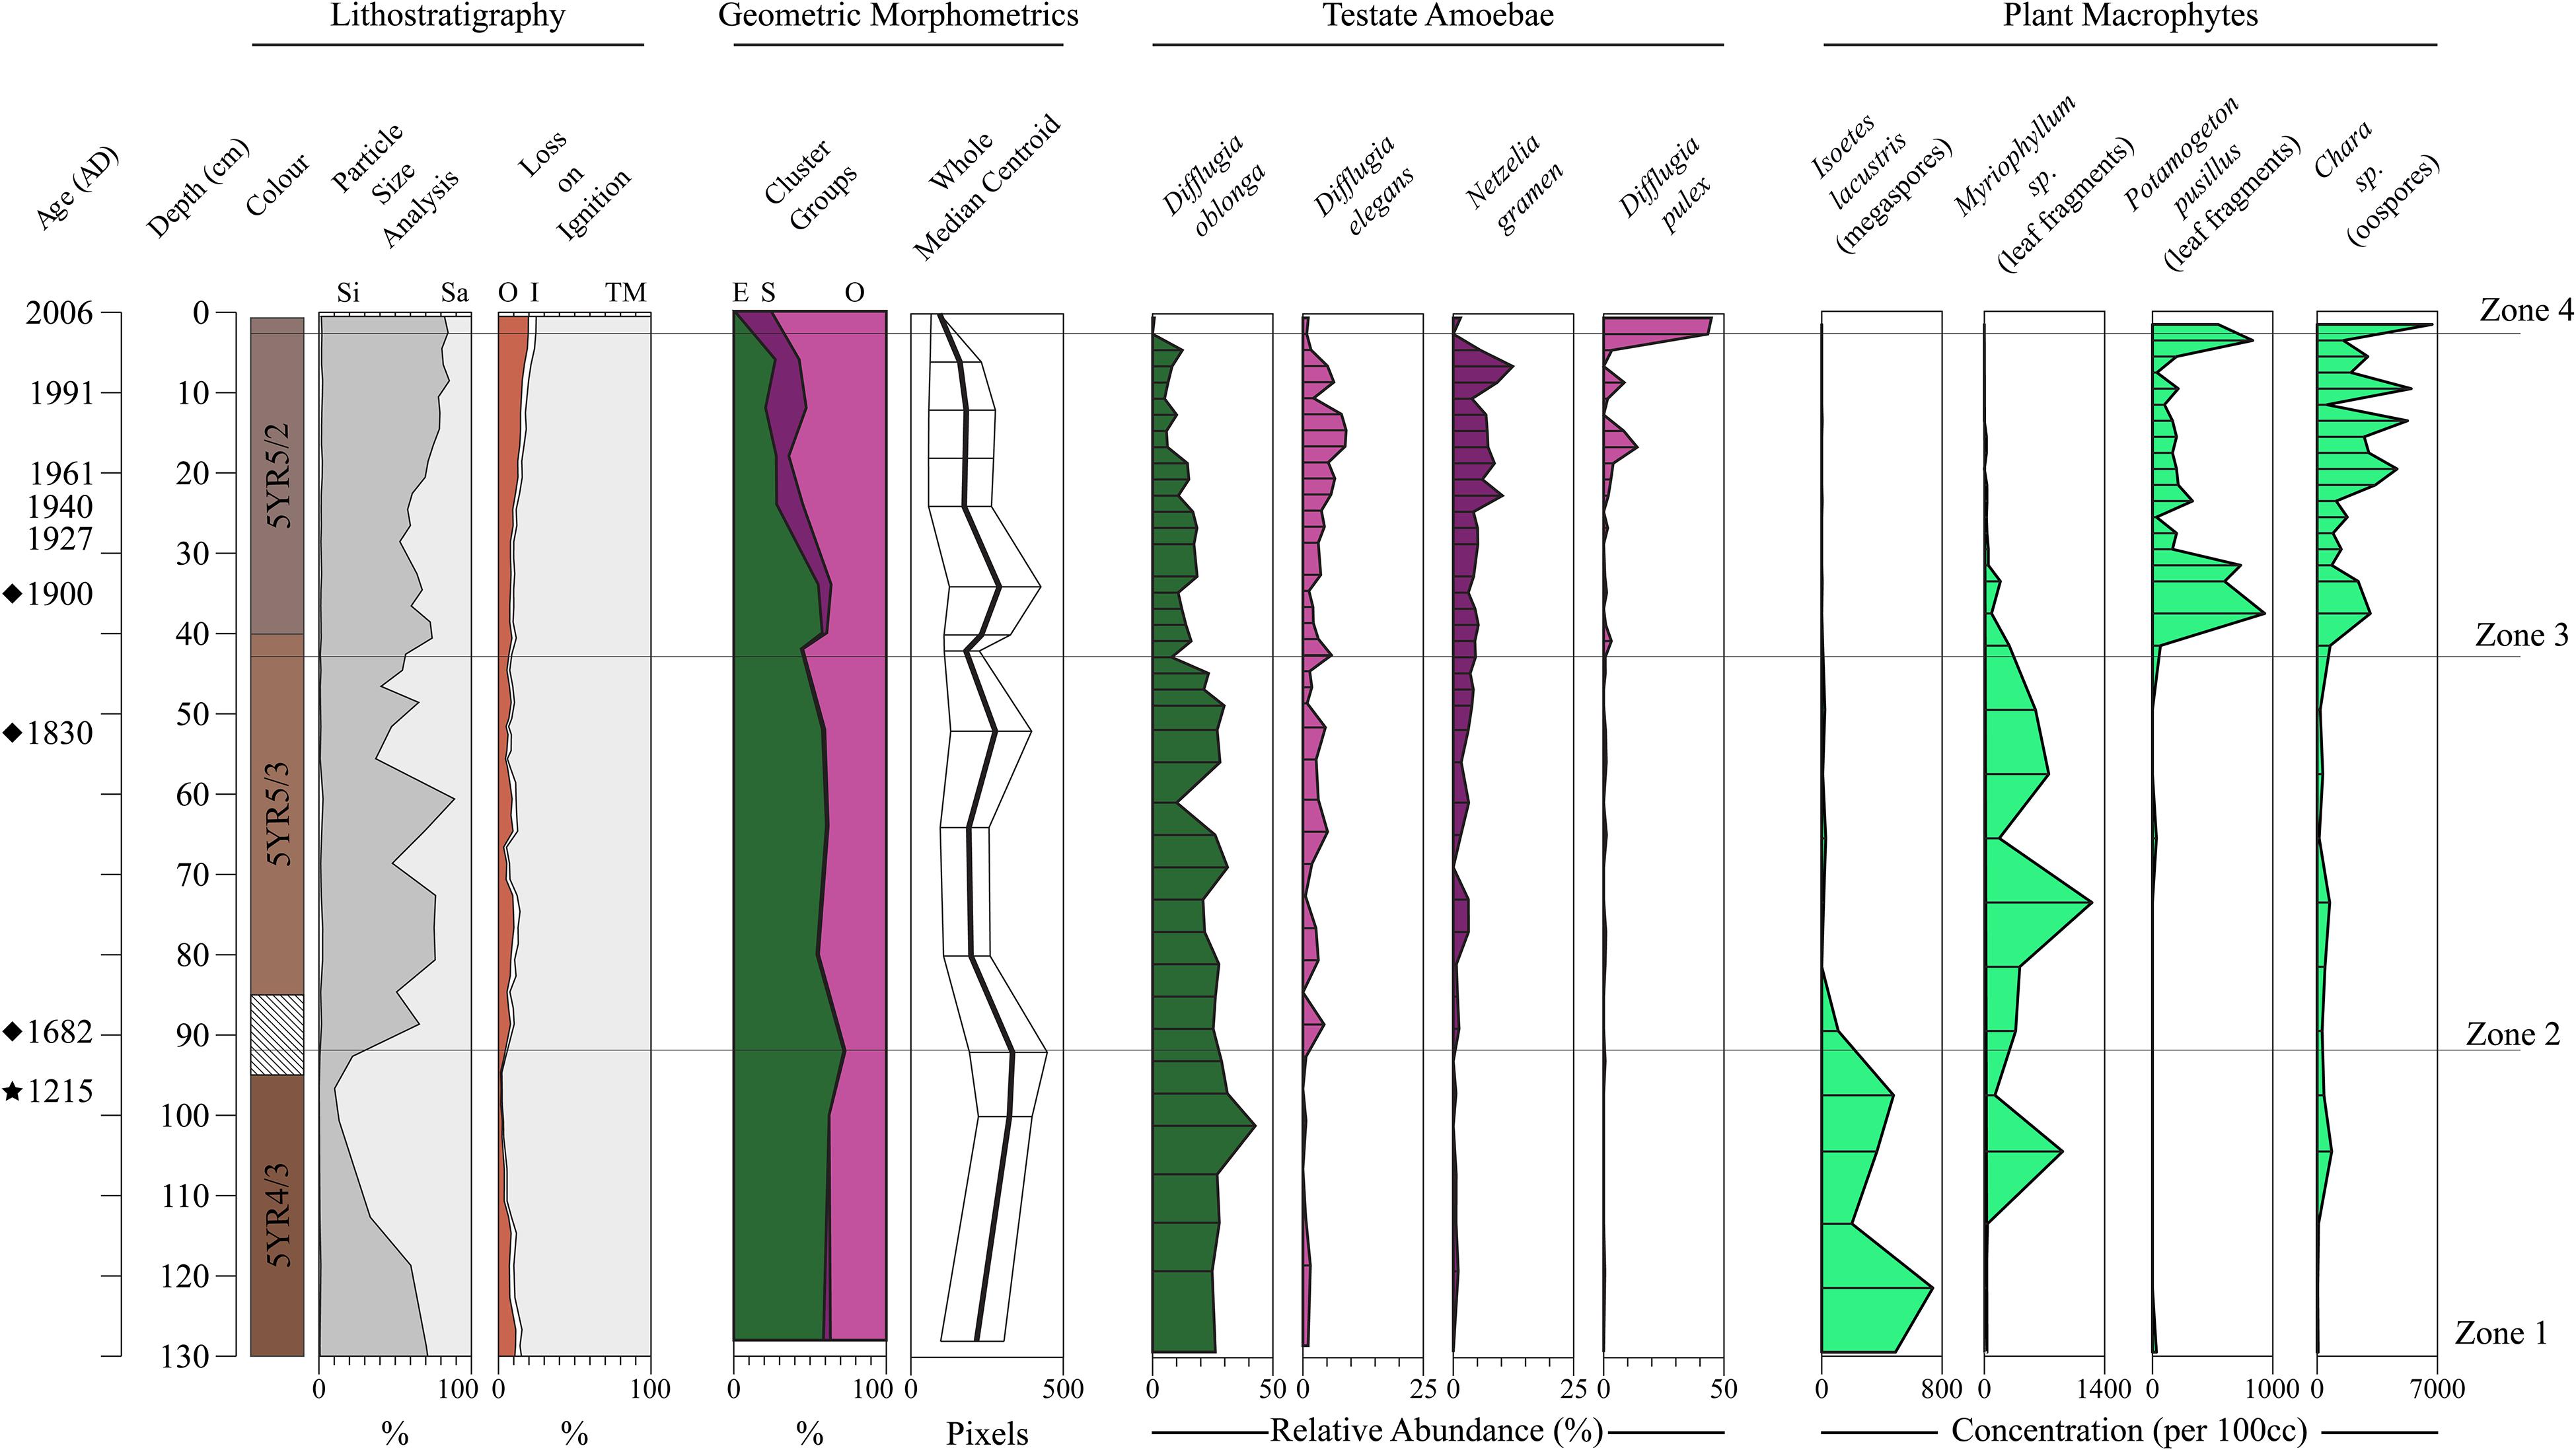
Figure 8. Stratigraphic summary diagram for Loch Leven. Core chronology is based on modeled 210Pb dates (Salgado et al., 2010), extended 210Pb model dates (diamonds) and a single radiocarbon date (1215) marked by a star at 96 cm (Prentice et al., 2018). Lithostratigraphic variables are shown as stacked profiles: loss-on-ignition results are percent organic carbon (OC), percent inorganic carbon (IC) and percent minerogenic matter (TM) (Salgado et al., 2010); particle size data as percent silt (Si) and sand (Sa) (Prentice et al., 2018). The percentage of specimens belonging to each shape group identified by cluster analysis of the Whole-PC1 and -PC2 scores are shown as a stacked profile: (O) Ovoid; (S) Spherical; (E) Elongate. Median centroid size of the Procrustes-PCA landmark dataset is displayed as a line graph. Select Arcellinida (Prentice et al., 2018) and plant macrofossil taxa (Salgado et al., 2010) are illustrated. CONISS zones are from the Arcellinida dataset presented by Prentice et al. (2018).
Discussion
The four phases of ecological change recorded in Loch Leven core LEVE14 in response to gradual eutrophication, as identified by the palaeolimnological studies of Salgado et al. (2010) and Prentice et al. (2018), provide an excellent framework to see whether geometric morphometric analysis applied to freshwater Arcellinida tests can identify functional traits which provide complementary summaries of ecological function without taxonomic expertise. In addition, assess the impact of intraspecific trait variability.
Pre-enrichment Phase (pre-1830)
Zone 1 (141–90 cm)
Salgado et al. (2010) inferred that the Zone 1 plant macrofossil assemblage of the LEVE14 sediment core was typical of a nutrient poor oligotrophic-mesotrophic lake, with very few dense stands of macrophytes and relatively deep and open water conditions (Figure 1B). The Arcellinida assemblage is comprised of mainly of elongate tests (60%; Figures 7, 8). Elongate difflugids, are inferred to reflect a benthic life habit (Patterson and Kumar, 2002; Lansac-Tôha et al., 2014; Prentice et al., 2018) and in fact, their abundances have been observed to decrease as benthic conditions become stressed (e.g., in reduced oxygen environments, Roe et al., 2010).
Taxa in the ovoid cluster make up 30% of the Zone 1 community (Figure 6). Lansac-Tôha et al. (2014), in a study of living testate amoeba from different habitats of a shallow lake in Brazil, observed assemblages composed of “elongate” tests in benthic habitats, also in association with macrophyte habitats (i.e., epibiotic). Several of the taxa classified as “elongate” by Lansac-Tôha et al. (2014) are classified by our geometric morphometric analysis as ovoid (e.g., D. elegans; Figure 7). Thus, we infer that taxa of the ovoid cluster might represent the success of an epibiotic life habit (i.e., stands of macrophytes) in addition to an oxygenated benthic environment.
Zone 1 has the greatest median centroid size (Figure 8), with more species characterized by large tests (centroid size >200) than any other temporal community (Figure 6). This is typified by Difflugia pyriformis Perty 1849 a large elongate difflugid known to be mixotrophic (Leidy, 1879). Macumber et al. (2020) using high-resolution phylogenetics (NAD9-NAD7 genes) and geometric morphometrics demonstrated two novel clades of elongate type Difflugia species that could be distinguished based on test centroid size: a pyriform clade and a lanceolate clade. The “pyriform” clade was characterized by larger centroid sizes and members known to be mixotrophic, while the “lanceolate” clade had smaller test centroid sizes and only heterotrophic taxa. The larger average centroid size and the higher abundance of elongate type taxa recorded in Zone 1 could therefore reflect relatively higher abundances of mixotrophic as compared to heterotrophic taxa. The oligotrophic-mesotrophic conditions inferred for the loch at this time would have promoted a benthic mixotrophic life habit and thus may well explain the presence of large elongate difflugids.
Zone 2 (90–41 cm)
From Zone 1 to Zone 2, macrofossils of the submerged taller growing macrophytes Myriophyllum and Chara sp., expanded coinciding with a reduction in isoetid plants. These changes were associated with increasing eutrophication of the lake, which was driven by expanding agricultural production in the catchment (Salgado et al., 2010). Denser stands of macrophytes would have provided increased habitat availability for epibiotic taxa such as members of the ovoid cluster. Accordingly, we observe an increase in the ovoid cluster (33 to 44%) as represented by increases in D. elegans, Difflugia pulex Penard 1902, and D. lithophila, with the appearance of D. distenda (Figures 6, 8). This increase in ovoid taxa could also explain the coeval decrease in median centroid size (Figure 8), which is driven by a decrease in median size of several species, notably D. oblonga, D. protaeiformis, D. pyriformis, and D. globulosa (Figure 6). Such shifts in median centroid size for several species would also explain why Zone 2 has the greatest amount of intraspecific centroid size variation (Figure 5).
Water Level Lowering and Nutrient Enrichment Phase (1830–1985)
The 1830s lowering of Loch Leven by 1.5 m was coincident with increased catchment agriculture and was inferred by a sedimentological color change at 41 cm in the LEVE14 core (Salgado et al., 2010; Figure 8). Nutrient enrichment led to frequent phytoplankton blooms, reducing light penetration and favoring macrophyte canopy forming species that grew close to the water surface (e.g., Potamogeton and Chara sp.; Figure 1B; Salgado et al., 2010). The expansion of dense elodeid stands (e.g., Myriophyllum and Chara sp.) could have resulted in benthic conditions low in oxygen (Lindholm et al., 2008; Tarkowska-Kukuryk and Kornijów, 2008) as supported by decreases in benthic diatoms (Bennion et al., 2012). Oxygen levels could have been further impacted by stands of Chara sp. reducing water flow (Vermaat et al., 2000). Reduced bottom water oxygen levels would have stressed benthic taxa. Indeed, we observe coeval decreases in the relative abundance of the elongate cluster, inferred to reflect benthic life habits (Figure 8).
At 40 cm there is also an increase in taxa from the spherical cluster: N. corona and D. globulosa and other taxa transitioning to more spherical shapes: D. angulostoma, D. lithophila, and N. gramen (Figures 6, 8). These shifts in test shape are characterized by a relative low amount of intraspecific variability as compared to centroid size (Figure 5). The taxon N. gramen (i.e., C. tricuspis; Supplementary Table S2), assigned to the ovoid and spherical clusters, can switch from benthic to planktic life habits during the summer through the addition of fat droplets and gas bubbles into the test to aid buoyancy (Schönborn, 1962; Arndt, 1993). In their study of Guaraná Lake in Brazil, Lansac-Tôha et al. (2014) found that planktic testate amoeba assemblages were composed of hemispherical and spherical tests. Wiik et al. (2015) also observed coincident increases in C. tricuspis (i.e., N. gramen), planktic diatoms and Daphnia sp., in response to increasing eutrophication of a small marl lake, Cunswick Tarn (United Kingdom). Interestingly, Han et al. (2008, 2011) described the feeding agility and wide prey range of several planktic Arcellinida taxa including N. tuberspinifera, which is morphologically and phylogenetically related to N. corona (Gomaa et al., 2017) which is assigned to the spherical cluster (Figure 7). Taking these points together, it is likely that the observed increase in the spherical cluster in our study reflects the expansion of planktic and epibiotic life strategies, both for Arcellinida and their prey, driven by the expansion of canopy forming macrophyte forming denser stands in the shallower waters.
The existence of an ecological separation between taxa in the spherical (i.e., planktic or epibiotic) and elongate cluster (i.e., benthic) is mirrored by differences in their phylogenetic placement. Molecular barcoding results demonstrate that spherical cluster taxa (e.g., Netzelia sp.) previously classified as part of the genus Difflugia in fact belong to the family Netzellidae and were assigned to the genus Netzelia (Kosakyan et al., 2016; Blandenier et al., 2017; Gomaa et al., 2017). The genetic divergence between these two groups could reflect a speciation event related to divergent life habits (i.e., planktic/epibiotic vs. benthic; Weisse, 2008).
The period from 1969 to 1987 represents one of the most productive periods in the history of Loch Leven with cyanobacteria blooms regularly occurring and planktic diatoms dominating the diatom assemblages (Bennion et al., 2012). This period coincided with a peak in tests from the spherical cluster at 12 cm (c. 1986 AD). This was broadly coeval with a reported Daphnia sp. bloom in the 1970s (May et al., 2012) suggesting that a zooplankton life strategy was very successful at this time and perhaps why there is an increase in small spherical tests. An increase in the availability of zooplanktonic prey would support planktic carnivory, potentially explaining the increase in N. corona (Han et al., 2008, 2011).
Remediation Phase (1985 to Present)
Remediation measures to reduce nutrient loading of Loch Leven have been in place since the mid-1980s (Salgado et al., 2010). Bennion et al. (2012) observed little evidence in the Loch Leven diatom assemblage for remediation success though and hypothesized that it was masked by the increasing influence of climate change. The Arcellinida data support this observation as test morphological trends continue along trajectories established before remediation efforts (Figure 8). The disappearance of the elongate cluster from 2000 AD is inferred to represent the development of an inhospitable benthic zone, while planktic and epibiotic life habits continued to be successful (Figures 6, 8). Prentice et al. (2018) hypothesized that continued Chara sp. expansion from 2000 to 2006 AD (Salgado et al., 2010) could have further reduced bottom water oxygen levels.
At c. 2006 AD, very small tests, having a median centroid size 58% less than in Zone 3, dominate the sample at unprecedented concentrations (Figures 6, 8). Prentice et al. (2018) inferred stressed environmental conditions prevailed in the loch at this time based on a decrease in Arcellinida species diversity. Assemblage dwarfing was observed in response to a stressed environment (e.g., fire and peat farming) by Marcisz et al. (2016) in their study of Sphagnum peatlands in Poland, as well as in other protist groups after abrupt perturbations (e.g., foraminifera; Hsiang et al., 2016).
Leading up to the interval representing c. 2006 AD centroid size is relatively stable, suggesting that an additional stressor in addition to nutrient enrichment may have impacted the Arcellinida of this uppermost part of the record, for example, warming water temperatures. Spring temperatures are certainly known to have risen in the loch between 1968 and 2007 (Carvalho et al., 2012). A relationship between Arcellinida test size and temperature has been observed experimentally (Wanner, 1999) and in field studies (Collins et al., 1990; Dallimore et al., 2000). A temperature increase in 10°C doubles cellular respiration while oxygen diffusion increases proportionally (Wanner, 1999). Thus, testate lobose amoeba may respond to temperature rises by increasing their surface area to volume (e.g., smaller cell sizes) and increasing the size of their apertures.
Efficacy of Geometric Morphometrics to Summarize Arcellinida Community Dynamics as Compared to Species-Based Approaches
This study has shown that geometric morphometric analysis of Arcellinida tests was able to capture the key phases of environmental variability recorded in the Loch Leven LEVE14 sediment core using only three variables (i.e., PC1, PC2, and centroid size). This is far fewer variables than a conventional species-based approach and requires less taxonomic expertise, making it more accessible to non-specialists. Our identification of three shape types (ovoid, elongate, and spherical) in freshwater Arcellinida tests adds support to ecological (Lansac-Tôha et al., 2014) and molecular (Gomaa et al., 2017) studies which have shown that there is a link between test morphology and life habit. In the current study, spherical tests have been shown to be associated with the expansion of both planktic and macrophytic habitats, while elongate tests are related to benthic habitat conditions. We recommend future experimental studies to test the relationship between Arcellinida and dissolved oxygen levels, to further observe macrophyte and Arcellinida associations and to undertake lake surveys along nutrient gradients to characterize the test morphological response to nutrient-enrichment.
Size variability, as an independent measure, was found to be valuable for inferring a response to eutrophication and/or warming temperatures and illustrating that shape groups (e.g., the elongate cluster) and species vary greatly in their range of sizes (Figures 4–6). This high degree of infraspecific variation could reflect an environmental response or could be related to the lumping of distinct taxa during the enumeration process. More research is needed to understand whether size is a specific trait and/or an intraspecific response to environmental variability. Other potential evidence of infraspecific variation was observed by certain taxa belonging to more than one shape cluster. The ability to capture this variation is an added benefit of geometric morphometrics, and future studies could assess the importance of this variation as a response to environmental variability.
Future Development
Geometric morphometric analysis requires Arcellinida tests to be photographed and digitized (i.e., landmark placement) in a consistent manner. This increases analytical time, excludes those taxa that cannot be oriented in a consistent manner (e.g., centropyxids) and, depending on the camera resolution, means that fine features may not be captured. Photography and digitization could potentially be automated reducing analytical time (Hsiang et al., 2016; Steele et al., 2020). Using 3D imaging techniques (e.g., nano-ct) could facilitate the inclusion of all test shapes. The sediment record of LEVE14 core, illustrates an environmental history of plant macrofossil community turnover associated with enrichment, resulting in significant habitat changes. Whether morphological changes in freshwater Arcellinida tests can track other types of environmental changes should be the focus of future research.
Conclusion
This study is the first paleoecological study to characterize Arcellinida test morphological variability using geometric morphometric analysis, providing continuous and independent measures of shape and size variation. Four morphological parameters (centroid size, spherical, ovoid and elongate clusters) accorded well with species-based reconstructions of limnological change in Loch Leven in terms of timing and nature. Fewer parameters that do not require taxonomic expertise and associated with ecological functioning provided intuitive results that could be made accessible to non-specialists facilitating their incorporation into larger multi-proxy studies. Our results support and build upon the hypothesis that freshwater Arcellinida test morphology reflects life habit, with spherical tests representing planktic habitat settings, ovoid tests signaling epibiotic living modes and elongate tests associated with benthic habitats. Our research illustrates the promise of freshwater Arcellinida test morphological variability in tracking environmental change.
Data Availability Statement
The raw data supporting the conclusions of this article will be made available by the authors, without undue reservation.
Author Contributions
AM and HR conceived and designed the analyses. SP and CS provided valuable insight about the previous Loch Leven study and access to the subsamples. HR provided research space and resources. AM performed data collection, analyses, and wrote the manuscript. All authors revised and edited the manuscript, read, and approved the final manuscript.
Funding
This research was undertaken as part of a Horizon 2020 Marie Skłodowska-Curie Actions Fellowship awarded by the European Commission (Project Number 703381, 2016–2018).
Conflict of Interest
The authors declare that the research was conducted in the absence of any commercial or financial relationships that could be construed as a potential conflict of interest.
Acknowledgments
Thanks, are expressed to John Meneely from the School of Natural and Built Environment, Queen’s University Belfast, United Kingdom for support with laboratory analyses and data collection.
Supplementary Material
The Supplementary Material for this article can be found online at: https://www.frontiersin.org/articles/10.3389/fevo.2020.568904/full#supplementary-material
References
Adams, D. C., and Otarola-Castillo, E. (2013). geomorph: an R package for the collection and analysis of geometric morphometric shape data. Methods Ecol. Evol. 4, 393–399. doi: 10.1111/2041-210X.12035
Adams, D. C., Rohlf, F. J., and Slice, D. E. (2013). A field comes of age: geometric morphometrics in the 21st century. Hystrix 24, 7–14. doi: 10.4404/hystrix-24.1-6283
Appleby, P. G., and Oldfield, F. (1978). The calculation of lead-210 dates assuming a constant rate of supply of unsupported 210Pb to the sediment. CATENA 5, 1–8. doi: 10.1016/S0341-8162(78)80002-2
Arndt, H. (1993). A critical review of the importance of rhizopods (naked and testate amoebae) and actinopods (Heliozoa) in lake plankton. Mar. Microb. Food Webs 7, 3–29. doi: 10.2113/gsjfr.50.1.3
Arrieira, R. L., Schwind, L. T. F., Bonecker, C. C., and Lansac-Tôha, F. A. (2015). Use of functional diversity to assess determinant assembly processes of testate amoebae community. Aquat. Ecol. 49, 561–571. doi: 10.1007/s10452-015-9546-z
Bennion, H., Carvalho, L., Sayer, C. D., Simpson, G. L., and Wischnewski, J. (2012). Identifying from recent sediment records the effects of nutrients and climate on diatom dynamics in Loch Leven. Freshw. Biol. 57, 2015–2029. doi: 10.1111/j.1365-2427.2011.02651.x
Beszteri, N. K. (2005). Conventional and geometric morphometric studies of valve ultrastructural variation in two closely related Cyclotella species (Bacillariophyta). Eur. J. Phycol. 40, 89–103. doi: 10.1080/09670260500050026
Blandenier, Q., Lara, E., Mitchell, E. A. D., Alcantara, D. M. C., Siemensma, F. J., Todorov, M., et al. (2017). NAD9/NAD7 (mitochondrial nicotinamide adenine dinucleotide dehydrogenase gene)—A new “Holy Grail” phylogenetic and DNA-barcoding marker for Arcellinida (Amoebozoa)? Eur. J. Protistol. 58, 175–186. doi: 10.1016/j.ejop.2016.12.002
Blois, J. L., Zarnetske, P. L., Fitzpatrick, M. C., and Finnegan, S. (2013). Climate change and the past, present, and future of biotic interactions. Science 341, 499–504. doi: 10.1126/science.1237184
Bobrov, A., and Mazei, Y. (2004). Morphological variability of testate amoebae (Rhizopoda: Testacealobosea: Testaceafilosea) in natural populations. Acta Protozool. 43, 133–146.
Borcard, D., Gillet, F., and Legendre, P. (2011). “Spatial analysis of ecological data,” in Numerical Ecology with R, eds S. Shekhar, H. Xiong, and X. Zhou (New York, NY: Springer), 227–292.
Boudreau, R. E. A., Galloway, J. M., Patterson, R. T., Kumar, A., and Michel, F. A. (2005). A paleolimnological record of Holocene climate and environmental change in the Temagami region, northeastern Ontario. J. Paleolimnol. 33, 445–461. doi: 10.1007/s10933-004-7616-7
Carvalho, L., Miller, C., Spears, B. M., Gunn, I. D. M., Bennion, H., Kirika, A., et al. (2012). Water quality of Loch Leven: responses to enrichment, restoration and climate change. Hydrobiologia 681, 35–47. doi: 10.1007/s10750-011-0923-x
Collins, E. S., McCarthy, F. M. G., Medioli, F. S., Scott, D. B., and Honig, C. A. (1990). “Biogeographic distribution of modern thecamoebians in a transect along the eastern North American coast,” in Paleoecology, Biostratigraphy, Paleoceanography and Taxonomy of Agglutinated Foraminifera, eds C. Hemleben, M. A. Kaminski, W. Kuhnt, and D. B. Scott (Cham: Springer), 783–791. doi: 10.1007/978-94-011-3350-0_28
Dallimore, A., Schröder-adams, C. J., and Dallimore, S. R. (2000). Holocene environmental history of thermokarst lakes on Richards Island, Northwest Territories, Canada: thecamoebians as paleolimnological indicators. J. Paleolimnol. 23, 261–283.
Dean, W. E. (1974). Determination of carbonate and organic matter in calcareous sediments and sedimentary rocks by loss on ignition: comparison with other methods. J. Sediment. Petrol. 44, 242–248.
Dudley, B., Gunn, I. D. M., Carvalho, L., Proctor, I., O’Hare, M. T., Murphy, K. J., et al. (2012). Changes in aquatic macrophyte communities in Loch Leven: evidence of recovery from eutrophication? Hydrobiologia 681, 49–57. doi: 10.1007/s10750-011-0924-9
Fournier, B., Gillet, F., Le Bayon, R. C., Mitchell, E. A. D., and Moretti, M. (2015). Functional responses of multitaxa communities to disturbance and stress gradients in a restored floodplain. J. Appl. Ecol. 52, 1364–1373. doi: 10.1111/1365-2664.12493
Fruciano, C. (2016). Measurement error in geometric morphometrics. Dev. Genes. Evol. 226, 139–158. doi: 10.1007/s00427-016-0537-4
Gomaa, F., Lahr, D. J. G., Todorov, M. T., Lin, J. H., and Lara, E. (2017). A contribution to the phylogeny of agglutinating Arcellinida (Amoebozoa) based on SSU rRNA gene sequences. Eur. J. Protistol. 59, 99–107. doi: 10.1016/j.ejop.2017.03.005
Grimm, E. C. (1987). CONISS: a FORTRAN 77 program for stratigraphically constrained cluster analysis by the method of incremental sum of squares. Comput. Geosci. 13, 13–35. doi: 10.1016/0098-3004(87)90022-7
Han, B. P., Wang, T., Lin, Q. Q., and Dumont, H. J. (2008). Carnivory and active hunting by the planktonic testate amoeba Difflugia tuberspinifera. Hydrobiologia 596, 197–201. doi: 10.1007/s10750-007-9096-z
Han, B. P., Wang, T., Xu, L., Lin, Q. Q., Jinyu, Z., and Dumont, H. J. (2011). Carnivorous planktonic Difflugia (Protista, Amoebina Testacea) and their predators. Eur. J. Protistol. 47, 214–223. doi: 10.1016/j.ejop.2011.04.002
Hsiang, A. Y., Elder, L. E., and Hull, P. M. (2016). Towards a morphological metric of assemblage dynamics in the fossil record: a test case using planktonic foraminifera. Philos. Trans. R. Soc. Lond. B Biol. Sci. 371:20150227. doi: 10.1098/rstb.2015.0227
Jassey, V. E. J., Lamentowicz, M., Bragazza, L., Hofsommer, M. L., Mills, R. T. E., Buttler, A., et al. (2016). Loss of testate amoeba functional diversity with increasing frost intensity across a continental gradient reduces microbial activity in peatlands. Eur. J. Protistol. 55, 190–202. doi: 10.1016/j.ejop.2016.04.007
Kosakyan, A., Gomaa, F., Lara, E., and Lahr, D. J. G. (2016). Current and future perspectives on the systematics, taxonomy and nomenclature of testate amoebae. Eur. J. Protistol. 55, 105–117. doi: 10.1016/j.ejop.2016.02.001
Kumar, A., and Patterson, R. T. (2000). Arcellaceans (Thecamoebians): new tools for monitoring long and short term changes in lake bottom acidity. Environ. Geol. 39, 689–697. doi: 10.1007/s002540050483
Lamentowicz, M., Gałka, M., Lamentowicz, Ł, Obremska, M., Kühl, N., Lücke, A., et al. (2015). Reconstructing climate change and ombrotrophic bog development during the last 4000years in northern Poland using biotic proxies, stable isotopes and trait-based approach. Palaeogeogr. Palaeoclimatol. Palaeoecol. 418, 261–277. doi: 10.1016/j.palaeo.2014.11.015
Lansac-Tôha, F., Velho, L., Costa, D., Simões, N., and Alves, G. (2014). Structure of the testate amoebae community in different habitats in a neotropical floodplain. Braz. J. Biol. 74, 181–190. doi: 10.1590/1519-6984.24912
Leidy, J. (1879). Fresh-Water Rhizopods of North America. Washington, DC: Government Printing Office.
Lindholm, T., Ronnholm, E., and Haggqvist, K. (2008). Changes due to invasion of Myriophyllum sibiricum in a shallow lake in Aland, SW Finland. Aquat. Invas. 3, 10–13. doi: 10.3391/ai.2008.3.1.3
Macumber, A. L., Blandenier, Q., Todorov, M., Duckert, C., Lara, E., Lahr, D. J. G., et al. (2020). Phylogenetic divergence within the Arcellinida (Amoebozoa) is congruent with test size and metabolism type. Eur. J. Protistol. 72:125645. doi: 10.1016/j.ejop.2019.125645
Marcisz, K., Colombaroli, D., Jassey, V. E. J., Tinner, W., Kołaczek, P., Gałka, M., et al. (2016). A novel testate amoebae trait-based approach to infer environmental disturbance in Sphagnum peatlands. Sci. Rep. 6:33907. doi: 10.1038/srep33907
Marcisz, K., Jassey, V. E. J., Kosakyan, A., Lahr, D. J. G., Lara, E., Lamentowicz, M., et al. (2020). Testate amoebae functional traits and their use in paleoecology. Front. Ecol. Evol. 8:575966. doi: 10.3389/fevo.2020.575966
May, L., Defew, L. H., Bennion, H., and Kirika, A. (2012). Historical changes (1905-2005) in external phosphorus loads to Loch Leven, Scotland, UK. Hydrobiologia 681, 11–21. doi: 10.1007/s10750-011-0922-y
McCarthy, F. M. G., Collins, E. S., McAndrews, J. H., Kerr, H. A., Scott, D. B., and Medioli, F. S. (1995). A comparison of postglacial arcellacean (“Thecamoebian”) and pollen succession in Atlantic Canada, illustrating the potential of arcellaceans for paleoclimatic reconstruction. J. Paleontol. 69, 980–993. doi: 10.1017/s0022336000035630
Mitchell, E. A. D., Charman, D. J., and Warner, B. G. (2008). Testate amoebae analysis in ecological and paleoecological studies of wetlands: past, present and future. Biodivers. Conserv. 17, 2115–2137. doi: 10.1007/s10531-007-9221-3
Nasser, N. A., Patterson, R. T., Roe, H. M., Galloway, J. M., Falck, H., Palmer, M. J., et al. (2016). Lacustrine arcellinina (Testate Amoebae) as bioindicators of arsenic contamination. Environ. Microbiol. 72, 130–149. doi: 10.1007/s00248-016-0752-6
Neville, L. A., McCarthy, F. M. G., MacKinnon, M. D., Swindles, G. T., and Marlowe, P. (2011). Thecamoebians (testate amoebae) as proxies of ecosystem health and reclamation success in constructed wetlands in the Oil Sands of Alberta, Canada. J. Foraminiferal Res. 41, 230–247. doi: 10.2113/gsjfr.41.3.230
Oksanen, J., Blanchet, F. G., Friendly, M., Kindt, R., Legendre, P., Minchin, P. R., et al. (2017). vegan: Community Ecology Package.
Patterson, R. T., Dalby, A. P., Kumar, A., Henderson, L. A., and Boudreau, R. E. A. (2002). Arcellaceans (thecamoebians) as indicators of land-use change?: settlement history of the Swan Lake area, Ontario as a case study. J. Paleolimnol. 28, 297–316.
Patterson, R. T., and Kumar, A. (2002). A review of current testate rhizopod (thecamoebian) research in Canada. Palaeogeogr. Palaeoclimatol. Palaeoecol. 180, 225–251. doi: 10.1016/s0031-0182(01)00430-8
Patterson, R. T., Lamoureux, E. D. R., Neville, L. A., and Macumber, A. L. (2013). Arcellacea (Testate Lobose Amoebae) as pH Indicators in a Pyrite Mine-Acidified Lake, Northeastern Ontario, Canada. Microb. Ecol. 65, 541–554. doi: 10.1007/s00248-012-0108-9
Patterson, R. T., Roe, H. M., and Swindles, G. T. (2012). Development of a thecamoebian (testate amoebae) based transfer function for sedimentary Phosphorous in lakes. Palaeogeogr. Palaeoclimatol. Palaeoecol. 348–349, 32–44. doi: 10.1016/j.palaeo.2012.05.028
Prentice, S. V., Roe, H. M., Bennion, H., Sayer, C. D., and Salgado, J. (2018). Refining the palaeoecology of lacustrine testate amoebae: insights from a plant macrofossil record from a eutrophic Scottish lake. J. Paleolimnol. 60, 189–207. doi: 10.1007/s10933-017-9966-y
R Core Team (2016). R: A Language and Environment for Statistical Computing. Vienna: R Foundation for Statistical Computing.
Roe, H. M., Patterson, R. T., and Swindles, G. T. (2010). Controls on the contemporary distribution of lake thecamoebians (testate amoebae) within the Greater Toronto Area and their potential as water quality indicators. J. Paleolimnol. 43, 955–975. doi: 10.1007/s10933-009-9380-1
Salgado, J., Sayer, C. D., Carvalho, L., Davidson, T. A., and Gunn, I. (2010). Assessing aquatic macrophyte community change through the integration of palaeolimnological and historical data at Loch Leven, Scotland. J. Paleolimnol. 43, 191–204. doi: 10.1007/s10933-009-9389-5
Schönborn, W. (1962). Über planktismus und zyklomorphose bei Difflugia limnetica (Levander) pénard. Limnologica 1, 21–34.
Siefert, A., Violle, C., Chalmandrier, L., Albert, C. H., Taudiere, A., Fajardo, A., et al. (2015). A global meta-analysis of the relative extent of intraspecific trait variation in plant communities. Ecol. Lett. 18, 1406–1419. doi: 10.1111/ele.12508
Steele, R. E., Patterson, R. T., Hamilton, P. B., Nasser, N. A., and Roe, H. M. (2020). Assessment of FlowCam technology as a potential tool for rapid semi-automatic analysis of lacustrine Arcellinida (testate lobose amoebae). Environ. Technol. Innov. 17:100580. doi: 10.1016/j.eti.2019.100580
Tarkowska-Kukuryk, M., and Kornijów, R. (2008). Influence of spatial distribution of submerged macrophytes on chironomidae assemblages in shallow lakes. Polish J. Ecol. 56, 569–579.
van Bellen, S., Mauquoy, D., Payne, R. J., Roland, T. P., Hughes, P. D. M., Daley, T. J., et al. (2017). An alternative approach to transfer functions? Testing the performance of a functional trait-based model for testate amoebae. Palaeogeogr. Palaeoclimatol. Palaeoecol. 468, 173–183. doi: 10.1016/j.palaeo.2016.12.005
Vermaat, J. E., Santamaria, L., and Roos, P. J. (2000). Water flow across and sediment trapping in submerged macrophyte beds of contrasting growth form. Arch. Hydrobiol. 148, 549–562. doi: 10.1127/archiv-hydrobiol/148/2000/549
Wanner, M. (1999). A review on the variability of testate amoebae: methodological approaches, environmental influences and taxonomical implications. Acta Protozool. 38, 15–30.
Weisse, T. (2008). Distribution and diversity of aquatic protists: an evolutionary and ecological perspective. Biodivers. Conserv. 17, 243–259. doi: 10.1007/s10531-007-9249-4
Wiik, E., Bennion, H., Sayer, C. D., Davidson, T. A., Clarke, S. J., McGowan, S., et al. (2015). The coming and going of a marl lake: multi-indicator palaeolimnology reveals abrupt ecological change and alternative views of reference conditions. Front. Ecol. Evol. 3:82. doi: 10.3389/fevo.2015.00082
Keywords: Arcellinida, ecology, lake, morphometrics, paleolimnology, Loch Leven, land-use change
Citation: Macumber AL, Roe HM, Prentice SV, Sayer CD, Bennion H and Salgado J (2020) Freshwater Testate Amoebae (Arcellinida) Response to Eutrophication as Revealed by Test Size and Shape Indices. Front. Ecol. Evol. 8:568904. doi: 10.3389/fevo.2020.568904
Received: 02 June 2020; Accepted: 19 October 2020;
Published: 03 December 2020.
Edited by:
Vincent Jassey, UMR 5245 Laboratoire Ecologie Fonctionnelle et Environnement (ECOLAB), FranceReviewed by:
Fábio Amodêo Lansac Toha, State University of Maringá, BrazilAndrey Nikolaevich Tsyganov, Lomonosov Moscow State University, Russia
Copyright © 2020 Macumber, Roe, Prentice, Sayer, Bennion and Salgado. This is an open-access article distributed under the terms of the Creative Commons Attribution License (CC BY). The use, distribution or reproduction in other forums is permitted, provided the original author(s) and the copyright owner(s) are credited and that the original publication in this journal is cited, in accordance with accepted academic practice. No use, distribution or reproduction is permitted which does not comply with these terms.
*Correspondence: Andrew L. Macumber, YW5kcmV3LmwubWFjdW1iZXJAZ21haWwuY29t; Helen M. Roe, aC5yb2VAcXViLmFjLnVr