 Carolyn K. Tepolt1,2*
 Stephen R. Palumbi1
- 1Department of Biology, Hopkins Marine Station, Stanford University, Pacific Grove, CA, United States
- 2Biology Department, Woods Hole Oceanographic Institution, Woods Hole, MA, United States
Widespread species often adapt easily to novel conditions – both those found in new habitats and those generated by climate change. However, rapid adaptation may be hindered in the marine realm, where long-distance dispersal and consequently high gene flow are predicted to limit potential for local adaptation. Here, we use a highly dispersive invasive marine crab to test the nature and speed of adaptation to temperature in the sea. Using single nucleotide polymorphisms (SNPs) generated from cardiac transcriptome sequencing, we characterized six populations of the European green crab (Carcinus maenas) located across parallel thermal gradients in their native and invasive ranges. We compared SNP frequencies with local temperatures and previously generated data on cardiac heat and cold tolerance to identify candidate markers associated with population-level differences in thermal physiology. Of 10,790 SNPs, 104 were identified as frequency outliers, a signal that was strongly driven by association with temperature and/or cold tolerance. Seventy-two of these outlier markers, representing 28 different genes, were in a cluster of SNPs identified as a potential inversion polymorphism using linkage disequilibrium network analysis. This SNP cluster was unique in the data set, which was otherwise characterized by low levels of linkage disequilibrium, and markers in this cluster showed a significant enrichment of coding substitutions relative to the full SNP set. These 72 outlier SNPs appear to be transmitted as a unit, and represent a putative genomic island of divergence which varied in frequency with organismal cold tolerance. This relationship was strikingly similar across both native and invasive populations, all of which showed a very strong correlation with cold tolerance (R2 = 0.96 over all six populations). Notably, three of these populations have diverged recently (<100 years) and show little to no neutral divergence, suggesting that this genomic region may be responding to temperature on a relatively short time scale. This relationship indicates adaptation to temperature based on the action of a putative genomic island of divergence, perhaps partially explaining the extraordinary invasive ability of this species.
Introduction
Adaptation is an important component of species persistence in the face of rapid environmental shifts – provided that adaptive change can keep up with the pace of environmental change. Recent work has suggested that adaptation may take place on time scales relevant to climate change, spurring interest in the tempo and dynamics of these rapid shifts (Carroll et al., 2007; Hoffmann and Sgrò, 2011; Marques et al., 2018). Several classic examples of rapid adaptation come from invasion biology, which offers an unusual opportunity to examine adaptation in natural systems over short times scales (Maron et al., 2004; Sultan et al., 2013; Chen et al., 2018). In animals, two of the most notable examples concern the rapid (<20 years) establishment of clines in chromosomal inversions and thermoregulation across latitudinal gradients in invasive populations of Drosophila subobscura (Balanyá et al., 2006), and leg-length extension in cane toads at invasion fronts (Phillips et al., 2006).
Adaptation in the ocean may be slowed by high gene flow: long pelagic larval phases frequently result in very high dispersal distances relative to most terrestrial species (Palumbi, 2004). However, recent studies have detected signs of selection in an increasing number of marine species, including several that were previously believed to be genetically homogeneous (Sanford and Kelly, 2011; Pespeni and Palumbi, 2013; Lal et al., 2017). In isolated laboratory or wild populations, some marine species have demonstrated a capacity for significant adaptation in just a handful of generations (Conover and Munch, 2002; Barrett et al., 2011; Therkildsen et al., 2019; but see Kelly et al., 2012). However, it is unclear how rapidly adaptation can proceed in nature in systems with a high level of gene flow, despite the tremendous relevance of this question for the future of marine communities in a rapidly changing environment.
For traits that require adaptation at multiple loci, recombination during sexual reproduction normally breaks up co-adapted alleles, slowing change in these traits even further. Recent theoretical work has shown that adaptation may be facilitated by strong linkage between multiple adaptive alleles when they are co-inherited as blocks due to genomic architecture or other recombination-limiting mechanisms (Aeschbacher and Bürger, 2014; Thompson and Jiggins, 2014). This has been suggested as an important avenue of adaptation in high gene flow systems, because the existence of multiple co-inherited advantageous alleles increases the selection coefficient for the chromosomal region as a whole (Tigano and Friesen, 2016). Such islands of divergence have recently been associated with a migratory ecotype and small-scale population differentiation in wild Atlantic cod populations (Kirubakaran et al., 2016; Barney et al., 2017), supporting the hypothesis that genomic architecture may play an important role in long-term adaptation in marine systems.
High-dispersal marine invasive species, studied across a range of native and invasive habitats, offer an opportunity to examine adaptation on long and short time scales in very high-gene flow systems. The European green crab (Carcinus maenas) is an ideal system for exploring the nature and tempo of adaptive evolution in the sea. The native range of the species spans a wide latitudinal and thermal gradient, stretching from Iceland to Morocco in the northeast Atlantic. The species has also been a particularly successful invader, with established populations on almost every continent (Carlton and Cohen, 2003). In C. maenas, environmental niche modeling found that summer and winter temperatures were the most important predictors of species range, with minimal contributions from salinity, chlorophyll-a, and wave exposure (Compton et al., 2010). Local adaptation to temperature in Europe has been hypothesized to have influenced the dynamics of C. maenas invasion to the East Coast of North America (Roman, 2006). The species was first recorded in 1817 from Long Island Sound; subsequently, green crabs spread up and down the coast until their range included coastal Delaware and the Gulf of Maine by the 1950s (Blakeslee et al., 2010). The northern extent of this range remained within the Gulf of Maine until the 1980s, when green crabs rapidly spread throughout northern Nova Scotia, Prince Edward Island, and ultimately reached Newfoundland circa 2002 (Roman, 2006; Blakeslee et al., 2010). This rapid northern expansion was coincident with a second introduction from a northern source in the native European range, in contrast to the likely south/central European source of the original introduction (Roman, 2006; Darling et al., 2008). This led to speculation that the colder waters of the northern Maritime Provinces presented a thermal barrier to the original introduction that was overcome by a fresh infusion of genetic diversity from a cold-adapted northern European population. An alternative hypothesis posits an oceanographic, rather than adaptive, explanation for the species’ rapid range expansion after the second introduction. This theory suggests that coastal currents in Nova Scotia favor southward dispersal of larvae, limiting the northern spread of the initial introduction but facilitating the southern spread of the second introduction (Pringle et al., 2011).
Additional research supports the idea that adaptation to temperature in the native range may have played a role in facilitating the exceptional success of this species across a wide range of environments. Physiological comparison of C. maenas from European populations showed substantial differences in heat and cold tolerance even after one month of common-temperature acclimation, with crabs from Norway having more robust cold and less robust heat tolerance than those from Portugal (Tepolt and Somero, 2014). The same study discovered similar physiological differences in invasive populations spanning a north-south gradient. These physiological data were reinforced by a population genomics study indicating that most of the divergence between the same native range populations used in physiological work derived from non-neutral markers (Tepolt and Palumbi, 2015).
Here, we combine these prior data sets to identify patterns of selection between six green crab populations (Figure 1; Table 1). By integrating transcriptomics with physiological data, we can characterize long-term adaptation to temperature in the species’ native range, and examine the ongoing role that adaptation is playing as it spreads in its introduced range. We focus on SNPs derived from the cardiac transcriptome, allowing an explicit comparison to prior physiological work on cardiac response to temperature and identifying candidate genes that may be mediating these physiological responses. By comparing multi-locus genotypes among 72 individuals, we can also probe the genomic architecture of outlier loci. Our results show a strong association between a set of alleles and temperature across the native and invasive ranges; a role for adaptation in genes integral to cardiac structure and function; and a tight linkage of many temperature-correlated alleles in a potential genomic island of divergence.
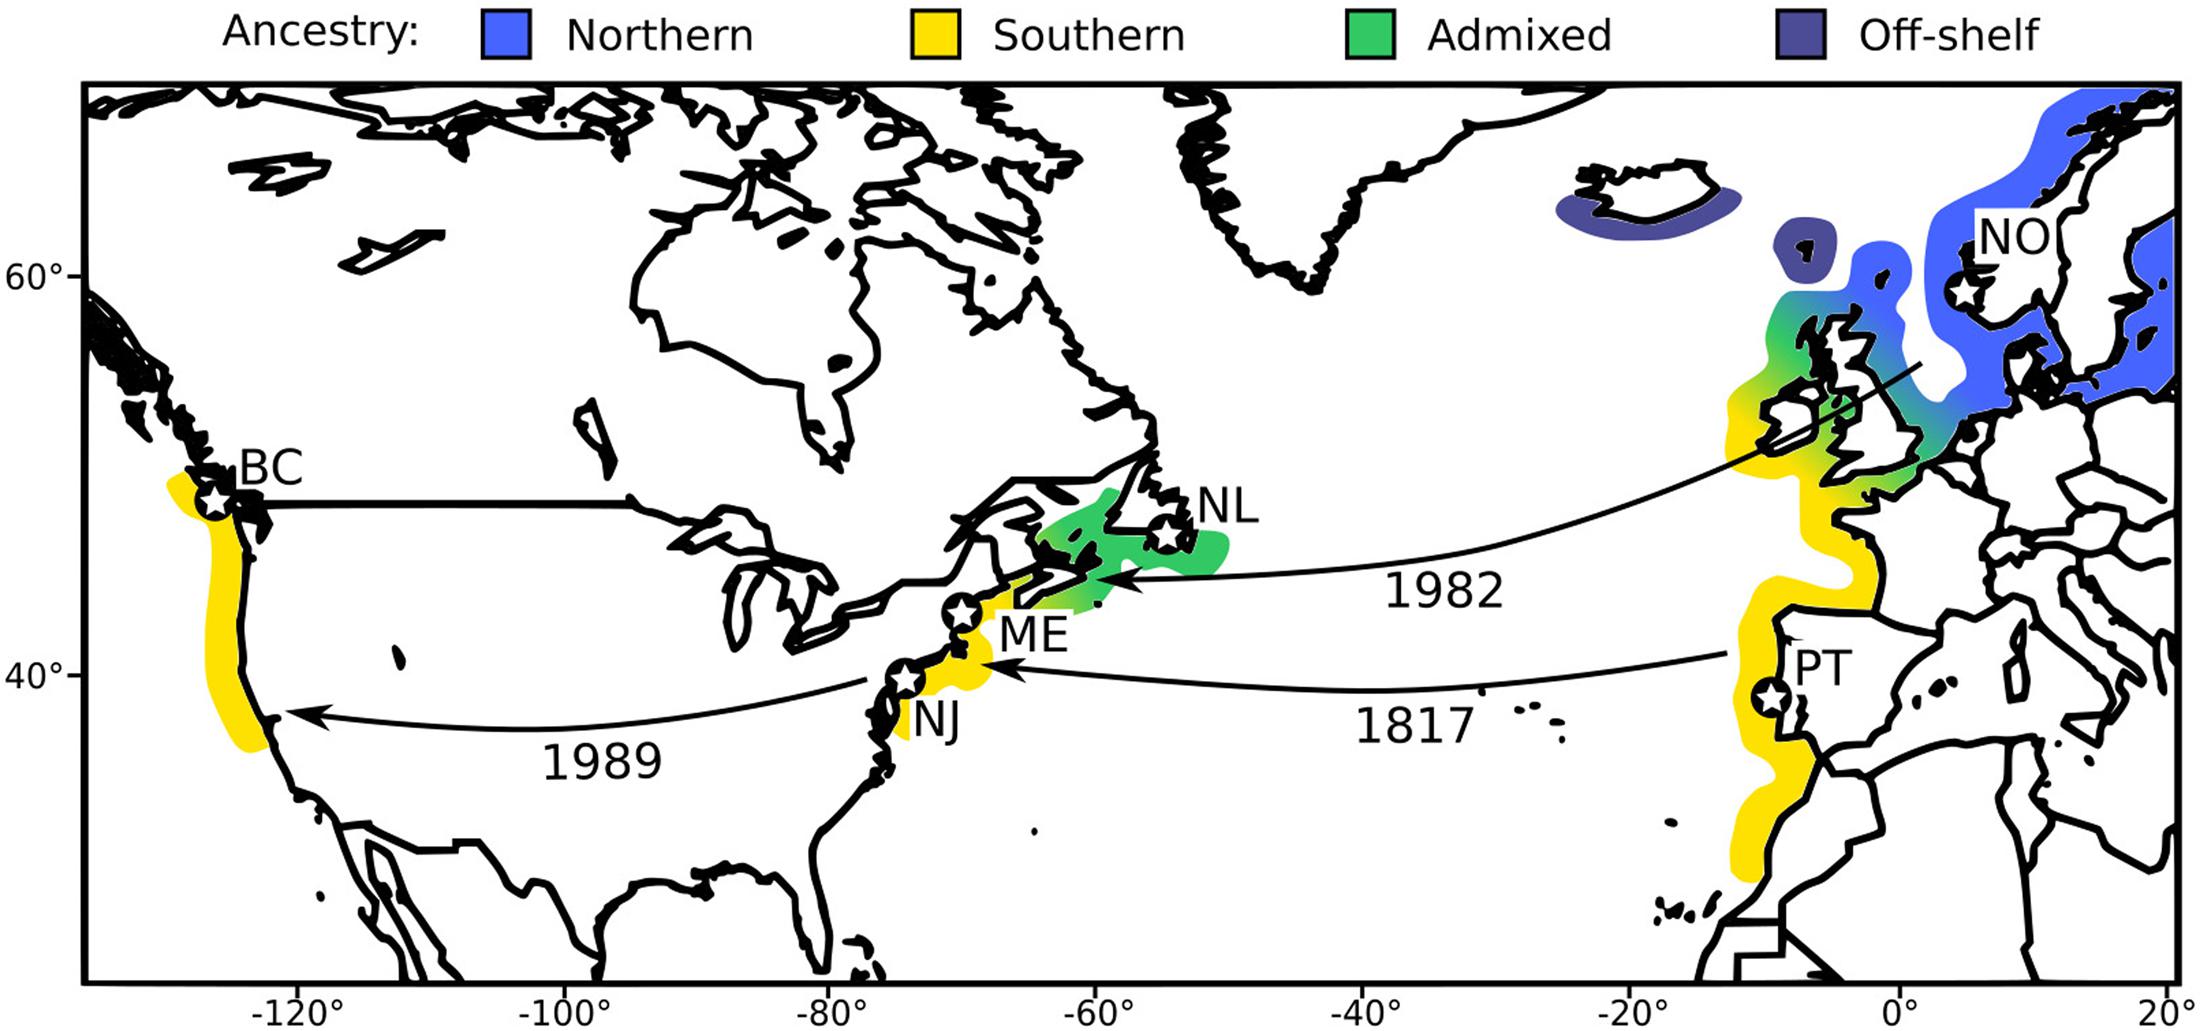
Figure 1. A: Map of study locations and invasion history of C. maenas in North America. Colors correspond roughly to genetic background. “Off-shelf” indicates a genetically distinct lineage that has not become established outside the species’ native range (Roman and Palumbi, 2004). Arrows represent major introduction events, with date of first record given. Stars indicate study sites, with site codes from Table 1.
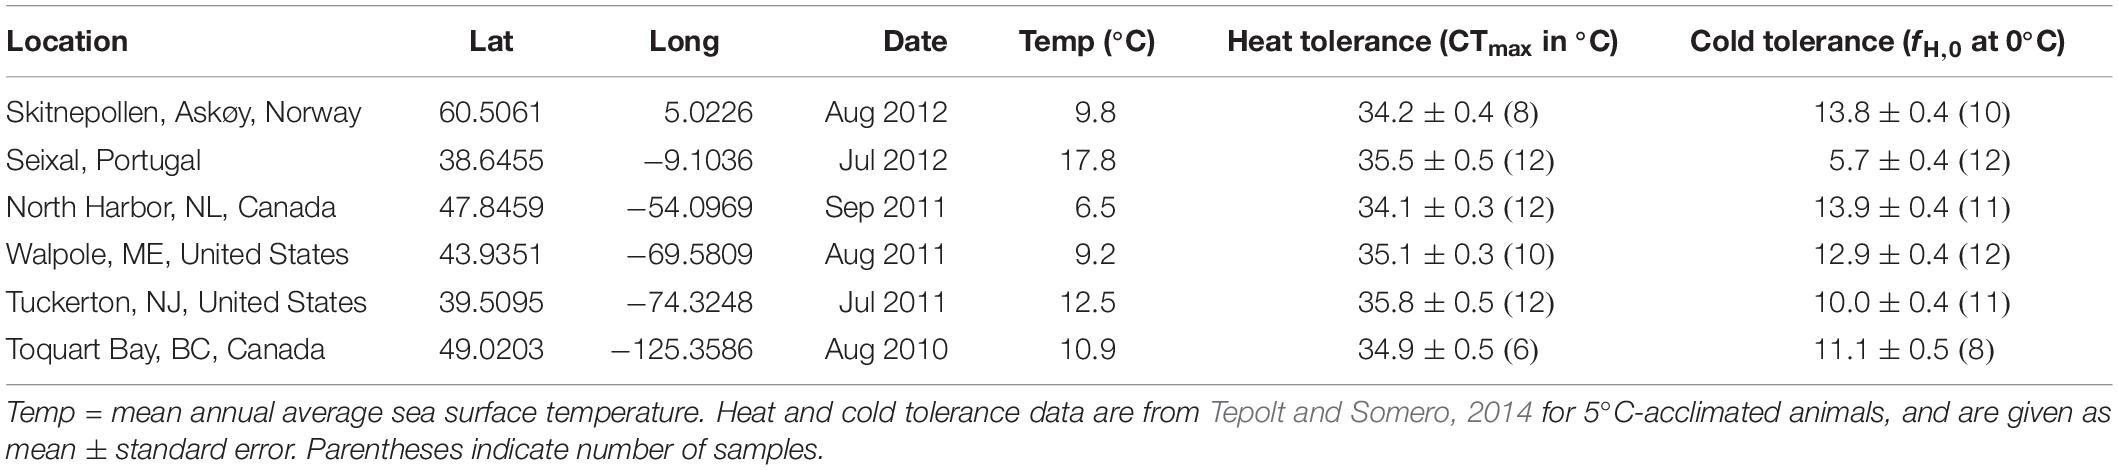
Table 1. Sampling details.
Materials and Methods
Sampling and Marker Discovery
Twelve crabs were collected from each of six locations in Europe and North America: Skitnepollen, Askøy, Norway; Seixal, Portugal; North Harbor, NL, Canada; Walpole, ME, United States; Tuckerton, NJ, United States; and Toquart Bay, BC, Canada (Figure 1; Table 1). At all locations, adult crabs were sampled by trapping from shore, and were acclimated to common conditions at 5°C or 25°C in the laboratory for 3-4 weeks prior to sampling tissue. After acclimation, cardiac tissue was collected from all individuals and preserved in RNAlater (Invitrogen, Carlsbad, CA, United States) prior to mRNA extraction. Further details on animal collection, acclimation, and sampling can be found in Tepolt and Somero, 2014.
The SNPs used in this analysis were characterized previously, and the methods are described in detail in Tepolt and Palumbi, 2015. Briefly, in that study RNA was extracted from cardiac tissue using a TRIZol protocol, and cDNA libraries were prepared for sequencing using a TruSeq RNA Sample Prep Kit from Illumina (San Diego, CA, United States). Samples were individually indexed and sequenced 12 per lane (randomized across lanes) using an Illumina HiSeq 2000 sequencer; sequencing was performed at the University of Utah’s Microarray and Genomics Core Facility. One lane used 101-bp paired-end reads in order to facilitate transcriptome assembly, while the remaining lanes were sequenced as 50-bp single-end reads.
Raw reads were processed following the pipeline and scripts outlined in De Wit et al., 2012, and available at http://sfg.stanford.edu. A de novo transcriptome assembly was generated using CLC Genomics Workbench v6.0.4 (CLC bio, Cambridge, MA, United States). Resulting contigs were annotated with blastx against UniProt’s Swiss-Prot and TrEMBL databases and GenBank’s nr protein database. Contigs identified as non-metazoan contamination were removed, resulting in a final assembly of 116,241 contigs, 28% of which were annotated.
Reads were mapped and SNPs detected using the SFG protocol and script (De Wit et al., 2012), updated to reflect changes to the underlying programs. Mapping to the de novo assembly was performed with BWA v0.7.4 (Li and Durbin, 2009), and high-quality nuclear SNPs were detected using the Genome Analysis Toolkit v2.4 (McKenna et al., 2010; DePristo et al., 2011). SNPs detected with this method were further filtered to retain only those with high-quality (Phred ≥ 20), high-coverage (≥10 reads) individual genotypes for a least 80% of individuals in each population; this process is described in detail in Tepolt and Palumbi, 2015. Ultimately, 10,790 nuclear SNPs confidently genotyped in at least 10 individuals per population were identified for downstream use.
Thermal Covariates
Long-term temperature data were previously calculated offshore of each location, using sea surface temperature (SST) data from the NOAA/NWS National Centers for Environmental Prediction covering the 25-year period of 1987–2011 (Reynolds et al., 2007). For this period, the annual mean temperature was calculated from monthly offshore SST averages for the 1 x 1 degree gridboxes closest to study locations. Heat and cold tolerance for each population were derived from a prior study, and consist of mean population tolerance after approximately 4 weeks of acclimation to 5°C under common conditions. Heat tolerance is given as critical cardiac maximum temperature in °C (CTmax), while cold tolerance is given as heart rate at 0°C (fH,0). Physiological and genomic data were derived from crabs collected and acclimated together: for more detail on temperature or physiological data, see Tepolt and Somero, 2014.
Scans for Selection
BayPass v2.1 was used to identify SNPs potentially under selection across all populations (Gautier, 2015). First, the core model was implemented over all populations to generate an omega matrix of pairwise covariance between populations (Supplementary Figure S1), and to calculate XtX values of differentiation for each SNP (Figure 2A). These values were calibrated using a simulated data set of 10,753 variable SNPs per Gautier (2015), and were considered “outliers” if they fell above the 0.5% FDR from the simulated data. Such markers, calculated from SNP frequencies only, were considered the “core” set of outlier loci.
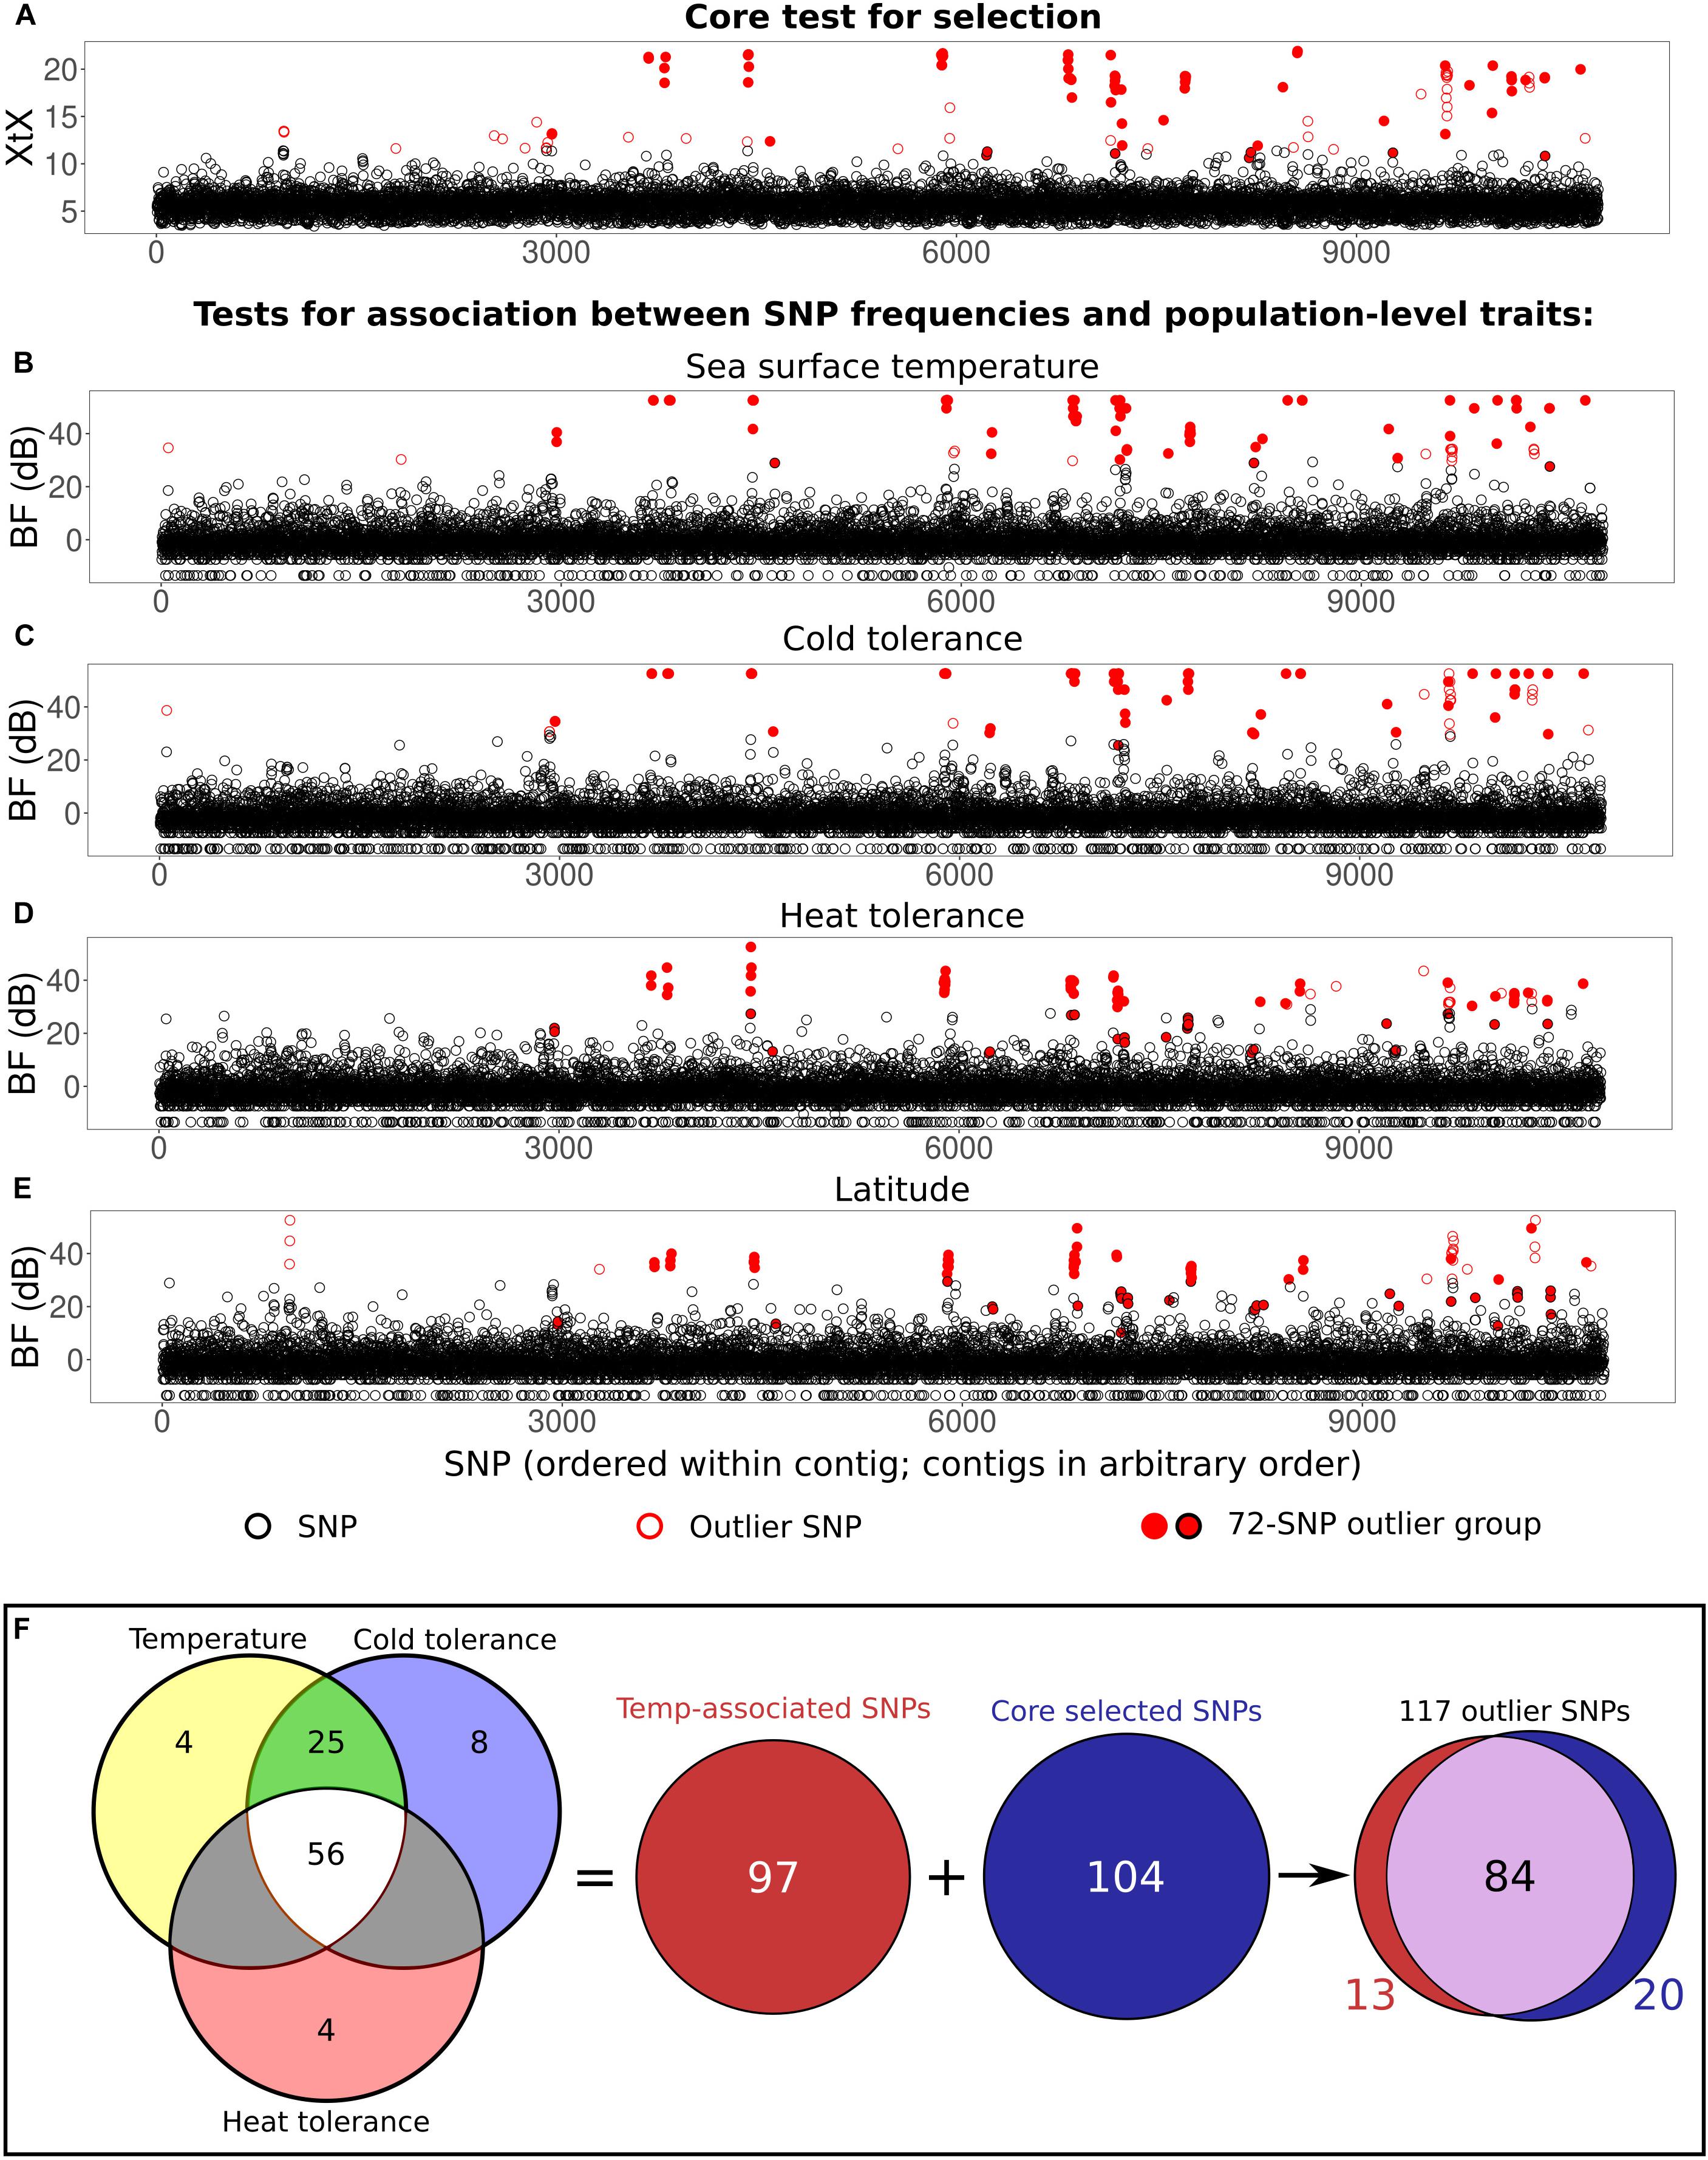
Figure 2. (A–E): SNPs identified as potentially under selection using BayPass; individual SNPs are in the same positions in all panels. SNPs outlined in red are outliers in that test; SNPs filled in red are in the 72-SNP LD cluster. SNPs are ordered within each contig; contigs are ordered arbitrarily. (A): Test for XtX frequency outliers based only on genotypes. (B–E): Tests for association between SNPs and population-level traits (temperature, heat and cold tolerance, and location latitude). (F): Overlap between SNPs identified with different tests. Left: Overlap between SNPs identified as associated with population-level traits: temperature, cold tolerance, and heat tolerance. Right: Overlap between SNPs identified as outliers in the core analysis (A) and SNPs identified as associated with at least one of the three thermal or physiological traits (B–D).
BayPass was also used to test association between SNPs and population-level covariates using the auxiliary covariate model, which calculates a Bayes Factor (BF) for the posterior probability of association between a given SNP and a covariate, taking into account the underlying structure between populations calculated under the core model. We ran this analysis separately with 3 different thermally-associated covariates: mean sea surface temperature at each location, mean cold tolerance, and mean heat tolerance (Figures 2B–D). We also ran it using location latitude (Figure 2E), which is only weakly correlated with temperature across all locations given the different oceanographic regimes in Europe and the East and West Coasts of North America. In all cases, covariates were scaled and no Ising prior was used (e.g., bis = 0) as there is no reference genome for C. maenas. SNPs associated with one or more thermal or physiological traits with a BF ≥ 30 dB were considered the “temperature-associated” set of outlier loci (Figure 2F). We explored the individual relationship between these SNPs and temperature in finer detail with partial Mantel tests using neutral FST from Tepolt and Palumbi, 2015 as a covariate to confirm the relationship while controlling in part for invasion history.
All BayPass analyses were run using 25,000 iterations thinned to 1,000 samples, following a 5000-iteration burn-in period after 20 pilot runs of 1000 iterations each to adjust parameter distributions.
Linkage Disequilibrium
Pairwise linkage disequilibrium (LD) was calculated among all 10,790 SNPs in the full data set using vcftools with options –geno-r2 for SNPs in the same contig and –interchrom-geno-r2 for SNPs on different contigs (Danecek et al., 2011); these values were converted into a single pairwise matrix for downstream analysis. Clusters of SNPs in extensive LD were identified from the pairwise R2 matrix using linkage disequilibrium network analysis, implemented in the R package ‘LDna’ v0.64 (Kemppainen et al., 2015). This approach uses network analysis to identify SNP clusters with unusually high within-group LD relative to the larger data set, without requiring information on their relative position in the genome. Such clustering may indicate the action of specific evolutionary processes on the genome, and the patterns by which clustered SNPs are distributed across genes and populations may further inform the nature of these processes (Kemppainen et al., 2015; Trevoy et al., 2019). For example, inversion polymorphisms and other extended genomic regions of decreased recombination are characterized by SNP clusters that separate individuals into three groups representing the two homozygous states (minor and major allele) and heterozygotes. We ran LDna’s ‘extractClusters’ command to detect outlier LD clusters with at least 45 edges (expected for 10 interconnected SNPs) and using a threshold of λ = 30 (Figures 3A,B). We chose these fairly strict parameters to ensure we identified larger clusters (≥10 SNPs) that were also compact, with high connectivity and strong LD among cluster SNPs (Kemppainen et al., 2015).
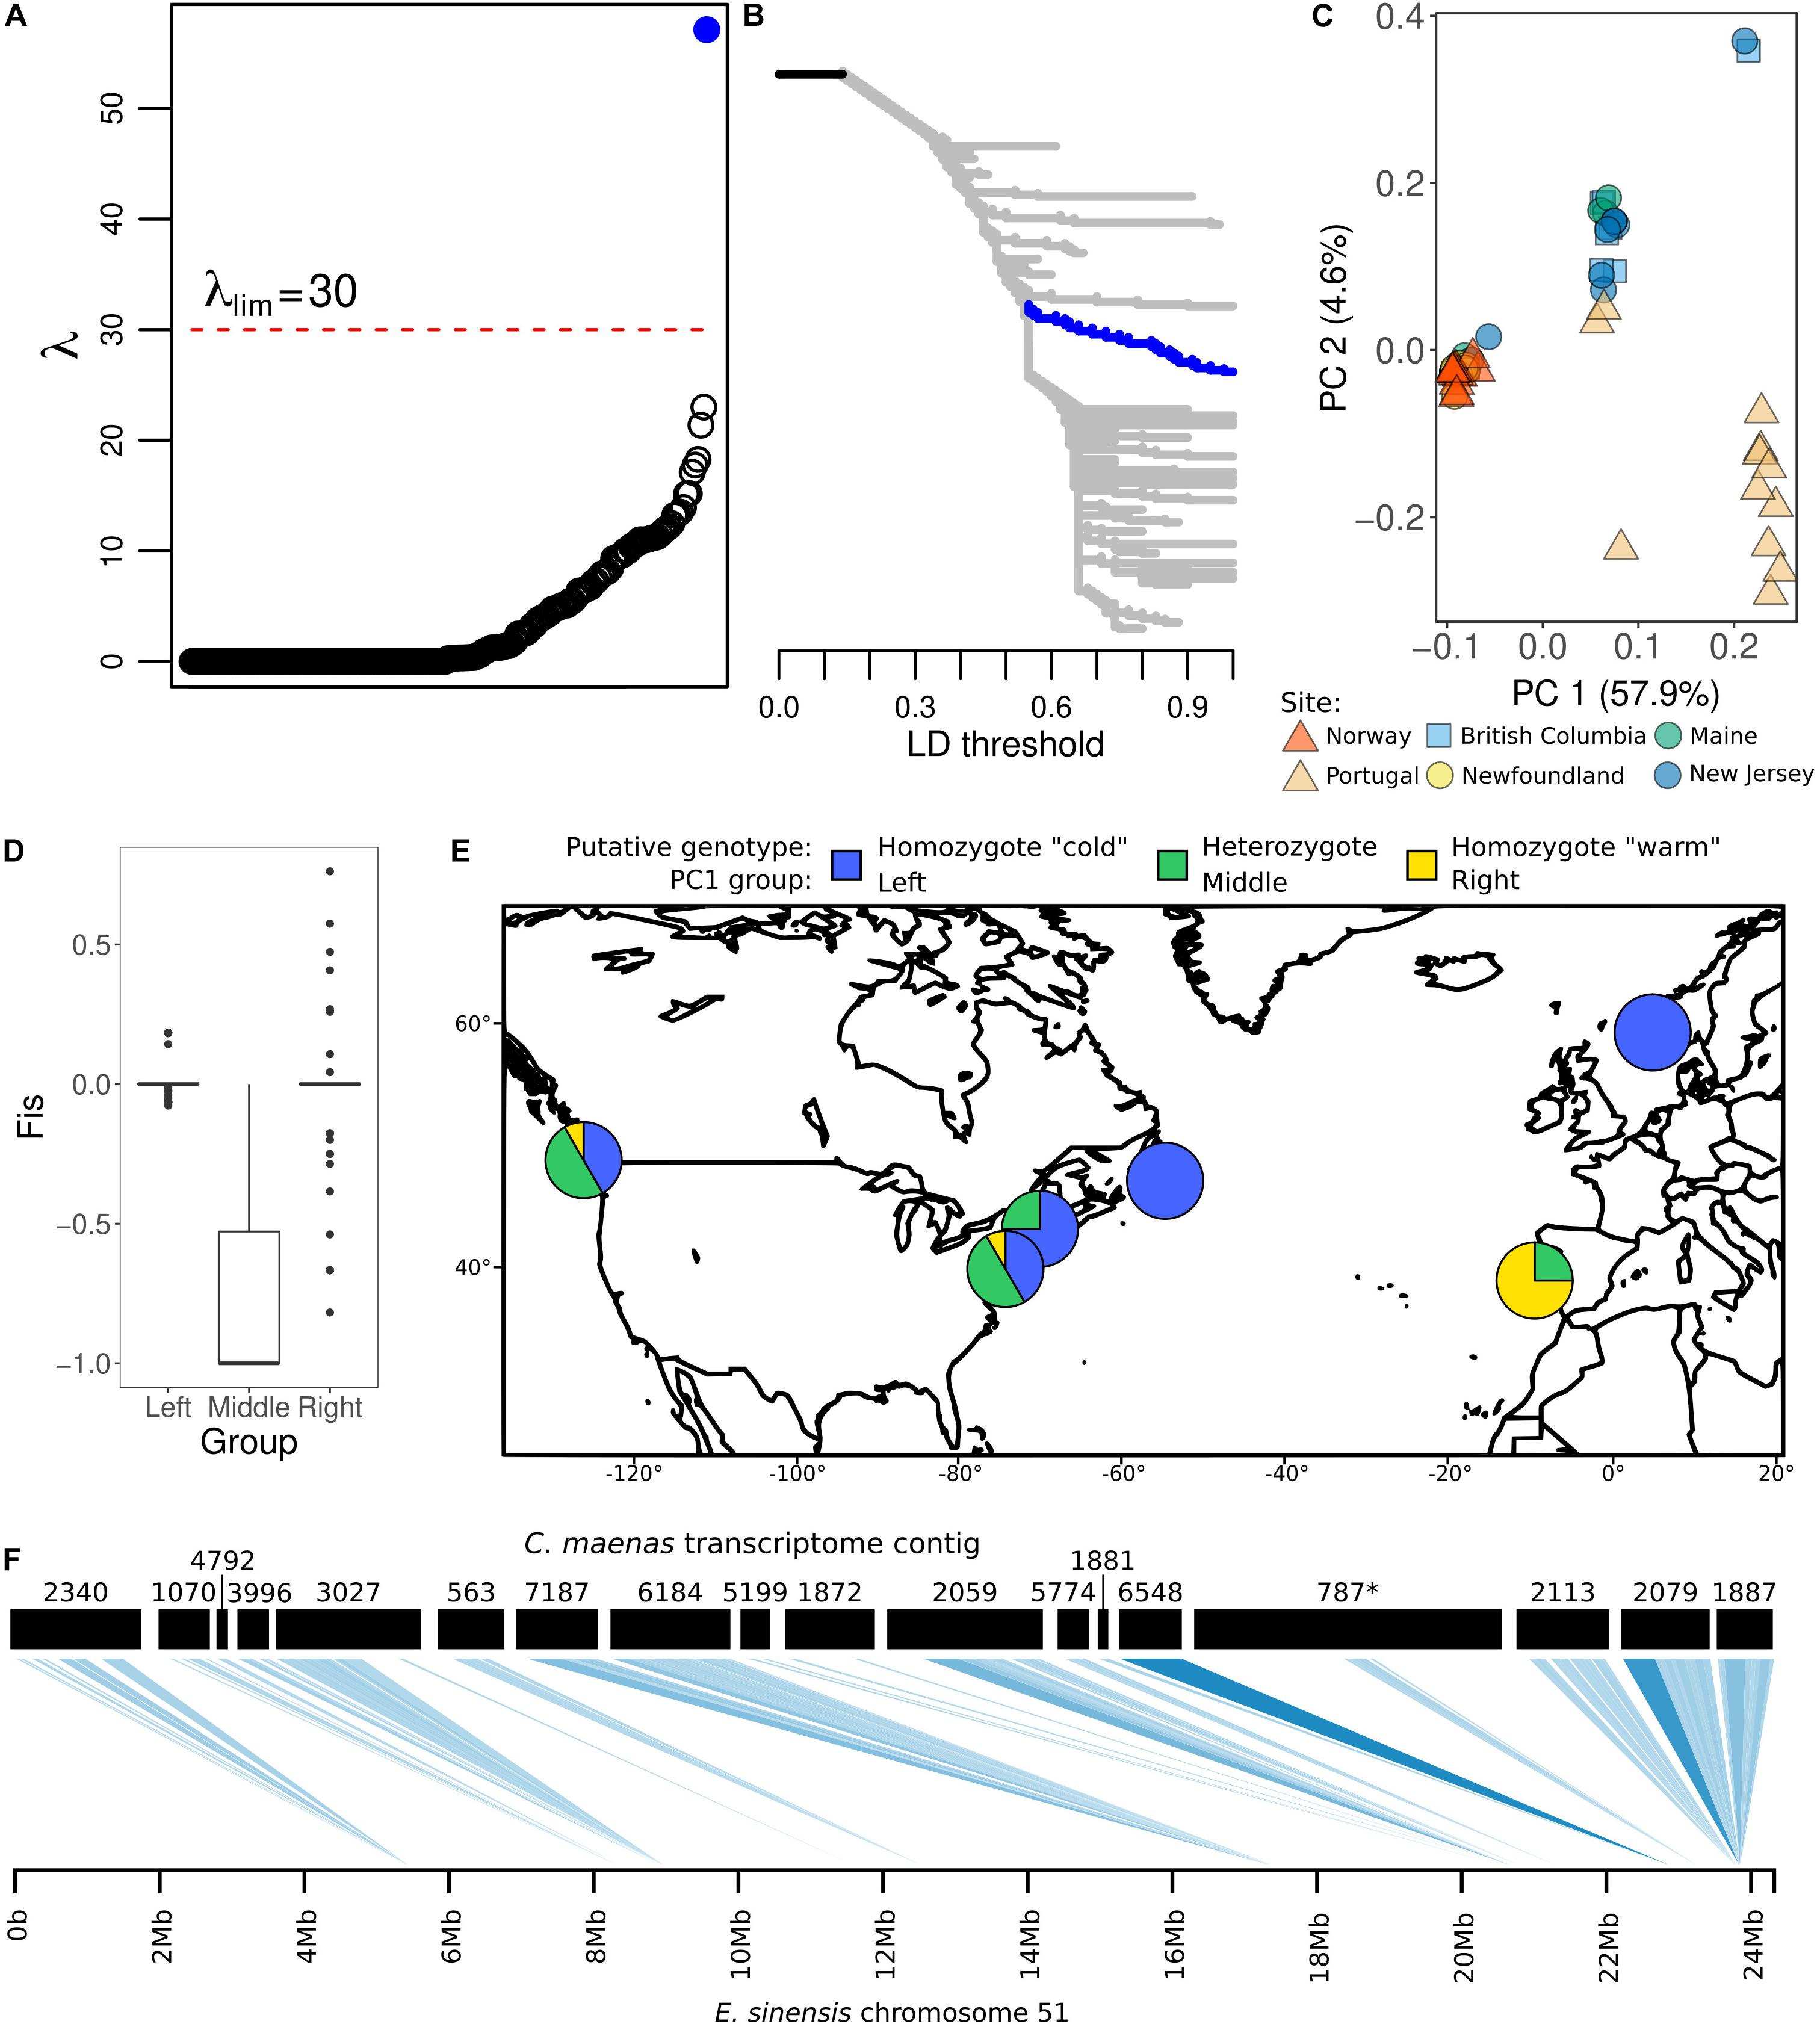
Figure 3. Linkage disequilibrium analysis. (A,B): LDna analysis of full 10,790 SNP set, using 45 edges and λ = 30. (A) shows all detected clusters ranked by λ value, where higher λ indicates a more compact and closely associated cluster of SNPs. Clusters above the λlim threshold are considered outliers. (B) shows a tree of SNP clustering based on pairwise R2 values. In both (A,B), dark blue indicates the large LD cluster including 72 outlier SNPs. (C): Principal Components Analysis of outlier SNPs in the 84-SNP LD cluster indicated in dark blue in (A,B). Points represent individual crabs; color and shape indicate sampling site. (D): Boxplot of FIS values for outlier SNPs in the 84-SNP LD cluster indicated in dark blue in (A,B), with individuals separated into three groups according to PC1 in (C). For Left and Right groups, boxplots appear as lines because the box hinges (25th to 75th percentiles) and whiskers (box hinges ± 1.5*interquartile range) are the same as the median. (E): Map showing distribution of putative divergence island alleles in each sampled site. Pie charts represent proportion of putative genotypes, based on PC1 clustering in (C). (F): Alignment to Eriocheir sinensis chromosome 51 of 18 contigs in the 84-SNP LD cluster indicated in dark blue in (A,B). Shade indicates alignment e-value (palest blue = 1–10; darkest blue = 0).
We used principal components analysis (PCA) to examine the relationship between all individuals based only on the 84 SNPs that were grouped into a single outlier LD cluster by LDna (Figure 3C). PCA was conducted using the SMARTPCA function implemented in EIGENSOFT v7.2.1 (Patterson et al., 2006; Price et al., 2006). To examine heterozygosity, we used Genepop v4.6 to calculate FIS at all 84 SNPs in this outlier LD cluster (Rousset, 2008), separated by PC1 axis grouping from the PCA (Figure 3D). The PC1 axis was also used to group individuals into putative alleles for this LD cluster, to better explore the relationship between allele frequency and geography or temperature tolerance (Figure 3E).
To examine whether the SNPs in the outlier LD cluster are likely to be co-located in the genome, we mapped their contigs against the genome assembly of the Chinese mitten crab (Eriocheir sinensis; GenBank GCA_013436485.1). While E. sinensis is not closely related to C. maenas, this was the only chomosome-level genome assembly available for a brachyuran crustacean at the time of analysis. We mapped the 32 contigs in the outlier LD cluster against this genome using BLAST+ v2.9.0, configured to use the blastn discontinuous megablast algorithm with a maximum allowed e-value of 1–10 (Camacho et al., 2009); we discarded mappings of <150 bp total. Results were visualized using Kablammo (Figure 3F; Wintersinger and Wasmuth, 2015).
Characterization of SNPs
SNPs were characterized as being in coding or untranslated regions (UTRs), using OrfPredictor to identify the longest open reading frame (ORF) in each contig sequence (Min et al., 2005). Putative coding regions were identified solely on the basis of contig sequence because 22% of contigs were unannotated and thus blastx data were unavailable to inform ORF identification. These putative ORFs were used to further characterize coding SNPs by their codon position and their class (synonymous or non-synonymous), using a custom python script.
Results
Outlier Loci
Across all six locations, BayPass detected 104 SNPs in 44 contigs as significant XtX outliers (FDR < 0.05, Figure 2A). In separate BayPass analyses of association between SNPs and population-level traits, 97 SNPs in 42 contigs were identified as being highly associated with at least one of three temperature-related traits: SST, cold tolerance, and heat tolerance (BF ≥ 30 db; Figures 2B–D). In total, we identified 117 overall candidate SNPs in the combined XtX outlier and trait covariation analyses: 20 were XtX outliers only, 13 were trait-associated only, and 84 SNPs were identified in both approaches (Figure 2F). In addition, five latitudinally-associated outlier SNPs were not associated with any of the other three traits; three of these loci were identified as XtX outliers (Figure 2E). Unsurprisingly, global FST was elevated among the 117 candidate SNPs, ranging from 0.12 to 0.61 for individual SNPs with a median value of 0.38.
Linkage Disequilibrium
Linkage disequilibrium network analysis identified one large, compact outlier LD cluster (λ = 57.12, with an LD merging threshold of R2 = 0.56; Figures 3A,B). This large outlier LD cluster comprised 84 SNPs in 32 contigs. Both alleles of this outlier LD cluster were present in all populations except for Newfoundland and Norway, where one allele was fixed. LD between all component SNPs within individual populations, including those in Portugal in the species’ native range, was consistent with LD calculated across all individuals (Figure 3C and Supplementary Figure S2).
Further exploration with PCA of the 84 SNPs in the large outlier LD cluster clearly separated all individuals into three distinct groups along the first PC axis, which explained 57.9% of variation (Figure 3C). These groups did not reflect overall population genetic structure (Tepolt and Palumbi, 2015), and individuals from several populations were found in multiple groups. PC2 explained much less of the overall variation (4.6%), and largely mirrored the PC1 groups with additional separation of some individuals from Portugal. When individuals were binned according their placement on the PC1 axis, FIS was centered at zero for the left and right groups, and at -1 for the middle group (Figure 3D). This is the pattern expected for inversion polymorphisms and other genomic regions in which recombination is limited, where each PC1 group represents a karyotype: in this case, homozygotes of the major allele on the left, heterozygotes in the middle, and homozygotes of the minor allele on the right (Figure 3E; Kemppainen et al., 2015).
Mapping against the E. sinensis assembly supports the idea that SNPs in this outlier LD cluster may be co-localized in the genome. Of the 32 contigs containing SNPs in this cluster, 22 mapped to E. sinensis chromosomes 51 (18 contigs; Figure 3F) and 49 (5 contigs): one C. maenas contig mapped to both of these chromosomes at different points along its length. Of the remaining 10 contigs, seven mapped against five other E. sinensis contigs and three could not be mapped.
Distribution of Outlier SNPs
While linkage disequilibrium was low across the full SNP set, the 117 outlier SNPs included several groups in LD. Most notably, a majority of outlier SNPs (N = 72) were contained in the large 84-SNP outlier LD cluster identified with LDna as having a cutoff of R2 = 0.56 (Figures 3A,B, Supplementary Figure S2, and Supplementary Table S1). Of the remaining 45 outlier SNPs (Supplementary Table S2), 20 were not strong candidates for selection. These were SNPs where the minor allele was rare (N = 4), that were variable in two or fewer of our sampling sites (N = 11), that showed frequency differences primarily between the native and invasive range (N = 4), or that were more strongly associated with latitude than temperature (N = 1; Supplementary Figure S3). We note that some of these 20 outlier SNPs may well be subject to thermal selection, but the six sites in our data set provided insufficient evidence to draw robust conclusions about them. Future work should characterize these regions in additional sites across thermal gradients to test their associations more thoroughly. After the removal of these 20 SNPs, we were left with 97 strong candidate SNPs for association with temperature.
Candidates for Selection to Temperature
Of the remaining 97 SNPs, 81 were variable in both the native and invasive ranges and showed a significant relationship between allele frequency and temperature and/or thermal physiology across all six locations (p < 0.05; partial Mantel test with neutral FST as a covariate; Figure 4 and Supplementary Table S2). The remaining 16 SNPs, which included a group of 15 SNPs in strong LD (R2 ≥ 0.8), appeared to have a potentially non-linear relationship between allele frequency and cold tolerance, which is difficult to disentangle from population history without data from additional sites (Supplementary Figures S3K–L).
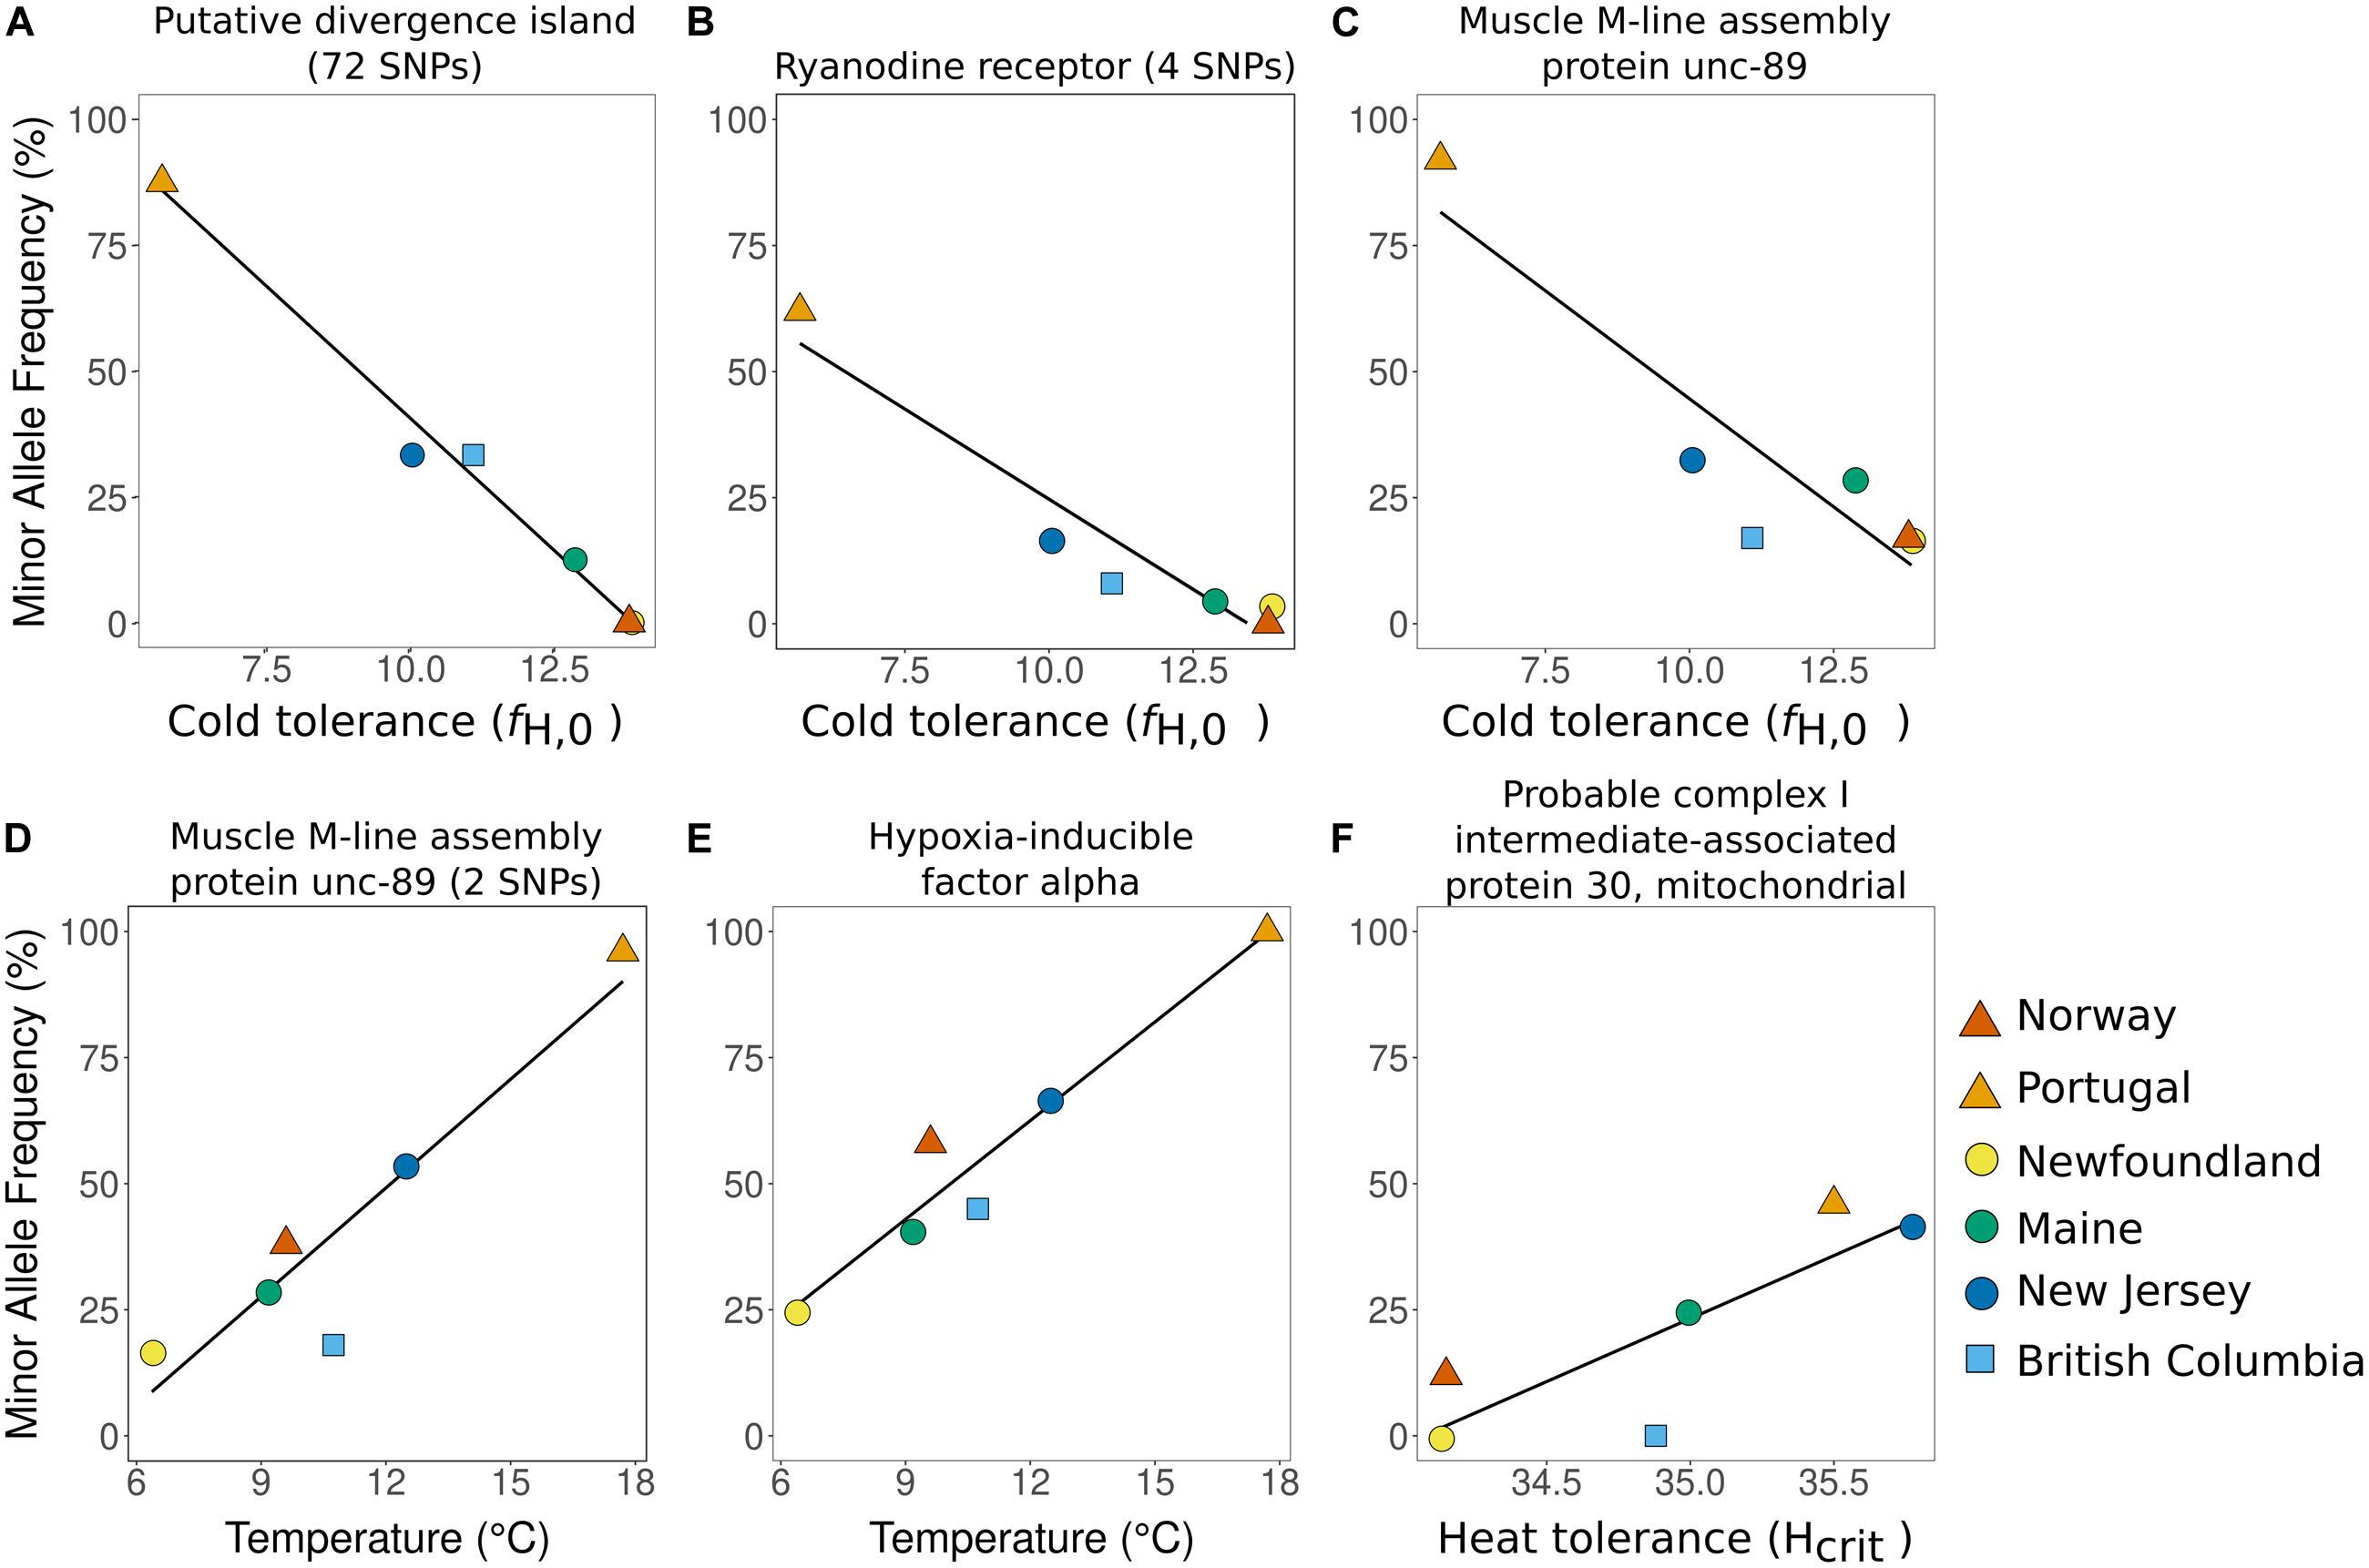
Figure 4. (A–F): Relationship between minor allele frequency and temperature or physiology at top candidates for ongoing selection. Each panel shows the linear relationship between minor allele frequency and population-level cold or heat tolerance or mean sea surface temperature. For (A), allele frequency was calculated over all 72 SNPs based on the first principal component in Figure 3C. For (B,D), points are shown for one representative SNP; all SNPs in these contigs are in strong LD and differences among them are negligible. For (C,E,F), plots show a single outlier SNP.
The most obvious candidates for rapid adaptation are those 81 SNPs having a significant relationship with temperature and/or thermal tolerance (Figure 4 and Supplementary Table S2). All of these regions showed a similar north-south cline: minor allele frequency was high is Portugal and low or absent in Norway, setting up an expectation that in this data set the minor allele is associated with warmer temperatures while the reference allele is associated with colder temperatures. The invasive range locations recapitulated this pattern, with a higher minor allele frequency in the warmer locations of New Jersey and British Columbia, and a lower frequency in Maine and Newfoundland, the coldest invasive range locations. While the similarity between Newfoundland and Norway can potentially be explained as an artifact of Newfoundland’s genetic input from the second introduction, the pattern in the rest of the invasive range is more robust. New Jersey, Maine, and British Columbia share a similar genetic background, and there is minimal genetic structure among these locations (Supplementary Figure S1). When only neutral SNPs were assayed, there was no differentiation between Maine and New Jersey (FST = -0.001; p = 0.5), and little between these two locations and British Columbia (ME-BC: FST = 0.01; p = 0.0001; NJ-BC: FST = 0.01; p < 0.0001; Supplementary Figure S1; Darling et al., 2008; Tepolt and Palumbi, 2015). By contrast with neutral genetic structure, when FST was calculated using only the 81 SNPs associated with temperature, there was significant differentiation between ME and NJ (FST = 0.09; p < 0.0001) and between ME and BC (FST = 0.08; p < 0.0001). Sites BC and NJ, which had very similar cold tolerance and mean SST, were not significantly differentiated when candidate SNPs were considered (FST = −0.02; p = 1).
Linkage disequilibrium was high among the remaining 81 candidate SNPs, which included 72 SNPs in the outlier LD cluster, a group of four SNPs in strong LD (R2 ≥ 0.8), a group of two SNPs in strong LD, and three additional independent SNPs. Three of these six clinal outlier groups were most strongly correlated with cold tolerance (R2: 0.79–0.96; Figures 4A–C), and two others were most strongly correlated with temperature (R2: 0.80–0.89; Figures 4D,E). Three of these five, including the 72 SNPs in the outlier LD cluster, were significantly associated with both traits. Only one clinal outlier showed a significant association with heat tolerance (R2: 0.54; Figure 4F).
Notably, the 72-SNP outlier group was the strongest of the six candidate groups for thermal adaptation. For this group of SNPs, we based minor allele frequency (MAF) calculations on the putative karyotypes suggested by Principal Components analysis (Figure 3C). This group of SNPs showed a highly significant association between allele frequency and cold tolerance, with a correlation of 0.96 after accounting for neutral genetic structure in a partial Mantel test (p = 0.001; Figure 4A; Supplementary Table S2). In Europe, the minor allele frequency was 87.5% in Portugal but 0% in Norway. We observed similar trends between northern and southern locations in the invasive range, where the minor allele was absent in Newfoundland, found at 12.5% frequency in Maine, and was highest at 33.3% in New Jersey and British Columbia, the least cold-tolerant invasive range locations (Figure 3E).
Possible Gene Functions
The 72-SNP outlier group was significantly enriched for SNPs in coding regions relative to the full data set, with 66.7% of SNPs (48/72) predicted to be in coding regions versus 51.1% overall (5,514/10,787; p = 0.005). Non-synonymous substitutions followed a similar but weaker pattern, with 16.7% of SNPs (12/72) predicted to change amino acid sequence within the 72-SNP outlier group versus 11% (1,186/10,787; p = 0.09) over the full set of tested SNPs. The twelve predicted amino acid-changing outlier SNPs in the 72-SNP group were found in eight different contigs: ubiquitin associated protein 2-like protein, hypoxia-inducible factor alpha, saposin, an uncharacterized peptidase C1-like protein (3 SNPs), two contigs with uncertain annotations as fibrous sheath CABYR-binding protein (2 SNPs) and neurofilament heavy polypeptide, and two un-annotated contigs (one of which contained 2 predicted amino acid-changing outlier SNPs; full list of outlier SNPs given in Supplementary Table S1).
Outside of the 72-SNP outlier group, other thermally or physiologically correlated outlier SNPs occurred in contigs annotated as muscle M-line assembly protein unc-89 (2 contigs), ryanodine receptor, and probable complex I intermediate-associated protein 30, mitochondrial (Figures 4B–F; Supplementary Table S2). One additional thermally correlated SNP was in the same hypoxia-inducible factor alpha contig included in the 72-SNP outlier group, but was not part of that LD group at R2 ≥ 0.5. The ryanodine receptor contig contained 2 outlier SNPs in LD, one non-synonymous.
Discussion
Our study strongly implicates a potential genomic island of divergence in promoting adaptation in the invasive green crab. This genomic region arose in the species’ native range, where one “warm-adapted” allele is favored in Portugal and the alternate “cold-adapted” allele is favored in Norway (Figure 3E). Allele frequencies in four invasive populations fall almost perfectly along the line predicted by the native range sites (Figure 4A); this relationship suggests ongoing selection on this region after the species’ establishment and spread in North America over the past 20–200 years. Patterns of linkage disequilibrium and heterozygosity among these SNPs suggest that it represents a region of reduced recombination such as an inversion polymorphism (Figures 3A–D), a type of genomic architecture which is increasingly being appreciated for its importance in shaping adaptation in high gene flow systems. Our work suggests that standing genetic variation at this locus evolved in the species’ native range and was introduced into North America, where it rapidly diverged as the species spread across a thermal gradient in its new range.
Rapid Adaptation via a Potential Genomic Island of Divergence
The majority of the SNPs that were strongly associated with cold tolerance and temperature were found in a large, compact LD cluster comprised of 84 SNPs in 32 contigs. Linkage disequilibrium network analysis identified this cluster as by far the largest and strongest outlier LD cluster in our entire SNP set; PCA and FIS on cluster SNPs further suggested that they are held together in a region of limited recombination (Figures 3A–D). In prior work, such patterns of linkage disequilibrium have been found to underlie known inversion polymorphisms in three-spined stickleback, and putative inversions supported by linkage mapping and cytology in mosquitoes and by draft genome data in chum salmon (Kemppainen et al., 2015; McKinney et al., 2020). We note that this strong LD was observed across all locations, including those in the native range, where both alleles of this cluster are present in Portugal with no apparent intermediate forms (Figures 3C,E, Supplementary Figure S2). While strong LD can be a byproduct of demographic shifts such as population bottlenecking and subsequent expansion (Slatkin, 2008), in the case of C. maenas this association arose prior to introduction and thus cannot be explained by invasion-associated changes. In addition, demography is predicted to produce extended LD across the genome (Slatkin, 2008; Kemppainen et al., 2015), whereas in this system, we observed a tightly clustered group against a background of otherwise low LD.
This type of LD is increasingly being uncovered in scans for selection, and such genomic islands of divergence, or supergenes, have been posited to play an important role in adaptation (Aeschbacher and Bürger, 2014; Thompson and Jiggins, 2014). The genomic mechanisms that create and maintain islands of divergence are a subject of active research, but there is an increasing appreciation of their importance in intraspecific adaptation (Thompson and Jiggins, 2014; Tigano and Friesen, 2016). In many systems, divergence island frequency has been correlated with environmental or adaptive differences between populations (Hoffmann and Rieseberg, 2008; Ayala et al., 2011; Twyford and Friedman, 2015). In Atlantic cod, recent work identified two adjacent chromosomal inversions as responsible for maintaining a stable behavioral polymorphism between ecotypes (Kirubakaran et al., 2016). In periwinkles, a series of inversions are associated with small-scale adaptation across multiple environmental axes encompassing both predation and tidal height (Morales et al., 2019). In invasion biology, a classic example is that of Drosophila, in which an inversion polymorphism shows a distinct latitudinal cline both in the species’ native and invasive ranges (Balanyá et al., 2006; Kapun et al., 2016). While chromosomal inversions frequently underlie islands of divergence, blocks of co-inherited genes can also be maintained by other recombination-reducing architectures or by strong balancing selection (Tigano et al., 2018; Lamichhaney and Andersson, 2019).
Without a reference genome, we cannot be sure that the SNPs in this outlier LD group are in an inversion, but our analyses suggest this possibility. Many of the contigs in this outlier LD group map to just two chromosomes in the E. sinensis genome, most to chromosome 51 (Figure 3F). Given that E. sinensis and C. maenas are not closely related (they share an infraorder but not a family), we suggest that this supports the idea that the SNPs in the in outlier LD group are co-located in the C. maenas genome. Regardless of its specific chromosomal architecture, the relationship between this group of SNPs and cold tolerance suggests that this region plays a strong role in adaptation in green crabs.
The nature of the SNPs in the LD cluster also supports an adaptive explanation. Relative to the full SNP set, there are significantly more outlier SNPs in coding regions in this putative divergence island than expected by chance. Consistent with this pattern, there were slightly more amino acid-changing SNPs than expected in the cluster (p = 0.08 for all 72 outlier cluster SNPs). This enrichment in coding variation is consistent with the idea that inversions accumulate multiple advantageous mutations (Aeschbacher and Bürger, 2014; Thompson and Jiggins, 2014; Tigano and Friesen, 2016; Faria et al., 2019), and suggests that several of these mutations may have fitness-related consequences for the organism. Non-synonymous SNPs were found in eight of 28 contigs, four of which were well-annotated. One such contig was hypoxia-inducible factor alpha (HIF-α), a master regulator of hypoxia response. In marine invertebrates, oxygen availability may be an important component of thermal tolerance (Pörtner, 2002). Mutations in the HIF-α gene in Drosophila have been shown to significantly impact cardiac response to hypoxia (Zarndt et al., 2015), and HIF-α mRNA and protein expression increased with both acute and seasonal cold-temperature exposure in the goldenrod gall fly (Morin et al., 2005). Here, we found two linked outlier HIF-α SNPs to be significantly correlated with cold tolerance (Supplementary Table 1), while the HIF-α contig itself showed significantly different expression in C. maenas between 5°C and 25°C acclimation (CKT and SRP, unpublished data). Given these data, we suggest that this hypoxia-related regulatory gene may play an important role in green crab adaptation and that it may be helping to drive selection on this outlier LD cluster along with other complementary mutations.
In addition, since we are working solely with transcriptome data in a genome-free system, it is almost certain that this putative divergence island contains more (unexpressed) adaptive variation than we see in this study. Further characterization of the C. maenas genome, particularly using long-read sequencing, will help to illuminate the importance of genomic architecture (e.g., inversion) to adaptation in the species. More extensive genomic sequencing will also allow us to identify the full extent of potentially adaptive diversity represented in this cluster of genes, regardless of their expression.
Temperature as an Agent of Selection
Our current and prior research in this system support the hypothesis that the northern range expansion of C. maenas was facilitated at least in part by local adaptation of a northern source population in the native range. In this study, we observed clear allele frequency differences between native range locations in many of the SNPs identified as potentially under selection, consistent with previous work in this system demonstrating that overall differentiation between Norway and Portugal was largely driven by non-neutral markers (Tepolt and Palumbi, 2015). Physiological research on thermal tolerance in the populations studied here showed that the Portuguese population was significantly more heat- and less cold-tolerant than the Norwegian population, even after 3–4 weeks of common temperature acclimation (Tepolt and Somero, 2014). Together, these results strongly suggest local adaptation to temperature in Europe.
The current research, showing correlation between multiple markers and both temperature and cold tolerance, suggests that temperature-sensitive alleles were likely introduced from the species’ native European range in the first introduction to North America in the early 1800s (Carlton and Cohen, 2003). Once in the invasive range, this pool of standing variation provided the raw material for ongoing selection to temperature across new environmental gradients. While this putative divergence island appears strongly linked to temperature, it is likely not the only genetic driver of temperature tolerance in this system. Other research suggests that mitochondrial lineages may also play a role, and that they may contribute to observed cold tolerance differences between crabs descended from the first and second introductions to the East Coast (Coyle et al., 2019). Alternatively, northern dispersal of the initial C. maenas introduction may have been limited by prevailing southward currents, whereas the second introduction was to a more favorable location for spread in the Canadian Maritimes (Pringle et al., 2011). Future work on mitochondrial variation and physiology, and in particular on mitonuclear interactions in the East Coast introgression zone, will help to better understand the full genetic basis of thermal adaptation in this system.
Given the maintenance of both alleles of this putative divergence island in both the native and invasive ranges, coupled with the close tracking of allele frequency with temperature, it seems likely that this polymorphism is maintained in populations by spatial balancing selection. This process has been documented across strong selective gradients on smaller spatial scales, including in oysters settling across a salinity gradient (Koehn et al., 1980), and in corals inhabiting neighboring pools with different thermal variability (Bay and Palumbi, 2014). On larger scales, spatial balancing selection has been inferred in highly dispersive marine species including acorn barnacles and summer flounder (Hoey and Pinsky, 2018; Nunez et al., 2020). Green crabs are a likely candidate for this type of selection, since the species has a very high dispersal potential (100s of km) and a range that spans strong thermal selective gradients (Sanford and Kelly, 2011). While this study looks across a relatively small number of sites, the close relationship between allele frequency and thermal tolerance we observe across multiple thermal gradients supports the idea that this region is highly responsive to temperature. Characterization of allele frequencies at this putative divergence island along thermal gradients on a finer spatial scale, and in additional invasive ranges, would help to better understand the dynamics of this region.
Patterns of allele frequency variation in the outlier LD cluster were very strongly associated with cold tolerance, and more moderately with sea surface temperature, but not with heat tolerance. This pattern is repeated in four additional candidate genomic regions, so that of the six top candidate regions for ongoing thermal selection in this system, only one region was significantly associated with heat tolerance (R2 = 0.54; R2 = 0.87 without BC). This overlap between cold tolerance and temperature is unsurprising, as these traits were tightly correlated in our data set (R2 = 0.91, p = 0.002). By contrast, heat tolerance was a more independent measure, and was not strongly correlated with either temperature (R2 = 0.45, p = 0.09) or cold tolerance (R2 = 0.51, p = 0.07). This disconnect may be due in part to experimental differences in how cold and heat tolerance were measured, with heart rate at 0°C more closely conforming to mean sea surface temperatures than critical maximum temperature in our dataset (Tepolt and Somero, 2014). However, if the observed allele-frequency clines are formed and maintained by spatial balancing selection, it is likely that the thermal tolerance patterns we see in adults reflect selection on thermal phenotypes early in life, rather than direct selection on the measured traits themselves (Koehn et al., 1980; Sanford and Kelly, 2011).
Finally, the identity of the outlier-containing contigs is consistent with adaptation, even outside of the outlier LD cluster. Several SNPs associated with temperature and thermal tolerance are located in genes important in invertebrate muscle structure and function. These include muscle M-line assembly protein unc-89, a so-called “giant protein” integral to the structure and function of sarcomeres in striated muscle, including cardiac muscle (Hooper et al., 2008). Another gene containing a charge-changing outlier SNP, ryanodine receptor, is a Ca2+ release channel in the sarcoplasmic reticulum and is vital to muscle contraction (Quinn et al., 1998). Tropomodulin helps to regulate the length of actin filaments in invertebrate muscle (Hooper et al., 2008). Finding outlier SNPs in several essential muscle genes is suggestive, given that our data derive from the cardiac transcriptome and that allele frequency at these outliers is strongly correlated with population-level cardiac physiology. Previous studies have established extensive structural and functional changes in ectotherm hearts in response to short-term acclimation at different temperatures, including increases in heart size and efficiency at low temperatures (Klaiman et al., 2011). Given that significant structural differences in cardiac tissue are characteristic of short-term responses to temperature, we suggest that they are also likely targets of long-term selection.
The History of Adaptation
In C. maenas, we have a system with the high dispersal and gene flow that typify many marine systems: along the West Coast of North America, the species’ range expanded more than 600 km in a single breeding season due to favorable oceanographic conditions for dispersal (Tepolt et al., 2009). In the marine realm, high dispersal ability often results in high levels of gene flow and consequently low population structure (Palumbi and Pinsky, 2013). In such cases, strong selection can potentially counter gene flow and result in divergent allele frequencies. It has been suggested that islands of divergence may be particularly important to maintaining adaptive differences in the face of high gene flow, by allowing the cumulative selective advantage of several linked advantageous mutations to create a strongly favored supergene that is inherited as a block (Tigano and Friesen, 2016). Our data provide support for the importance of supergenes in maintaining adaptive differences in the face of high gene flow. This putative supergene was identified using tests for both selection and association with temperature and thermal tolerance, and we see a strong correlation between allele frequency and physiological cold tolerance globally.
The ongoing adaptation detected in this study appears to have derived from standing genetic variation present in the first introduction of green crabs from south-central Europe. There is no evidence for any genetic influence of the second, northern introduction in three of our four invasive range locations, suggesting that secondary introduction of cold-adapted alleles is not the driver of the patterns we identified as ongoing selection. However, it is likely that finer-scale geographic sampling of the East Coast, particularly in the region where the two introductions introgress, will identify cold-adapted markers introduced from northern Europe which are under selective pressure on the East Coast (e.g., Jeffery et al., 2017). Future work on targeted genotyping of all putatively adaptive markers along fine spatial scales in Europe and the East Coast will help to disentangle the contributions of standing variation and multiple introduction to the adaptive history of this highly invasive species.
Conclusion
Adaptation is likely to play a vital role in species’ response to changing climate. In the ocean, where dispersal is often very high, we are only beginning to appreciate the role adaptation may play in structuring populations, and the time scale of this adaptation remains largely unknown. Here we discovered signs of selection to temperature in a high-dispersal invasive species across a range of time scales. This adaptation appears to have been driven at least in part by temperature, and mediated by a potential genomic island of divergence comprising at least 28 genes. This supports the hypothesis that genomic architecture may play a key role in adaptation in the face of gene flow, and provides a first marine example of a potential supergene under rapid, ongoing selection. Importantly, our genetic data build on a robust foundation of physiological research, providing a clearer picture of adaptation at multiple levels. Taken together, our data suggest that adaptation may occur quite quickly even in species with very high gene flow, underscoring the importance of incorporating adaptation into predictions of species’ responses to rapid environmental changes.
Data Availability Statement
Publicly available datasets were analyzed in this study. The de novo Carcinus maenas cardiac transcriptome, SNP positions and individual genotypes are deposited in Dryad at doi: 10.5061/dryad.g8b96. The raw sequencing reads are archived at NCBI’s Sequence Read Archive under BioProject ID PRJNA283611, BioSample numbers SAMN03653390-SAMN03653473. Custom scripts used in this analysis are available in a figshare archive at 10.6084/m9.figshare.c.5182427.v1.
Author Contributions
CT designed the study, carried out the data analysis, and drafted the manuscript. SP participated in the design of the study and interpretation of results, and helped draft the manuscript. Both authors gave final approval for publication.
Funding
CT was supported on this project by a National Defense Science and Engineering Grant, a Stanford Graduate Fellowship, a Stanford Center for Computational, Evolutionary, and Human Genomics Fellowship, and the Penzance Endowed Fund in Support of Assistant Scientists at WHOI. The sampling and sequencing of the data used in this analysis was funded by the Partnership for the Interdisciplinary Study of Coastal Oceans, the Myers Trust, the Explorer’s Club Exploration Fund, the Lerner Gray Memorial Fund of the American Museum of Natural History, the Vice Provost for Graduate Education at Stanford, the Eugene C. and Aileen E. Haderlie Memorial Fund, and a National Science Foundation Doctoral Dissertation Improvement Grant (1210057).
Conflict of Interest
The authors declare that the research was conducted in the absence of any commercial or financial relationships that could be construed as a potential conflict of interest.
Acknowledgments
We thank Katie Lotterhos for her insights into selection analyses in invasions. For field assistance, we sincerely thank John Lee; the Bamfield Marine Centre; the Smithsonian Environmental Research Center; the Rutgers University Marine Field Station; the Darling Marine Center; Iain McGaw and the Ocean Sciences Centre; João Canning-Clode and the Laboratório Marítimo da Guia; and Henrik Glenner and the Espeland Marinbiologisk Stasjon.
Supplementary Material
The Supplementary Material for this article can be found online at: https://www.frontiersin.org/articles/10.3389/fevo.2020.580701/full#supplementary-material
References
Aeschbacher, S., and Bürger, R. (2014). The effect of linkage on establishment and survival of locally beneficial mutations. Genetics 197, 317–336. doi: 10.1534/genetics.114.163477
Ayala, D., Fontaine, M. C., Cohuet, A., Fontenille, D., Vitalis, R., and Simard, F. (2011). Chromosomal inversions, natural selection and adaptation in the malaria vector Anopheles funestus. Mol. Biol. Evol. 28, 745–758. doi: 10.1093/molbev/msq248
Balanyá, J., Oller, J. M., Huey, R. B., Gilchrist, G. W., and Serra, L. (2006). Global genetic change tracks global climate warming in Drosophila subobscura. Science 313, 1773–1775. doi: 10.1126/science.1131002
Barney, B. T., Munkholm, C., Walt, D. R., and Palumbi, S. R. (2017). Highly localized divergence within supergenes in Atlantic cod (Gadus morhua) within the Gulf of Maine. BMC Genomics 18:271. doi: 10.1186/s12864-017-3660-3
Barrett, R. D. H., Paccard, A., Healy, T. M., Bergek, S., Schulte, P. M., Schluter, D., et al. (2011). Rapid evolution of cold tolerance in stickleback. Proc. R. Soc. B 278, 233–238. doi: 10.1098/rspb.2010.0923
Bay, R. A., and Palumbi, S. R. (2014). Multilocus adaptation associated with heat resistance in reef-building corals. Curr. Biol. 24, 2952–2956. doi: 10.1016/j.cub.2014.10.044
Blakeslee, A. M. H., McKenzie, C. H., Darling, J. A., Byers, J. E., Pringle, J. M., and Roman, J. (2010). A hitchhiker’s guide to the Maritimes: anthropogenic transport facilitates long-distance dispersal of an invasive marine crab to Newfoundland. Divers. Distrib. 16, 879–891. doi: 10.1111/j.1472-4642.2010.00703.x
Camacho, C., Coulouris, G., Avagyan, V., Ma, N., Papadopoulos, J., Bealer, K., et al. (2009). BLAST+: architecture and applications. BMC Bioinformatics 10:421. doi: 10.1186/1471-2105-10-421
Carlton, J. T., and Cohen, A. N. (2003). Episodic global dispersal in shallow water marine organisms: the case history of the European shore crabs Carcinus maenas and Carcinus aestuarii. J. Biogeogr. 30, 1809–1820. doi: 10.1111/j.1365-2699.2003.00962.x
Carroll, S. P., Hendry, A. P., Reznick, D. N., and Fox, C. W. (2007). Evolution on ecological time-scales. Funct. Ecol. 21, 387–393. doi: 10.1111/j.1365-2435.2007.01289.x
Chen, Y., Shenkar, N., Ni, P., Lin, Y., Li, S., and Zhan, A. (2018). Rapid microevolution during recent range expansion to harsh environments. BMC Evol. Biol. 18:187. doi: 10.1186/s12862-018-1311-1
Compton, T. J., Leathwick, J. R., and Inglis, G. J. (2010). Thermogeography predicts the potential global range of the invasive European green crab (Carcinus maenas). Divers. Distrib. 16, 243–255. doi: 10.1111/j.1472-4642.2010.00644.x
Conover, D. O., and Munch, S. B. (2002). Sustaining fisheries yields over evolutionary time scales. Science 297, 94–96. doi: 10.1126/science.1074085
Coyle, A. F., Voss, E. R., Tepolt, C. K., and Carlon, D. B. (2019). Mitochondrial genotype influences the response to cold stress in the European green crab, Carcinus maenas. J. Exp. Biol. 222:jeb203521. doi: 10.1242/jeb.203521
Danecek, P., Auton, A., Abecasis, G., Albers, C. A., Banks, E., DePristo, M. A., et al. (2011). The variant call format and VCFtools. Bioinformatics 27, 2156–2158. doi: 10.1093/bioinformatics/btr330
Darling, J. A., Bagley, M. J., Roman, J., Tepolt, C. K., and Geller, J. B. (2008). Genetic patterns across multiple introductions of the globally invasive crab genus Carcinus. Mol. Ecol. 17, 4992–5007. doi: 10.1111/j.1365-294X.2008.03978.x
De Wit, P., Pespeni, M. H., Ladner, J. T., Barshis, D. J., Seneca, F., Jaris, H., et al. (2012). The simple fool’s guide to population genomics via RNA-Seq: an introduction to high-throughput sequencing data analysis. Mol. Ecol. Resour. 12, 1058–1067. doi: 10.1111/1755-0998.12003
DePristo, M. A., Banks, E., Poplin, R., Garimella, K. V., Maguire, J. R., Hartl, C., et al. (2011). A framework for variation discovery and genotyping using next-generation DNA sequencing data. Nat. Genet. 43, 491–498.
Faria, R., Johannesson, K., Butlin, R. K., and Westram, A. M. (2019). Evolving inversions. Trends Ecol. Evol. 34, 239–248. doi: 10.1016/j.tree.2018.12.005
Gautier, M. (2015). Genome-wide scan for adaptive divergence and association with population-specific covariates. Genetics 201, 1555–1579. doi: 10.1534/genetics.115.181453
Hoey, J. A., and Pinsky, M. L. (2018). Genomic signatures of environmental selection despite near-panmixia in summer flounder. Evol. Appl. 11, 1732–1747. doi: 10.1111/eva.12676
Hoffmann, A. A., and Rieseberg, L. H. (2008). Revisiting the impact of inversions in evolution: from population genetic markers to drivers of adaptive shifts and speciation? Annu. Rev. Ecol. Evol. Sci. 39, 21–42. doi: 10.1146/annurev.ecolsys.39.110707.173532
Hoffmann, A. A., and Sgrò, C. M. (2011). Climate change and evolutionary adaptation. Nature 470, 479–485.
Hooper, S. L., Hobbs, K. H., and Thuma, J. B. (2008). Invertebrate muscles: thin and thick filament structure; molecular basis of contraction and its regulation, catch and asynchronous muscle. Prog. Neurobiol. 86, 72–127. doi: 10.1016/j.pneurobio.2008.06.004
Jeffery, N. W., DiBacco, C., Van Wyngaarden, M., Hamilton, L. C., Stanley, R. R. E., Bernier, R., et al. (2017). RAD sequencing reveals genomewide divergence between independent invasions of the European green crab (Carcinus maenas) in the Northwest Atlantic. Ecol. Evol. 7, 2513–2524. doi: 10.1002/ece3.2872
Kapun, M., Fabian, D. K., Goudet, J., and Flatt, T. (2016). Genomic evidence for adaptive inversion clines in Drosophila melanogaster. Mol. Biol. Evol. 33, 1317–1336. doi: 10.1093/molbev/msw016
Kelly, M. W., Sanford, E., and Grosberg, R. K. (2012). Limited potential for adaptation to climate change in a broadly distributed marine crustacean. Proc. R. Soc. B 279, 349–356. doi: 10.1098/rspb.2011.0542
Kemppainen, P., Knight, C. G., Sarma, D. K., Hlaing, T., Prakash, A., Maung, Y. N. M., et al. (2015). Linkage disequilibrium network analysis (LDna) gives a global view of chromosomal inversions, local adaptation and geographic structure. Mol. Ecol. Resour. 15, 1031–1045. doi: 10.1111/1755-0998.12369
Kirubakaran, T. G., Grove, H., Kent, M. P., Sandve, S. S., Baranski, M., Nome, T., et al. (2016). Two adjacent inversions maintain genomic differentiation between migratory and stationary ecotypes of Atlantic cod. Mol. Ecol. 25, 2130–2143. doi: 10.1111/mec.13592
Klaiman, J. M., Fenna, A. J., Shiels, H. A., Macri, J., and Gillis, T. E. (2011). Cardiac remodeling in fish: strategies to maintain heart function during temperature change. PLoS One 6:e24464. doi: 10.1371/journal.pone.0024464
Koehn, R. K., Newell, R. I. E., and Immermann, F. (1980). Maintenance of an aminopeptidase allele frequency cline by natural selection. Proc. Natl. Acad. Sci. U.S.A. 77, 5385–5389. doi: 10.1073/pnas.77.9.5385
Lal, M. M., Southgate, P. C., Jerry, D. R., Bosserelle, C., and Zenger, K. R. (2017). Swept away: ocean currents and seascape features influence genetic structure across the 18,000 km Indo-Pacific distribution of a marine invertebrate, the black-lip pearl oyster Pinctada margaritifera. BMC Genomics 18:66. doi: 10.1186/s12864-016-3410-y
Lamichhaney, S., and Andersson, L. (2019). A comparison of the association between large haplotype blocks under selection and the presence/absence of inversions. Ecol. Evol. 9, 4888–4896. doi: 10.1002/ece3.5094
Li, H., and Durbin, R. (2009). Fast and accurate short read alignment with Burrows-Wheeler transform. Bioinformatics 25, 1754–1760. doi: 10.1093/bioinformatics/btp324
Maron, J. L., Vilà, M., Bommarco, R., Elmendorf, S., and Beardsley, P. (2004). Rapid evolution of an invasive plant. Ecol. Monogr. 74, 261–280. doi: 10.1890/03-4027
Marques, D. A., Jones, F. C., Di Palma, F., Kingsley, D. M., and Reimchen, T. E. (2018). Experimental evidence for rapid genomic adaptation to a new niche in an adaptive radiation. Nat. Ecol. Evol. 2, 1128–1138. doi: 10.1038/s41559-018-0581-8
McKenna, A., Hanna, M., Banks, E., Sivachenko, A., Cibulskis, K., Kernytsky, A., et al. (2010). The Genome Analysis Toolkit: a MapReduce framework for analyzing next-generation DNA sequencing data. Genome Res. 20, 1297–1303. doi: 10.1101/gr.107524.110
McKinney, G., McPhee, M. V., Pascal, C., Seeb, J. E., and Seeb, L. W. (2020). Network analysis of linkage disequilibrium reveals genome architecture in Chum salmon. G3. 10, 1553–1561. doi: 10.1534/g3.119.400972
Min, X. J., Butler, G., Storms, R., and Tsang, A. (2005). OrfPredictor: predicting protein-coding regions in EST-derived sequences. Nucl. Acids Res. 33, W677–W680. doi: 10.1093/nar/gki394
Morales, H. E., Faria, R., Johannesson, K., Larsson, T., Panova, M., Westram, A. M., et al. (2019). Genomic architecture of parallel ecological divergence: beyond a single environmental contrast. Sci. Adv. 5:eaav9963. doi: 10.1126/sciadv.aav9963
Morin, P., McMullen, D. C., and Storey, K. B. (2005). HIF-1α involvement in low temperature and anoxia survival by a freeze tolerant insect. Mol. Cell. Biochem. 280, 99–106. doi: 10.1007/s11010-005-8236-x
Nunez, J. C. B., Flight, P. A., Neil, K. B., Rong, S., Eriksson, L. A., Ferranti, D. A., et al. (2020). Footprints of natural selection at the mannose-6-phosphate isomerase locus in barnacles. Proc. Natl. Acad. Sci. U.S.A. 117, 5376–5385. doi: 10.1073/pnas.1918232117
Palumbi, S. R. (2004). Marine reserves and ocean neighborhoods: the spatial scale of marine populations and their management. Annu. Rev. Env. Resour. 29, 31–68. doi: 10.1146/annurev.energy.29.062403.102254
Palumbi, S. R., and Pinsky, M. (2013). “Marine dispersal, ecology and conservation,” in Marine Community Ecology and Conservation, eds M. Bertness, J. Bruno, B. Silliman, and J. Stachowicz (Sunderland, MA: Sinauer), 57–84.
Patterson, N., Price, A. L., and Reich, D. (2006). Population structure and eigenanalysis. PLoS Genet. 2:e190. doi: 10.1371/journal.pgen.0020190
Pespeni, M. H., and Palumbi, S. R. (2013). Signals of selection in outlier loci in a widely dispersing species across an environmental mosaic. Mol. Ecol. 22, 3580–3597. doi: 10.1111/mec.12337
Phillips, B. L., Brown, G. P., Webb, J. K., and Shine, R. (2006). Invasion and the evolution of speed in toads. Nature 439:803. doi: 10.1038/439803a
Pörtner, H. O. (2002). Climate variations and the physiological basis of temperature dependent biogeography: systemic to molecular hierarchy of thermal tolerance in animals. Comp. Biochem. Phys. A 132, 739–761. doi: 10.1016/S1095-6433(02)00045-4
Price, A. L., Patterson, N. J., Plenge, R. M., Weinblatt, M. E., Shadick, N. A., and Reich, D. (2006). Principal components analysis corrects for stratification in genome-wide association studies. Nat. Genet. 38, 904–909. doi: 10.1038/ng1847
Pringle, J. M., Blakeslee, A. M. H., Byers, J. E., and Roman, J. (2011). Asymmetric dispersal allows an upstream region to control population structure throughout a species’ range. Proc. Natl. Acad. Sci. U.S.A. 108, 15288–15293. doi: 10.1073/pnas.1100473108
Quinn, K. E., Castellani, L., Ondrias, K., and Ehrlich, B. E. (1998). Characterization of the ryanodine receptor/channel of invertebrate muscle. Am. J. Physiol. Reg. I 274, R494–R502.
Reynolds, R. W., Rayner, N. A., Smith, T. M., Stokes, D. C., and Wang, W. (2007). Daily high-resolution-blended analyses for sea surface temperature. J. Climate. 15, 5473–5496. doi: 10.1175/2007jcli1824.1
Roman, J. (2006). Diluting the founder effect: cryptic invasions expand a marine invader’s range. Proc. R. Soc. B 273, 2453–2459. doi: 10.1098/rspb.2006.3597
Roman, J., and Palumbi, S. R. (2004). A global invader at home: population structure of the green crab, Carcinus maenas, in Europe. Mol. Ecol. 13, 2891–2898. doi: 10.1111/j.1365-294X.2004.02255.x
Rousset, F. (2008). genepop’007: a complete re-implementation of the genepop software for Windows and Linux. Mol. Ecol. Resour. 8, 103–106. doi: 10.1111/j.1471-8286.2007.01931.x
Sanford, E., and Kelly, M. W. (2011). Local adaptation in marine invertebrates. Annu. Rev. Mar. Sci. 3, 509–535. doi: 10.1146/annurev-marine-120709-142756
Slatkin, M. (2008). Linkage disequilibrium–understanding the evolutionary past and mapping the medical future. Nat. Rev. Genet. 9, 477–485. doi: 10.1038/nrg2361
Sultan, S. E., Horgan-Kobelski, T., Nichols, L. M., Riggs, C. E., and Waples, R. K. (2013). A resurrection study reveals rapid adaptive evolution within populations of an invasive plant. Evol. Appl. 6, 266–278. doi: 10.1111/j.1752-4571.2012.00287.x
Tepolt, C. K., Darling, J. A., Bagley, M. J., Geller, J. B., Blum, M. J., and Grosholz, E. D. (2009). European green crabs (Carcinus maenas) in the northeastern Pacific: genetic evidence for high population connectivity and current-mediated expansion from a single introduced source population. Divers. Distrib. 15, 997–1009. doi: 10.1111/j.1472-4642.2009.00605.x
Tepolt, C. K., and Palumbi, S. R. (2015). Transcriptome sequencing reveals both neutral and adaptive genome dynamics in a marine invader. Mol. Ecol. 24, 4145–4158. doi: 10.1111/mec.13294
Tepolt, C. K., and Somero, G. N. (2014). Master of all trades: thermal acclimation and adaptation of cardiac function in a broadly distributed marine invasive species, the European green crab, Carcinus maenas. J. Exp. Biol. 217, 1129–1138. doi: 10.1242/jeb.093849
Therkildsen, N. O., Wilder, A. P., Conover, D. O., Munch, S. B., Baumann, H., and Palumbi, S. R. (2019). Contrasing genomic shifts underlie parallel phenotypic evolution in response to fishing. Science 365, 487–490. doi: 10.1126/science.aaw7271
Thompson, M. J., and Jiggins, C. D. (2014). Supergenes and their role in evolution. Heredity 113, 1–8. doi: 10.1038/hdy.2014.20
Tigano, A., and Friesen, V. L. (2016). Genomics of local adaptation with gene flow. Mol. Ecol. 25, 2144–2164. doi: 10.1111/mec.13606
Tigano, A., Reiertsen, T. K., Walters, J. R., and Friesen, V. L. (2018). A complex copy number variant underlies differences in both colour plumage and cold adaptation in a dimorphic seabird. BioRxiv[Preprint]. doi: 10.1101/507384
Trevoy, S. A. L., Janes, J. K., Muirhead, K., and Sperling, F. A. H. (2019). Repurposing population genetics data to discern genomic architecture: a case study of linkage cohort detection in mountain pine beetle (Dendroctonus ponderosae). Ecol. Evol. 9, 1147–1159. doi: 10.1002/ece3.4803
Twyford, A. D., and Friedman, J. (2015). Adaptive divergence in the monkey flower Mimulus guttatus is maintained by a chromosomal inversion. Evolution 69, 1476–1486. doi: 10.5061/dryad.5h032
Wintersinger, J. A., and Wasmuth, J. D. (2015). Kablammo: an interactive, web-based BLAST results visualizer. Bioinformatics 31, 1305–1306. doi: 10.1093/bioinformatics/btu808
Keywords: rapid adaptation, supergene, thermal adaptation, gene flow, invasive species, balanced polymorphism, chromosomal inversion
Citation: Tepolt CK and Palumbi SR (2020) Rapid Adaptation to Temperature via a Potential Genomic Island of Divergence in the Invasive Green Crab, Carcinus maenas. Front. Ecol. Evol. 8:580701. doi: 10.3389/fevo.2020.580701
Received: 06 July 2020; Accepted: 04 November 2020;
Published: 26 November 2020.
Edited by:
Angela McGaughran, The University of Waikato, New ZealandReviewed by:
Ashley Sendell-Price, University of Oxford, United KingdomNick Jeffery, Bedford Institute of Oceanography (BIO), Canada
Sarah Lehnert, Fisheries and Oceans Canada, Canada
Copyright © 2020 Tepolt and Palumbi. This is an open-access article distributed under the terms of the Creative Commons Attribution License (CC BY). The use, distribution or reproduction in other forums is permitted, provided the original author(s) and the copyright owner(s) are credited and that the original publication in this journal is cited, in accordance with accepted academic practice. No use, distribution or reproduction is permitted which does not comply with these terms.
*Correspondence: Carolyn K. Tepolt, Y3RlcG9sdEB3aG9pLmVkdQ==