 Yincheng Zhao1,2†
 Shanyuan Chen
- 1School of Ecology and Environmental Science, Yunnan University, Kunming, China
- 2School of Life Sciences, Yunnan University, Kunming, China
Cavefish evolved a series of distinct survival mechanisms for adaptation to cave habitat. Such mechanisms include loss of eyesight and pigmentation, sensitive sensory organs, unique dietary preferences, and predation behavior. Thus, it is of great interest to understand the mechanisms underlying these adaptability traits of troglobites. The teleost genus Sinocyclocheilus (Cypriniformes: Cyprinidae) is endemic to China and has more than 70 species reported (including over 30 cavefish species). High species diversity and diverse phenotypes make the Sinocyclocheilus as an outstanding model for studying speciation and adaptive evolution. In this study, we conducted a comparative transcriptomics study on the brain tissues of two Sinocyclocheilus species (surface-dwelling species – Sinocyclocheilus malacopterus and semi-cave-dwelling species – Sinocyclocheilus rhinocerous living in the same water body. A total of 425,188,768 clean reads were generated, which contributed to 102,839 Unigenes. Bioinformatic analysis revealed a total of 3,289 differentially expressed genes (DEGs) between two species Comparing to S. malacopterus, 2,598 and 691 DEGs were found to be respectively, down-regulated and up-regulated in S. rhinocerous. Furthermore, it is also found tens of DEGs related to cave adaptability such as insulin secretion regulation (MafA, MafB, MafK, BRSK, and CDK16) and troglomorphic traits formation (CEP290, nmnat1, coasy, and pqbp1) in the cave-dwelling S. rhinocerous. Interestingly, most of the DEGs were found to be down-regulated in cavefish species and this trend of DEGs expression was confirmed through qPCR experiments. This study would provide an appropriate genetic basis for future studies on the formation of troglomorphic traits and adaptability characters of troglobites, and improve our understanding of mechanisms of cave adaptation.
Introduction
Caves are classified among the special habitat category, and are characterized by extremely scarce of food resources, high concentrations of carbon dioxide, and perpetual darkness. Troglobites exhibit a set of phenotypes and behavioral traits that have arisen from long-term adaptation to these harsh habitat factors (Aspiras et al., 2015). Studies of these traits will contribute not only to improved understanding of the mechanisms involved in their adaptation, but also help to reveal processes underlying speciation, acquisition of novel functions, and the impact of evolution on genetic material.
“Cavefish” mainly refers to fish species that live in subterranean cave water bodies, underground rivers, underground lakes or other similar ecosystems (Borowsky, 2018). Cavefish have developed a series of unique physical and behavioral features in their adaptation to cave habitats, including reduction of eyesight and pigmentation, sensitive sensory organs, unique dietary preferences, and predation behavior (Jeffery, 2009). In recent years, many research related to morphology, molecular biology and ecology has been conducted on various cavefish species such as Astyanax mexicanus (Varatharasan et al., 2009; Hyacinthe et al., 2019) and Phreatichthys andruzzii (Ceinos et al., 2018). However, due to difficulties in adequately sampling wild cavefish species, clear understanding of regulatory mechanisms underlying their adaptive traits requires further investigation (Zagmajster et al., 2010).
As the control center in vertebrates, the brain plays a significant role in regulating body temperature, biorhythm, muscle activity, and the sensory systems. A subset of metazoan genes underlie the biophysical properties and information processing of the brain (Guo, 2003; Drew et al., 2012). The goal of studies of the functions and regulatory mechanisms of these brain genes to understand cell- and circuit-specific effects is ultimately to establish the connections between brain function and adaptive behavior (Croset et al., 2018). For example, Somerville et al. found that the territorial behavior of the round goby (Neogobius melanostomus) is linked to methylation of DNA in the hypothalamus, and the process of DNA methylation synchronized with the appearance of territorial behavior (Somerville et al., 2019). Similarly, by comparing the hypothalamus transcriptomes of domesticated and aggressive undomesticated silver foxes (Vulpes vulpes), Rosenfeld et al. (2019) identified many differentially expressed genes (DEGs) (DKKL1 [dickkopf like acrosomal protein 1], FBLN7 [fibulin 7], NPL [N-acetylneuraminate pyruvate lyase], PRIMPOL [primase and DNA directed polymerase], PTGFRN [prostaglandin F2 receptor inhibitor], SHCBP1L [SHC binding and spindle associated 1 like], and SKIV2L [Ski2 like RNA helicase]) which play roles in signaling, development, differentiation, and immunity. These DEGs may be partly responsible for the loss of aggressive behavior after domestication of silver foxes (Rosenfeld et al., 2019).
The teleost genus Sinocyclocheilus (Cypriniformes: Cyprinidae) is a treasured group of wild fish species, endemic to the karst terrain of the east and northwest Yunnan and Guizhou plateau, Guangxi, southwestern China, and encompassing more than 70 known species as of 2019. This genus is the largest known group of cavefishes worldwide, with new species continuing to be reported (Lunghi et al., 2019). Interestingly, the genus Sinocyclocheilus represents an example of two morphotypes (cavefish/surface fish) that have obvious phenotypic and habitat differences existing within one genus. High species diversity with diverse phenotypes makes Sinocyclocheilus as an outstanding model for studying speciation and adaptive evolution, that has attracted much attention in various fields. For example, Yang et al., 2016 conducted comparative genomic and transcriptomic studies on three representative Sinocyclocheilus fish species (surface-dwelling Sinocyclocheilus grahami; semi-cave-dwelling Sinocyclocheilus rhinocerous; and cave-restricted Sinocyclocheilus anshuiensis) and found many genetic changes associated with regressive features, such as gene loss, pseudogenes, mutations, and differential gene expression. The genetic changes identified in this study provide novel insights into cave dwelling adaptations of Sinocyclocheilus fish (Yang et al., 2016). Research into the adaptability of Sinocyclocheilus fishes has largely focused on the most distinct troglomorphic traits (eye degeneration or skin albinism) (Meng et al., 2013), while other organs/tissues such as the brain, muscle, and liver remain insufficiently studied.
In this study, we conducted comparative transcriptomic analysis to examine the transcript profiles from the brains of two sympatric Sinocyclocheilus fish species: surface-dwelling Sinocyclocheilus malacopterus (with complete eye structure) and semi-cave-dwelling S. rhinocerous (with reduced eyesight and pigmentation). The main purposes of this study were to: (i) obtain the high-quality brain transcriptome profiles of cave and surface dwelling Sinocyclocheilus species using Illumina sequencing technology, (ii) identify DEGs by comparing brain transcriptome profiles of cave and surface dwelling species, and (iii) to identify and confirm key candidate genes which related to cave adaptability and development that differ between these two different ecotype fish species through qPCR experiments, and pathway and function annotation of DEGs.
The results of this research are expected to provide valuable information to guide further studies of biocompatibility and improve our understanding of the molecular regulatory mechanisms underlying troglomorphic traits in cavefishes.
Materials and Methods
Sample Collection
The two fish species S. malacopterus and S. rhinocerous used in this study were captured in Yunnan Province, China, with five and three biological replicates, respectively (Figure 1). The Characteristics of the sampling location are shown in the Table 1. To avoid RNA degradation, because cavefish die soon after being captured from the cave water body, sterile laboratory appliances were prepared in advance, and all tissue samples were harvested immediately after the fish were collected from the water. Because of the small size of the fish, after general anesthesia with 30 mg/L of MS-222 anesthetic (3-Aminobenzoic acid ethyl ester methanesulfonate) (Sigma-Aldrich, St. Louis, MO, United States), all brain tissues were surgically excised, consolidated into sterile tubes containing RNAlater, and placed in liquid nitrogen. After sacrificing the fish, other tissues (muscles) and organs (heart, liver, skin, etc.) were also collected for other studies. Every effort was made to minimize animal suffering. Samples were stored at −80°C upon return to the laboratory. All experiments were conducted with approval from the local Ethical committee at Yunnan University in accordance with China’s local and global ethical polices (Grant No: ynucae 20190056), and all procedures were approved and permits granted by the local government.
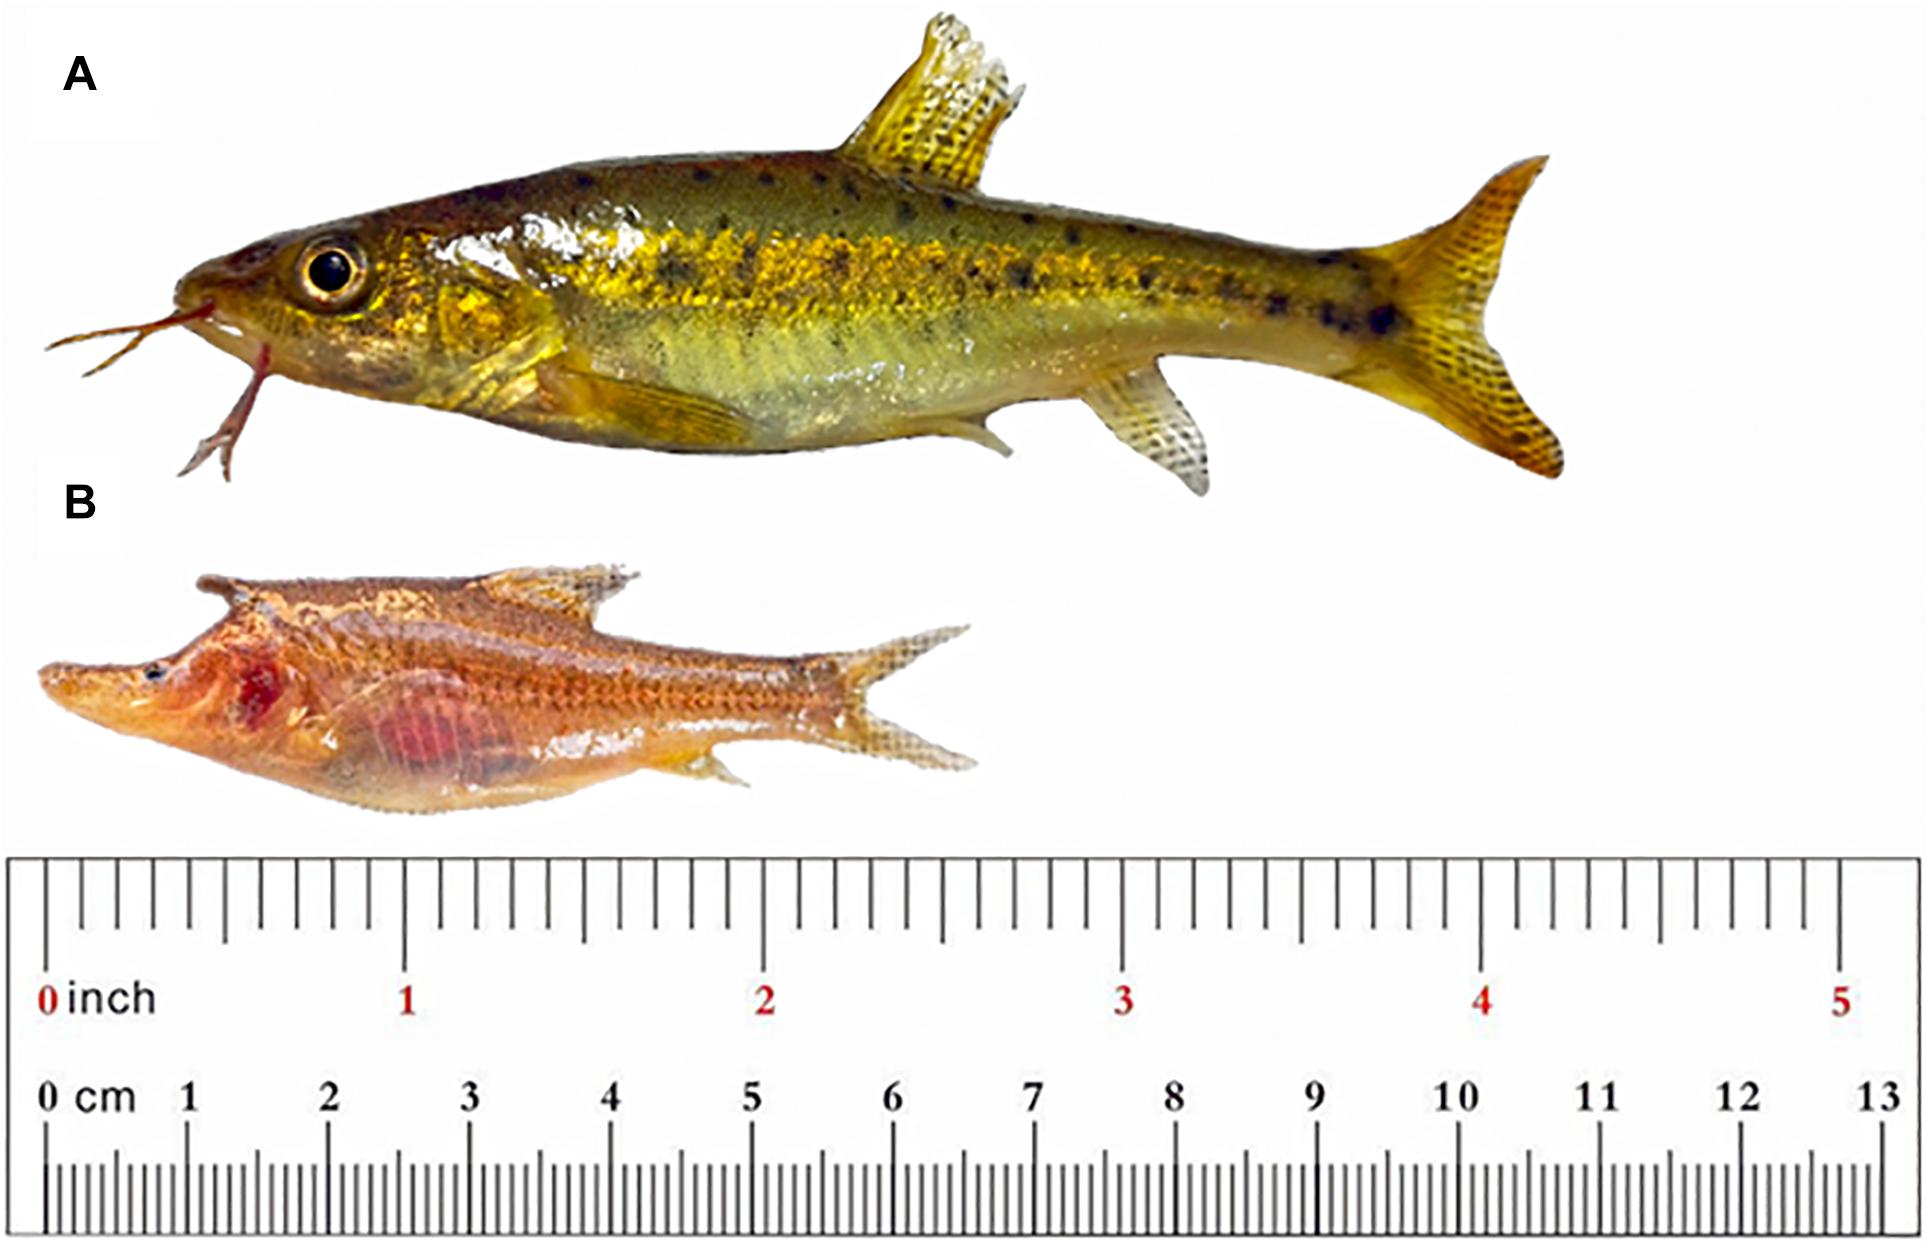
Figure 1. Photographs of Sinocyclocheilus surface and cavefish. (A) S. malacopterus; (B) S. rhinocerous. The body length and proportion of these two fish are consistent with the truly scale.
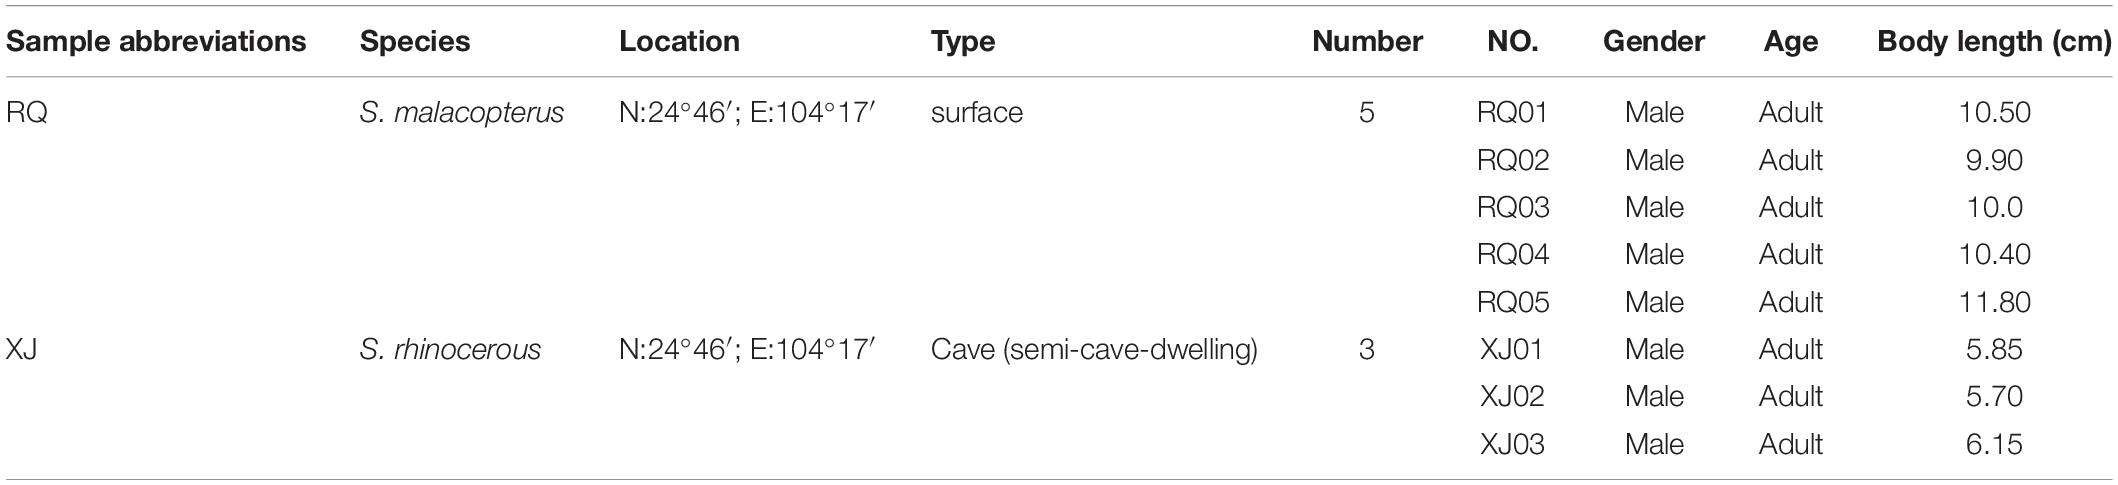
Table 1. Sampling details of each Sinocyclocheilus species.
RNA Extraction, Library Preparation, and Illumina Sequencing
Total RNA was extracted from the brain tissues of each Sinocyclocheilus fish using TRIzol® Reagent (Invitrogen, Carlsbad, CA, United States). A 2100 Bioanalyzer (Agilent Technologies, Inc., Santa Clara, CA, United States) was used to determine RNA purity and integrity, and the RNA samples were quantified using the ND-2000 (NanoDrop Thermo Scientific, Wilmington, DE, United States).
High-quality RNA was used to construct the sequencing library. RNA purification, reverse transcription, and library construction were performed according to the manufacturer’s instructions (Illumina, San Diego, CA, United States). Brain RNA-seq transcriptome libraries were prepared using an Illumina TruSeqTM RNA sample preparation Kit (San Diego, CA, United States). Poly(A) mRNA was purified from total RNA using oligo-dT-attached magnetic beads, then fragmented in fragmentation buffer. Using these short fragments as templates, double-stranded cDNA was synthesized using a SuperScript double-stranded cDNA synthesis kit (Invitrogen, Carlsbad, CA, United States) with random hexamer primers (Illumina). Synthesized cDNAs were subjected to end-repair, phosphorylation, and “A” base addition according to Illumina’s library construction protocol. The libraries were limited to 200–300 bp fragments by gel purification from 2% Low Range Ultra Agarose, followed by PCR amplification using Phusion DNA polymerase (New England Biolabs, Boston, MA, United States) for 15 cycles. After quantification using a TBS380, two RNAseq libraries were sequenced in a single lane on an Illumina HiSeq X ten sequencer (Illumina, San Diego, CA, United States) for 2 × 150 bp paired-end reads. In this study, DNA sequenced using an Illumina HiSeq platform, with assistance from Majorbio Bio-Pharm Technology Co., Ltd. (Shanghai, China).
De novo Assembly and Sequence Annotation
Clean data from the brain samples were used for de novo assembly using Trinity1, after quality control using SeqPrep2 and Sickle3 software packages to remove low-quality reads, reads of less than 20 bp in length, and reads containing more than 10% ambiguous bases “N.” BLASTX was used to identify those proteins in the NCBI protein non-redundant (NR), and KEGG databases with the highest sequence similarity to each of the assembled transcripts, to gain insight into their function. BLAST2GO4 (Conesa et al., 2005) was used to obtain GO annotations describing biological processes, molecular functions, and subcellular locations of unique assembled transcripts. Metabolic pathway analysis was performed using the Kyoto Encyclopedia of Genes and Genomes (KEGG)5 (Minoru and Susumu, 2000), and functions were predicted using Unigenes by aligning Unigenes sequences to the COG database.
Differential Expression Analysis
To identify DEGs between the two different fish species, the expression level of each transcript was calculated in units of fragments per kilobase of exon per million mapped reads (FRKM) method. RSEM6 was used to quantify gene and isoform abundances (Dewey and Li, 2011). The R statistical package software EdgeR (Empirical analysis of Digital Gene Expression in R), was utilized for differential expression analysis. Genes with expression log2| Foldchange| ≥ 1 and false discovery rates (FDR) ≤ 0.05 were considered to be differentially expressed.
Functional Annotation of Differentially Expressed Genes
Functional-enrichment analyses, including GO and KEGG, were performed to identify which GO terms and metabolic pathways were significantly enriched among identified DEGs, using a Bonferroni-corrected P-value ≤ 0.05 (significantly enriched functional clusters). GO functional enrichment and KEGG pathway analysis were carried out using Goatools7 and KOBAS8, respectively.
Validation of DEGs by Real-Time PCR
In this study, due to quantitative limitations on wild fish brain mRNA samples, we could not validate all of the DEGs that we identified. Therefore, four DEGs were randomly selected from among all target DEGs for validation using real-time PCR analysis. Real-time PCR analysis used the same RNA samples used for transcriptome profiling. Two housekeeping genes (β-actin and GAPDH) were used as internal references. Primer sequences are listed in Table 2, and amplification conditions were as follows: initial denaturation at 95°C for 5 min, followed by 40 cycles of 95°C for 5 s, 50°C (nmnat1)/55°C (dab1, ophn1, and ubr1) for 30 s, and extension at 72°C for 40 s. Finally, 60–95°C was used to produce melting curves for analysis. All reactions were performed with three technical replicates using one biological sample. Relative gene expression was calculated using the 2 −ΔΔCT method using qPCRsoft3.2 software.

Table 2. Primers used for qRT-PCR.
Weighted Gene Co-expression Network Analysis (WGCNA)
Although the quantity of samples in this study did not meet the official recommended standards, in consideration of the rarity of cavefish species and small population sizes, we still launched WGCNA and tried to find additional important genes. We used the R package WGCNA for weighted correlation network analyses. Using gene expression data that assessed transcriptional levels in brain tissue from cave and surface fish, we constructed a co-expression network.
First, we constructed a gene-gene similarity network (Pearson’s correlation) for all Unigenes. In this analysis, we filtered Unigenes for those with relative expression levels <1 to calculate optimal power values. We then transformed these values to an adjacency matrix under soft power (beta = 6). Next, all Unigenes were hierarchically clustered and divided into modules. Gene modules corresponding to the branch cutoff of the gene tree were color-coded (networkType: signed; soft power: 6; minModuleSize: 30; minKMEtoStay: 0.3; mergeCutHeight: 0.25). The “gray” module contains Unigenes that cannot be associated with any expression patterns. In this study because we cannot measure physiological data from each wild cavefish species, we have instead produced a simple phenotypic traits table. To find the core genes (hub-genes) that are significantly associated with a phenotypic trait, we focused on the most highly correlated modules (R2 > | 0.4|, P < 0.005). The most correlated genes, in “blue” and “turquoise,” were selected for further analysis. Information on the functions and related pathways of hub genes were obtained from annotation in GO and KEGG databases.
Results
Sequencing and Assembly
In this study, a total of 425,188,768 clean reads, covering 63,744,868,368 bases were produced form the brain transcriptomes of the two Sinocyclocheilus species (eight specimens) using an Illumina HiSeq 2000 sequencing platform. Other parameter details of the sequencing data, such as bases number, and GC content, are presented in Table 3. A total of 102,839 Unigenes (unique transcript fragments), with an average length of 1151.19 bp and an N50 of 1734 bp was generated from 184,699 transcripts de novo assembled in Trinity. Information about sequence the length distribution and other details of transcripts and Unigenes is shown in Table 4.
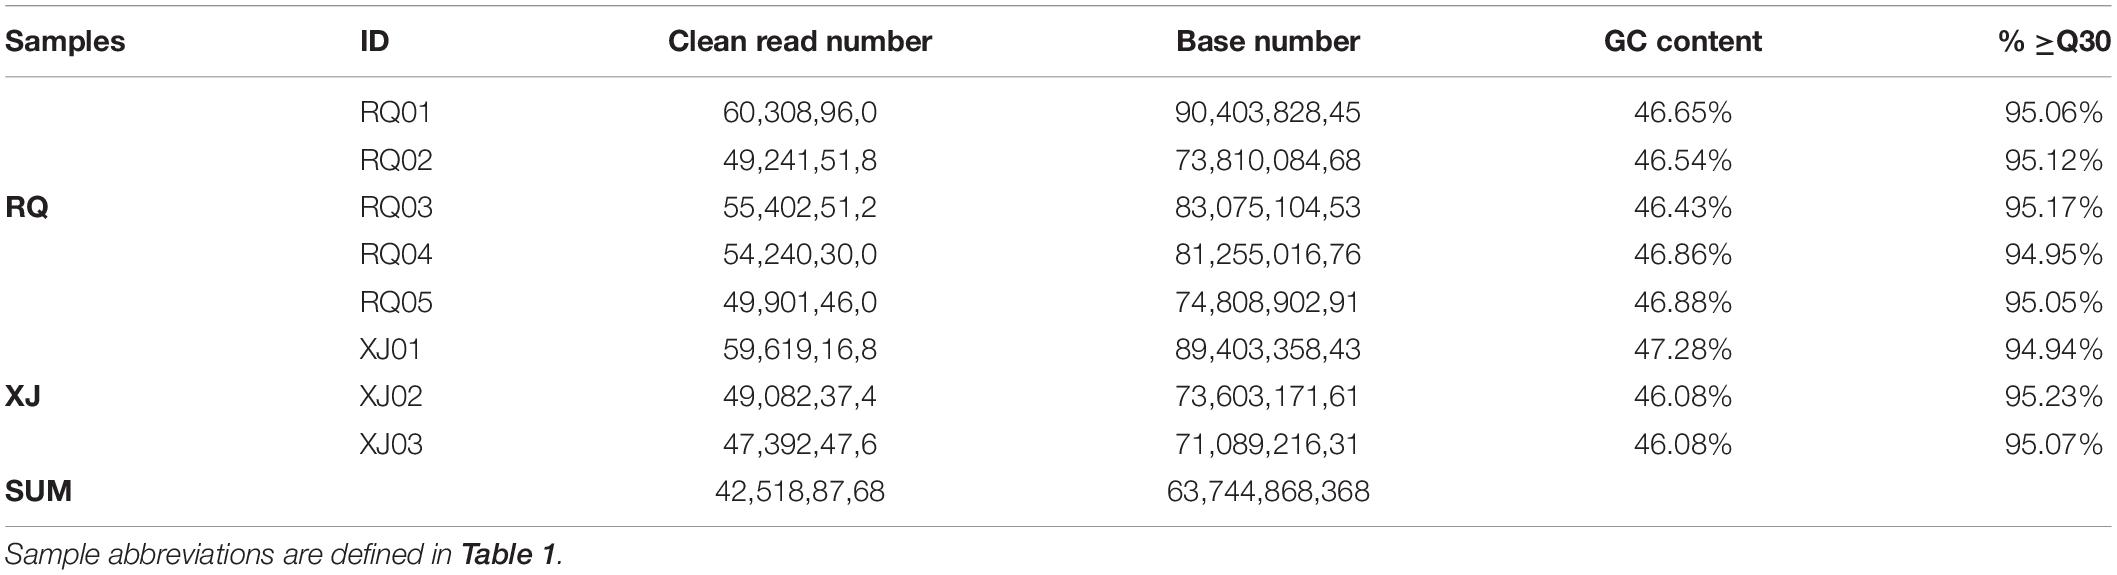
Table 3. Sequencing data for eight Sinocyclocheilus species.
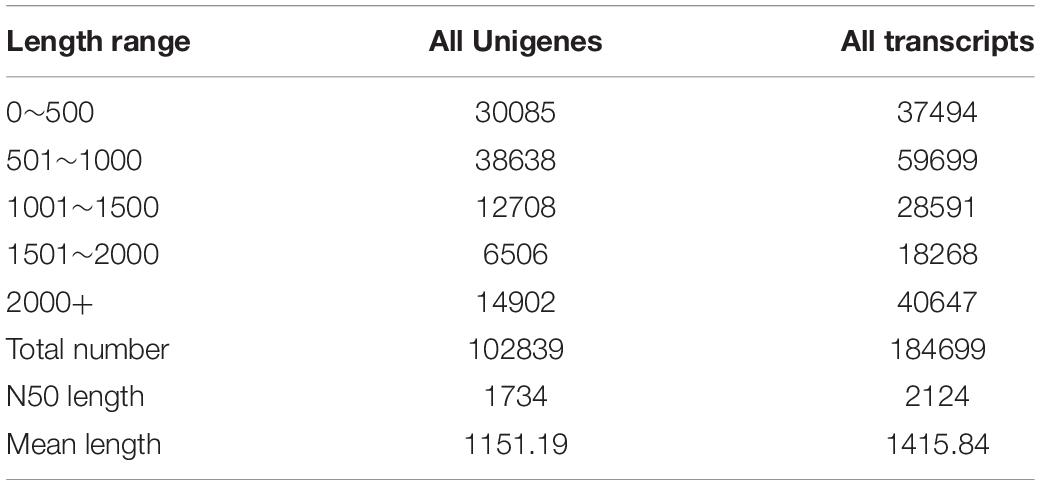
Table 4. Summary of Unigenes identified in brain samples of the two Sinocyclocheilus species.
Functional Annotation of Unigenes
Prediction of function, and Unigene categorization were achieved by searching in many databases (Table 5). Unigenes similarity analyses by BLASTX to against the NCBI non-redundant database (Nr) showed that the 45,601 Unigenes matched sequences from a range of species (Supplementary Material 1). S. malacopterus and S. rhinocerous Unigenes displayed the highest protein sequence homology (more than 25%) with S. grahami (13,054 Unigenes), followed by S. rhinocerous (10,234 Unigenes) and S. anshuiensis (6,720 Unigenes). In this study, nearly a 4.93% of Unigenes (2,249 Unigenes) identified homologs in unknown species, possibly due to limited Sinocyclocheilus sequence data in GenBank. Furthermore, considering the abundance of unique features in Sinocyclocheilus fish species, some lineage-specific genes may existed. To gain more insight into the function of the identified Unigenes, GO analysis of Unigenes was performed (Figure 2). According to GO terms, 122,719 Unigenes were assigned to GO level 2 terms using GO database annotation under three major functional categories: “biological process,” “cellular component,” and “molecular function.” The level 3 GO terms under each functional are shown in Figure 2B. Regulation of biological process (7,646 Unigenes) and organic substance metabolic process (6,517 Unigenes) were the main subcategories under “Biological process,” while intracellular part (10,672 Unigenes) and intrinsic component of membrane (8,826 Unigenes) were the main subcategories under “cellular component,” the subcategories with the largest number of Unigenes under “molecular function” are organic cyclic compound binding (9,015 Unigenes), and heterocyclic compound binding (8,917 Unigenes). 7,312 and 15,359 Unigenes were annotated into 24 and 25 categories of COG (Supplementary Material 2A) and KOG (Supplementary Material 2B) databases, respectively. To further predict their functions, the top five COGs were the clusters for (1) general function prediction only (1,407 Unigenes), (2) signal transduction mechanisms (991 Unigenes), (3) posttranslational modification, protein turnover, and chaperones (636 Unigenes), (4) replication, recombination, and repair (416 Unigenes), and (5) translation, ribosomal structure, and biogenesis (413 Unigenes). Only 7 and 4 Unigenes were assigned to cell motility and nuclear structure, respectively. No Unigenes were annotated for extracellular structures. The KEGG pathway database was used to identify the biological pathways in which the Unigenes function. A total of 23,615 Unigenes were annotated as in 364 known KEGG pathways, The top five pathways (containing the highest number of Unigenes) were pathways in signal transduction (4,478 Unigenes), cancer (2,430 Unigenes), the endocrine system (2,205 Unigenes) and followed by infectious diseases (2,037 Unigenes) and the immune system (2,025 Unigenes) (Supplementary Material 3 and Figure 3).
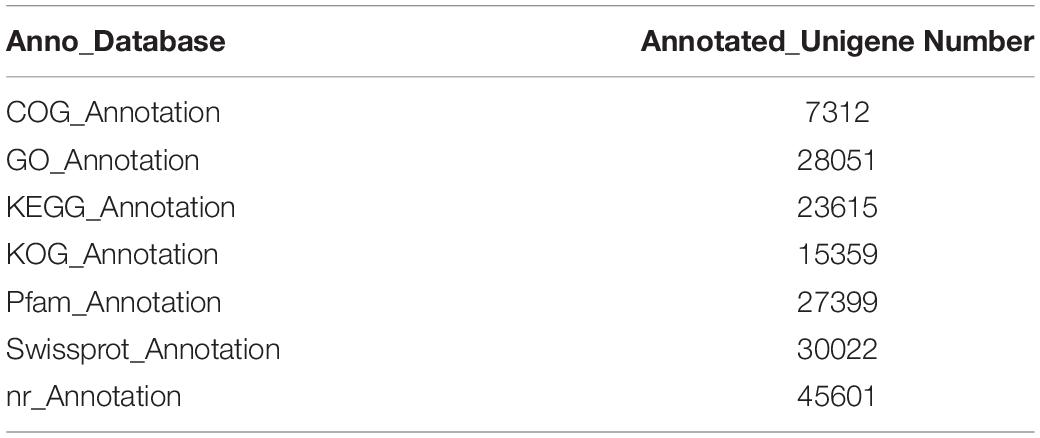
Table 5. Gene annotation in different databases.
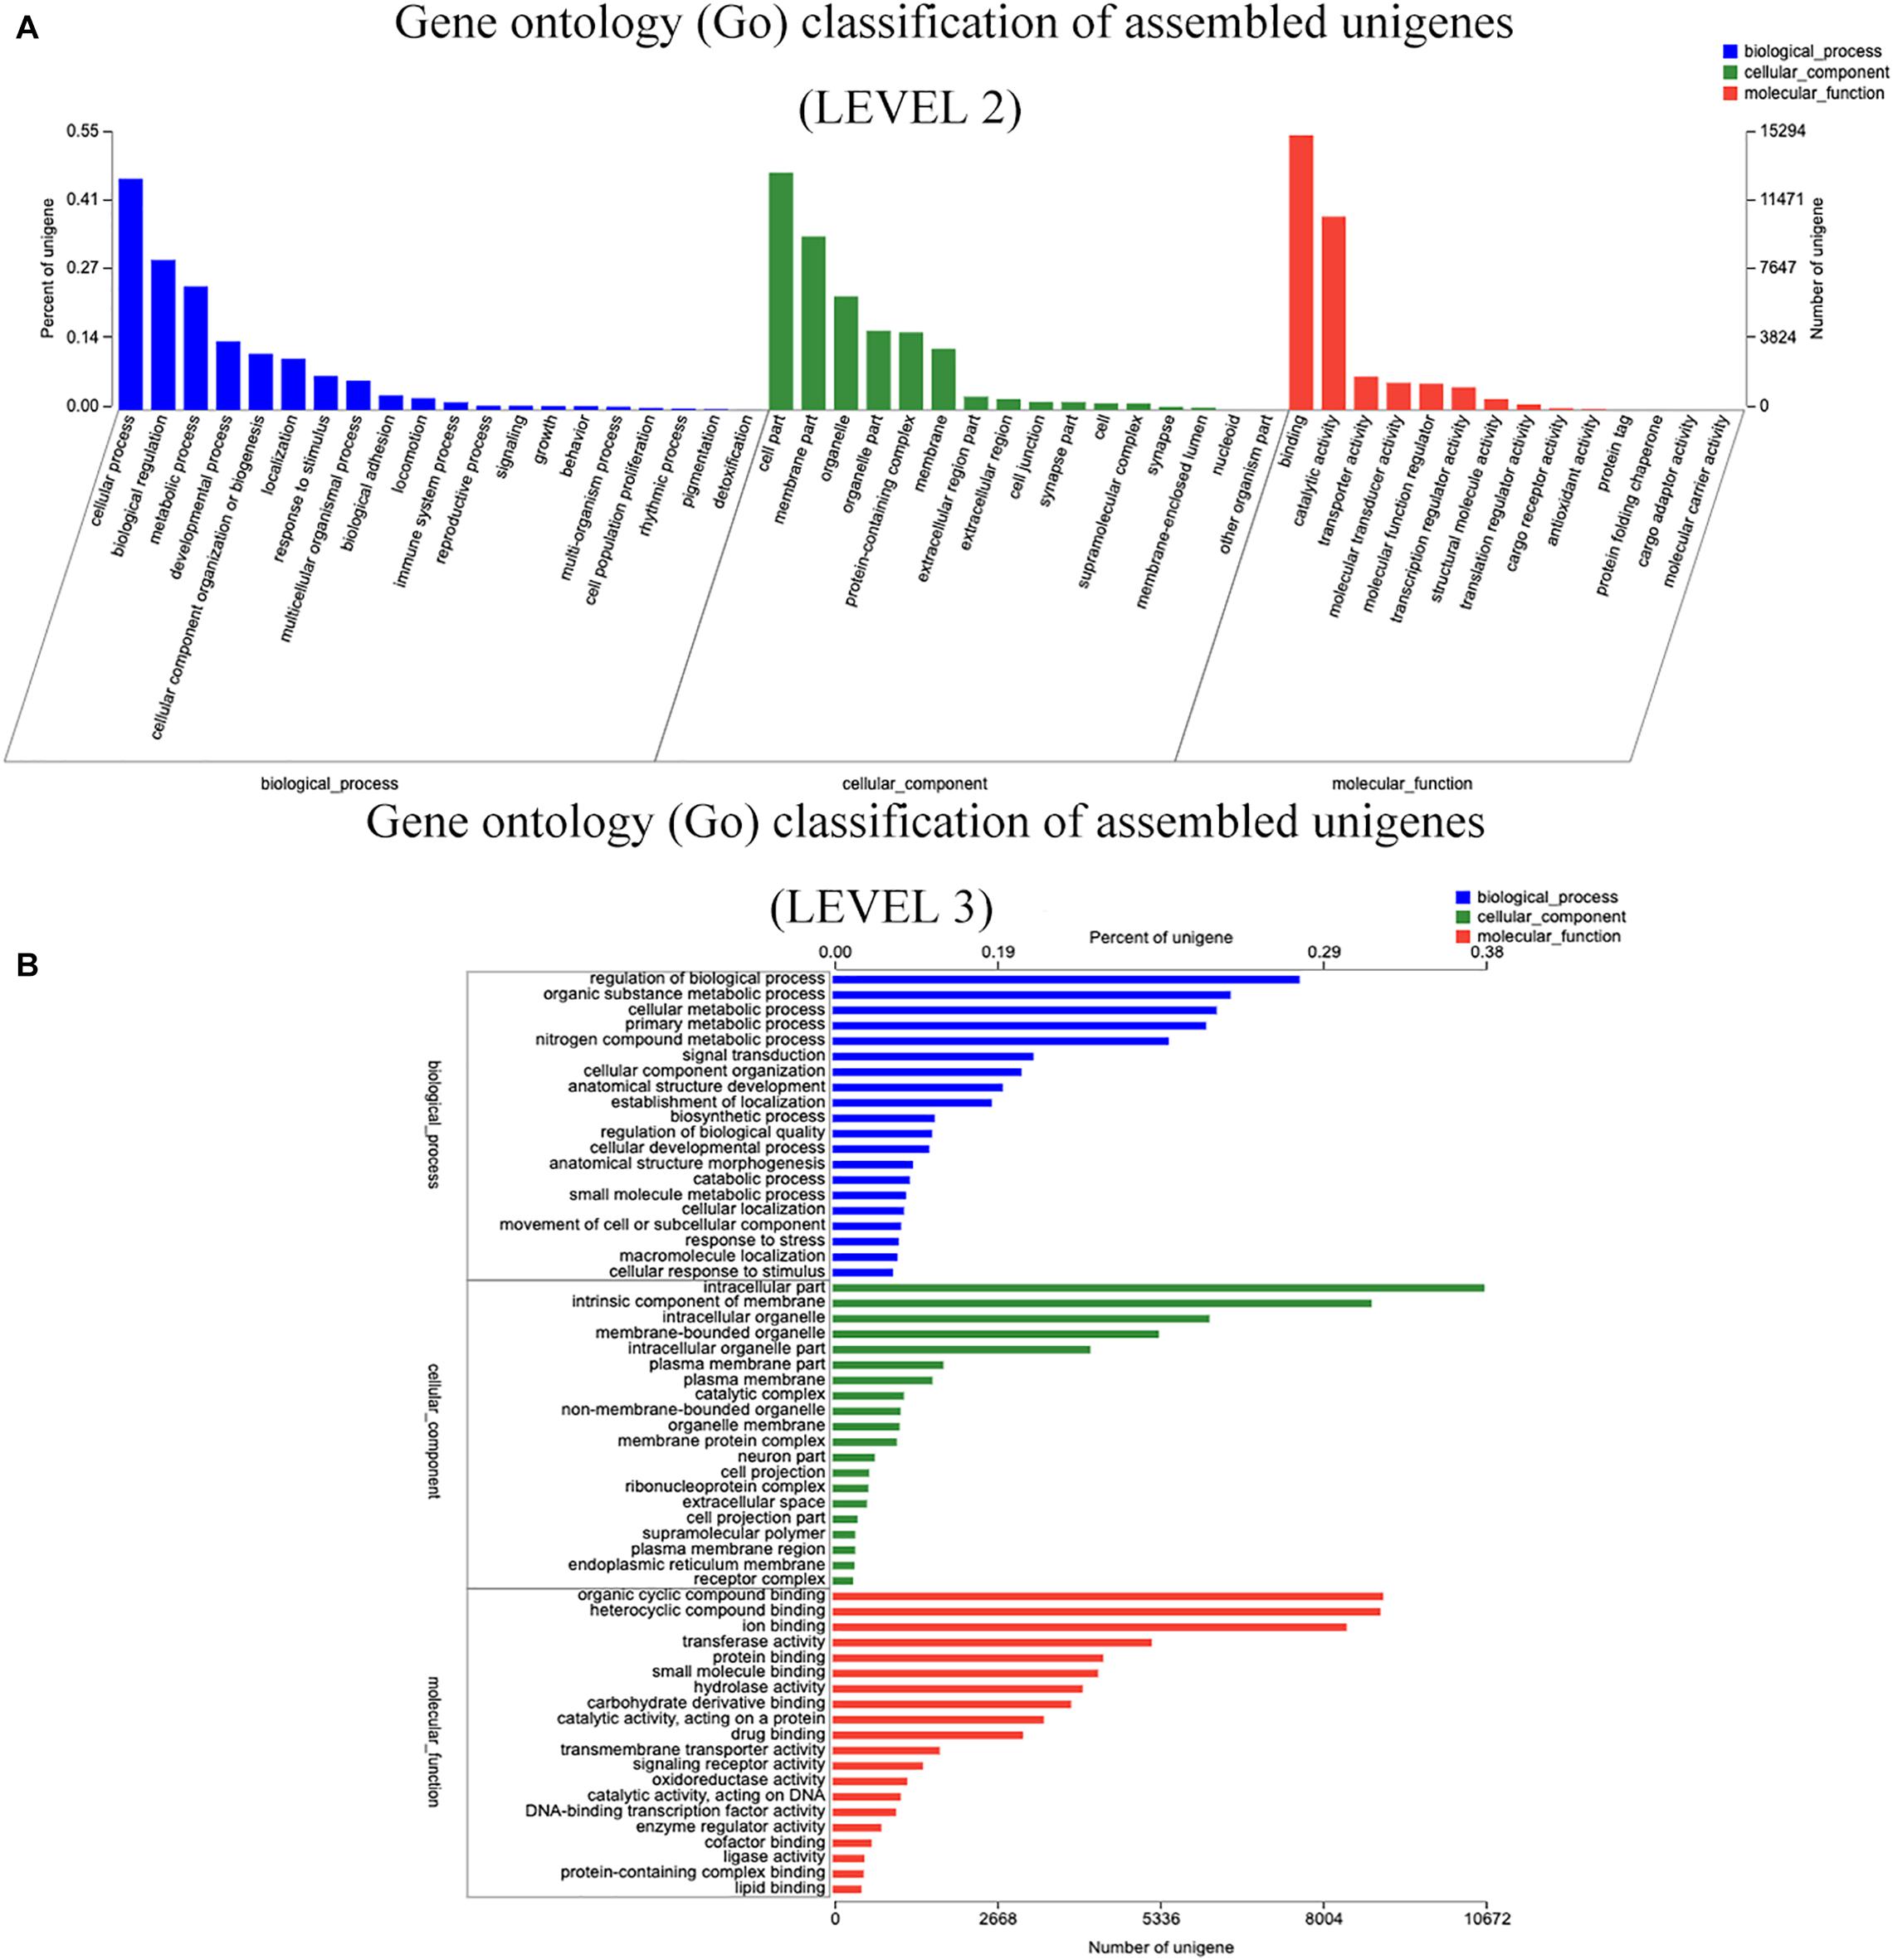
Figure 2. Gene ontology (GO) classification of assembled Unigenes. (A) The database annotation of GO at level 2 classification of Unigenes. (B) The database annotation of GO at level 3 classification of Unigenes.
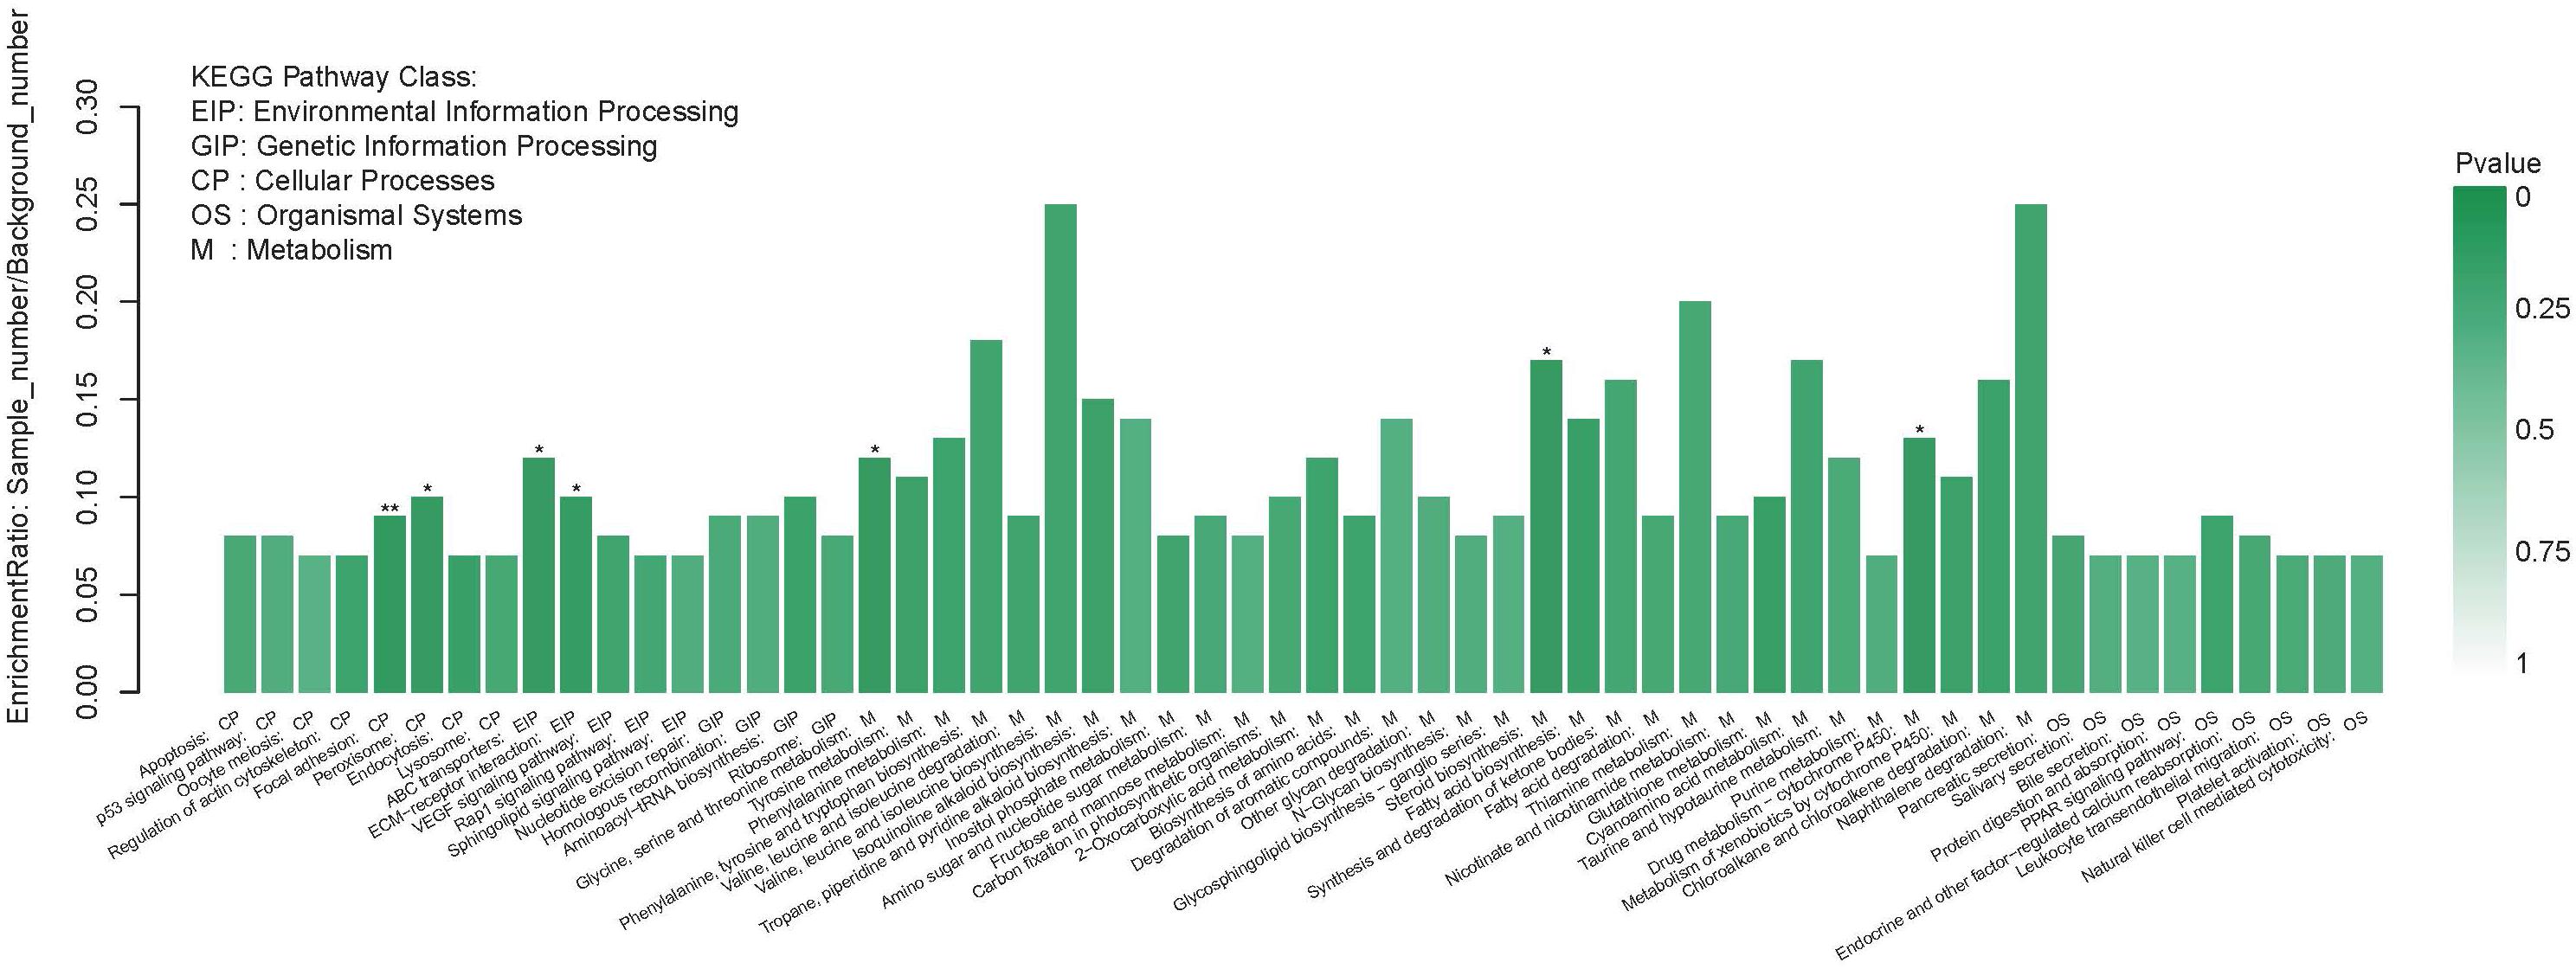
Figure 3. The significant enrichment of DEGs KEGG pathway. The left of the X-axis shows the enrichment ratio, and the right bar shows the P value (p value is represented by color). *P < 0.05; **P < 0.01.
DEGs Analysis and Functional Annotation
Sinocyclocheilus malacopterus and S. rhinocerous were designated control group and experimental groups, respectively. A total of 3,289 DEGs were identified, and 2,598 and 691 DEGs, respectively, were found to be respectively, down-regulated and up-regulated in S. rhinocerous (cave-dwelling species). The proportion of down-regulated genes in this surface vs. cave fish comparison. The volcano diagram in Figure 4 provides more detail.
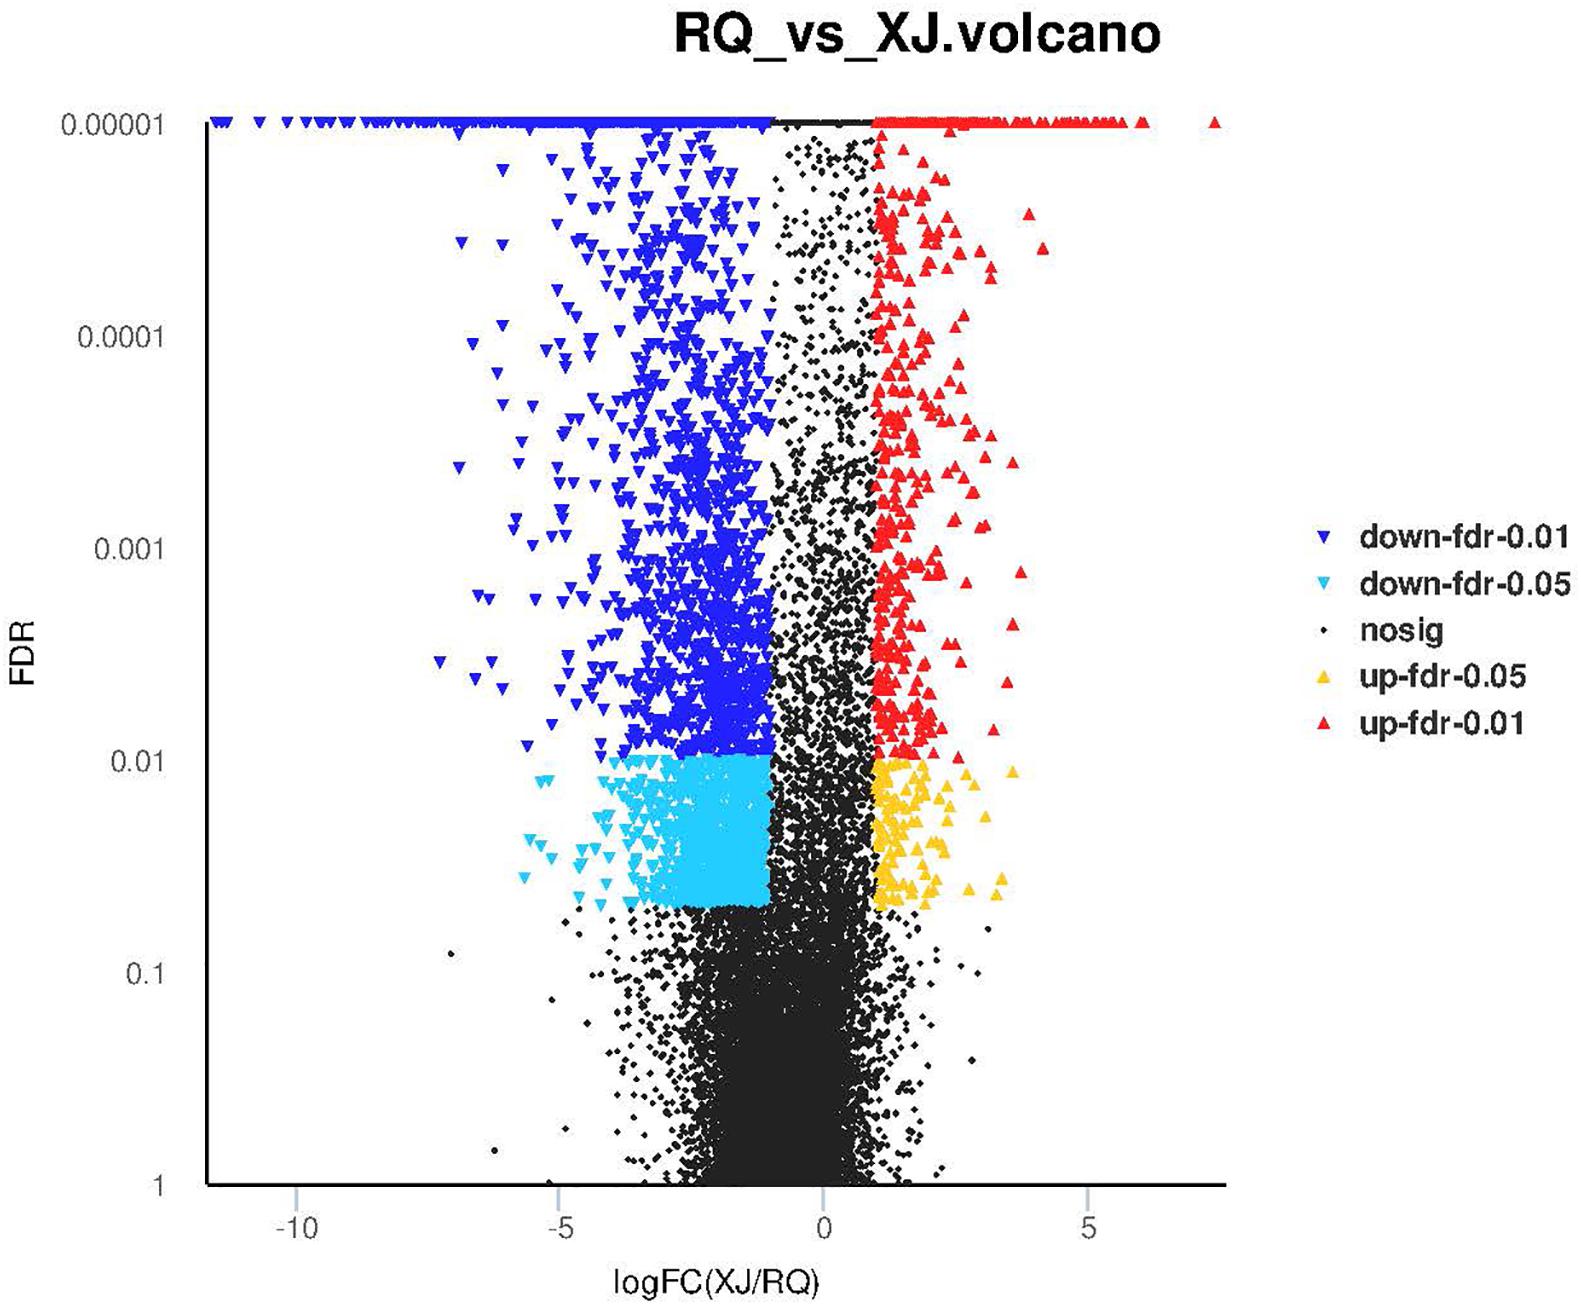
Figure 4. The number of differentially expressed genes of surface-cave fish groups. X-axis shows the differences in expression given as the log values, and the Y-axis shows significant differences in expression as FDR values in the Volcano plot; up-regulated genes and down-regulated genes are indicated by red dots and blue dots, respectively.
To further filter the candidate DEGs, we attempted to ascertain each DEG’s function using GO database annotation. DEGs in the surface-cave fish comparison group were classified into three functional categories in the GO database: biological process, Cellular component, and molecular function. However, several GO terms were over- or under-represented among these DEGs (Figure 5A). In the biological process category, regulation of biological processes and responses to stimuli were overrepresented among the up-regulated gene group, which may likely reflect the highly responsive behavior of cavefish to external stimuli, such as predation. The cells and organelles subcategory of the cellular component category was overrepresented among down-regulated genes. GO functional enrichment analysis of DEGs by using Goatools software, showed that the significant enrichment of DEGs functions was mainly concentrated in two categories: cellular component and molecular function (under which organelle membrane was the most significant subcategory) (P < 0.001) (Figure 5B).
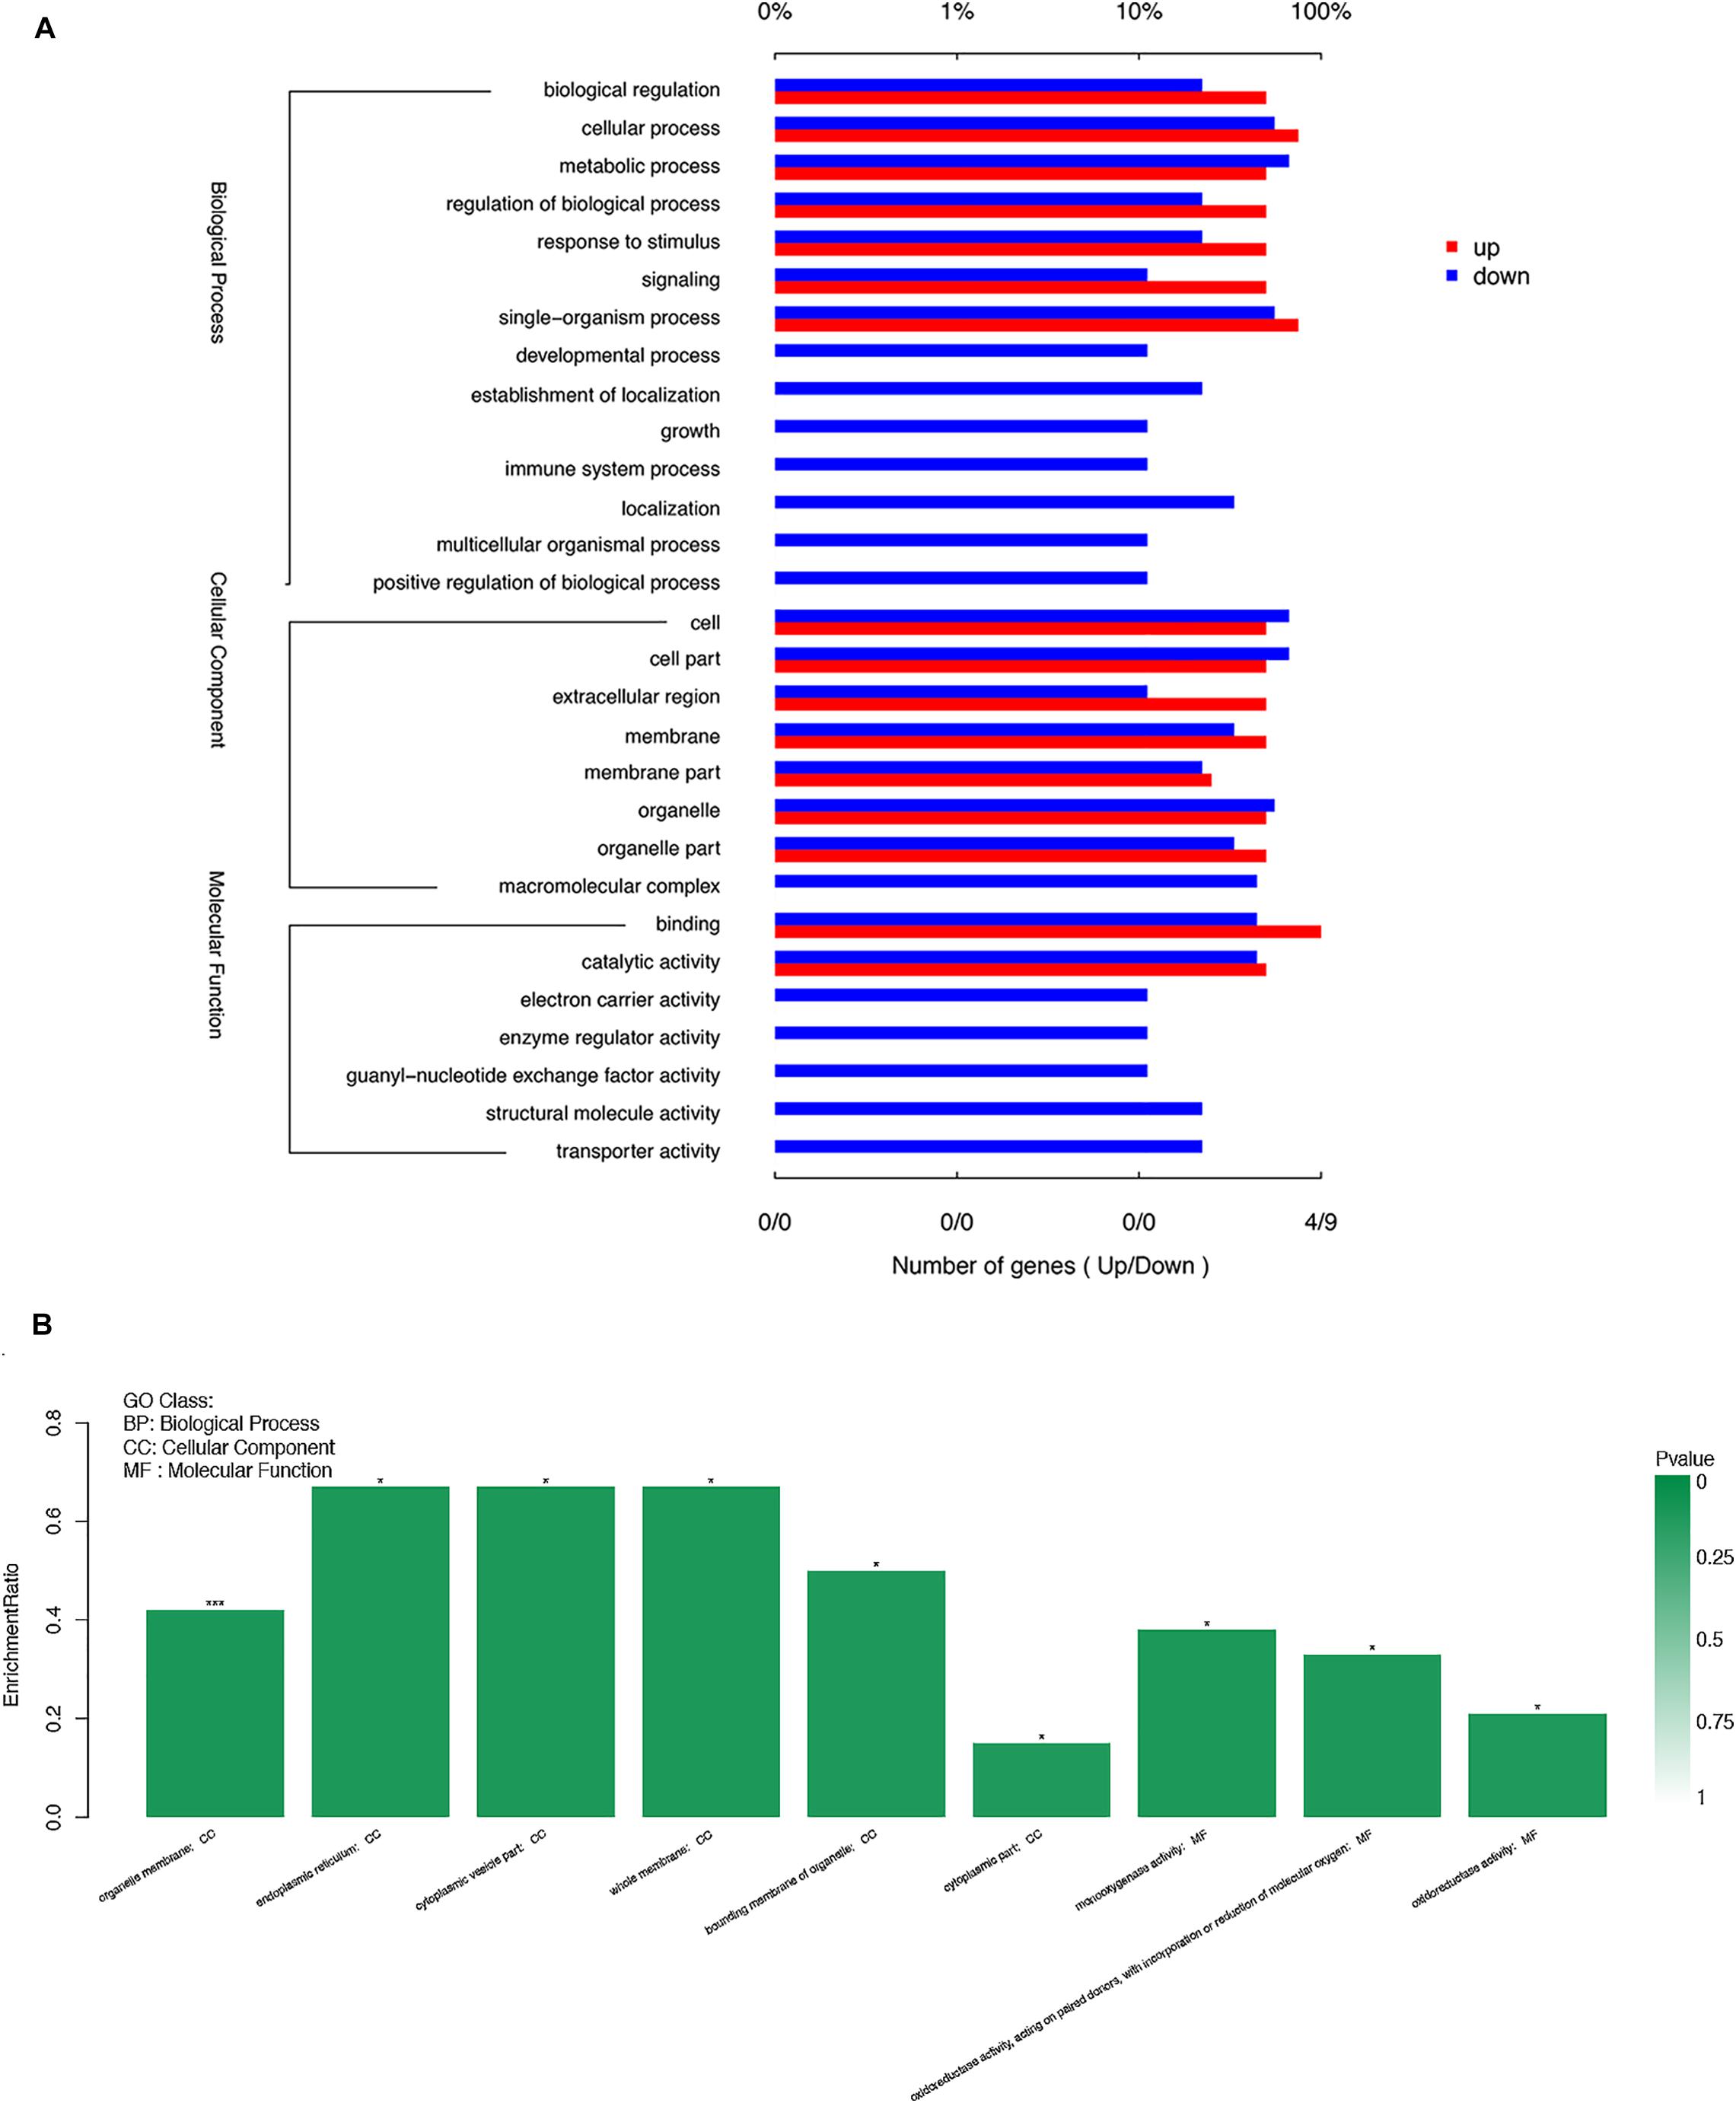
Figure 5. Functional distribution of the differentially expressed genes (DEGs) based on gene ontology (GO) term categorization. (A) Unigenes in each group were annotated in three GO categories: BP, biological process; CC, cellular component; MF, molecular function. The X-axis shows the percentage of the DEGs function categories. and the right of the Y-axis indicates the secondary level of term in the three major categories of GO categories. (B) The significant enrichment of DEGs function. The left of the X-axis shows the enrichment ratio, and the right bar shows the P value (p value is represented by color). *P < 0.05; ***P < 0.001.
The KEGG pathway annotations show the biological processes that these DEGs are involved in. This process assigned 3,051 DEGs to a total of 245 KEGG pathways. The top five KEGG pathways with the highest number of Unigenes were metabolic pathways (214 Unigenes), pathways in cancer (76 Unigenes), the PI3K-Akt signaling pathway (66 Unigenes), endocytosis (63 Unigenes), and focal adhesion (62 Unigenes) (Supplementary Material 4). KEGG enrichment analysis showed enriched DEGs representation among metabolism pathways (M), especially those related to synthesis and metabolism of amino acids such as glycine, serine, and threonine (ko00260), steroid biosynthesis (ko00100), and drug metabolism-cytochrome P450 (ko00982) (P < 0.05). The most significant enrichment pathway was seen in focal adhesion (ko04510) (P < 0.01). Furthermore, pathways related to glycometabolism and lipid metabolism, such as amino sugar and nucleotide sugar metabolism (ko00520), fructose and mannose metabolism (ko00051), other glycan degradation (ko00511), fatty acid biosynthesis (ko00061), and fatty acid degradation (ko00071) were also enriched in DEGs, though not significantly (Figure 3).
Target DEGs Selection and Expression Trend Validation
After the DEG functional analysis and pathway annotation, 13 of the 3289 total DEGs, putatively related to cave adaptability of the Sinocyclocheilus fish species, were selected. These DEGs are involved in cavefish specific phenotypes and behavioral traits, such as eye, brain, and retina development (pqbp1[polyglutamine binding protein 1], dab1[DAB adapter protein 1], and nmnat1[nicotinamide nucleotide adenylyltransferase 1]), circadian rhythm (ophn1[oligophrenin 1]) and energy regulation (CDK16[cyclin dependent kinase 16], and mtpn[myotrophin]). Interestingly, these DEGs were all down-regulated in Sinocyclocheilus cavefishes (Table 6). We verified this expression trend through the real-time PCR to ensure the reliability of transcriptome data in this study (Figure 6).
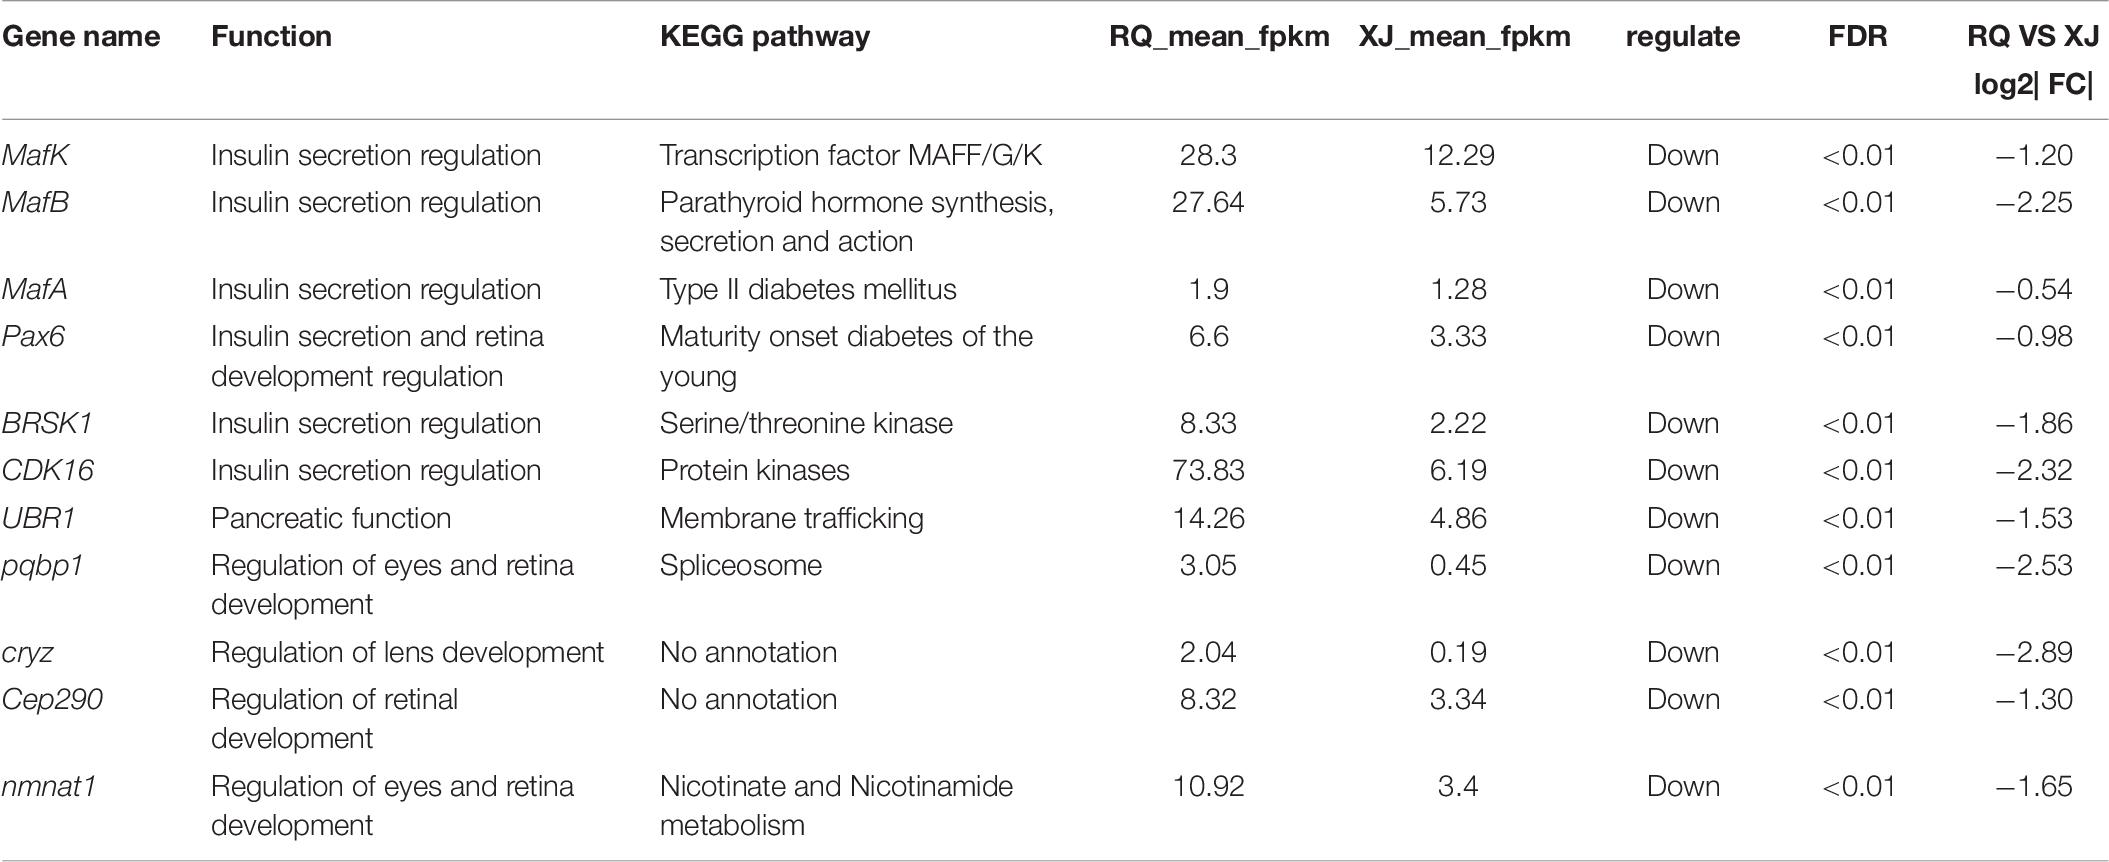
Table 6. Candidate DEGs that related to cave adaptability.
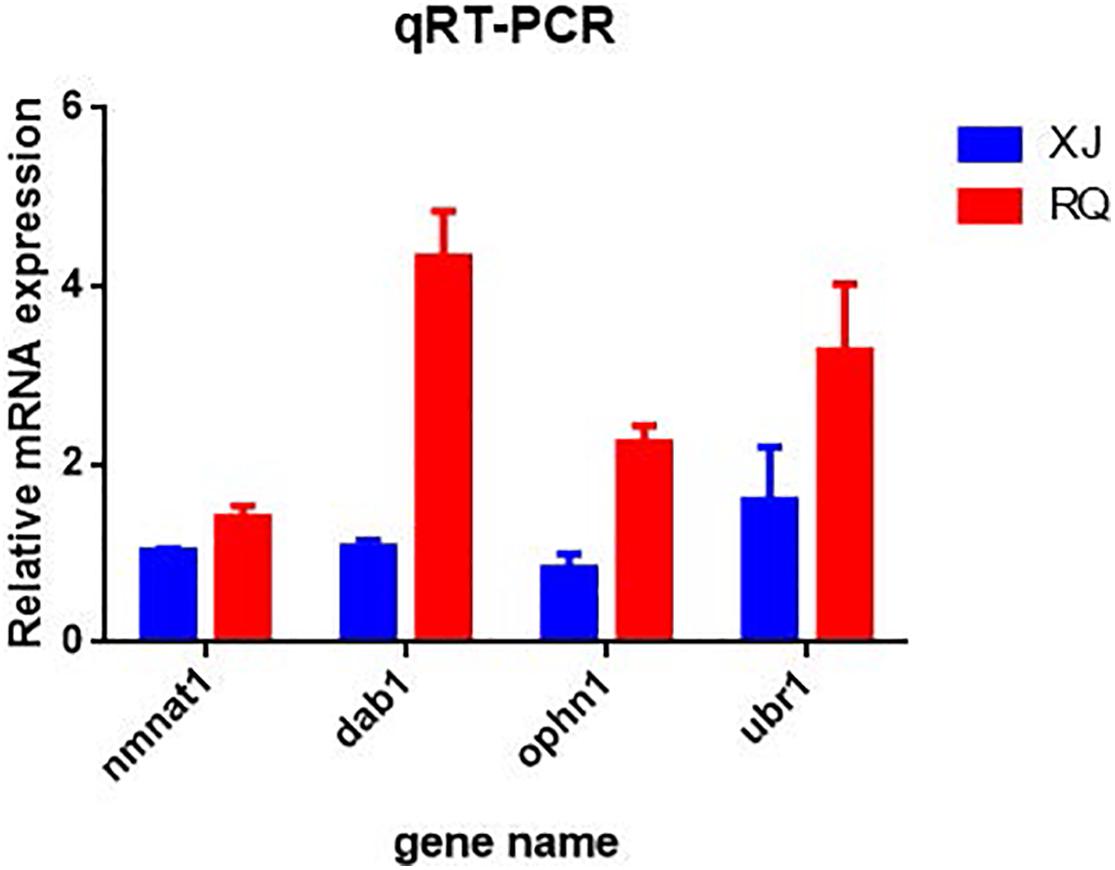
Figure 6. Quantitative real time PCR (qRT-PCR) validation of differentially expressed genes (DEGs) in each surface-cave group. The relative mRNA expression level is presented on the X-axis after normalization to β-actin. Bars in each panel represent the mean ± standard (n = 3); the red and blue colors in the bars indicate that the relative mRNA expression of Sinocyclocheilus cavefish and surface fish species.
The WCGNA of Cave and Surface Sinocyclocheilus Fish Species
After filtering, 41,958 entered genes were incorporated into 51 color-modules. The module of “turquoise” (12,239 genes) and “blue” (5,989 genes) modules are the two that contain the most genes. Details of the correlation between modules and clustering patterns are shown in Supplementary Material 5. A co-expression network was used to quantitatively link gene expression with two troglomorphic phenotypes, which readily distinguish two types of fish: eyes and horn (Figures 7A,B). In this study, our analysis identified groups of genes correlated with the observed troglomorphic traits. We found that the “turquoise” and “blue” modules showed a significant correlation with differentiation of Sinocyclocheilus fish species according to ecotype (Figures 7C,D). By focusing on these two highly correlated modules, we found tens of hub genes (Figure 8). Functional and pathway annotation indicated that these hub genes with differential expression between surface fish and cavefish are involved in a variety of biological processes, and are divided into the following four major categories: (i) regulation of insulin; (ii) energy and metabolism, especially related to ATP and GTP biosynthesis; (iii) phenotype and behavior; and (iv) nervous system development (Table 7).
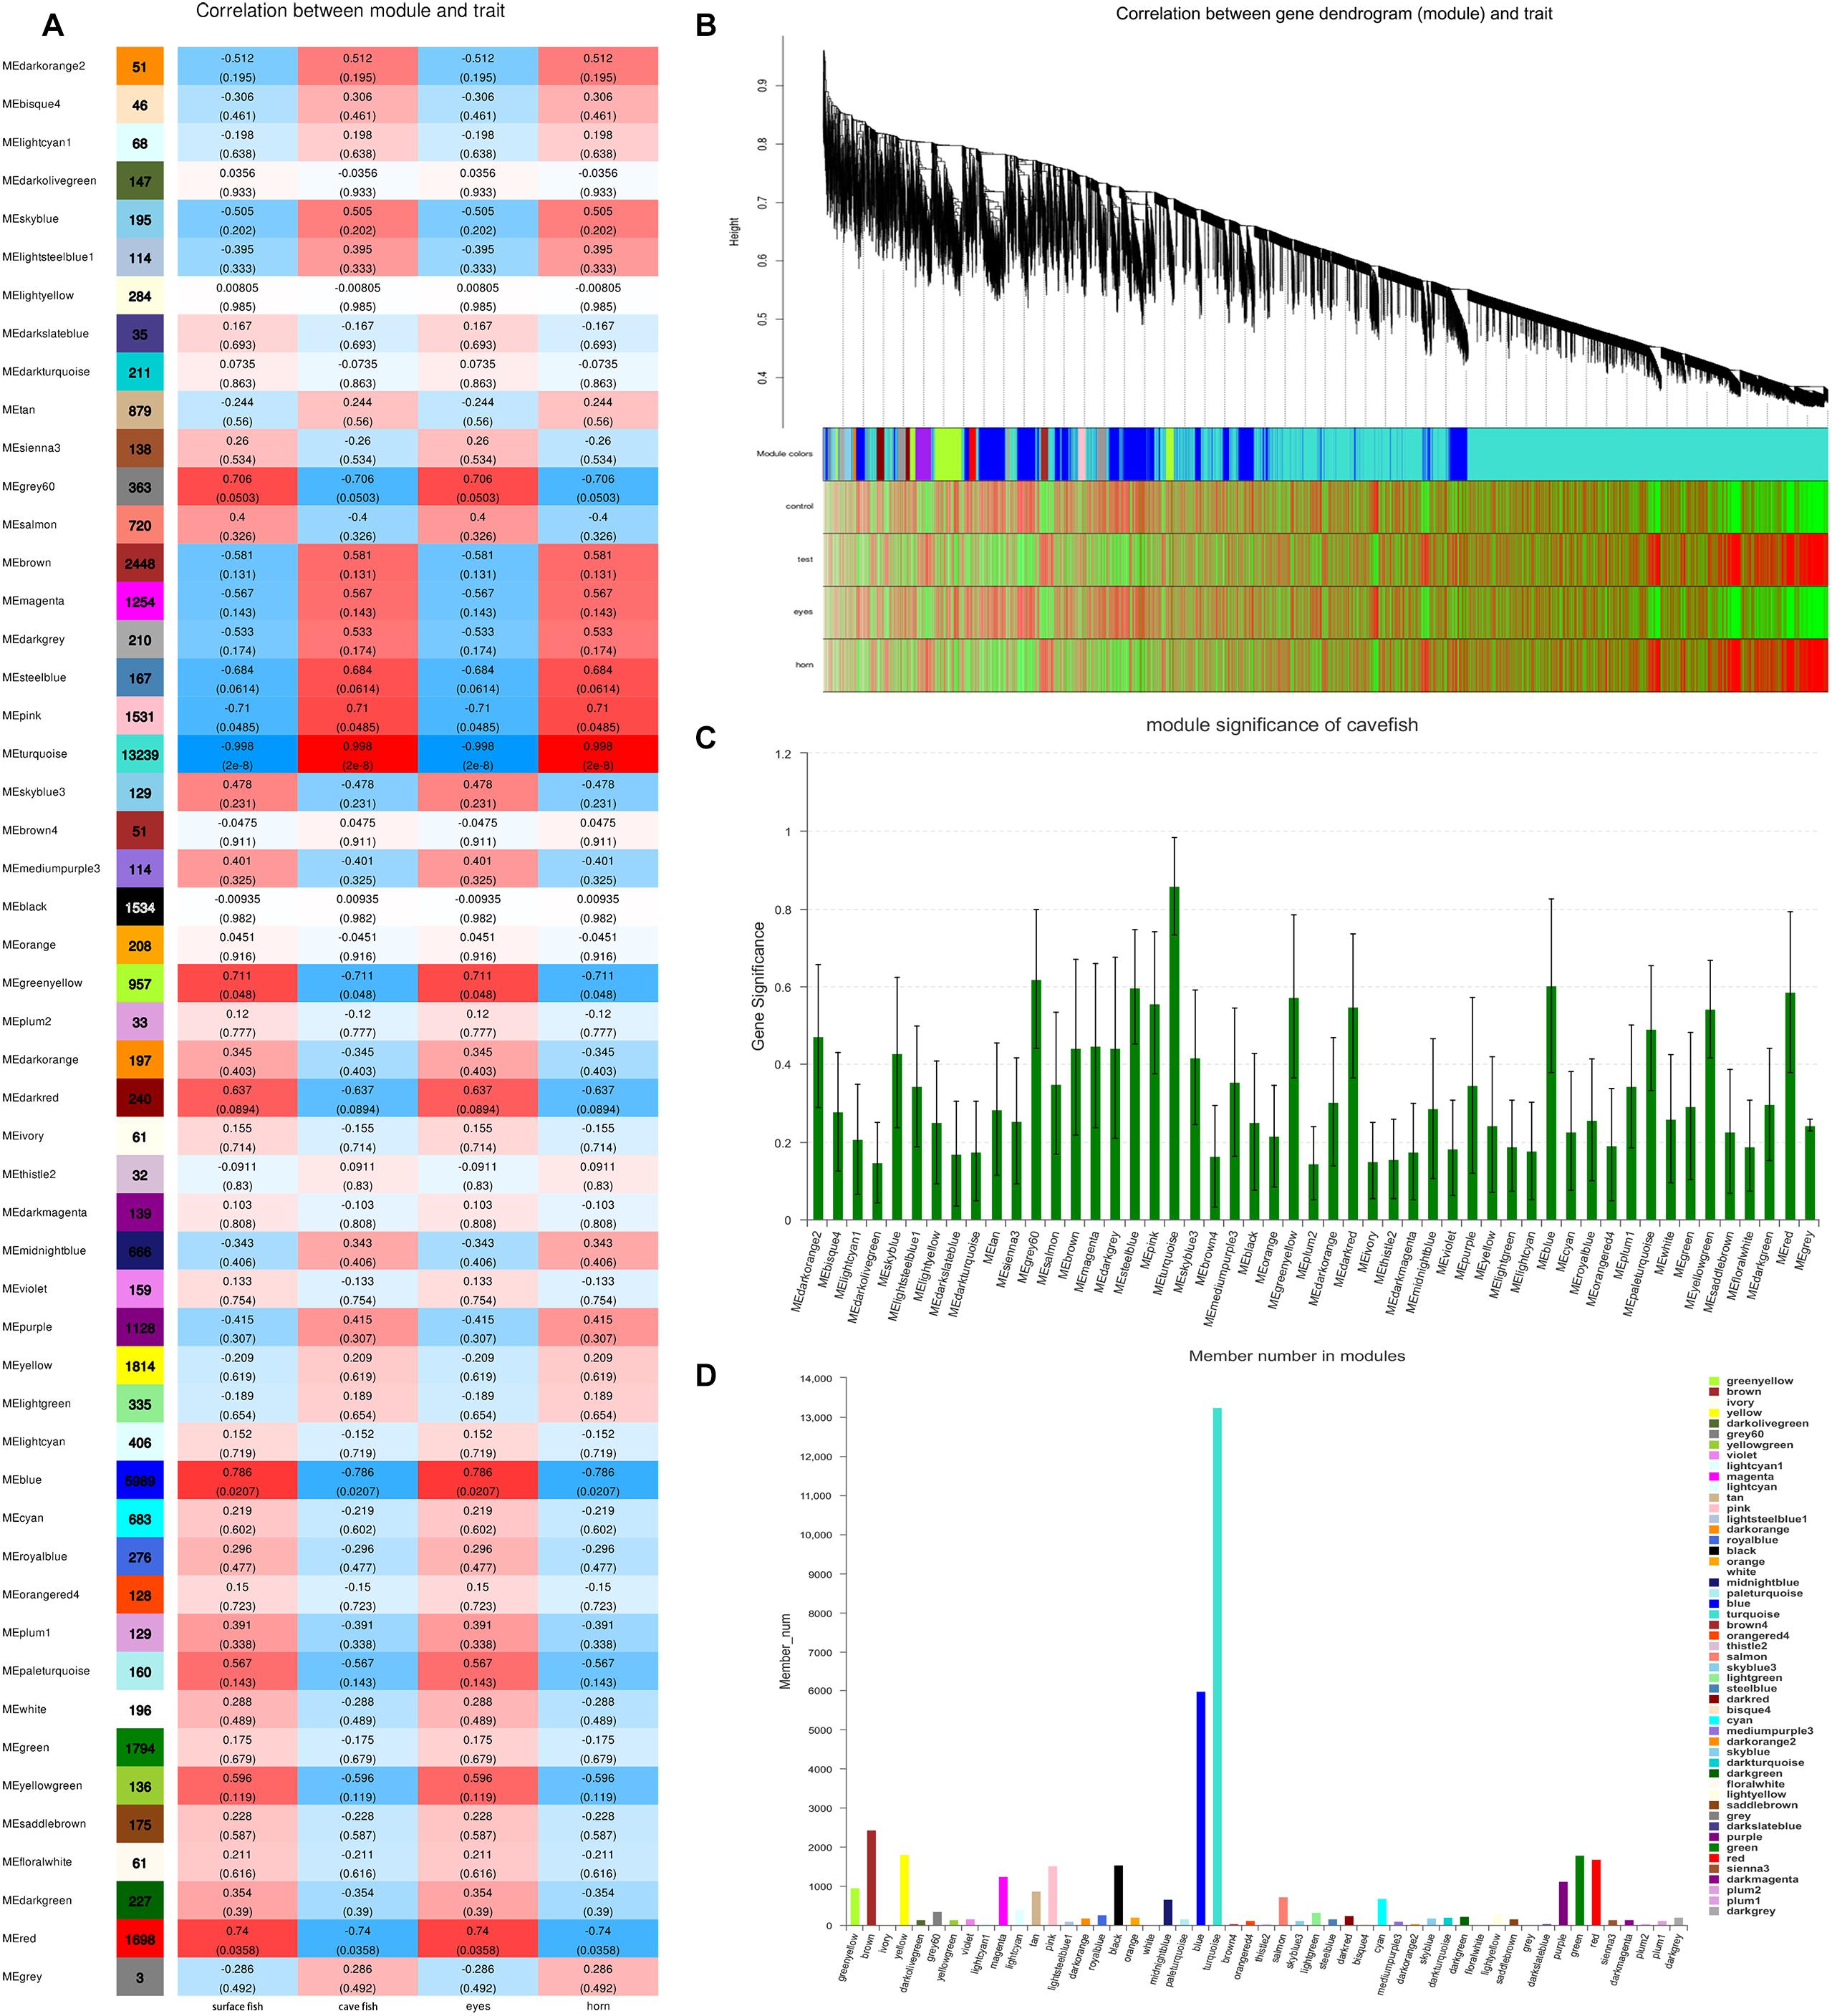
Figure 7. Weighted Gene Co-expression Network Analysis of Genes Correlated with troglomorphic traits. (A) The correlation between modules and traits; The number in the left column indicates the number of genes in each module; The data in the heat map on the right represents the correlation coefficient between the module and traits and P value (parentheses). The deeper the red (positive correlation) and blue (negative correlation), the greater correlation between the module and traits, respectively. (B) Clustering of the genes which correlated with troglomorphic traits. Distance is based on topological overlap, the bottom heat map indicates the signed correlation of each gene with traits: red, positive correlation; green, negative correlation. (C) Module significance, X-axis is the module and the Y-axis is the value of gene significance (GS). The larger GS value indicates a greater correlation with traits. (D) gene number in each module.
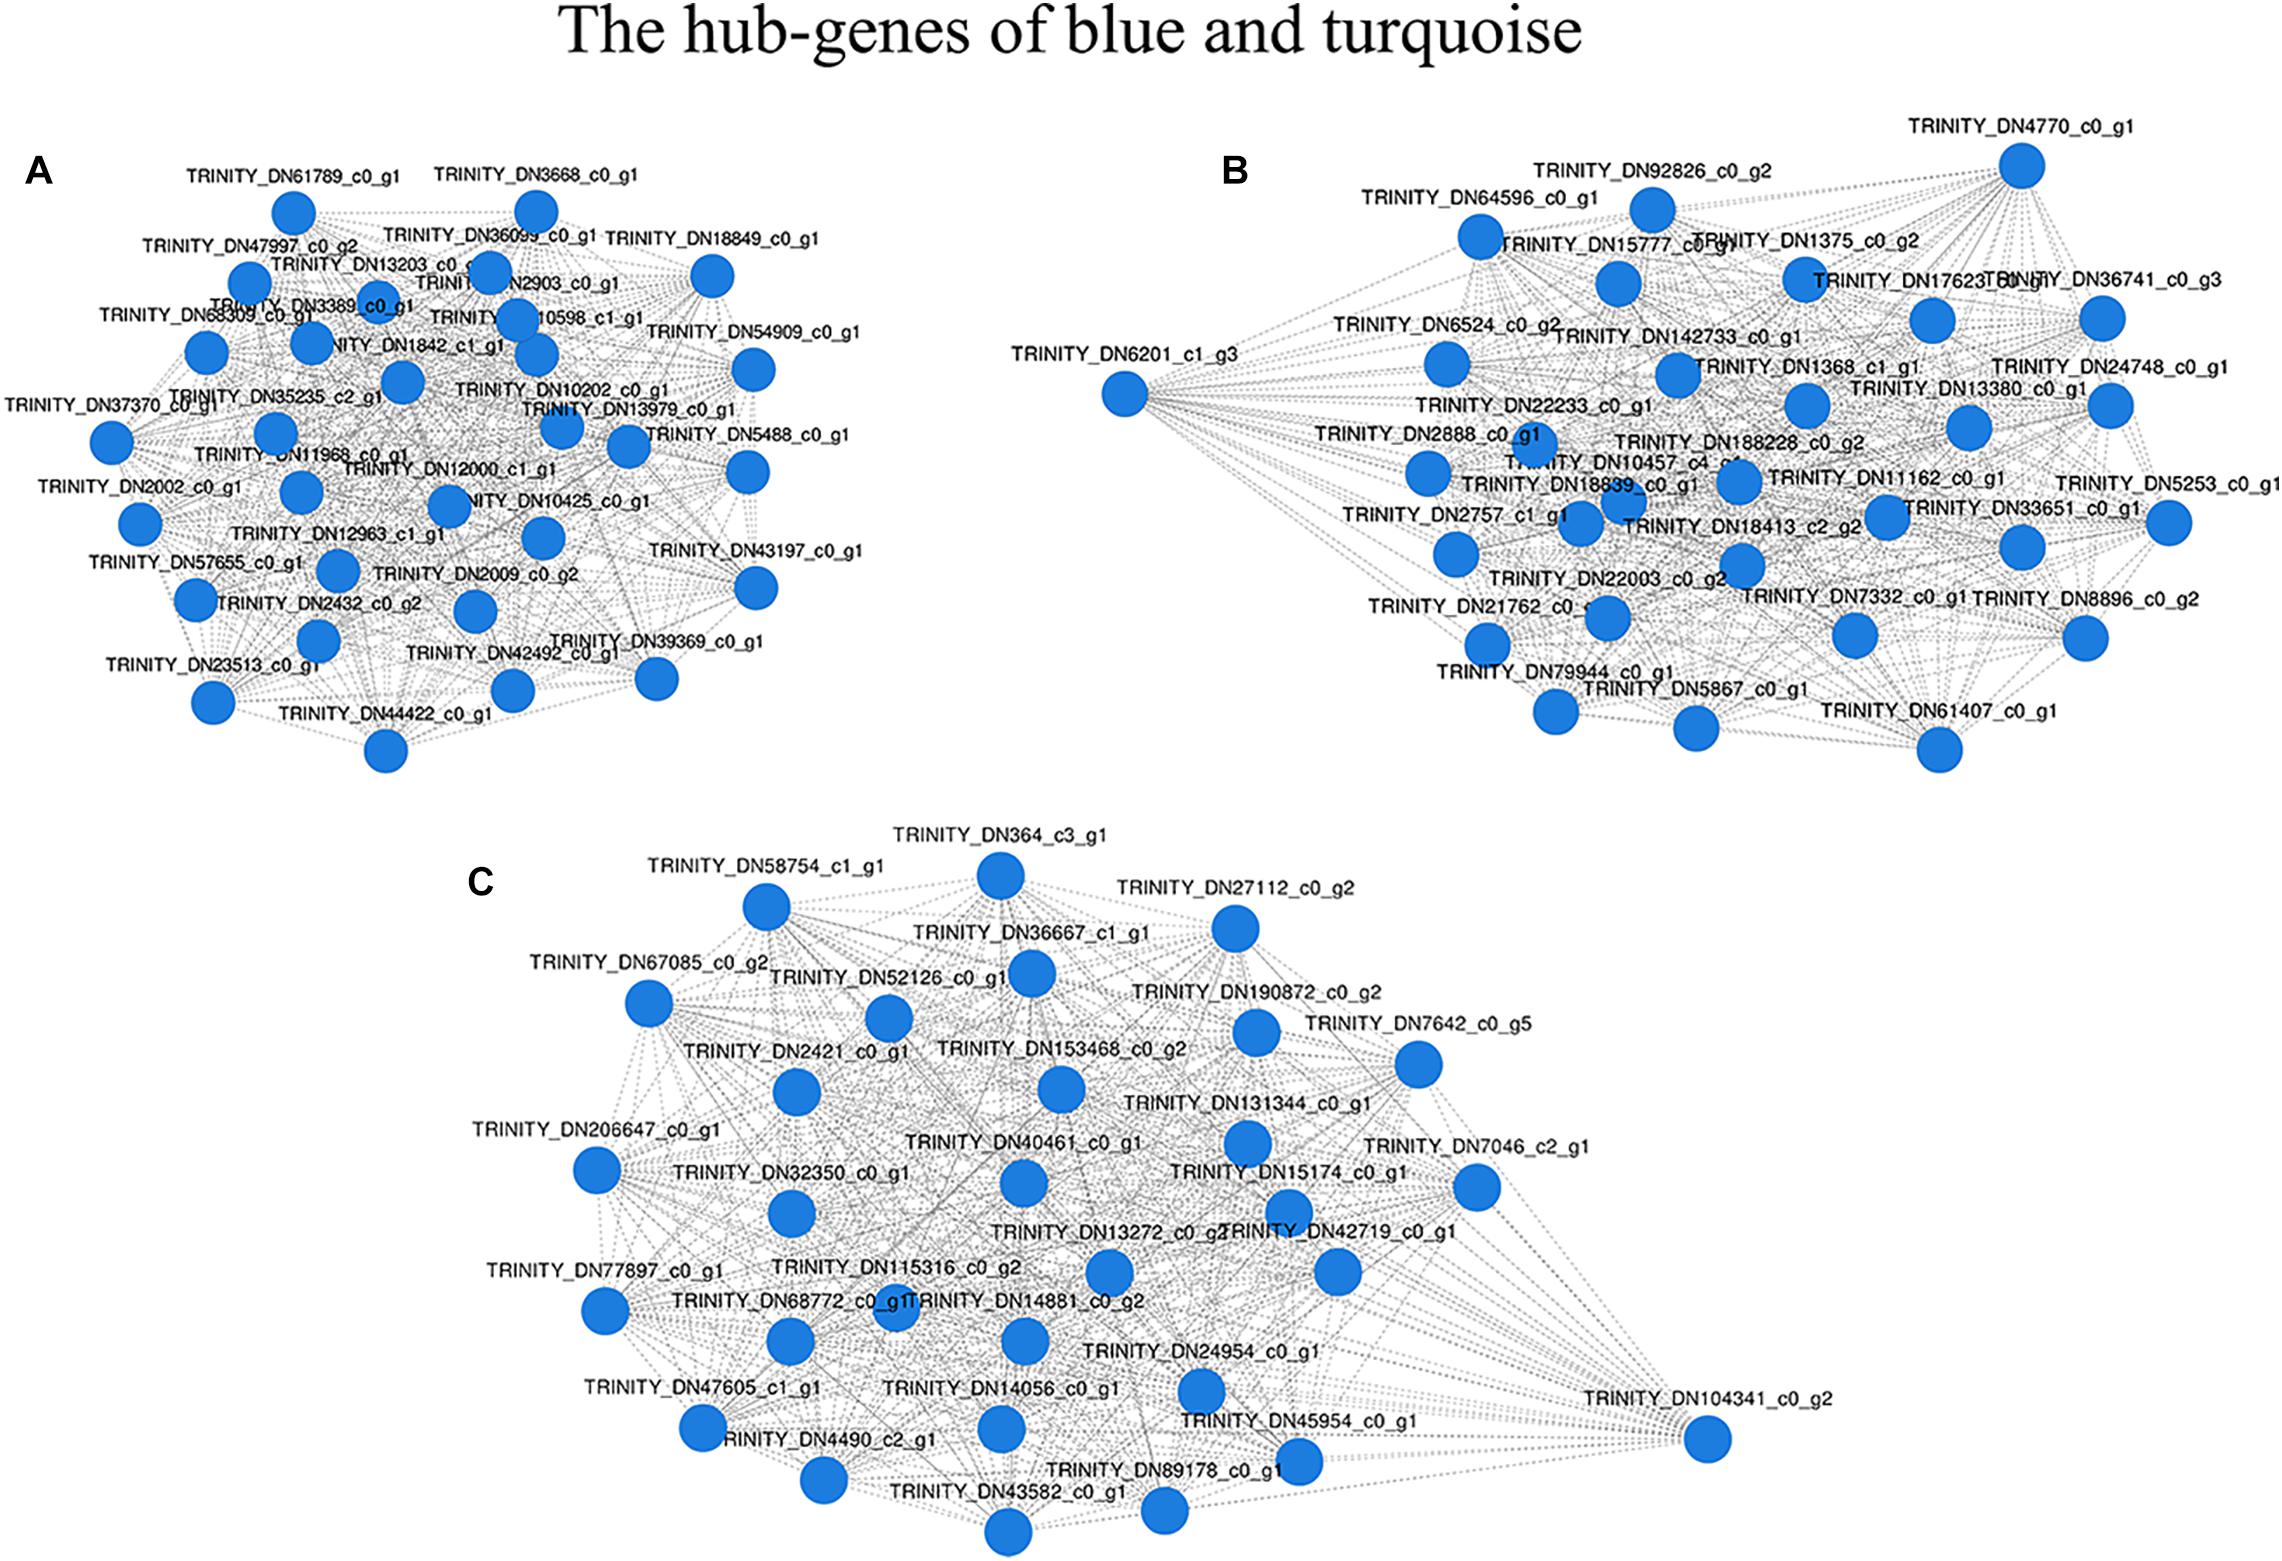
Figure 8. Network of the most connected hub-genes. (A) Gene co-expression network in the “blue” module. (B) Gene co-expression network1 in the “turquoise” module. (C) Gene co-expression network2 in the “turquoise” module.
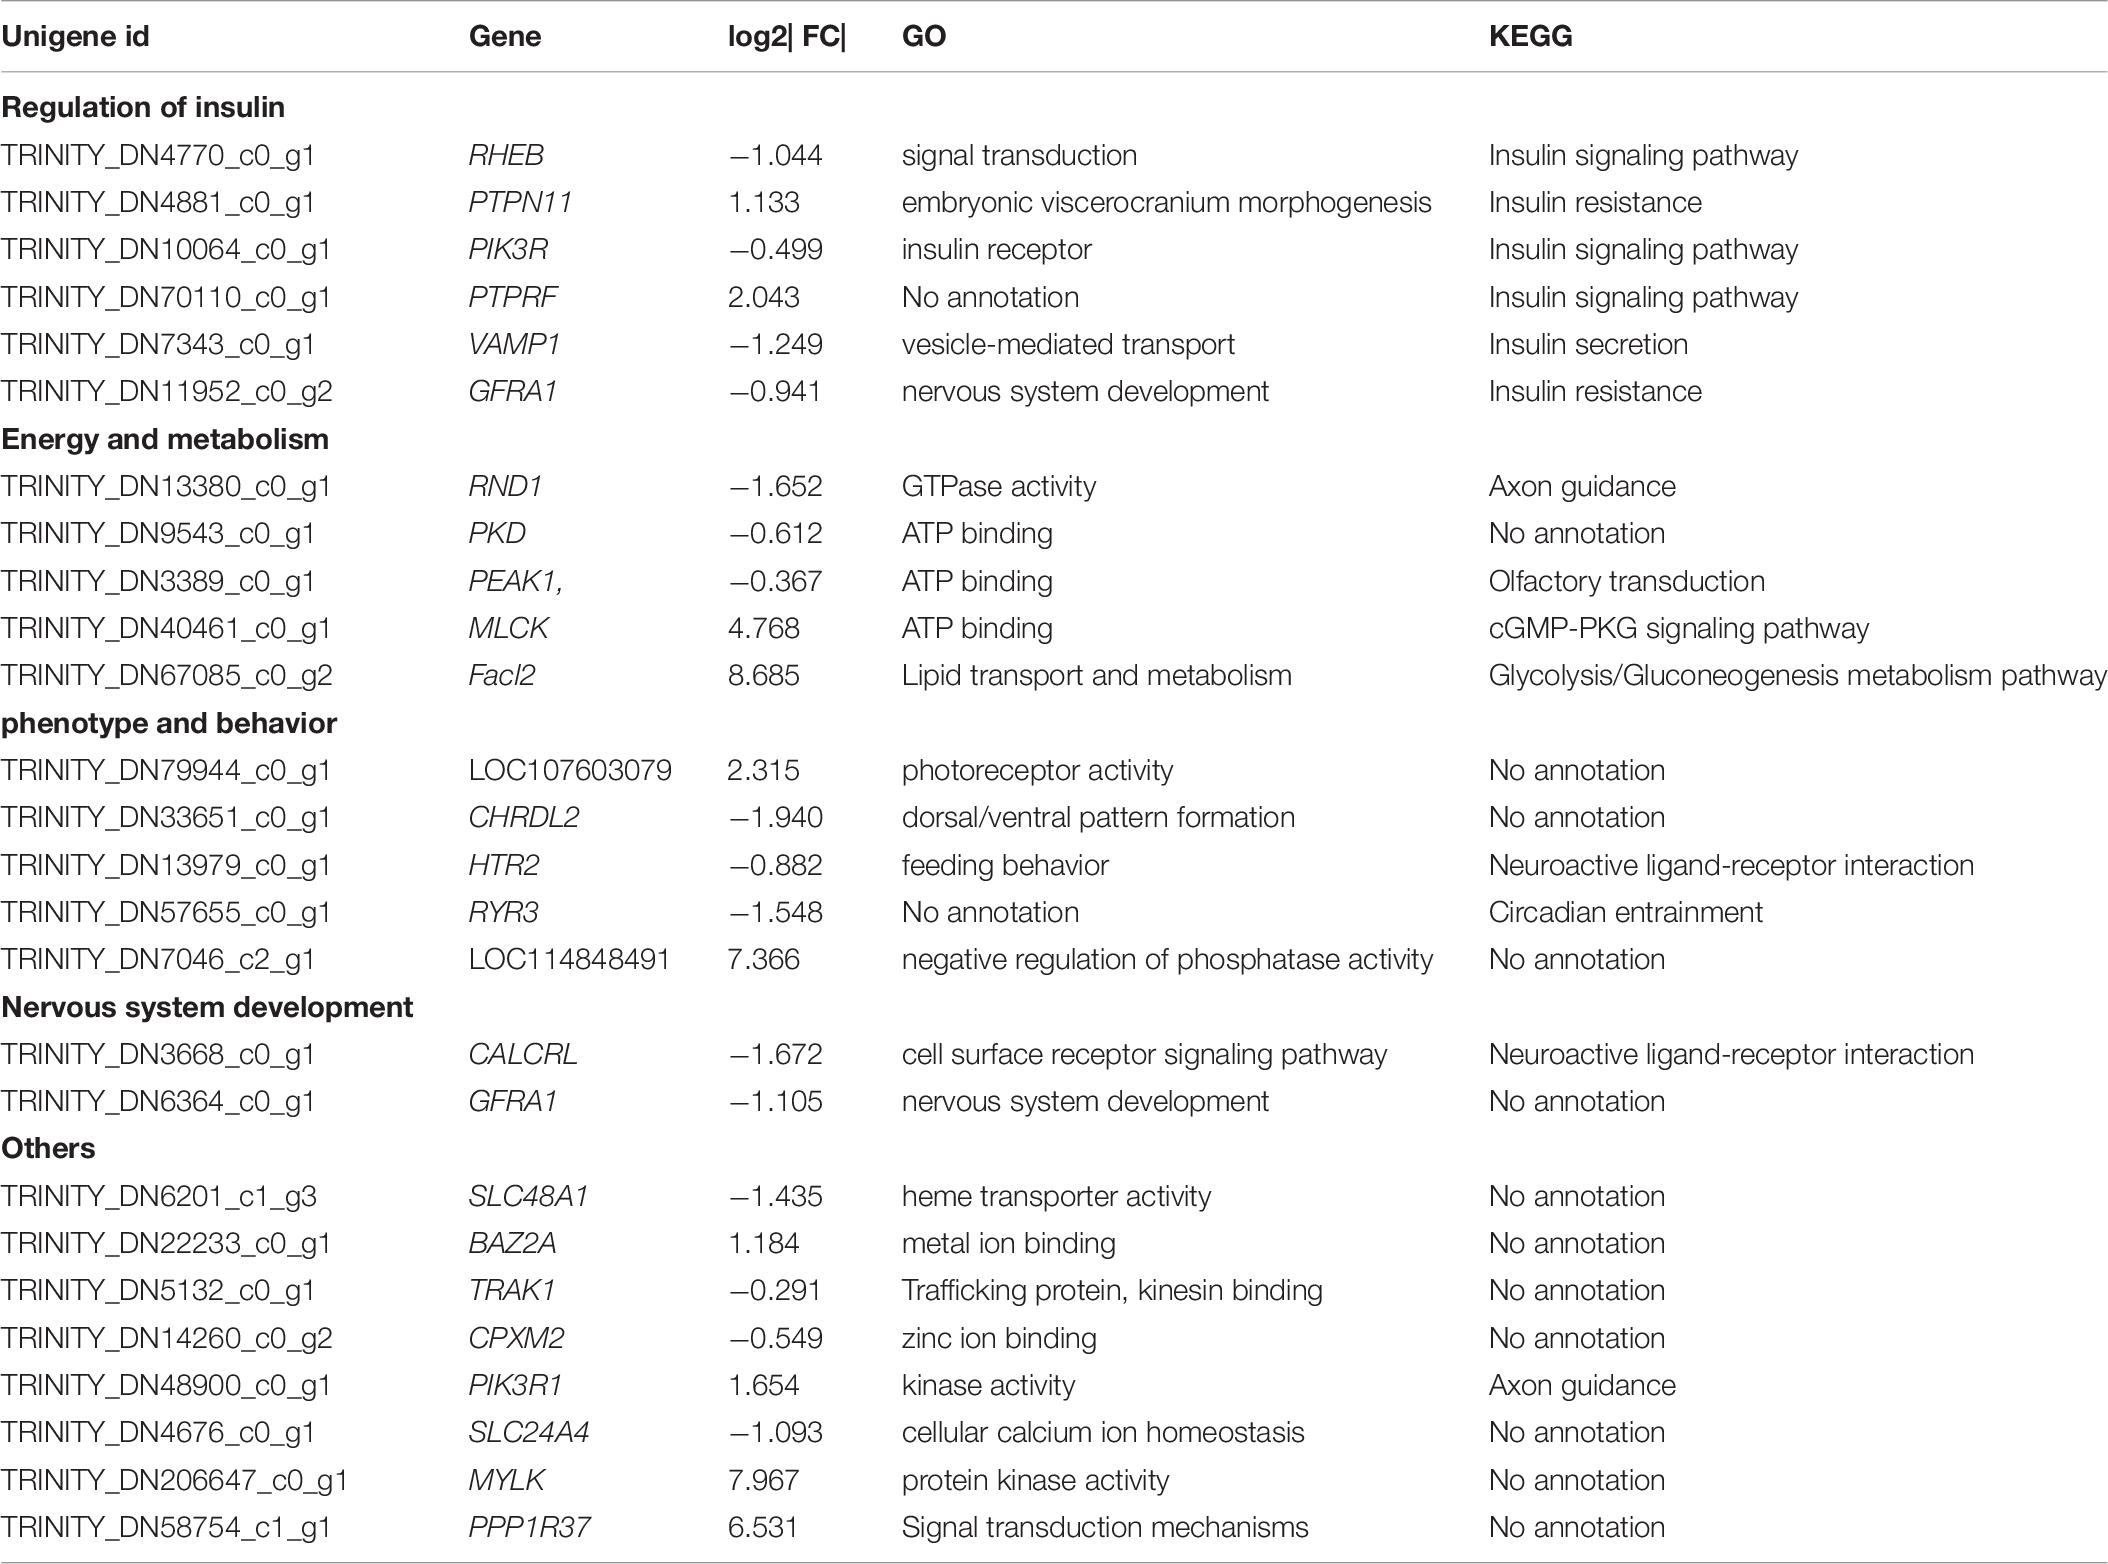
Table 7. The annotation of the hub genes with top 30 connectivity in “blue” and “turquoise” module with differential expression identified by WGCNA.
Discussion
Cave-adaptation has ultimately created a unique survival mechanisms and adaptive behaviors in organisms from the chronic stress of harsh habitat factors (Li et al., 1997). Many studies have shown that, the complex behaviors that are goal-directed (driven by the “intention” to survive or reproduce, e.g., food hunting, escape from predators) or emotion-related (e.g., aggression, anxiety, and fear) are controlled by brain-centric neuromodulation systems (Guo, 2003). Previous studies on some cavefish species indicated that some brain genes may play an important role in the evolution of cave adapted behaviors. For example, a mutation in the MAO (monoamine oxidase) gene coding sequence (pro160leu) in the blind Mexican cavefish A. mexicanus brain may lead to high levels of serotonin and low monoamine oxidase activity, resulting in complete loss of aggressive behavior, allowing evolution of new food-seeking behaviors. The author believes that this is conducive to energy acquisition by A. mexicanus (Elipot et al., 2013, 2014). This may illustrate that the link between phenotypic, physiological and behavioral adaptations and their underlying genetic mechanisms in cave-dwelling fishes can be further understood by investigating the transcriptional regulation patterns of genes in cavefish brains.
In this study, to minimize the influence of nature environment variables as much as possible, we selected two sympatric Sinocyclocheilus species, which represent an extremely rare phenomenon in the Sinocyclocheilus genus, namely, different types of fish (cave and surface) living in the same water body but at different depths. Through comparative transcriptomic analysis of brain transcriptome data which acquired through next-generation sequencing, followed by data analyses, we identified tens of DEGs reliable candidate DEGs that may be related to Sinocyclocheilus cavefish adaptability from among 3,289 total DEGs.
DEGs That Involved in the Development of Sinocyclocheilus Cavefish Brain and Eyes
Compared to Sinocyclocheilus surface fish species, absent or great vestigial of eyes is one of the most remarkable troglodyte features in cavefish (Yoshizawa et al., 2012). Histological investigations of the eye tissue from Sinocyclocheilus cavefish have revealed that the cone cells normally distributed in the center of the retina are deficient, resulting in ineffectively distinguishment of colors and light intensity (Li and Tao, 2002). Another previously study of Sinocyclocheilus eyes have showed that gene expression patterns were substantially altered between cave and surface fish species, and some genes were identified that are responsible for eye degeneration (Meng et al., 2013). Interestingly, in this study, we also identified some genes (cryz[crystallin zeta], CEP290[centrosomal protein 290], and nmnat1[nicotinamide nucleotide adenylyltransferase 1]) that may be related to eye development (retina) that exhibit differential expression in the cavefish brain.
Leber congenital amaurosis (LCA) is a genetically heterogeneous inherited retinal dystrophy characterized by retinal dysplasia and severe vision loss, and associate with mutations in 18 genes, including CEP290, nmnat1, LCA5[Leber congenital amaurosis 5], and TULP1[TUB like protein 1] (Maeder et al., 2019). LCA symptoms are very similar to those of eye degeneration in Sinocyclocheilus cavefish. Unexpectedly, we found in this study that two LCA-related retinal developmental genes (CEP290 and nmnat1) were down regulated in the Sinocyclocheilus cavefish brain. CEP290 protein is encoded by 54 exons, and localizes to the photoreceptor-connecting cilium. Loss-of-function mutations in CEP290 can cause severe cone dystrophy and blindness (Cideciyan et al., 2007). nmnat1 encodes an essential rate-limiting enzyme that catalyzes the ligation of nicotinamide mononucleotide to ATP to form NAD in the NAD biosynthesis pathway, a highly energy-consuming process (Siemiatkowska et al., 2014). Earlier studies found that loss of nmnat1 in Drosophila melanogaster and mice leads to retinal degradation and photoreceptor cell degeneration (Zhai et al., 2006; Greenwald et al., 2016).
We believe that the DEGs related to eye development may reflect functions within the brain that regulate formation of the visual system of Sinocyclocheilus cavefish. We speculate that the differential expression of these genes may be one reasons for developmental defects in the eyes of Sinocyclocheilus cavefish eyes.
Among the Sinocyclocheilus cavefish species is a group of species with special head morphological characteristics. Namely, the head protrudes forward to form a spike-shaped angular convex structure. The function of this horn remains unknown. Li et al. speculated that the horn structure in cavefish species might be a protective organ that minimizes damage to the head when hitting underwater rocks (Li and Tao, 2002). In this study, we found two genes (coasy[Coenzyme A synthase] and pqbp1), which may regulate to head shape, that were significantly down regulation in the cavefish brain. CoA synthase, which is mainly expressed in the brain, is an important players in cellular metabolism and signal transduction. Loss of function variants of coasy have been shown to lead to head deformities (microcephaly) (Nemazanyy et al., 2006; van Dijk et al., 2018). Moreover, Khatri et al. (2016) found that down-regulation of coasy could lead to abnormal development of the head in zebrafish (Danio rerio), including brain protrusion in the knockout. Polyglutamine tract-binding protein 1 (PQBP1) has been directly linked to intellectual disability. Many studies have proven that mutations in PQBP1 (duplications or deletions of AG dinucleotides in the fourth coding exon) may be a primary cause of developmental deformities of the eyes (microphthalmia) and head (microcephaly) (Kleefstra et al., 2004; Martínez-Garay et al., 2007). Yang et al., 2020 analyzed the bone phenotype of Pqbp1-knockout mice (cKO) and found that Pqbp1-cKO mice exhibited brachycephaly and significant reduction in bone formation and chondrocytes. Furthermore, expression of osteoblast- and chondrocyte-related gene was downregulated in the Pqbp1-cKO mice. PQBP1, an intellectual disability causative gene, affects bone development and growth (Yang et al., 2020).
The DEGs involved in Sinocyclocheilus cavefish eye and head formation identified in this study may provide an appropriate genetic basis for future studies of the formation of troglomorphic traits and adaptability characteristics of troglobites. However, further validation experiments, such as gene knockout or gene overexpression, are needed to validate the function of these genes.
Downregulation of Insulin-Related Genes in the Sinocyclocheilus Cavefish Brain
Living in perpetual darkness in cave environments that cannot support photosynthesis have caused scarcity of food resources to become the main pressure faced by cavefish (i.e., adaptation to long periods of nutrient deprivation in underground water bodies). In addition to minimizing unnecessary consumption of energy (Gross and Wilkens, 2013), appropriate behavioral and metabolic adaptations to increase the probability of energy intake and improve maintenance of energy stores, such as blood sugar homeostasis and reduction of metabolic rate, are also important for survival.
Previous studies of the cave adaptability of fish have been found that, compared to surface fish, cavefish species Mexican tetra (A. mexicanus) exhibit dysregulated blood glucose homeostasis, and are insulin-resistant due to a mutation in the insulin receptor. The author believes that keeping blood sugar at high levels high for a long periods may be advantageous in caves as a strategy to cope with the periodic food shortages (Riddle et al., 2018).
Insulin is an essential polypeptide hormone that regulates of blood glucose, and fatty acid, and amino acid metabolism. It is synthesized exclusively in pancreatic islet B cells. Expression of the insulin gene is regulated by several islet-enriched transcription factors (Matsuoka et al., 2004). As part of a cascade of regulatory genes, the Maf transcription factor family has been shown to play an important role in insulin regulation. MafA[MAF bZIP transcription factor A], MafB[MAF bZIP transcription factor B], and MafK[MAF bZIP transcription factor K] are components of a multisubunit Maf transcription factor complex that activates insulin gene expression in pancreatic β-cells (Kataoka and Kamber, 2004), Artner et al. (2007) found that MafB loss of function mutations in mice lead to decreased insulin expression, and blockade of β-cells maturation. Similarly, Nishimura et al. found that the number of pancreatic islet β-cells was significantly reduced upon knockout of the MafB gene in mice (Nishimura et al., 2006). MafA is a transcription factor that binds to the insulin gene promoter and is expressed exclusively in pancreatic β-cells to regulate insulin transcription in response to serum glucose levels. The current study demonstrated that the transcription factor MafA is a crucial regulator of insulin secretion. Moreover, the MafA-deficient mice are currently used as a new model for studying the overt diabetes mellitus (Matsuoka et al., 2004; Zhang et al., 2005).
In this study, we found that most of the Maf transcription factors family genes mentioned above, including MafA, MafB, and MafK all trend toward down-regulation in Sinocyclocheilus cavefish species relative to surface fish species. Moreover, pax6 [paired box 6], the upstream regulatory gene of MafB and MafA, is synchronously down-regulated, though its log2| Foldchange| < 1. Pax6 acts upstream of MafB, and is fundamental for MafB to activate insulin expression. Pax6 also regulates PDX-1 [pancreatic and duodenal homeobox 1], and MafA expression is required for β-cell maturation (Nishimura et al., 2008). We also found that, in addition to the Maf transcription factor family, other insulin secretion regulating genes, such as BRSK[BR-serine/threonine kinase-like protein], CDK16, and UBR1[ubiquitin protein ligase E3 component n-recognin 1] are differentially expressed in the cavefish brain. Brain-selective kinase (BRSK) is a member of the AMP-activated protein kinase (AMPK) subfamily of serine/threonine kinases. BRSK plays an important role in regulating glucose-stimulated insulin secretion (GSIS) in response to blood glucose by phosphorylating CDK16 (serine/threonine kinase) (Chen et al., 2012). UBR1 encodes one of at least four functionally overlapping E3 ubiquitin ligases of the N-end rule pathway. Previous studies have found that low expression of UBR1 perturbs pancreas cells and eventually leads to pancreatic insufficiency (Hülskamp et al., 2005). This may indicate that regulation of insulin expression to balance metabolic stress and energy intake is important in cavefish populations, but various mechanisms might be involved in different species. However, due to the limited fish sample sizes, we cannot conduct more additional experiments. Further functional verification experiments are needed to test the hypothesis that the Maf transcription factors family and other candidate genes we mentioned above play an important role in insulin regulation in cavefish is required.
Co-expressed Gene Network Revealed the Important Differences Between Two Sinocyclocheilus Fish Species
In this study, we aimed to find “modules” which correlated significantly with different types of Sinocyclocheilus fish, by using transcriptomic data through WGCNA. Genes with certain functions in these modules may be related to the division of two ecological types of Sinocyclocheilus fish species. We focused on the two most highly correlated modules, “turquoise” and “blue,” and found three co-expressing network modules that comprised the top 90 hub genes (Figure 8). Through function and pathway annotation, we found that these hub genes with differential expression between cave and surface fish are mainly related to regulation of insulin, energy, and metabolism, phenotype and behavior, and nervous system development (Table 7). Interestingly, most of the genes related to insulin regulation display varying degrees of differential expression in the brain of Sinocyclocheilus cavefish. This may further confirm that there is a difference in insulin regulatory mechanism between the two types of Sinocyclocheilus fish. Our previous research showed that two types of Sinocyclocheilus fish species have diverse dietary preferences and predation patterns (Chen et al., 2019). We believe that dietary preferences may cause differences in energy intake, ultimately affecting blood glucose regulation. Furthermore, these results may confirm the previous hypothesis that starvation resistance and metabolic regulation of cavefish would be present in multiple independently evolved cavefish populations (Bilandžija et al., 2020). However, more in-depth studies involving quantitative detection of insulin and blood glucose in the Sinocyclocheilus cave and surface fish species is still needed to verify the relationship between these DEGs and cave adaptability.
In this study, we conducted brain comparative transcriptomics analysis of two Sinocyclocheilus fish species, and found tens of DEGs that may be related to cave adaptability, with functions including insulin secretion regulation (MafA, MafB, MafK, BRSK, and CDK16) and troglomorphic trait formation (CEP290, nmnat1, COASY, and pqbp1). This study adds to our understanding of cave adaptation mechanisms. However, the brain transcriptome alone cannot fully represent and comprehensively explain the molecular mechanisms of cavefish special phenotypes. Accordingly, it is necessary to perform additional transcriptome sequencing from muscle, eyes, and liver in future work to provide a more complete explanation of the evolution of troglomorphism.
Data Availability Statement
The datasets presented in this study can be found in online repositories. The names of the repository/repositories and accession number(s) can be found below: NCBI BioProject (accession: PRJNA655363).
Ethics Statement
The animal study was reviewed and approved by the Animal Ethics and Welfare Committee at Yunnan University.
Author Contributions
SC and HX contributed to conceptualization, project administration, and funding acquisition. CL, HC, and YZ carried out investigation and performed formal analysis. YZ and CL contributed to methodology and resources. HC, SC, and HX wrote the manuscript. HC and SC reviewed and edited the manuscript. All authors read and approved the final version of the manuscript.
Funding
This study was partially supported by the National Natural Science Foundation of China (31560111) and the Top Young Talents Program of Ten-Thousand Plan of Yunnan Province (YNWR-QNBJ-2018-024).
Conflict of Interest
The authors declare that the research was conducted in the absence of any commercial or financial relationships that could be construed as a potential conflict of interest.
Supplementary Material
The Supplementary Material for this article can be found online at: https://www.frontiersin.org/articles/10.3389/fevo.2020.589039/full#supplementary-material
Supplementary Material 1 | Homologous species distribution analysis against Nr database.
Supplementary Material 2 | Database annotation of Unigenes for brain transcriptome of two Sinocyclocheilus species. (A) COG database; (B) KOG database.
Supplementary Material 3 | KEGG pathways of the Unigenes annotations.
Supplementary Material 4 | The top 30 KEGG pathways of the Unigenes annotations.
Supplementary Material 5 | Co-expression modules conducted by WGCNA. (A) The Module clustering dendrogram; A branch represents a module, the distance between two branches indicates module correlation, which can be used as a basis for module merger. (B) The heat map of correlation between modules. The deeper the red and green, the greater and less correlation between the module, respectively. (C) A hierarchical cluster tree conducted by WGCNA showed co-expression modules. Each leaf represents a gene, and each module corresponds to branches marked by different colors.
Footnotes
- ^ http://trinityrnaseq.sourceforge.net/
- ^ https://github.com/jstjohn/SeqPrep
- ^ https://github.com/najoshi/sickle
- ^ http://www.blast2go.com/b2ghome
- ^ http://www.genome.jp/kegg/
- ^ http://deweylab.biostat.wisc.edu/rsem/
- ^ https://github.com/tanghaibao/Goatools
- ^ http://kobas.cbi.pku.edu.cn/home.do
References
Artner, I., Blanchi, B., Raum, J. C., Guo, M., Kaneko, T., Cordes, S., et al. (2007). MafB is required for islet beta cell maturation. Proc. Natl. Acad. Sci. U.S.A. 104, 3853–3858. doi: 10.1073/pnas.0700013104
Aspiras, A. C., Rohner, N., Martineau, B., and Borowsky, R. L. (2015). Melanocortin 4 receptor mutations contribute to the adaptation of cavefish to nutrient-poor conditions. Proc. Natl. Acad. Sci. U.S.A. 112, 9668–9673. doi: 10.1073/pnas.1510802112
Bilandžija, H., Hollifield, B., Steck, M., Meng, G., Ng, M., Koch, A. D., et al. (2020). Phenotypic plasticity as a mechanism of cave colonization and adaptation. eLife 9:e51830. doi: 10.7554/eLife.51830
Ceinos, R. M., Frigato, E., Pagano, C., Fröhlich, N., Negrini, P., Cavallari, N., et al. (2018). Mutations in blind cavefish target the light-regulated circadian clock gene, period 2. Sci. Rep. 8:8754.
Chen, H., Li, C., Liu, T., Chen, S., and Xiao, H. (2019). A metagenomic study of intestinal microbial diversity in relation to feeding habits of surface and cave-dwelling Sinocyclocheilus species. Microb. Ecol. 79, 299–311. doi: 10.1007/s00248-019-01409-4
Chen, X.-Y., Gu, X.-T., Saiyin, H., Wan, B., Zhang, Y.-J., Li, J., et al. (2012). Brain-selective kinase 2 (BRSK2) phosphorylation on PCTAIRE1 negatively regulates glucose-stimulated insulin secretion in pancreatic β-cells. J. Biol. Chem. 287, 30368–30375. doi: 10.1074/jbc.m112.375618
Cideciyan, A. V., Aleman, T. S., Jacobson, S. G., Khanna, H., Sumaroka, A., Aguirre, G. K., et al. (2007). Centrosomal-ciliary gene CEP290/NPHP6 mutations result in blindness with unexpected sparing of photoreceptors and visual brain: implications for therapy of leber congenital amaurosis. Hum. Mutat. 28, 1074–1083. doi: 10.1002/humu.20565
Conesa, A., Gotz, S., Garcia-Gomez, J. M., Terol, J., Talon, M., and Robles, M. (2005). Blast2GO: a universal tool for annotation, visualization and analysis in functional genomics research. Bioinformatics 21, 3674–3676. doi: 10.1093/bioinformatics/bti610
Croset, V., Treiber, C. D., and Waddell, S. (2018). Cellular diversity in the Drosophila midbrain revealed by single-cell transcriptomics. eLife 7:e34550. doi: 10.7554/eLife.34550
Dewey, C. N., and Li, B. (2011). RSEM: accurate transcript quantification from RNA-Seq data with or without a reference genome. BMC Bioinformatics 12:323. doi: 10.1186/1471-2105-12-323
Drew, R. E., Settles, M. L., Churchill, E. J., Williams, S. M., Balli, S., and Robison, B. D. (2012). Brain transcriptome variation among behaviorally distinct strains of zebrafish (Danio rerio). BMC Genomics 13:323. doi: 10.1186/1471-2164-13-323
Elipot, Y., Hinaux, H., Callebert, J., Launay, J.-M., Blin, M., and Rétaux, S. (2014). A mutation in the enzyme monoamine oxidase explains part of the Astyanax cavefish behavioural syndrome. Nat. Commun. 5:3647. doi: 10.1038/ncomms4647
Elipot, Y., Hinaux, H., Callebert, J., and Rétaux, S. (2013). Evolutionary shift from fighting to foraging in blind cavefish through changes in the serotonin network. Curr. Biol. 23, 1–10. doi: 10.1016/j.cub.2012.10.044
Greenwald, S. H., Charette, J. R., Staniszewska, M., Lan, Y. S., and Pierce, E. A. (2016). Mouse models of NMNAT1-leber congenital amaurosis (LCA9) recapitulate key features of the human disease. Am. J. Pathol. 186, 1925–1938. doi: 10.1016/j.ajpath.2016.03.013
Gross, J. B., and Wilkens, H. (2013). Albinism in phylogenetically and geographically distinct populations of Astyanax cavefish arises through the same loss-of-function Oca2 allele. Heredity 111, 122–130. doi: 10.1038/hdy.2013.26
Guo, S. (2003). Linking genes to brain, behavior and neurological diseases: what can we learn from zebrafish? Genes Brain Behav. 3, 63–74. doi: 10.1046/j.1601-183x.2003.00053.x
Hülskamp, G., Guzman, C., Rehder, H., Zenker, M., Mayerle, J., Lerch, M. M., et al. (2005). Deficiency of UBR1, a ubiquitin ligase of the N-end rule pathway, causes pancreatic dysfunction, malformations and mental retardation (Johanson-Blizzard syndrome). Nat. Genet. 37, 1345–1350. doi: 10.1038/ng1681
Hyacinthe, C., Attia, J., and Rétaux, S. (2019). Evolution of acoustic communication in blind cavefish. Nat. Commun. 10:4231.
Kataoka, K., and Kamber, R. A. (2004). Differentially expressed Maf family transcription factors, c-Maf and MafA, activate glucagon and insulin gene expression in pancreatic islet alpha- and beta-cells. J. Mol. Endocrinol. 32, 9–20. doi: 10.1677/jme.0.0320009
Khatri, D., Zizioli, D., Tiso, N., Facchinello, N., Vezzoli, S., Gianoncelli, A., et al. (2016). Down-regulation of coasy, the gene associated with NBIA-VI, reduces Bmp signaling, perturbs dorso-ventral patterning and alters neuronal development in zebrafish. Sci. Rep. 6:37660. doi: 10.1038/srep37660
Kleefstra, T., Franken, C., Arens, Y., Ramakers, G., Yntema, H., Sistermans, E., et al. (2004). Genotype-phenotype studies in three families with mutations in the polyglutamine-binding protein 1 gene (PQBP1). Clin. Genet. 66, 318–326. doi: 10.1111/j.1399-0004.2004.00308.x
Li, W., and Tao, J. (2002). Local dissection of body of the fishes Sinocyclocheilus rhinocerous. J. Yunnan Agric. Univ. 17, 208–209.
Lunghi, E., Zhao, Y., Sun, X., and Zhao, Y. (2019). Morphometrics of eight Chinese cavefish species. Sci. Data 6:233.
Maeder, M. L., Stefanidakis, M., Wilson, C. J., Baral, R., Barrera, L. A., Bounoutas, G. S., et al. (2019). Development of a gene-editing approach to restore vision loss in Leber congenital amaurosis type 10. Nat. Med. 25, 229–233.
Martínez-Garay, I., Tomás, M., Oltra, S., Ramser, J., Moltó, M. D., Prieto, F., et al. (2007). A two base pair deletion in the PQBP1 gene is associated with microphthalmia, microcephaly, and mental retardation. Eur. J. Hum. Genet. 15, 29–34. doi: 10.1038/sj.ejhg.5201717
Matsuoka, T. A., Artner, I., Henderson, E., Means, A., Sander, M., and Stein, R. (2004). The MafA transcription factor appears to be responsible for tissue-specific expression of insulin. Proc. Natl. Acad. Sci. U.S.A. 101, 2930–2933. doi: 10.1073/pnas.0306233101
Meng, F., Braasch, I., Phillips, J., Lin, X., Titus, T., Zhang, C., et al. (2013). Evolution of the eye transcriptome under constant darkness in Sinocyclocheilus cavefish. Mol. Biol. Evol. 30, 1527–1543. doi: 10.1093/molbev/mst079
Minoru, K., and Susumu, G. (2000). KEGG: Kyoto encyclopedia of genes and genomes. Nucleic Acids Res. 27, 29–34.
Nemazanyy, I., Panasyuk, G., Breus, O., Zhyvoloup, A., Filonenko, V., and Gout, I. T. (2006). Identification of a novel CoA synthase isoform, which is primarily expressed in the brain. Biochem. Biophys. Res. Commun. 341, 995–1000. doi: 10.1016/j.bbrc.2006.01.051
Nishimura, W., Kondo, T., Salameh, T., Khattabi, I. E., Dodge, R., Bonner-Weir, S., et al. (2006). A switch from MafB to MafA expression accompanies differentiation to pancreatic β-cells. Dev. Biol. 293, 526–539. doi: 10.1016/j.ydbio.2006.02.028
Nishimura, W., Rowan, S., Salameh, T., Maas, R. L., Bonner-Weir, S., Sell, S. M., et al. (2008). Preferential reduction of β cells derived from Pax6–MafB pathway in MafB deficient mice. Dev. Biol. 314, 443–456. doi: 10.1016/j.ydbio.2007.12.009
Riddle, M. R., Aspiras, A. C., Gaudenz, K., Peuß, R., Sung, J. Y., Martineau, B., et al. (2018). Insulin resistance in cavefish as an adaptation to a nutrient-limited environment. Nature 555, 647–651. doi: 10.1038/nature26136
Rosenfeld, C. S., Hekman, J. P., Johnson, J. L., Lyu, Z., Ortega, M. T., Joshi, T., et al. (2019). Hypothalamic transcriptome of tame and aggressive silver foxes (Vulpes vulpes) identifies gene expression differences shared across brain regions. Genes Brain Behav. 19:e12614. doi: 10.1111/gbb.12614
Siemiatkowska, A. M., Born, L. I. V. D., Genderen, M. M. V., Bertelsen, M., and Cremers, F. P. M. (2014). Novel compound heterozygous NMNAT1 variants associated with Leber congenital amaurosis. Mol. Vis. 20, 753–759.
Somerville, V., Schwaiger, M., Hirsch, P., Walser, J.-C., Bussmann, K., Weyrich, A., et al. (2019). DNA methylation patterns in the round goby hypothalamus support an on-the-spot decision scenario for territorial behavior. Genes 10:219. doi: 10.3390/genes10030219
van Dijk, T., Ferdinandusse, S., Ruiter, J. P. N., Alders, M., Mathijssen, I. B., Parboosingh, J. S., et al. (2018). Biallelic loss of function variants in COASY cause prenatal onset pontocerebellar hypoplasia, microcephaly, and arthrogryposis. Eur. J. Hum. Genet. 26, 1752–1758. doi: 10.1038/s41431-018-0233-0
Varatharasan, N., Croll, R. P., and Franz-Odendaal, T. (2009). Taste bud development and patterning in sighted and blind morphs of Astyanax mexicanus. Dev. Dyn. 238, 3056–3064. doi: 10.1002/dvdy.22144
Li, W., Wu, D., Chen, A., and Tao, J. (1997). Histological study on the horn-like projection of the head of Sinocyclocheilus rhinocerous. J. Yunnan Univ. 19, 426–428.
Yang, J., Chen, X., Bai, J., Fang, D., Qiu, Y., Jiang, W., et al. (2016). The Sinocyclocheilus cavefish genome provides insights into cave adaptation. BMC Biol. 14:1. doi: 10.1186/s12915-015-0223-4
Yang, S.-S., Ishida, T., Fujita, K., Nakai, Y., Ono, T., and Okazawa, H. (2020). PQBP1, an intellectual disability causative gene, affects bone development and growth. Biochem. Biophys. Res. Commun. 523, 894–899. doi: 10.1016/j.bbrc.2019.12.097
Yoshizawa, M., Yamamoto, Y., O’Quin, K. E., and Jeffery, W. R. (2012). Evolution of an adaptive behavior and its sensory receptors promotes eye regression in blind cavefish. BMC Biol. 10:108. doi: 10.1186/1741-7007-10-108
Zagmajster, M., Culver, D. C., Christman, M. C., and Sket, B. (2010). Evaluating the sampling bias in pattern of subterranean species richness: combining approaches. Biodivers. Conserv. 19, 3035–3048. doi: 10.1007/s10531-010-9873-2
Zhai, R. G., Cao, Y., Hiesinger, P. R., Zhou, Y., Mehta, S. Q., Schulze, K. L., et al. (2006). Drosophila NMNAT maintains neural integrity independent of its NAD synthesis activity. PLoS Biol. 4:e416. doi: 10.1371/journal.pbio.0040416
Keywords: cavefish, Sinocyclocheilus, comparative transcriptomics, troglomorphic trait, brain
Citation: Zhao Y, Chen H, Li C, Chen S and Xiao H (2020) Comparative Transcriptomics Reveals the Molecular Genetic Basis of Cave Adaptability in Sinocyclocheilus Fish Species. Front. Ecol. Evol. 8:589039. doi: 10.3389/fevo.2020.589039
Received: 30 July 2020; Accepted: 23 September 2020;
Published: 16 October 2020.
Edited by:
Sanyuan Ma, Southwest University, ChinaReviewed by:
Chao Bian, Beijing Genomics Institute (BGI), ChinaQiong Shi, Beijing Genomics Institute (BGI), China
Copyright © 2020 Zhao, Chen, Li, Chen and Xiao. This is an open-access article distributed under the terms of the Creative Commons Attribution License (CC BY). The use, distribution or reproduction in other forums is permitted, provided the original author(s) and the copyright owner(s) are credited and that the original publication in this journal is cited, in accordance with accepted academic practice. No use, distribution or reproduction is permitted which does not comply with these terms.
*Correspondence: Shanyuan Chen, Y2hlbnN5QHludS5lZHUuY24=; Heng Xiao, eGlhb2hlbmdAeW51LmVkdS5jbg==
†These authors have contributed equally to this work
‡ORCID: Hongyu Chen, orcid.org/0000-0001-9879-274; Shanyuan Chen, orcid.org/0000-0002-9524-9428