 Frank S. Gilliam
- Department of Biology, University of West Florida, Pensacola, FL, United States
Tropical storms and hurricanes (collectively hereafter, tropical cyclones) are among the most destructive forces in nature. These threats are of particular concern to human populations and ecosystems of coastal areas of the southeastern United States, most especially in the State of Florida. This review begins with an overview of the effects of tropical cyclones on Florida’s most conspicuous terrestrial ecosystem—longleaf pine. Environmental factors leading to tropical cyclogenesis will also be reviewed, with a specific focus on (1) landfall history in Florida, and (2) the potential relationship between climate change and the frequency/intensity of tropical cyclones in the North Atlantic Ocean. Given its geographical distribution, it is not surprising that longleaf pine has long been impacted by tropical cyclones of the North Atlantic. Tropical cyclones are formed from a complex combination of meteorological conditions, driven initially by the release of excess heat from the surface waters of the ocean, along with an unstable atmosphere comprising air temperatures decreasing and wind speeds increasing with altitude. Among the coastal counties from Texas to Maine, those of Florida have experienced by far the highest frequency of tropical cyclones, especially the southern tip of peninsular Florida, with its most populous county (Miami-Dade) receiving 25 hits from 1900 to 2010, second only to Monroe County (32 hits) during that period. Frequencies of all categories of cyclones have increased significantly from 1850 to the present. Cyclone frequencies were significantly correlated with increases in air and ocean temperatures, both of which have increased over the past, suggesting a causal relationship with anthropogenic climate change. Of future concern is how increases in frequencies and intensities of tropical cyclones will negatively affect the structure and function of these ecologically and economically important longleaf pine ecosystems.
Introduction
Tropical storms and hurricanes (also called typhoons, but collectively hereafter, tropical cyclones) comprise among the most formidable, destructive forces in nature. As dramatic an event as was the 1980 eruption of Mt. St. Helens (Washington State, United States), its total energy yield was 1,000-fold lower than a typical single tropical cyclone. To wit, the initial pyroclastic blast of Mt. St. Helens was 2.9316 J of energy (United States Geological Survey [USGS], 2005), whereas the average tropical cyclone is >1.1019 J of energy. Even the energy associated with the mean annual seismic activity (nearly 1.1018 J) falls short of that by over an order of magnitude (Emanuel, 1999; Leeder and Perez-Arlucea, 2006). The destructive forces of tropical cyclones are manifold, including high winds, excessive rain, and storm surge, with the latter two often combining to create extensive, deep flooding. All of these comprise serious threats to human life and built structures, and are unsurprisingly of particular concern to coastal areas, including the southeastern United States. They also represent an existential threat to the flora and fauna of impacted areas of this region (DuBois et al., 2020; Gang et al., 2020).
The State of Florida is second only to Alaska in absolute distance of marine shoreline, but it has a far higher ratio of shoreline to surface area than Alaska, making it all the more susceptible to damage from tropical cyclones. Florida also has the second lowest mean elevation among states (30.5 m), with a high relative surface area <5 m in elevation, enhancing the threat of cyclone-generated flooding. Finally, the rate of human population growth in Florida—the third most populous state in the United States, behind California and Texas—is highest among the 10 most populated states. All these factors combine to make Florida particularly vulnerable to tropical cyclone-mediated impacts. Although such vulnerability is understandingly primarily focused on impacts on human populations, considerable damage occurs to Florida’s terrestrial ecosystems, especially those dominated by longleaf pine (Gang et al., 2020; Zampieri et al., 2020).
Longleaf pine is a major forest type in Florida, and its distribution covers most of the state (Figure 1). Despite the naturally low biodiversity of the overstory, wherein longleaf pine is typically the sole species, longleaf ecosystems exhibit an extremely high level of plant diversity in the ground cover (Gilliam et al., 2006). Once covering approximately 37 million ha in its original range throughout the southeastern United States, it currently occupies <3% of this extent (Gilliam and Platt, 2006). Thus, threats to extant longleaf stands represent a loss of biodiversity. Among the more expansive tracts of old-growth longleaf pine is in Florida, particularly under the protection of the federal government on United States Air Force bases (AFBs), such as Eglin AFB and Tyndall AFB (Hiers et al., 2007; Kirkman and Jack, 2018). Currently, extensive efforts are underway to restore degraded longleaf stand in Florida (Hogland et al., 2020).
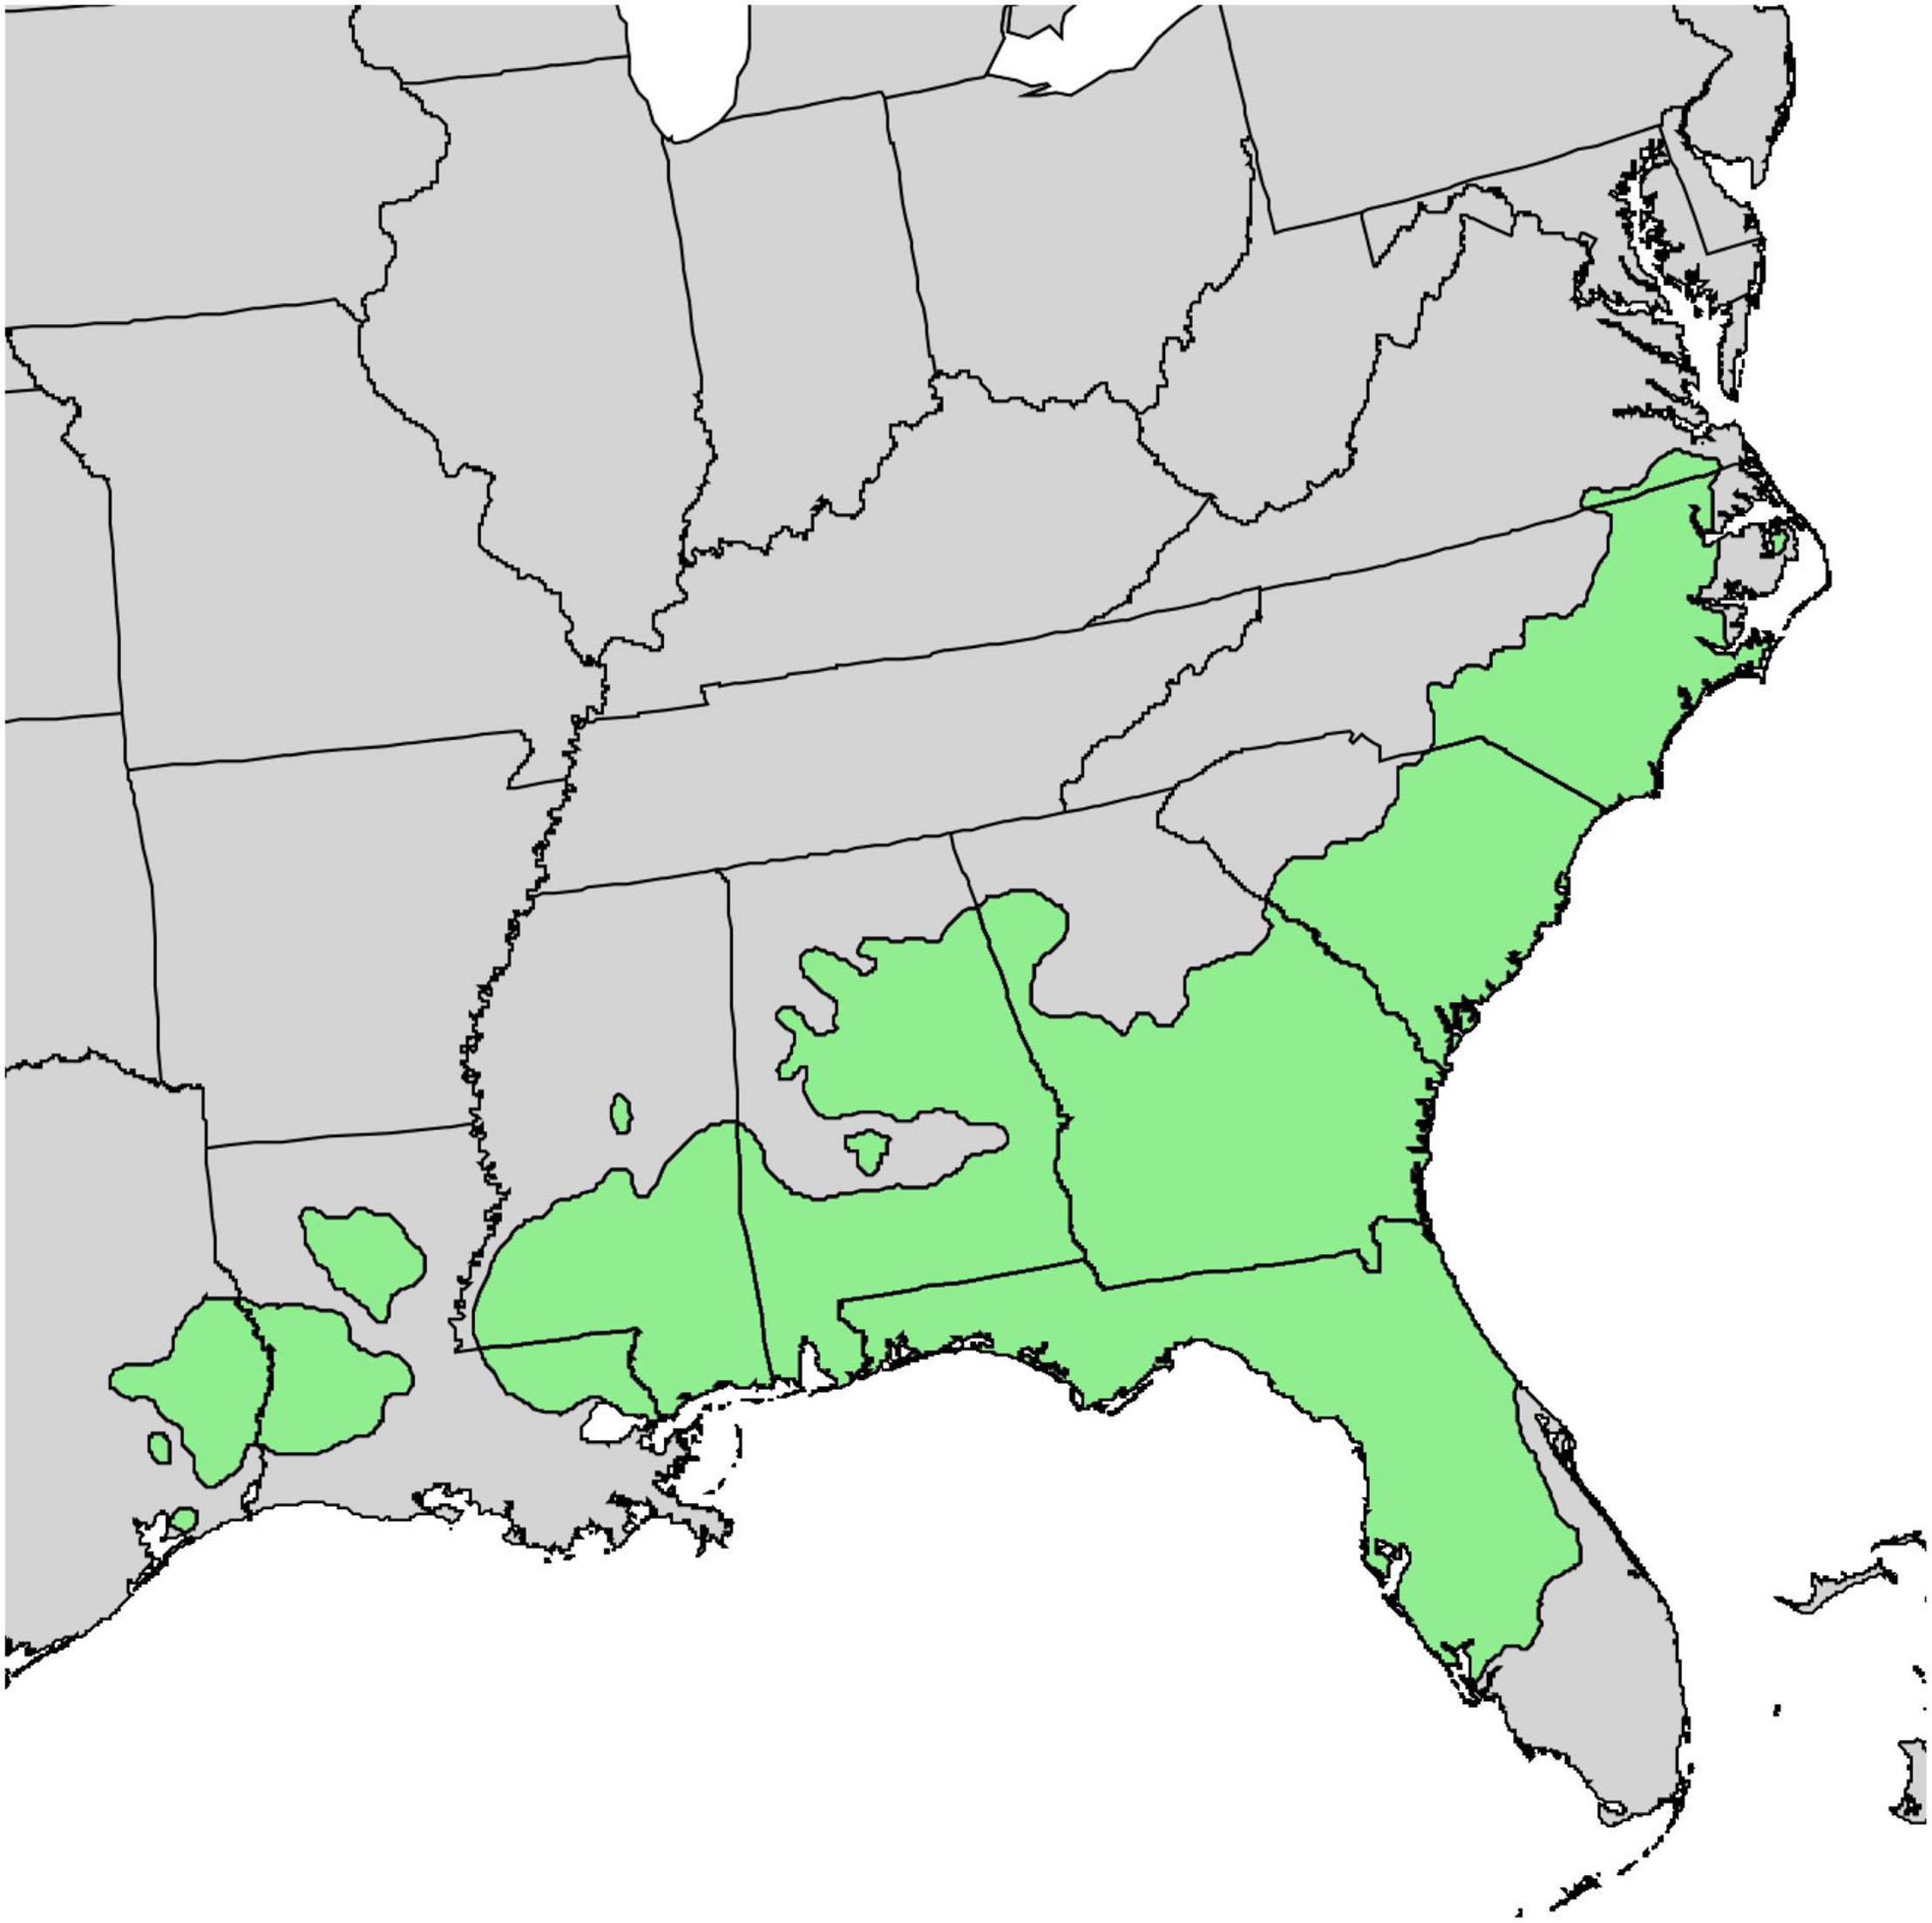
Figure 1. Geographic range of longleaf pine (www.plants.usda.gov).
As will be described later, the main source of energy needed to create and sustain tropical cyclones is heat absorbed by and released from surface ocean water. Because of this, it is possible that the current trend of increasing air and ocean temperatures (Figure 2) related to anthropogenic climate change may be having an impact on the frequency of tropical cyclones. On the other hand, as of the new millennium, this has been a topic of some debate amongst climatologists.
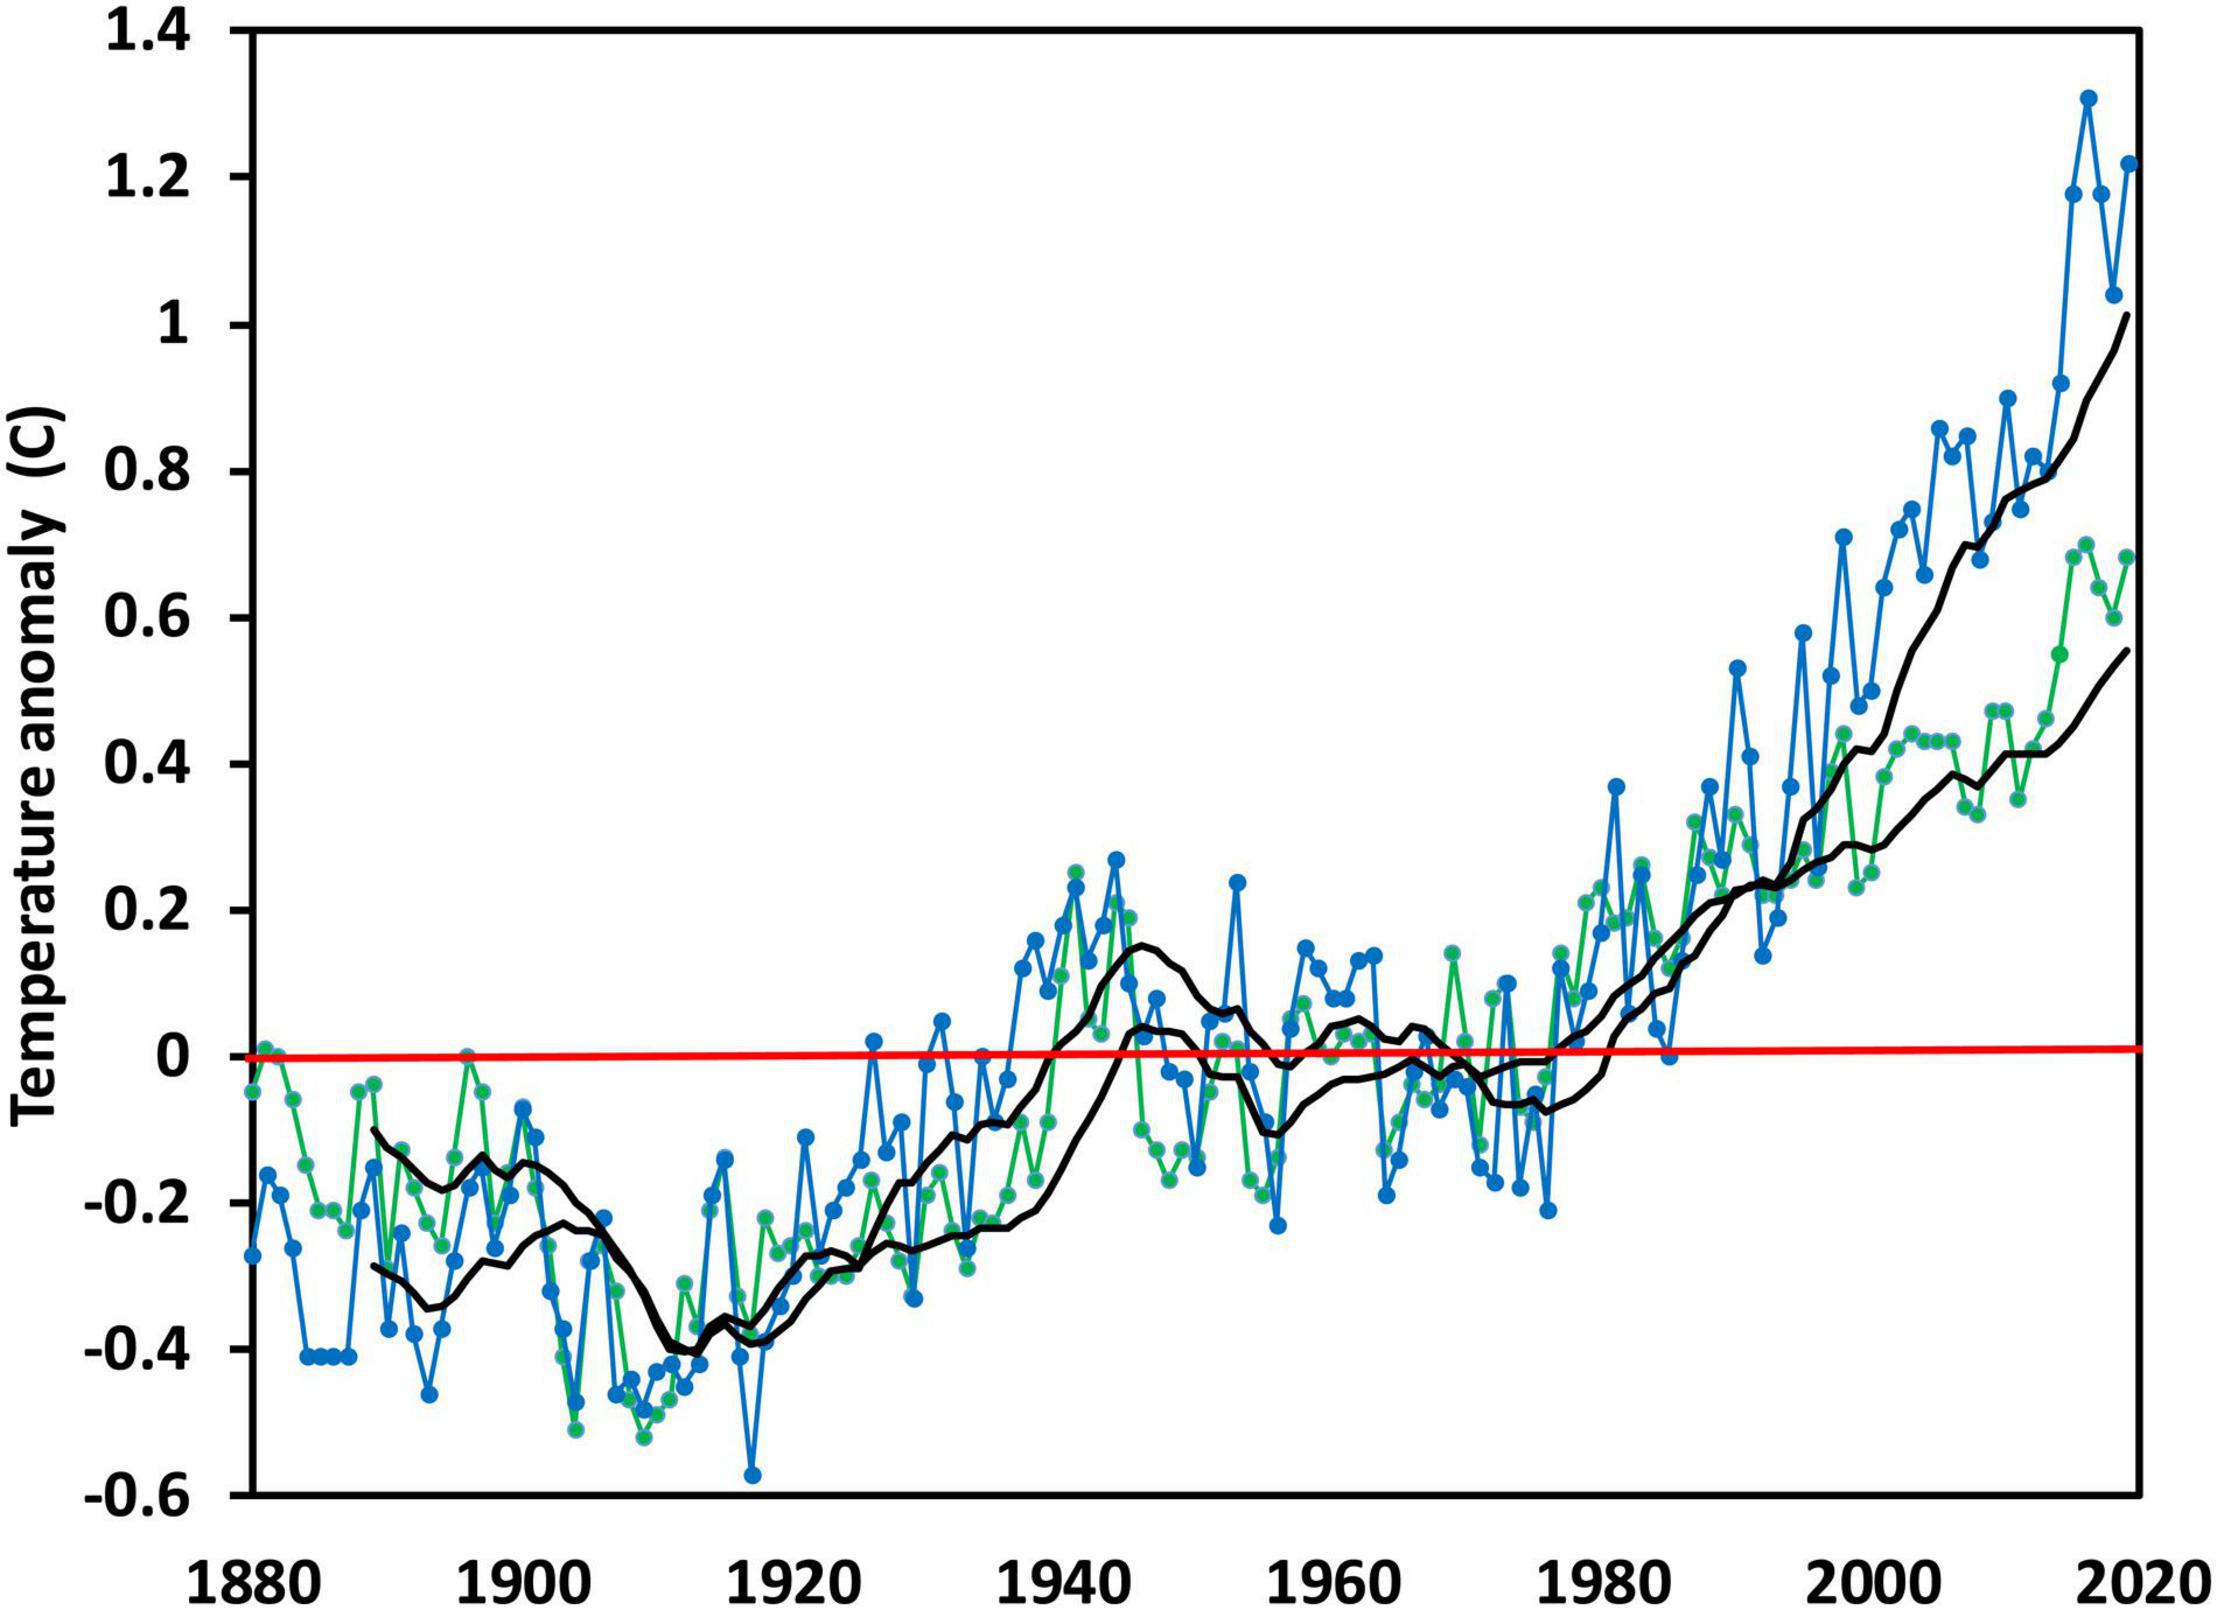
Figure 2. Annual temperature anomalies for Northern Hemisphere (blue line/symbols) and ocean (green line/symbols), 1880–present. Black lines are 25-year running means. Data taken from the National Centers for Environmental Information (https://www.ncdc.noaa.gov/).
For example, Emanuel (2005c) created an index of potential destructiveness of tropical cyclones that he based on the total dissipation of energy and integrated over the duration of a cyclone event. He reported temporal patterns of increases in the destructiveness index of cyclones over a 30-year period, from 1975 to 2005, concluding that this was driven significantly by increases in sea surface temperatures (SSTs). He further noted that increased dissipation of energy over this period was likely to have been from either more intense cyclones, longer duration of peak intensities, or both (Emanuel, 2005c).
These conclusions were challenged by Pielke (2005), who based his metrics on storm-mediated loss/damage; he found that these did not vary significantly over a similar time period. Landsea (2005) also questioned the findings of Emanuel (2005c) by downplaying the impact of increasing SSTs in enhancing the intensity of tropical cyclones. Emanuel (2005b) defended his original conclusions, citing theory, and modeling predicting that, for an increase of 2°C in tropical SST, there would be increased wind speeds by 10% and power dissipation by 40–50% (Knutson and Tuleya, 2004).
More recent studies (e.g., Mann and Emanuel, 2006; Shepherd and Knutson, 2007; Zhao and Held, 2010; Hosseini et al., 2018) have taken various approaches, many quite sophisticated, to address this important question of whether there is a link between global warming and tropical cyclones. This article, which is particularly focused toward a student and/or non-atmospheric scientist readership, will take a more heuristic approach by utilizing readily accessible data and simpler statistics.
The objectives of this review are multi-faceted: (1) characterize the recent effects of tropical cyclones on longleaf pine ecosystems of Florida by synthesizing current literature, (2) outline the general mechanisms of tropical cyclogenesis, (3) describe the tropical cyclone scenario for Florida, including frequencies of occurrence for coastal counties and general summaries of tropical cyclones in the past 30 years, and (4) examine historical data for tropical cyclone frequencies in the North Atlantic Ocean, particularly as related to air and ocean temperatures, to assess potential relationships between cyclone frequency and climate change.
Tropical Cyclones: Effects on Longleaf Pine in Florida
Longleaf pine clearly represents one of the better examples of a disturbance-maintained ecosystem (Platt et al., 1988; Frost, 1993), with one disturbance—fire—having long been known as essential in maintaining the structure and function of these ecosystems (Chapman, 1932; Heyward, 1939), a role noted even by 18th century naturalist William Bartram (Bartram, 1791). Among its numerous effects, fire simultaneously exposes mineral soil required for successful germination of copious seed production and eliminates potentially competing vegetation, thus allowing for establishment and early growth of seedlings. Under typical fire frequencies, longleaf stands are thus maintained in an open savanna-like physiognomy (Platt, 1997). Under chronic fire exclusion, however, hardwood species, especially southern oak species, establish in the open matrix of the savanna and greatly inhibit, or even essentially eliminate, longleaf reproduction (Gilliam and Platt, 1999).
More recently, the role of tropical cyclones in shaping longleaf pine ecosystems has been increasingly understood (Provencher et al., 2001), with cyclonic events in the southeastern United States during the past 25 years having stimulated research on direct effects on longleaf stands (Stone and Finkl, 1995; Batista and Platt, 2003). Gilliam et al. (2006) proposed a phenomenological model for longleaf pine savanna comprising two natural disturbances: fire and tropical cyclones. This model considers that these two disturbances exert contrasting effects on stand physiognomy. Fires are more frequent and less intense, whereas tropical cyclones are periodic and often of extreme intensity. Fire exerts direct effects on juvenile stages of longleaf regeneration and indirect effects on ground cover via consumption of fine fuel and selective mortality among plant species that are potential competitors of longleaf juveniles. Tropical cyclones influence the overstory directly via wind-caused damage and mortality, indirectly influencing ground cover by changing the spatial distribution of shading and litter accumulation. Such differences in effects of disturbances can result in widely different physiognomies for longleaf stands. In the absence of disturbance, especially fire, vegetation structure changes dramatically with the increased establishment of hardwood shrubs and tree species (Gilliam et al., 2006).
This model suggests that tropical cyclones comprise an integral component of longleaf pine ecosystems. As will be discussed later in this review, however, some global climate change scenarios have suggested increases in both frequency and intensity of future events, thus greatly affecting pine stands, and ultimately entire pine savanna ecosystems. To address this on a synoptic scale, Gang et al. (2020) used satellite observations to assess forest resilience to 12 hurricanes making landfall in the northern Gulf of Mexico from 2001 to 2015, most of which had direct impacts on Florida. These included two that were Category 1 (Saffir-Simpson Scale—Landsea et al., 1999), three that were Category 2, six that were Category 3, and one that was Category 4. Thus, over half of the storms during this period were major hurricanes (Category 3 or higher). Using standard vegetation indices, they concluded that structural recovery of vegetation impacted by a single major hurricane could take decades to return to pre-hurricane conditions.
By accessing extensive pre-storm data, Zampieri et al. (2020) provided clear, empirical data on the immediate effects of Hurricane Michael in 2018—the first Category 5 hurricane to make landfall this millennium and the third most intense North Atlantic hurricane ever, with maximum sustained winds of ∼257 km/h and a minimum barometric pressure of 919 mb (Figure 3A). One of their principle areas of focus was on the longleaf pine ecosystem as a global biodiversity hotspot (Blaustein, 2008; Noss et al., 2015). By directly comparing pre- versus post-storm data at four sites within the impacted area, they concluded that such high intensity storms reduced the extent of mature longleaf habitat (Figure 3B), a reduction that threatens both the innately high biodiversity of these hotspots, as well as the existence of endangered species endemic to the habitat (Zampieri et al., 2020). In another study of the effects of Hurricane Michael on longleaf stands, Rutledge et al. (2021) used observations of >3,000 stems of different species—primarily longleaf but also other pines and oaks species—to confirm that longleaf was in the lower range of treefall probability, but that this pattern varied greatly with soil type. They concluded that tropical cyclones can greatly alter landscape-scale structure and composition of impacted stands. This response also interacts with storm-mediated changes in fire regimes in longleaf pine ecosystems (Rutledge et al., 2021).
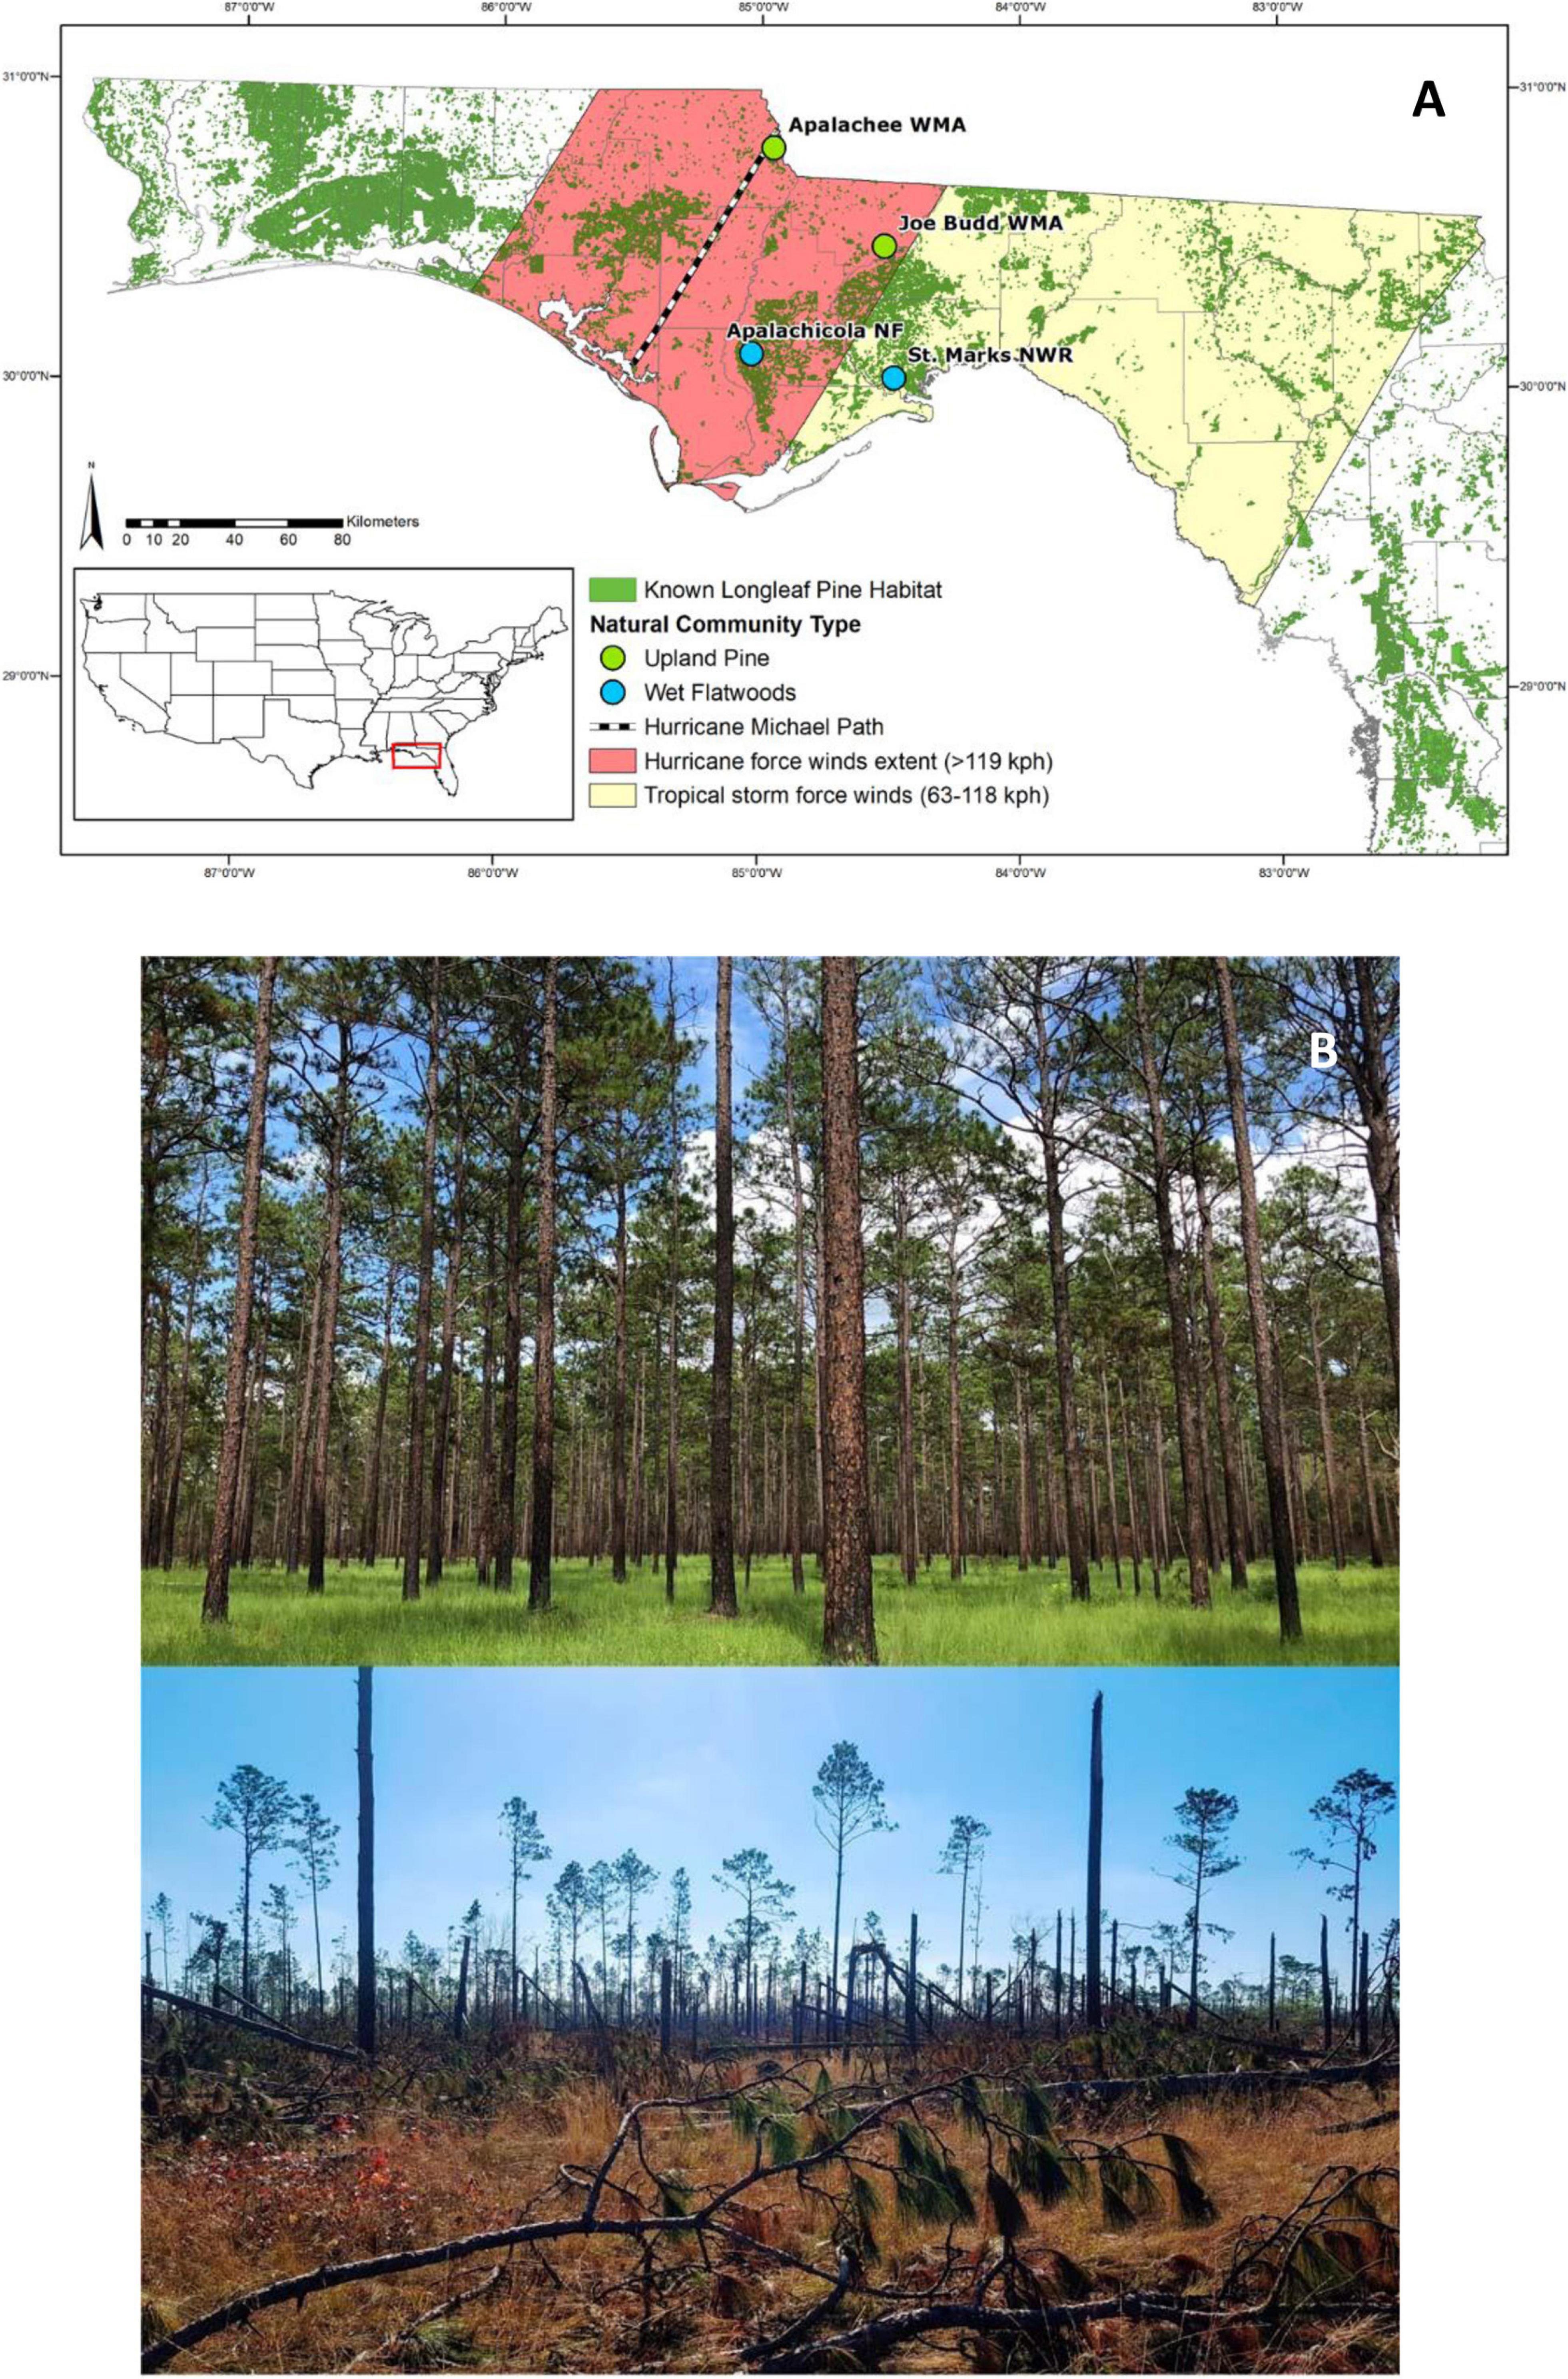
Figure 3. (A) Map showing trajectory of Hurricane Michael, which made landfall on October 10, 2018 as a Category 5 hurricane. Shown also are the affected areas and study sites from Zampieri et al. (2020); used with permission. (B) Pre- and post-storm longleaf pine savanna, Apalachee Wildlife Management Area, Florida (Zampieri et al., 2020); used with permission.
Clearly, these are neither the types of storms, nor the responses, envisaged in the phenomenological model of Gilliam et al. (2006). As will be discussed later, the frequency and intensity of tropical cyclones impacting longleaf pine ecosystems is far higher in the current millennium than what was used to conceptually develop the model. Thus, the question for the future of longleaf pine ecosystems in Florida, and throughout its range (Figure 1), is what existential threat is posed by tropical cyclones that may increase in frequency and intensity with climate warming? To address this, it is first imperative to understand the process of tropical cyclogenesis, along with implications for the state of Florida and relationships with temporal patterns of surface and ocean temperatures.
Tropical Cyclogenesis
Especially because of increasingly sophisticated meteorological instruments, the factors that interact to lead to formation of tropical cyclones are generally well understood, if not relatively complex (Emanuel, 2005a). Several variables and factors comprise this list, without any of which tropical cyclones will fail to form. Below are six, as originally articulated by Zehr (1992), with brief further discussion:
High Sea Surface Temperature
Graham and Barnett (1987) estimated that surface sea temperature (SST) should be at least 27.5°C at the surface and remain warm to a depth of ∼50 m to initiate tropical cyclogenesis. This is because the rapid loss of heat from warm surface ocean waters provides the initial energy to drive the heat engines of tropical cyclones. Higher SSTs indicate a higher heat content of surface ocean water and, thus, result in release of more heat energy.
High Relative Humidity in the Mid-Troposphere
Because dry air has lower energy than humid air, dry air up to 5 km in altitude can absorb the energy dissipated in the early stages of cyclogenesis. Conversely for humid air, condensation of water vapor into cloud droplets and rain releases a considerable amount of energy to the developing system, something which does not occur with dry air. In addition, condensation of water vapor associated with air of high relative humidity releases considerable energy as latent heat, further driving heat engines of tropical cyclones (Rosenberg et al., 1983).
Large Surface-to-500 mb Lapse Rates of Equivalent Potential Temperature
Lapse rates quantify the rate of change (in this case, decrease) of temperature between pressure levels or fixed layers above the surface (Rosenberg et al., 1983). Lapse rates between 6 and 9.6 C/km are considered “conditionally unstable.” It is this range that is required for the deep convection contributing to tropical cyclone formation.
Small Tropospheric Vertical Wind Shear
Wind shear is the change of wind speed and direction over relatively short distances in the atmosphere, with vertical wind shear referring to such variation with change in altitude. A small degree of vertical wind shear between the surface and the upper troposphere enhances thunderstorm formation, providing more energy for tropical cyclones. The requisite convection for thunderstorms is disturbed and weakened by excessive vertical wind shear (Wong and Chan, 2004).
High Low-Level Relative Vorticity
Vorticity describes the tendency for fluids (in this case, air) to rotate. Thus, relative vorticity describes the vorticity of air relative to the Earth induced by the velocity field. Earth vorticity is zero at the Equator and maximal at the poles (Bierly, 2005). Vorticity is considered positive when air moves in a counterclockwise direction, seen as looking down to the surface of the earth. In the Northern Hemisphere, positive vorticity is called cyclonic rotation (and is associated with low-pressure systems), whereas negative vorticity is anticyclonic rotation (and is associated with high-pressure systems). In the Southern Hemisphere, an opposite nomenclature applies (e.g., negative vorticity and clockwise rotation is cyclonic). The high low-level relative vorticity required for formation of tropical cyclones initially arises from heat energy rising from surface waters of the ocean, creating low pressure which causes inward movement of air. When this movement interacts with the Coriolis force (see below), a vortex forms.
Sufficiently High Coriolis Force
The Coriolis force (also called the Coriolis effect, named after Gaspard-Gustave de Coriolis, who initially described it in 1835 as a theory for water wheels) is an inertial force that deflects movement of fluids (i.e., air and water) toward right angles to the right in the Northern Hemisphere and right angles to the left in the Southern Hemisphere. Varying proportionally with latitude, the force is greatest at the poles and zero at the equator; it only reaches enough strength to create the spin required for tropical cyclone formation 480 km from the equator. As this spin is typically required for cyclones to organize, tropical cyclones closer to the equator than 480 km are extremely rare (Figure 4). Finally, the Coriolis force is what causes tropical cyclones (and all low-pressure systems) to rotate counter-clockwise in the Northern Hemisphere, and clockwise in the Southern Hemisphere, as described previously for vorticity.
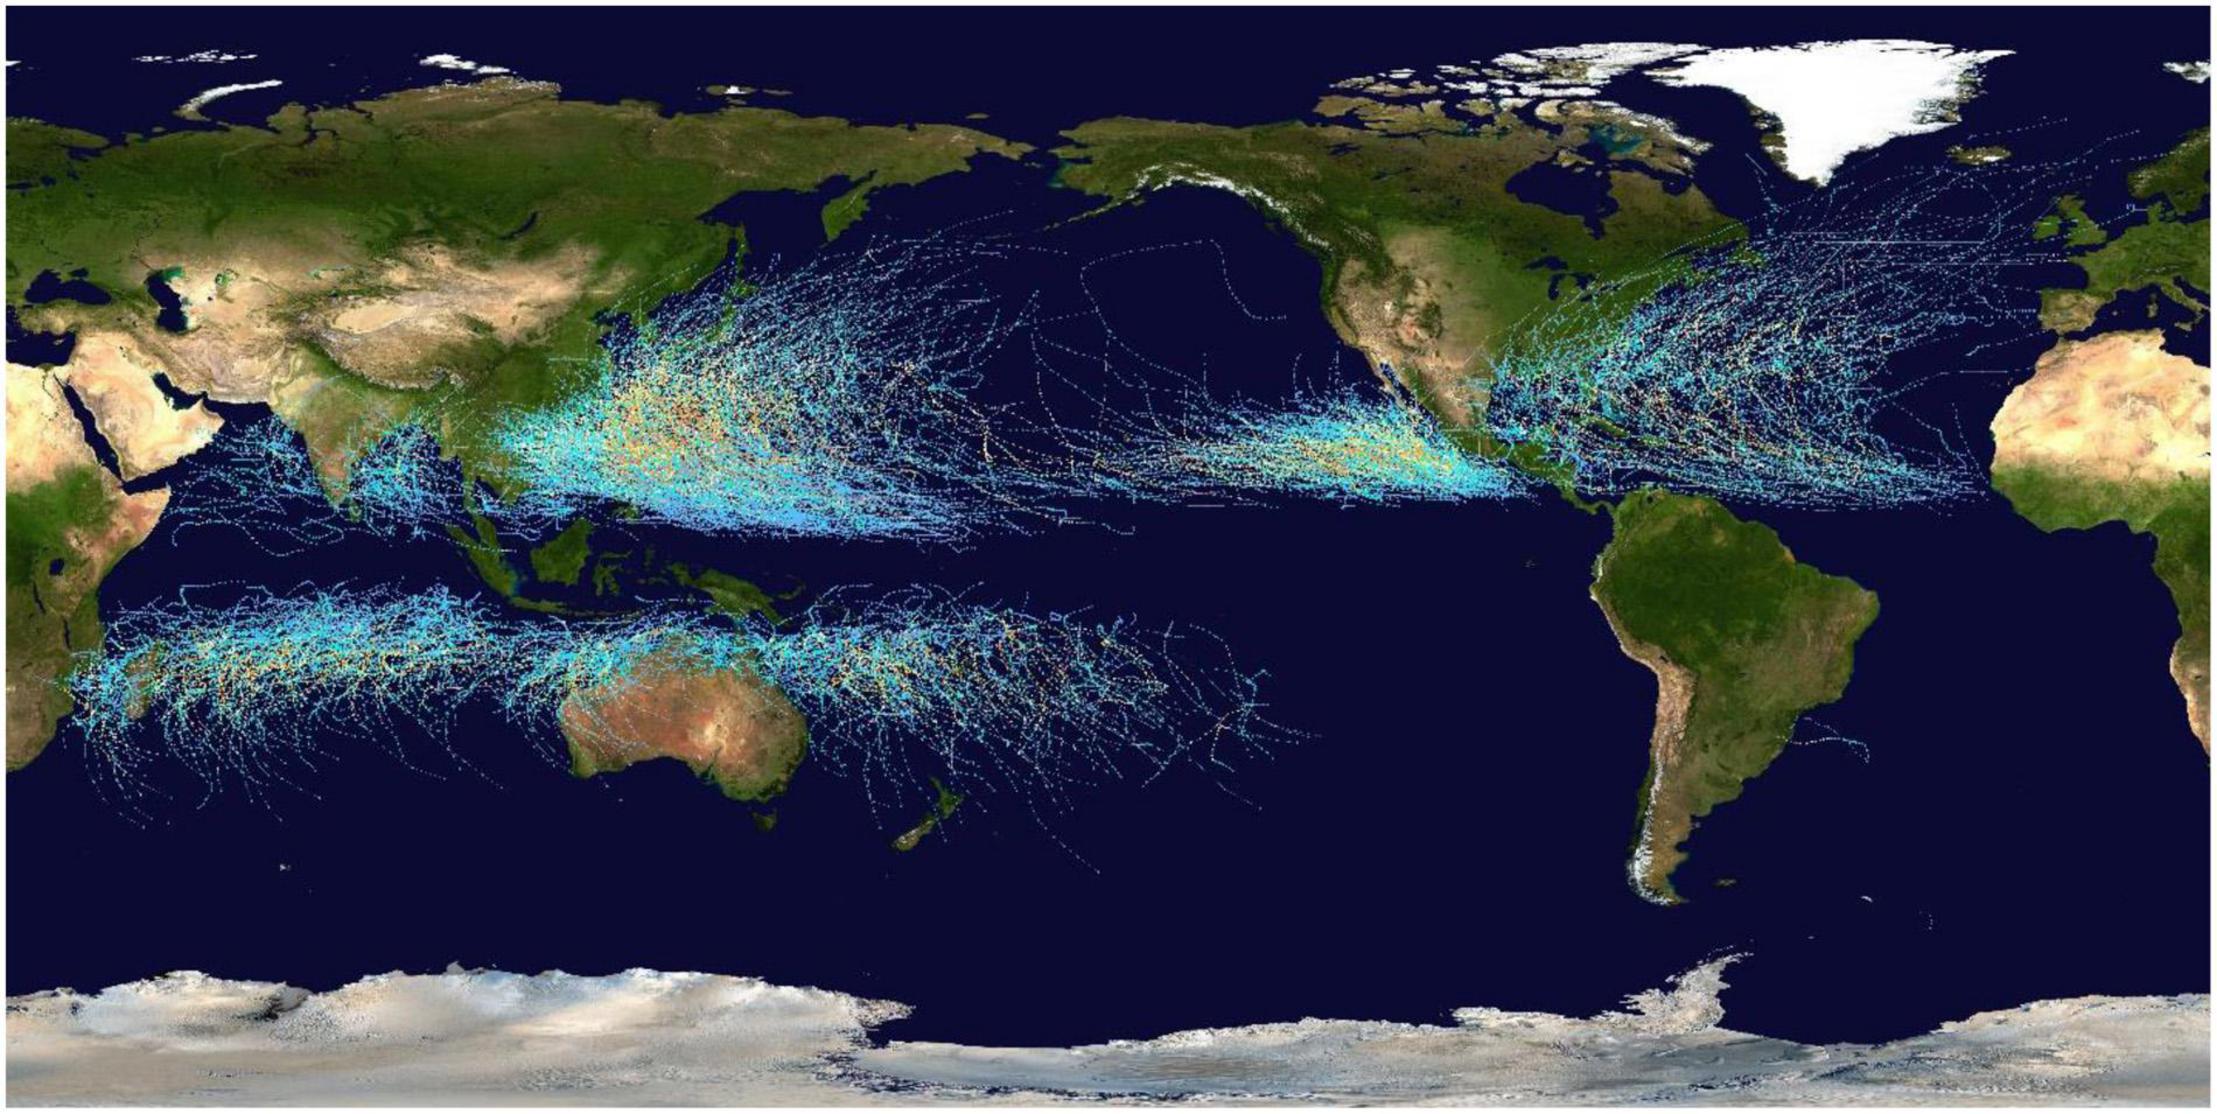
Figure 4. Tracks for global tropical cyclones, 1985–2005. Data for the North Atlantic and East Pacific are from the National Hurricane Center. Tracking data for storms in the Indian Ocean, the Northwest Pacific, and the South Pacific are from the Joint Typhoon Warning Center. Tracking data for Cyclone Catarina in the South Atlantic was published in Gary Padgett’s April 2004 Monthly Tropical Cyclone Summary and was originally produced by Roger Edson, University of Guam. Public domain.
Not all of these factors are equal in their contribution toward cyclone formation. Some variables comprise numerical values unlikely applicable for determining cyclogenesis for individual events. For example, SSTs and Coriolis forces vary at spatial-temporal scales that preclude diurnal fluctuations for a given potential cyclone. By contrast, other variables, especially vertical wind shear, can vary at diurnal scales (Wong and Chan, 2004). Indeed, development of wind shear is a common factor that disrupts tropical cyclone formation in the Atlantic basin (Landsea et al., 1999). Furthermore, wind shear is a principle mechanism for why the occurrence of El Nino/Southern Oscillation (ENSO) events typically suppress tropical cyclogenesis in this area (Goldenberg and Shapiro, 1996). Note that, in addition to ENSO-generated wind shear, Tang and Neelin (2004) demonstrated that another mechanism for tropical cyclone suppression in the North Atlantic arises from anomalous tropospheric temperatures communicated from the Pacific Ocean from ENSO.
Much of the preceding discussion regarding tropical cyclogenesis can be exemplified in global maps (Figures 4, 5A,B), both by where tropical cyclones form and where they do not, especially regarding SSTs and the Coriolis force. Tracks of global cyclones from 1985 to 2005 show the greatest frequency of storms in the western Pacific, with a similarly high density of cyclones in the eastern Pacific (Figure 4). For the North Atlantic Ocean—and comprising the cyclones of interest in this article—there are notably fewer tracks relative to the Pacific Ocean, yet they occur over a greater area of ocean. Fewer still are the cyclones of the Southern Hemisphere, with perhaps the most notable pattern being the essentially complete absence of tracks in a band around Equator (Figure 4).
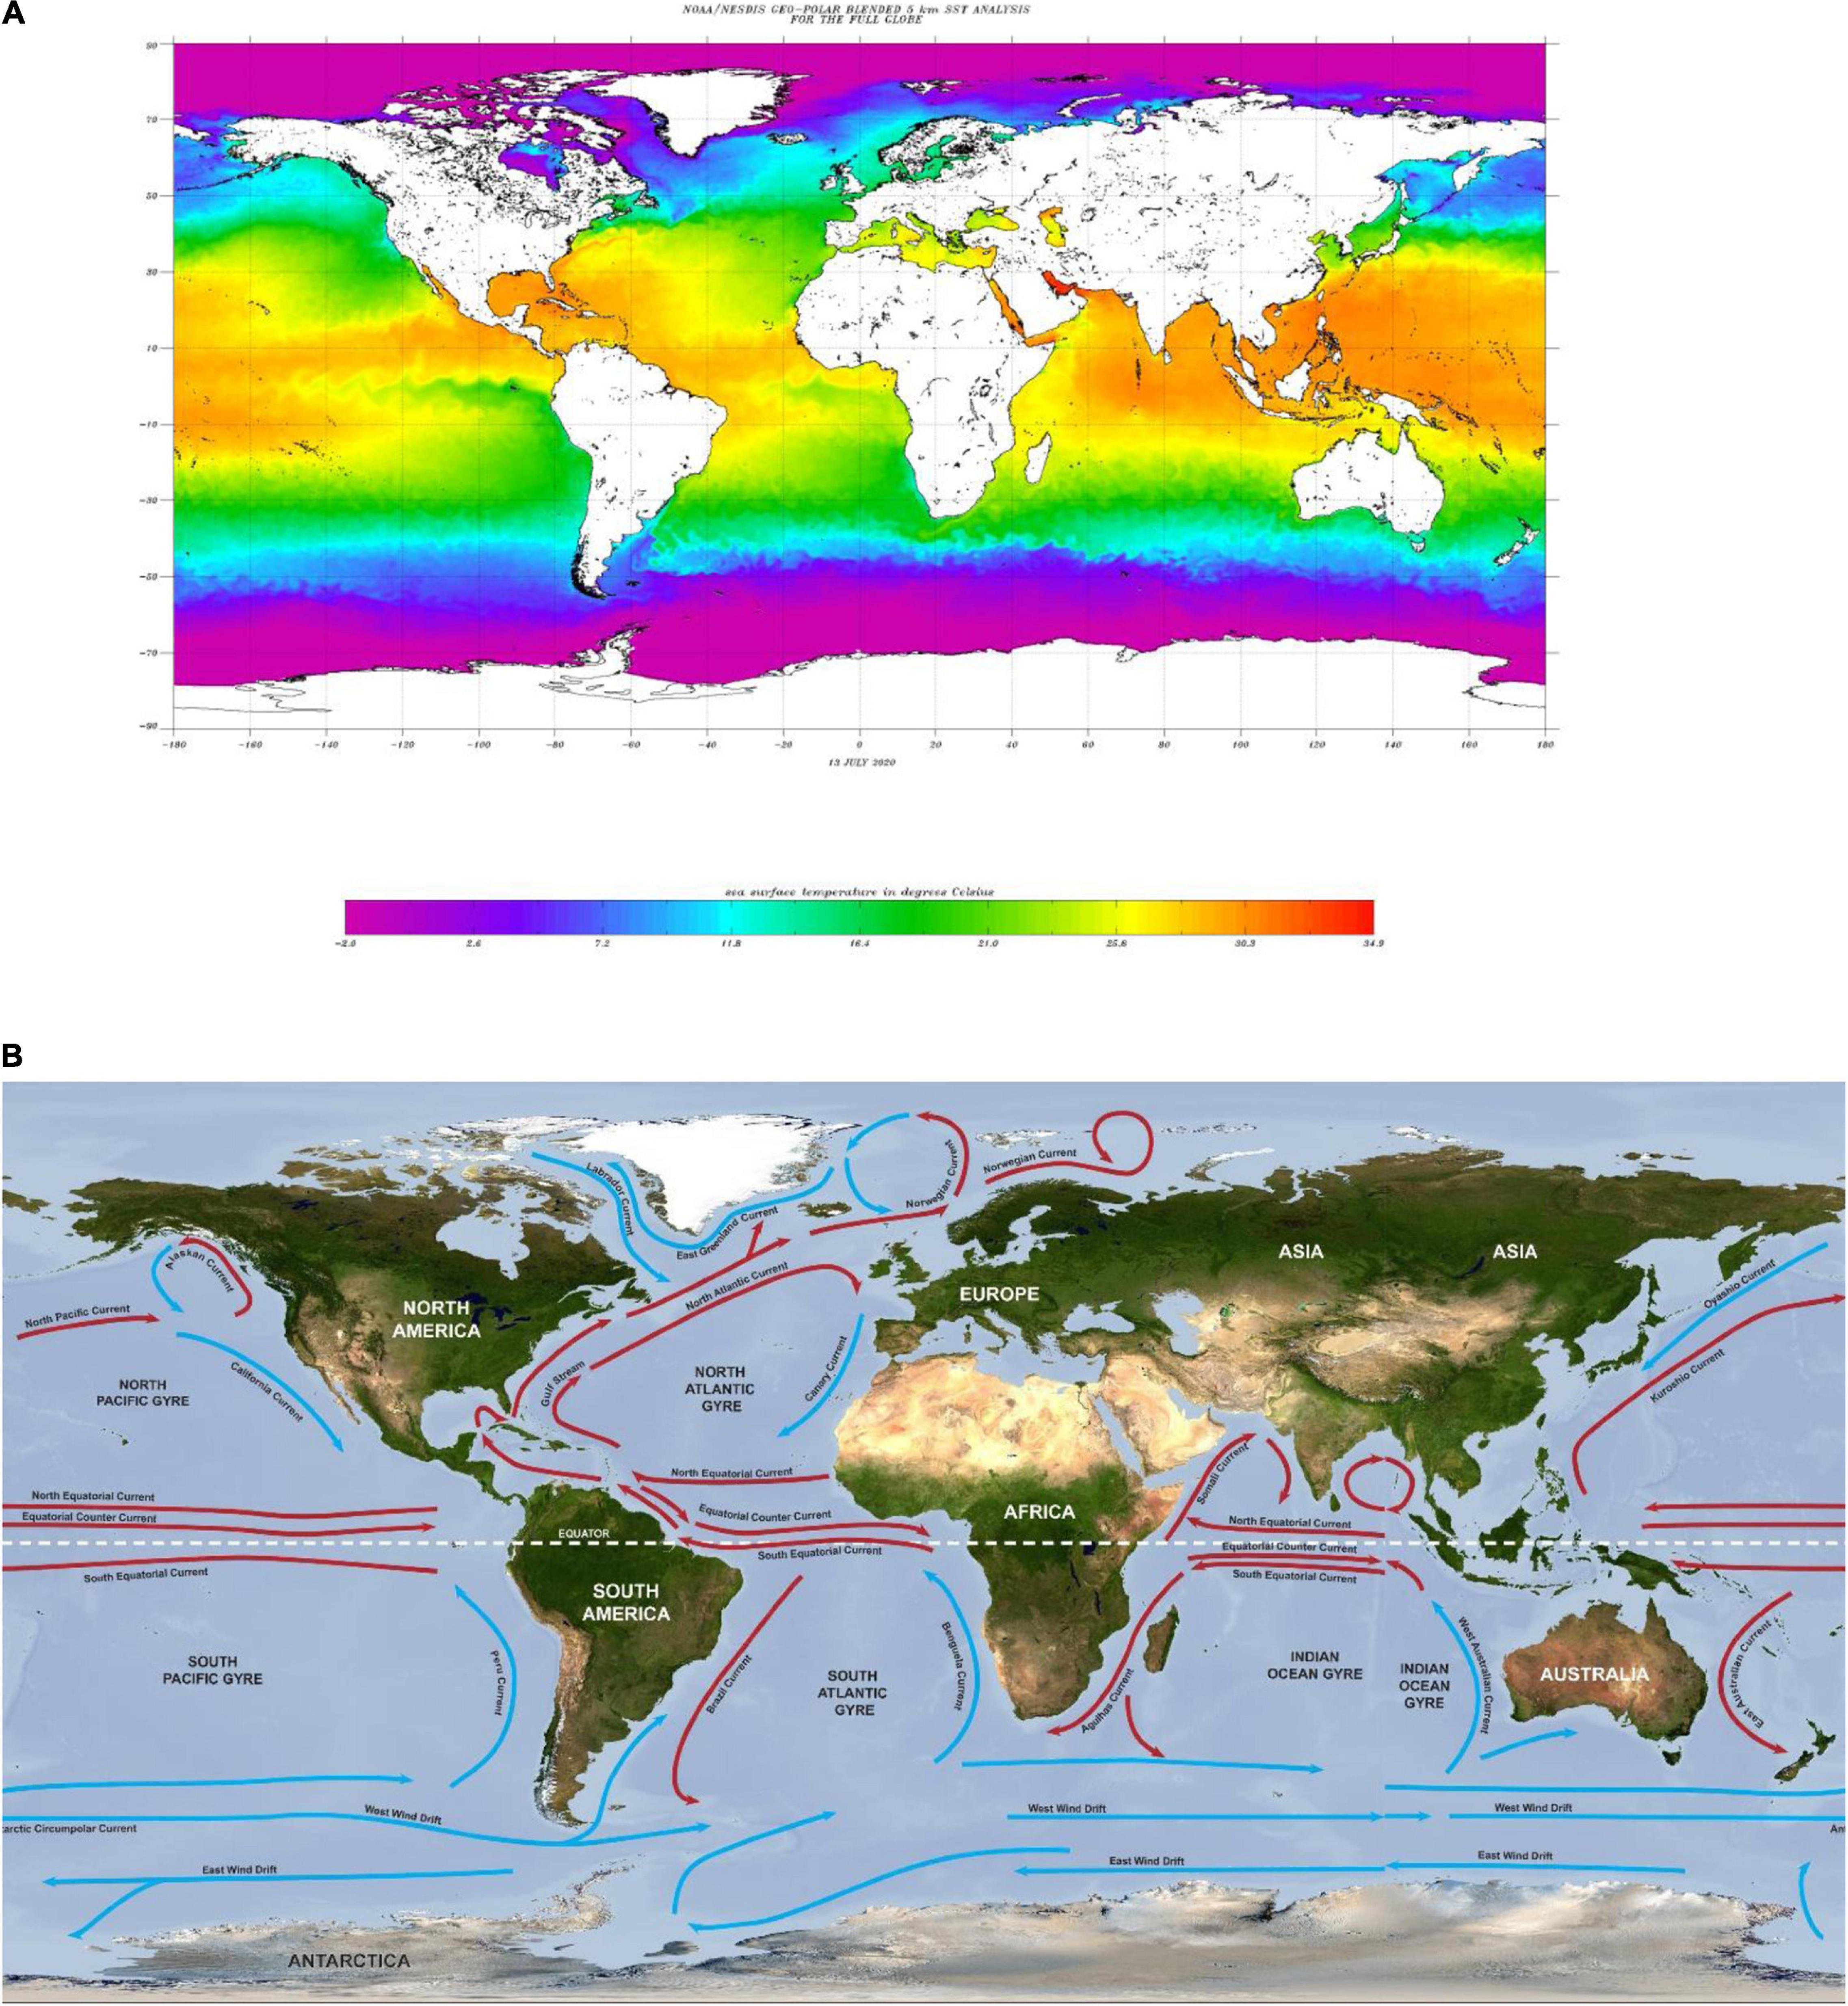
Figure 5. (A) Global sea surface temperatures, July 13, 2020. Map taken from the Office of Satellite and Product Operations (https://www.ospo.noaa.gov/); (B) major ocean currents, taken from the NOAA (https://sos.noaa.gov/).
The density of cyclones is clearly driven by spatial patterns of SSTs that are widely higher in corresponding regions of the Pacific Ocean (Figure 5A). The lower number of tracks in the North Atlantic Ocean also results from a proclivity of the jet stream to create wind shear there (Landsea et al., 1999). The widespread absence of cyclones along the west coasts of South America and Africa below the Equator arises from low SSTs (Figure 5A) which are maintained by cold ocean currents, namely the Peru Current (also called the Humboldt Current) and the Benguela Current for South America and Africa, respectively (Figure 5B). Similarly, the northern limit of tropical cyclone tracks in the eastern Pacific Ocean is limited by the cold waters of the California Current (Figure 5B).
The distinctive equatorial band lacking cyclones displays the clear importance of the Coriolis force, which is absent at the Equator and only gains enough strength ∼480 km north and south of it to initiate and maintain tropical cyclogenesis. Finally, the uneven distribution of cyclonic tracks north versus south of the Equator arises from a combination of interactions of ocean currents with land masses and the profound asymmetry of land mass, wherein that of the Northern Hemisphere (67.3%) is approximately twice that of the Southern Hemisphere (32.7%).
Tropical Cyclone Frequencies and Florida Landfall Events
It is important to separate tropical cyclogenesis from the occurrence of cyclones that make landfall. Numerous factors interact to control whether an individual cyclone reaches land, including many of the mechanisms previously discussed regarding cyclogenesis. In particular for the eastern United States and the North Atlantic Ocean is the North Atlantic Oscillation (NAO). The NAO arises from differences in sea-level air pressure between the Icelandic Low and the Azores High (which is also called the Bermuda High because of its shift toward Bermuda in summer months). The Azores/Bermuda High is also largely responsible for directing tropical cyclones that form off the west coast of Africa (the often-called Cabo Verde storms) in their west, north-west path toward the United States (Elsner and Bossak, 2004). The development of high-pressure systems over land, and in particular the dry air and wind shear commonly associated with them, often prevents tropical cyclones from making landfall. Storm tracks of all tropical and subtropical cyclones in the North Atlantic Ocean from 1851–2017 (Figure 6) reveal that most of these never made landfall.
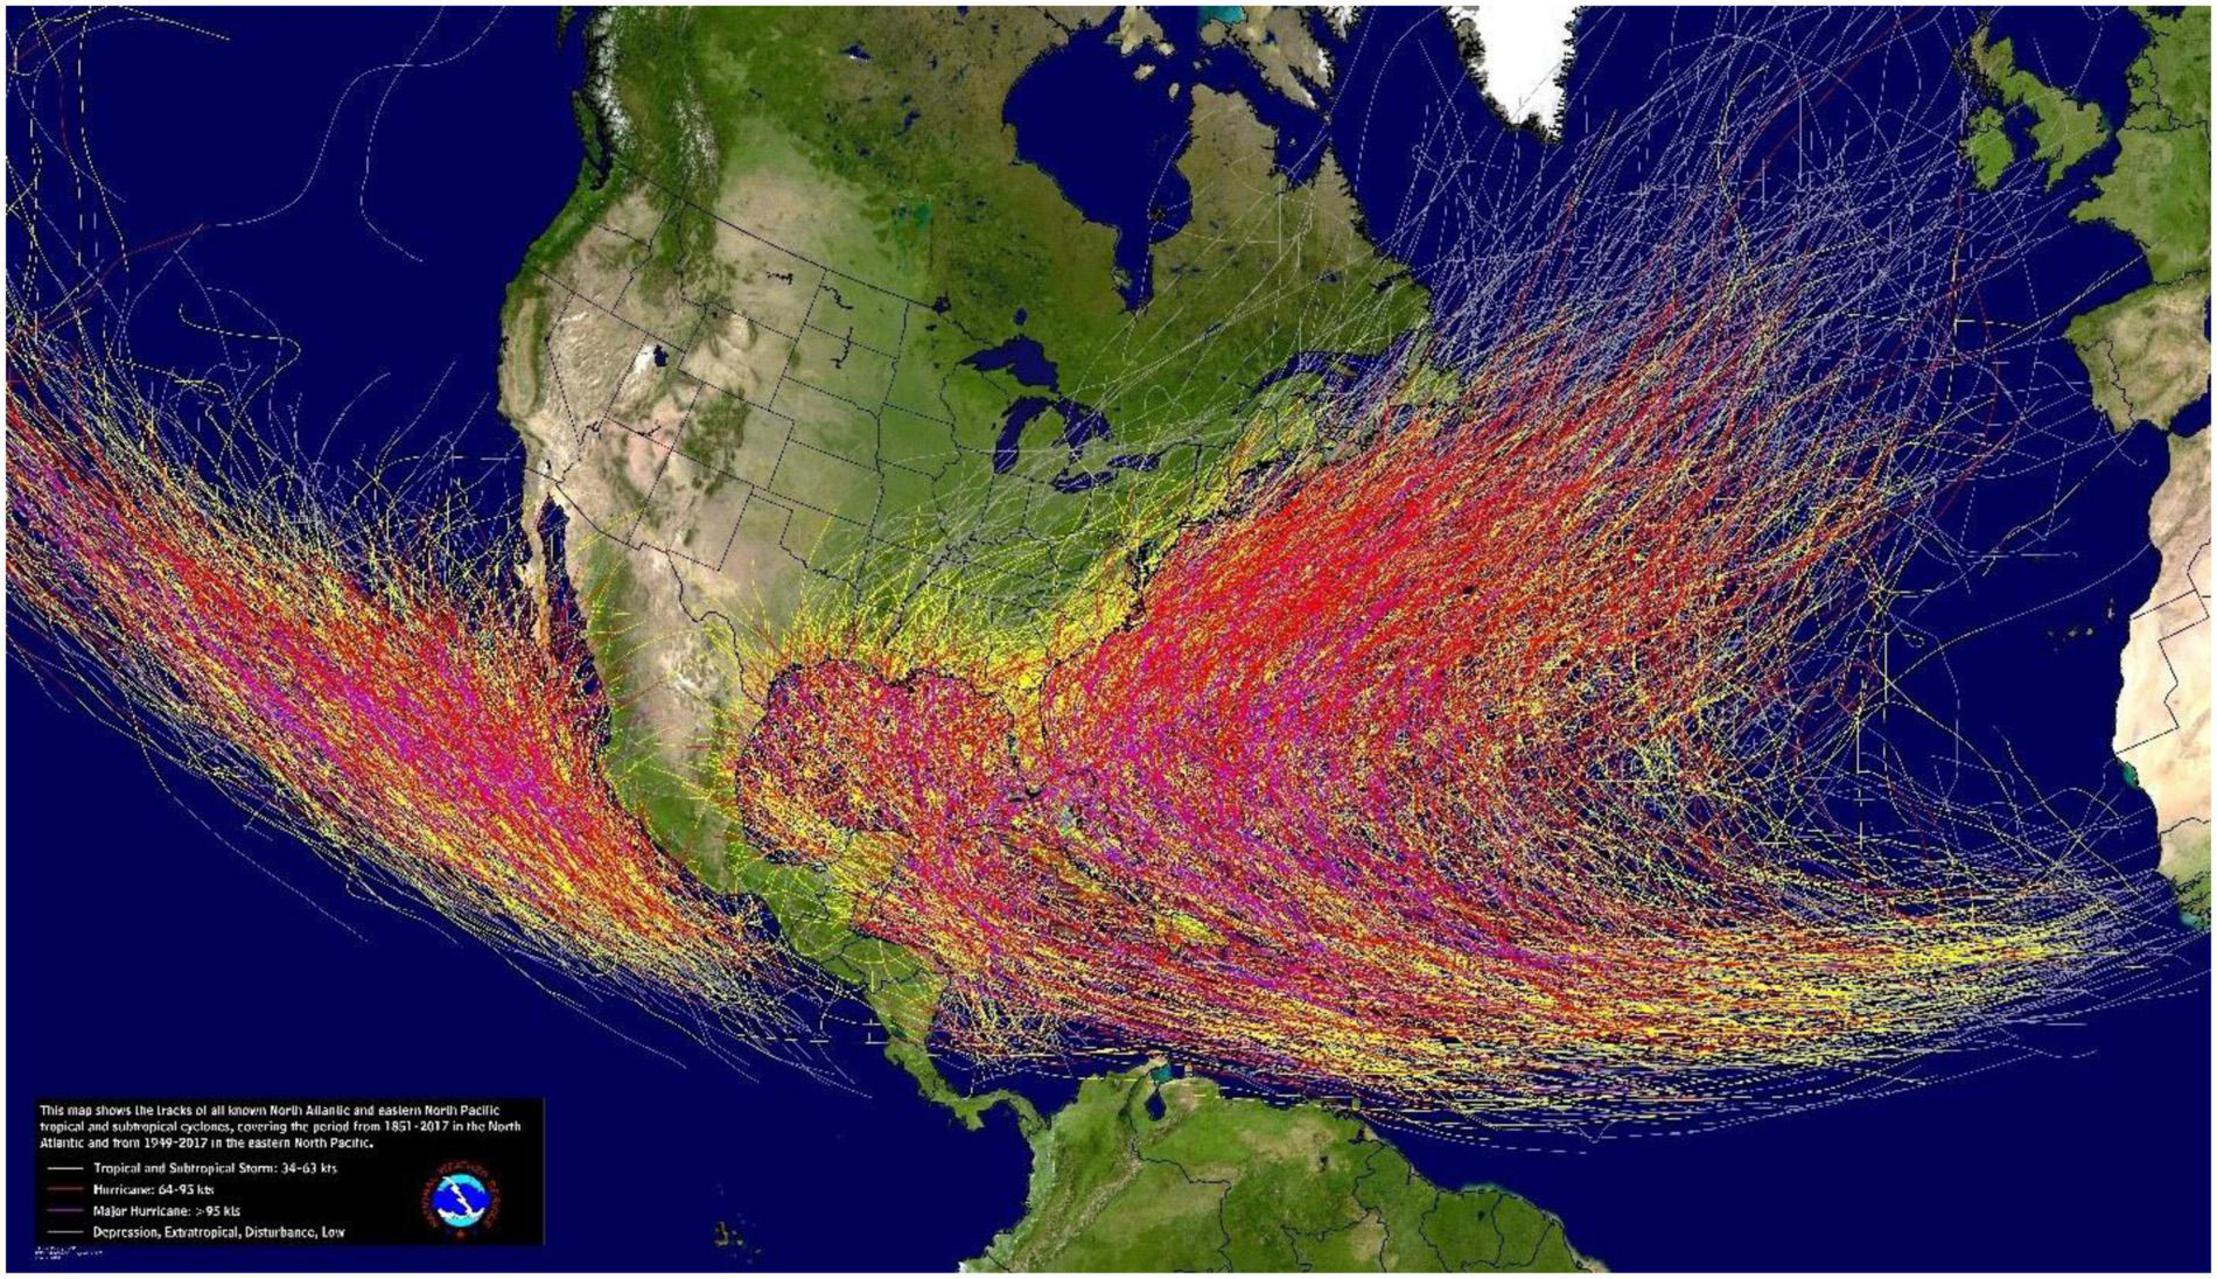
Figure 6. Tropical cyclones, North Atlantic Ocean (1851–2017) and eastern North Pacific Ocean (1949–2017). Credit: NOAA/NHC.
In addition to the NAO, landfall events are also affected differentially by El Niño/La Niña cycles (i.e., ENSO) and the Atlantic multidecadal oscillation (AMO) (Klotzbach et al., 2018). As already discussed, ENSO-generated wind shear can greatly suppress tropical cyclogenesis (Goldenberg and Shapiro, 1996). Furthermore, there is current scientific debate regarding the origins of the AMO. Some studies (e.g., Grossmann and Klotzbach, 2009; Yan et al., 2017) suggest that the Atlantic meridional overturning circulation is the primary driver, whereas other studies identify sulfate aerosols (Booth et al., 2012) or stochastic midlatitude atmospheric forcing (Clement et al., 2015) as having a primary impact. Temporally, Klotzbach et al. (2018) reported no significant increase in landfall events for the continental United States from 1900 to 2017.
Spatially, considering both its geographic location and its geometric shape, it is unsurprising that Florida experiences a relatively high number of landfall tropical cyclones in the United States. That is, it is not only the most southeastern of all states, but most of Florida is a peninsula with a total shoreline distance second only to Alaska. Indeed, 40% of all landfall cyclones in the United States on record (1850–present) have hit Florida. Inspection of the total number of landfall hurricanes from 1900 to 2010 reveals that not only did Florida experience the highest number among coastal counties/parishes/boroughs from southern Texas to Maine, but that southeastern Florida and its southern-most tip was a particular “hot spot” during this period (Figure 7). Closer examination shows that Monroe, Miami-Dade, and Broward counties averaged 26 landfall hurricanes (Figure 8) in a period of time wherein the eastern United States experienced 73 landfalls.
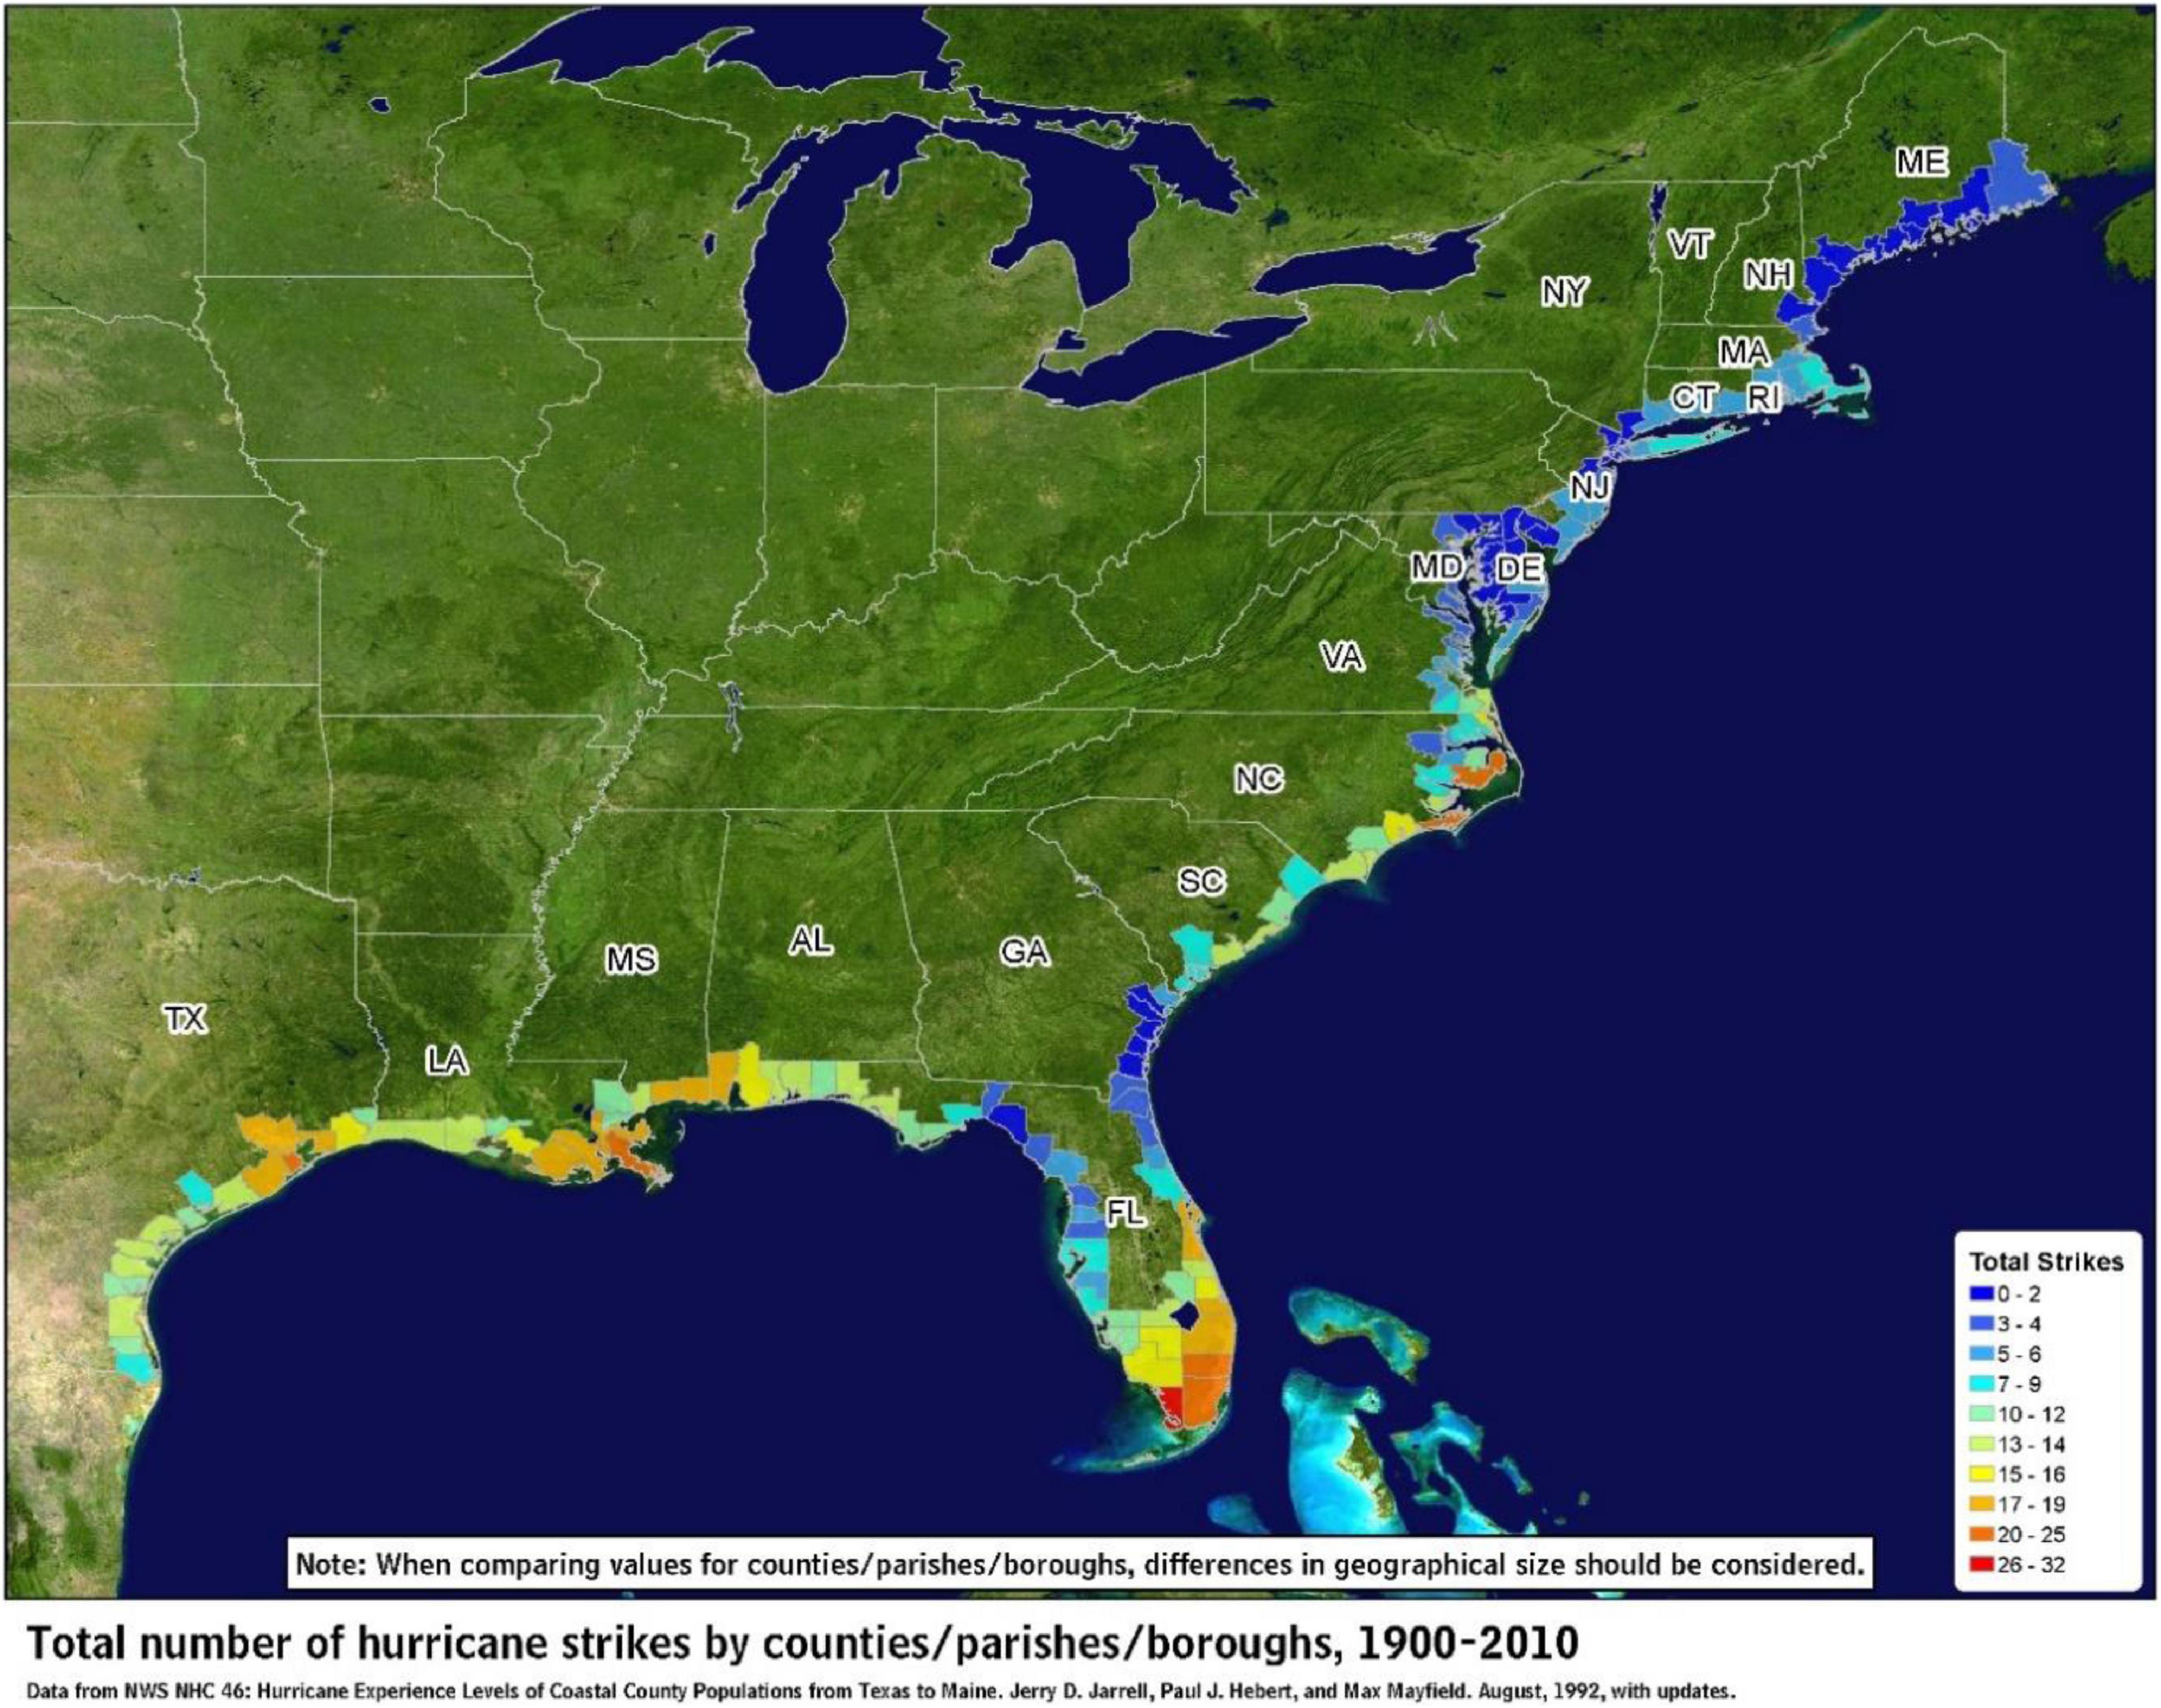
Figure 7. Total hurricane strikes in coastal counties/parishes/boroughs, 1900–2010. Credit: NOAA/NHC.
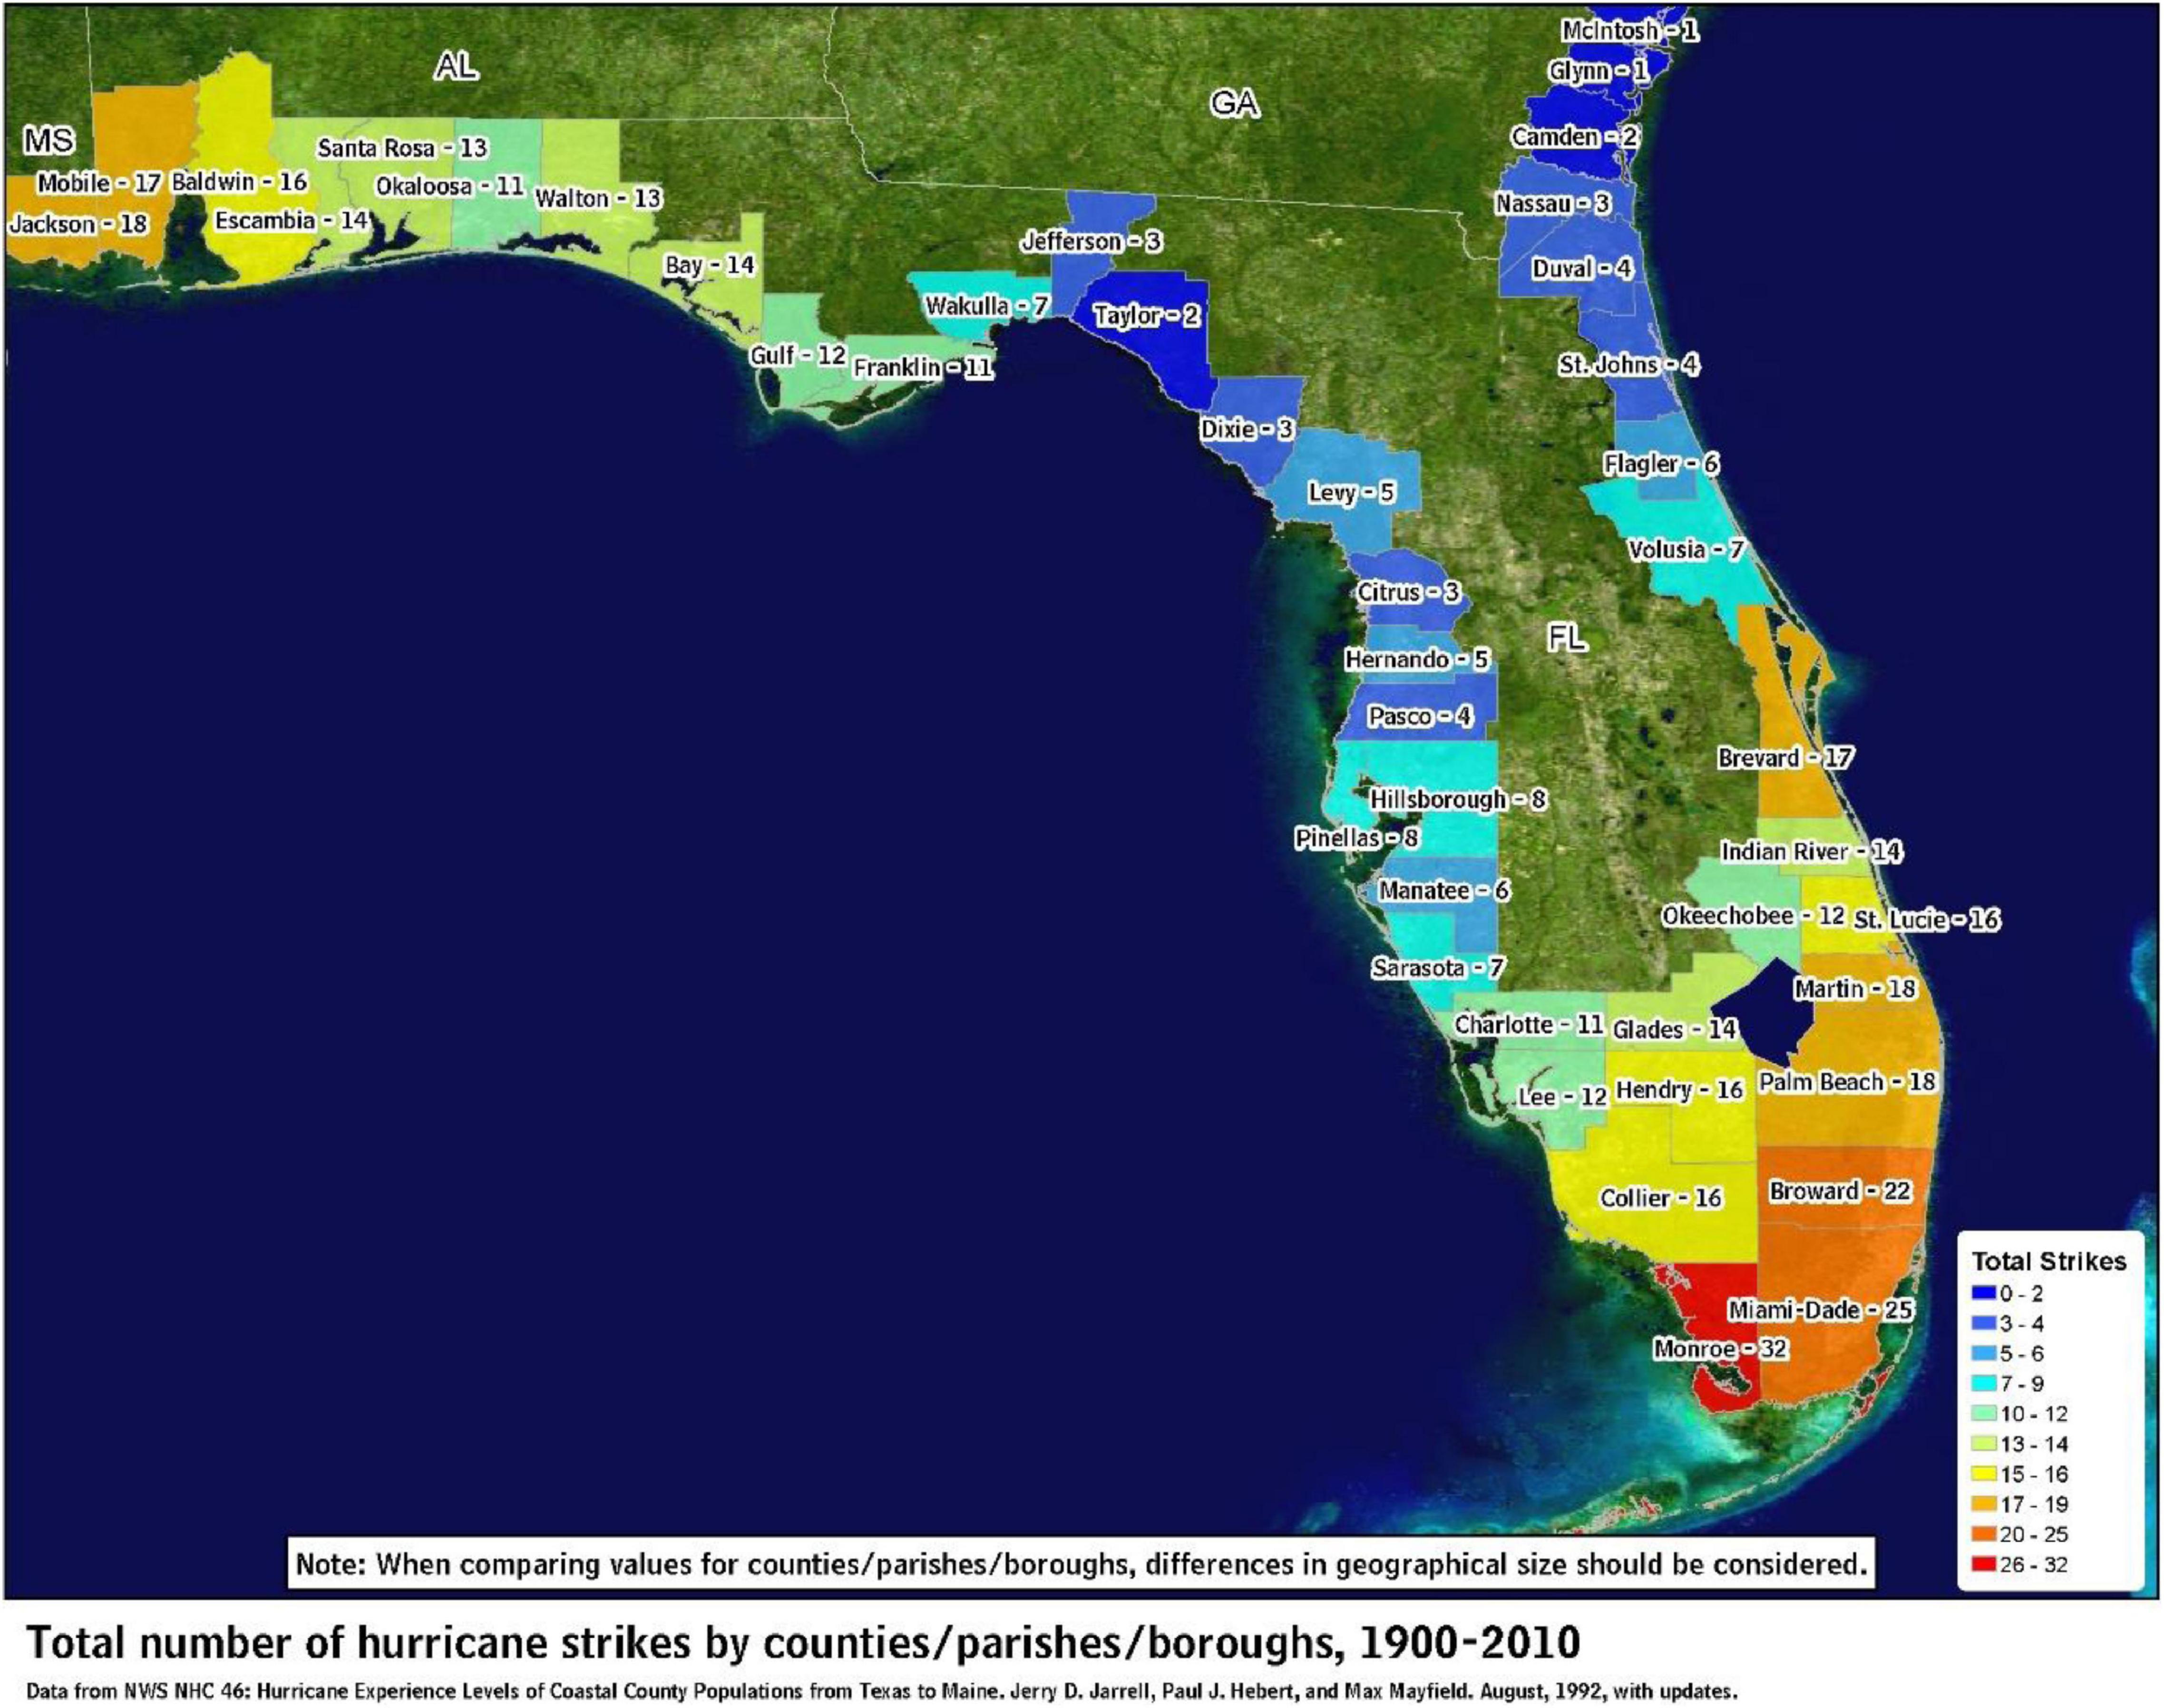
Figure 8. Total hurricane strikes in coastal counties of eastern Mississippi to southern Georgia, 1900–2010. Credit: NOAA/NHC.
Between 1990 and the present, there were 18 hurricanes to make landfall in Florida (Table 1). It is important to note that this list comprises only hurricanes and, thus, does not include tropical storms, which are named cyclones but do not reach the intensity of wind speeds of 33 m/s (119 km/h) or a minimum surface pressure of 980 mb (Landsea et al., 1999). Among the extremes of this list, the earliest and latest storms in a given year were Dennis (July) and Jeanne (November), respectively, which were also the months of least common occurrence. September was the most common month, with all but five hurricanes making landfall in either September or October. Thus, nearly 75% of hurricanes making landfall in Florida over the past 30 years did so in either September or October.
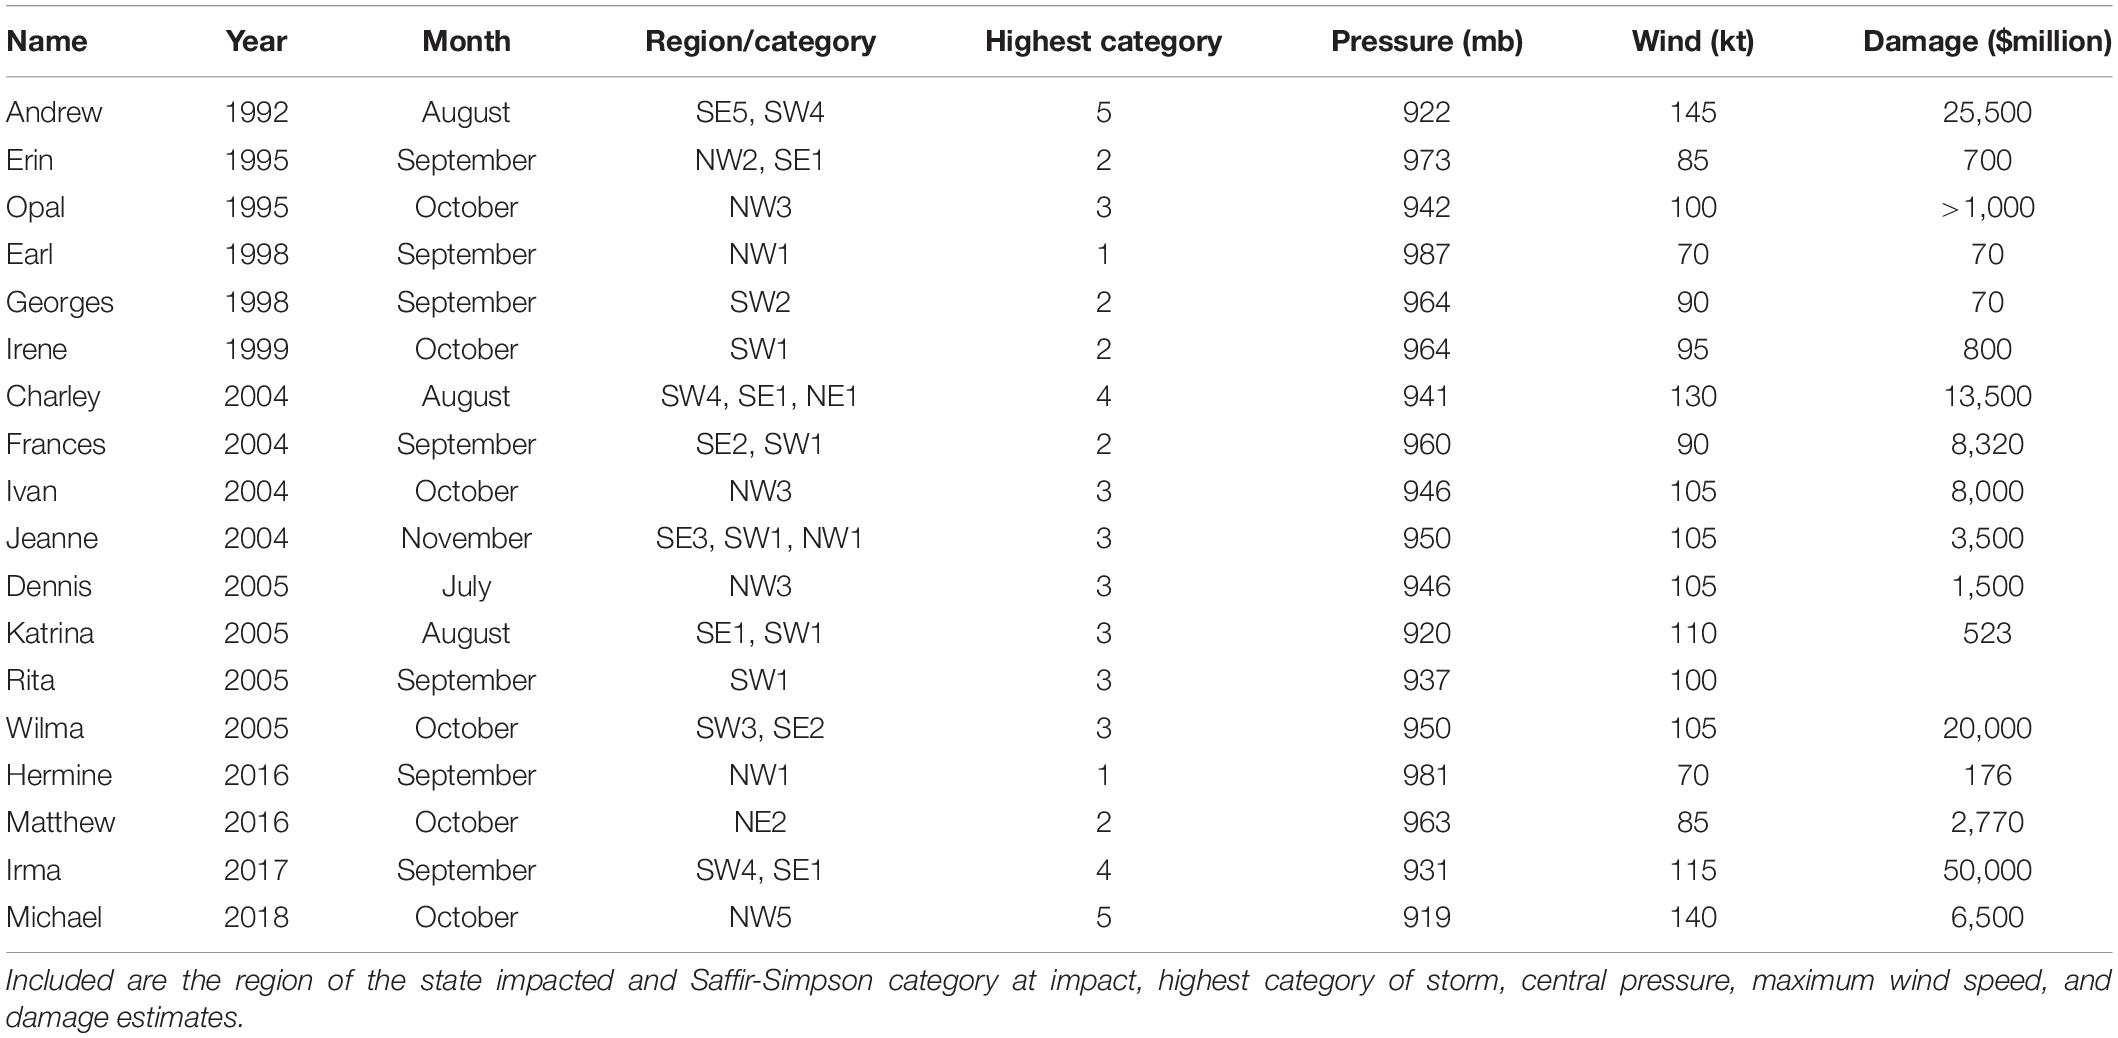
Table 1. Landfall hurricanes for the State of Florida, 1990 to present.
Ten hurricanes made landfall as a Category 1, whereas two (Andrew in 1992 and Michael in 2018) made landfall as a Category 5. Notably, Andrew and Michael were two of only four hurricanes on record to make landfall as Category 5 storms anywhere on record in the United States [the Labor Day Hurricane (1935) and Camille (1969) were the other two]. All told, hurricanes making landfall in Florida created an estimated $142 billion in damage or $8.4 billion/storm.
Several factors intersect to suggest a challenging future for Florida regarding tropical cyclones, including that it has (1) a high coastline-to-surface area ratio (which exceeds that of Alaska, the state with the greatest distance of maritime coastline), (2) the second-lowest mean elevation (30 m, behind Delaware at 20 m) and a high proportion of the state <5 m, and (3) a large, rapidly growing human population. The population of Florida ranks third among United States states, behind California and Texas. With a current rate of 1.8%, however, Florida has the highest population growth rate among the top 10 states, which is over three times the current rate for the United States as a whole (0.5%).
Florida’s high coastline-to-surface area ratio—and its geographical location—are, of course, unchanging, ensuring a higher-than-average likelihood for landfall cyclones in the future. Low mean elevation is similarly unchanging, but mean sea level is rising. Global rise in sea level averaged 0.009 mm/year from 1880 to 1900, but from 1900 to 2009 averaged 1.7 mm/year, a nearly 200% increase in the rate of sea level rise (Church and White, 2011); it is predicted to continue to at least 0.3 m by the end of the century (Figure 9). Accordingly, storm surge from a tropical cyclone, which can be as much as 1.5 m for a Category 1 hurricane and 6 m for a Category 5 hurricane, will have an increasing impact via flooding. Finally, Florida’s increase in human population is part of an ongoing shift of the United States population toward the southeast region, with an annual growth rate of just under 1% in 2010s (twice that of the United States in general and 10 times that of the northeast at 0.1%). This translates into more property that is susceptible to cyclone-mediated damage and—far more important—more lives threatened by tropical cyclones. The question of what this may mean for the future is covered in the next section.
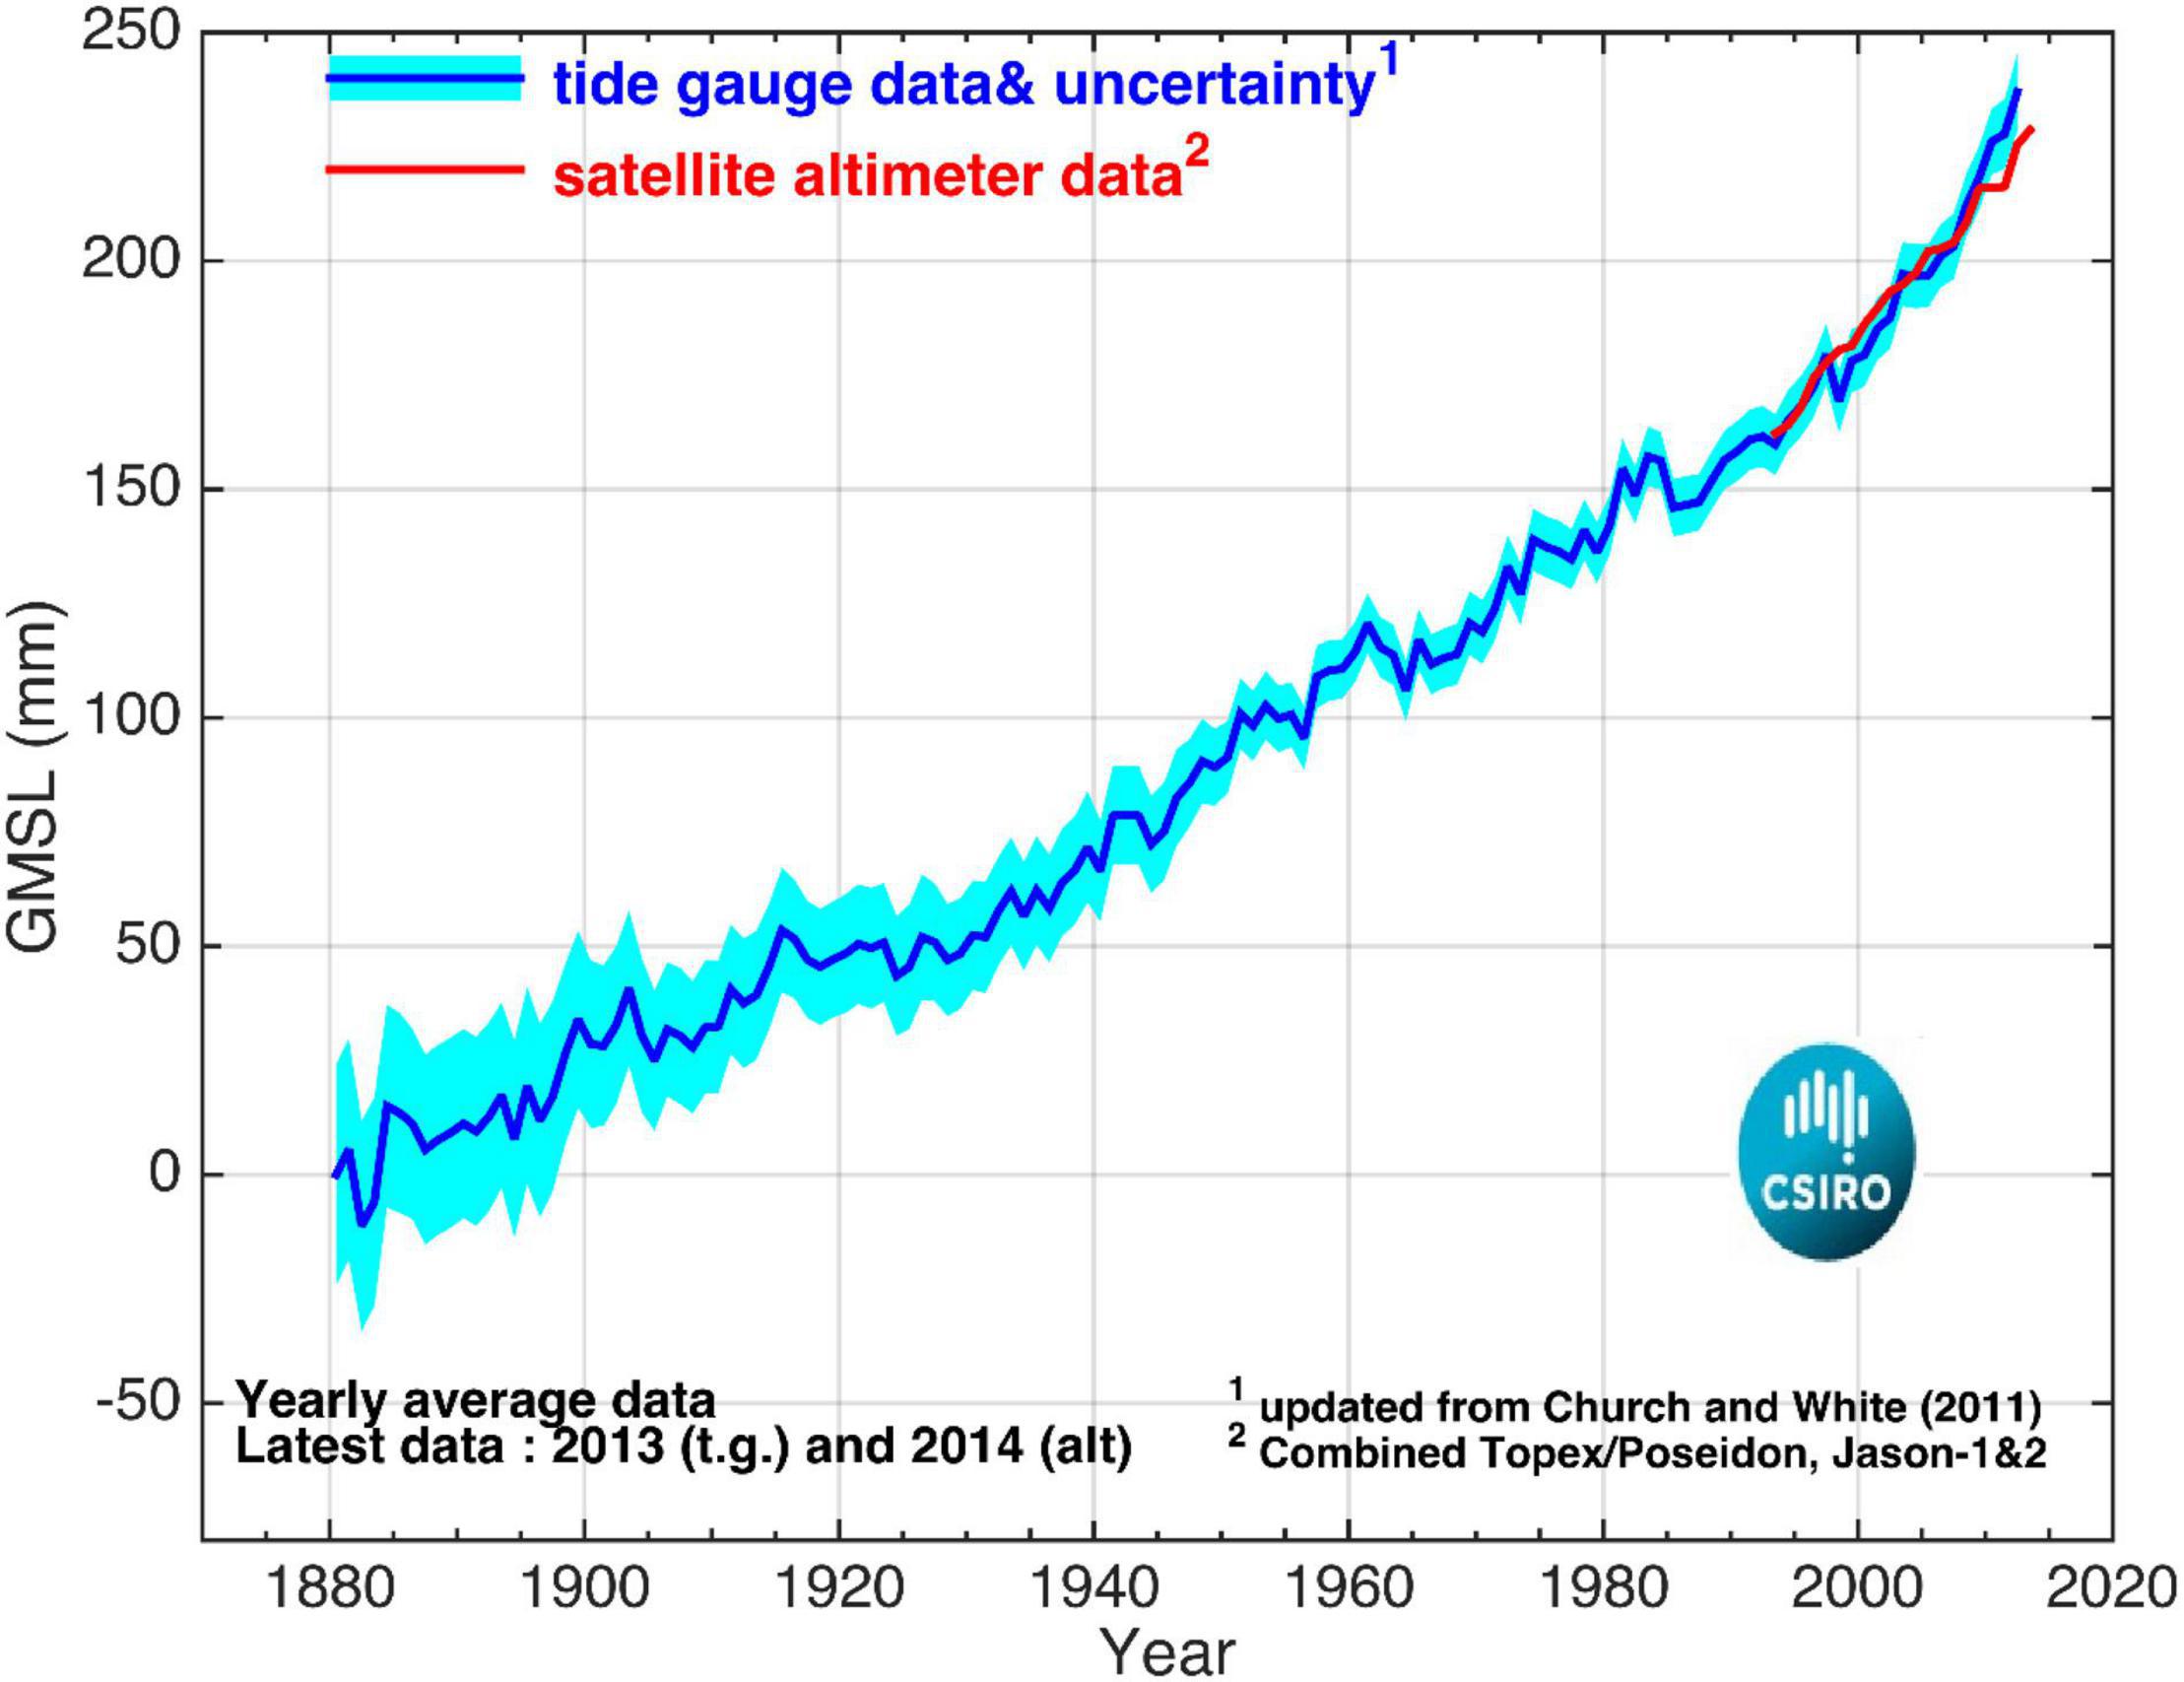
Figure 9. Global sea level, 1880–2014. Figure taken from the CSIRO (https://research.csiro.au/slrwavescoast/sea-level/).
Tropical Cyclones and Climate Change
Anthropogenic climate warming—driven primarily by exponential increases in global emissions of CO2 that enhance the heat-trapping greenhouse effect—has long been acknowledged in the scientific community, particularly among environmental and atmospheric scientists (Oreskes, 2004; Doran and Zimmerman, 2009; Goldberg et al., 2019), with warming for this century projected to be of an unprecedented magnitude (Hansen et al., 1981). A landmark study at the time, the National Research Council (1979) estimated the Earth’s “climate sensitivity” (i.e., susceptibility of Earth’s climate to anthropogenic influence) was between 1.5 and 4.5°C per doubling of global atmospheric CO2. Over 40 years later, Sherwood et al. (2020) examined all lines of evidence—feedback processes and historical/paleo climate records—and improved the uncertainty around climate sensitivity, suggesting values toward the middle and upper limits of this range.
Hansen et al. (1988) made several specific predictions regarding climate change using a three-dimensional model developed at the Goddard Institute for Space Studies. Among their predictions was that greenhouse warming would be clearly identifiable in the decade of the 1990s, reaching a level at least three standard deviations above that of the 1950s. They also predicted that such increases in temperature would be enough to have profoundly detrimental impacts on humans and the biosphere, including increases in frequencies of extreme events, e.g., hot versus cold, wet versus dry, as well as extremes of intensity of storm events. Over the >30 years since Hansen et al. (1988), evidence fully supports these predictions, as revealed in temporal patterns of temperature (Figure 2) and global occurrences of storms, droughts, and floods (Figure 10).
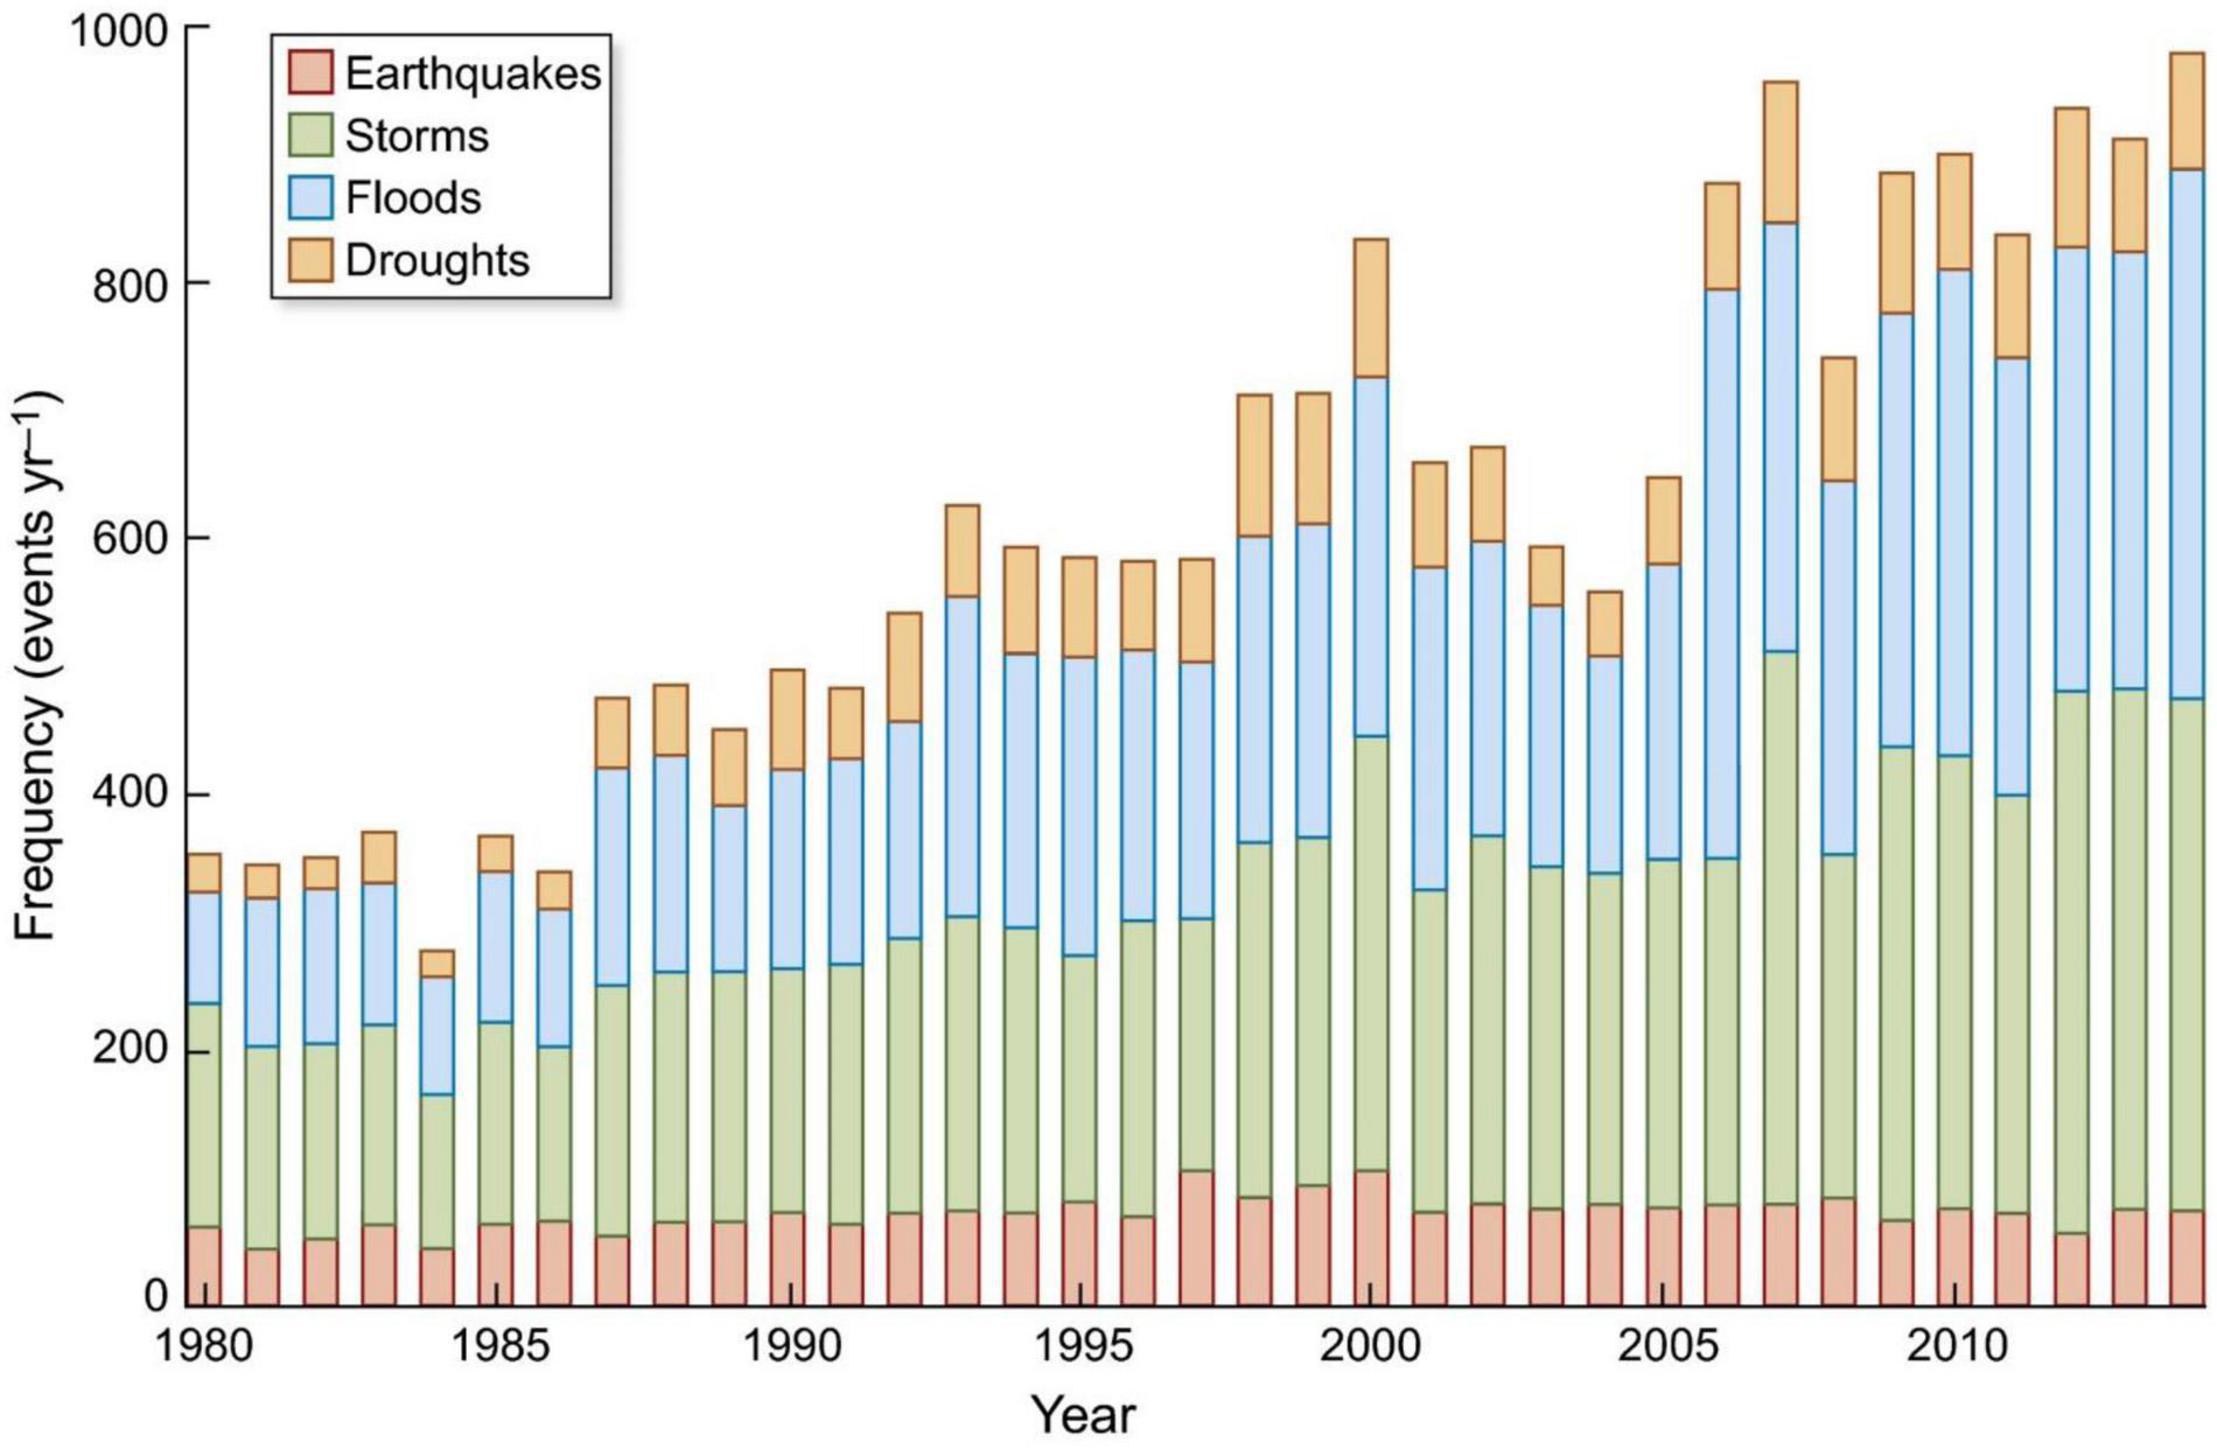
Figure 10. Global frequency of extreme events. Figure from Gilliam (2016); used with permission.
Although the veracity of global warming is widely accepted among scientists (Oreskes, 2004; Doran and Zimmerman, 2009), current debate remains regarding the environmental repercussions of increasing surface and ocean temperature on terrestrial and aquatic ecosystems, including both biotic processes, such as life cycles and phenology, and abiotic processes, such as weather patterns, hydrology, and fire cycles (Parmesan and Yohe, 2003; Marlon et al., 2009; Mackey et al., 2012; Gilliam, 2016). Once again, there is a broad consensus among scientists that anthropogenic climate change has detrimentally affected numerous Earth systems (Oreskes, 2004; Doran and Zimmerman, 2009).
Not surprisingly, given the central role of heat release from surface seawater in tropical cyclogenesis (sometimes even referred to as a “heat engine,” Renno and Ingersoll, 1996), part of this debate includes whether global warming is causing increases in the frequency and/or intensity of tropical cyclones. In addition to the dialogue chronicled earlier between Emanuel (2005b, c) and Pielke (2005)/Landsea (2005) regarding the potential for such relationship, recent work has suggested a direct connection between warming-enhanced increases in surface temperatures and increases in frequency/intensity of tropical cyclones (Shepherd and Knutson, 2007; Zhao and Held, 2010).
Hosseini et al. (2018) found a strong correlation between SSTs and tropical cyclones, confining their analyses to hurricanes (i.e., excluding tropical storms) in the Atlantic Tropical Cyclogenesis Region (ATCR: 6–18° N, 20–60° W) from 1886 to 2017. The final section of this review summarizes analyses from the same data source, i.e., the National Oceanic and Atmospheric Administration (NOAA) [NOAA National Hurricane Center1 —Landsea et al., 2015], but expands spatial scale (all North Atlantic storms versus ATCR), temporal scale (1850–2019 versus 1886–2017), and types of tropical cyclones (tropical storms, hurricanes, and major hurricanes versus hurricanes). Two questions were addressed: (1) are frequencies/intensities of tropical cyclones increasing in the North Atlantic? and (2) do frequencies of tropical cyclone of all intensities vary significantly with measures of air and ocean temperature?
The first question was addressed in two ways. The first is via linear regression of frequencies of tropical cyclones versus time, separated by cyclone type/intensity—tropical storm, hurricane, and major hurricane—according to the Saffir-Simpson scale, with a major hurricane being of Category ≥3 (Landsea et al., 1999). The second is by examining temporal change in the mean annual number of cyclones by type. There has been increasing reference to a “new normal” in both meteorological events and biological processes brought on by anthropogenic climate warming (Lewis et al., 2017); this latter examination endeavors to place this into a context regarding tropical cyclones.
The number of tropical storms has increased significantly (P < 0.00001) from 1850 to the present (Figure 11). Understandably, given the numerous factors that contribute to tropical cyclogenesis as previously discussed, there is a considerable inter-annual variability in the number of tropical storms. A clearer pattern emerges from examining quarter-century means, i.e., 25-year running averages, exhibiting increases to 1910, followed by a slight decrease to 1930, a steep increase to 1955, another slight decrease to 1990, and finally another steep increase to the present time. Other than in 2006 and 2014, since 1990, there have been no years with fewer than six tropical storms; prior to 1990, most years had fewer—often far fewer—than six storms (Figure 11).
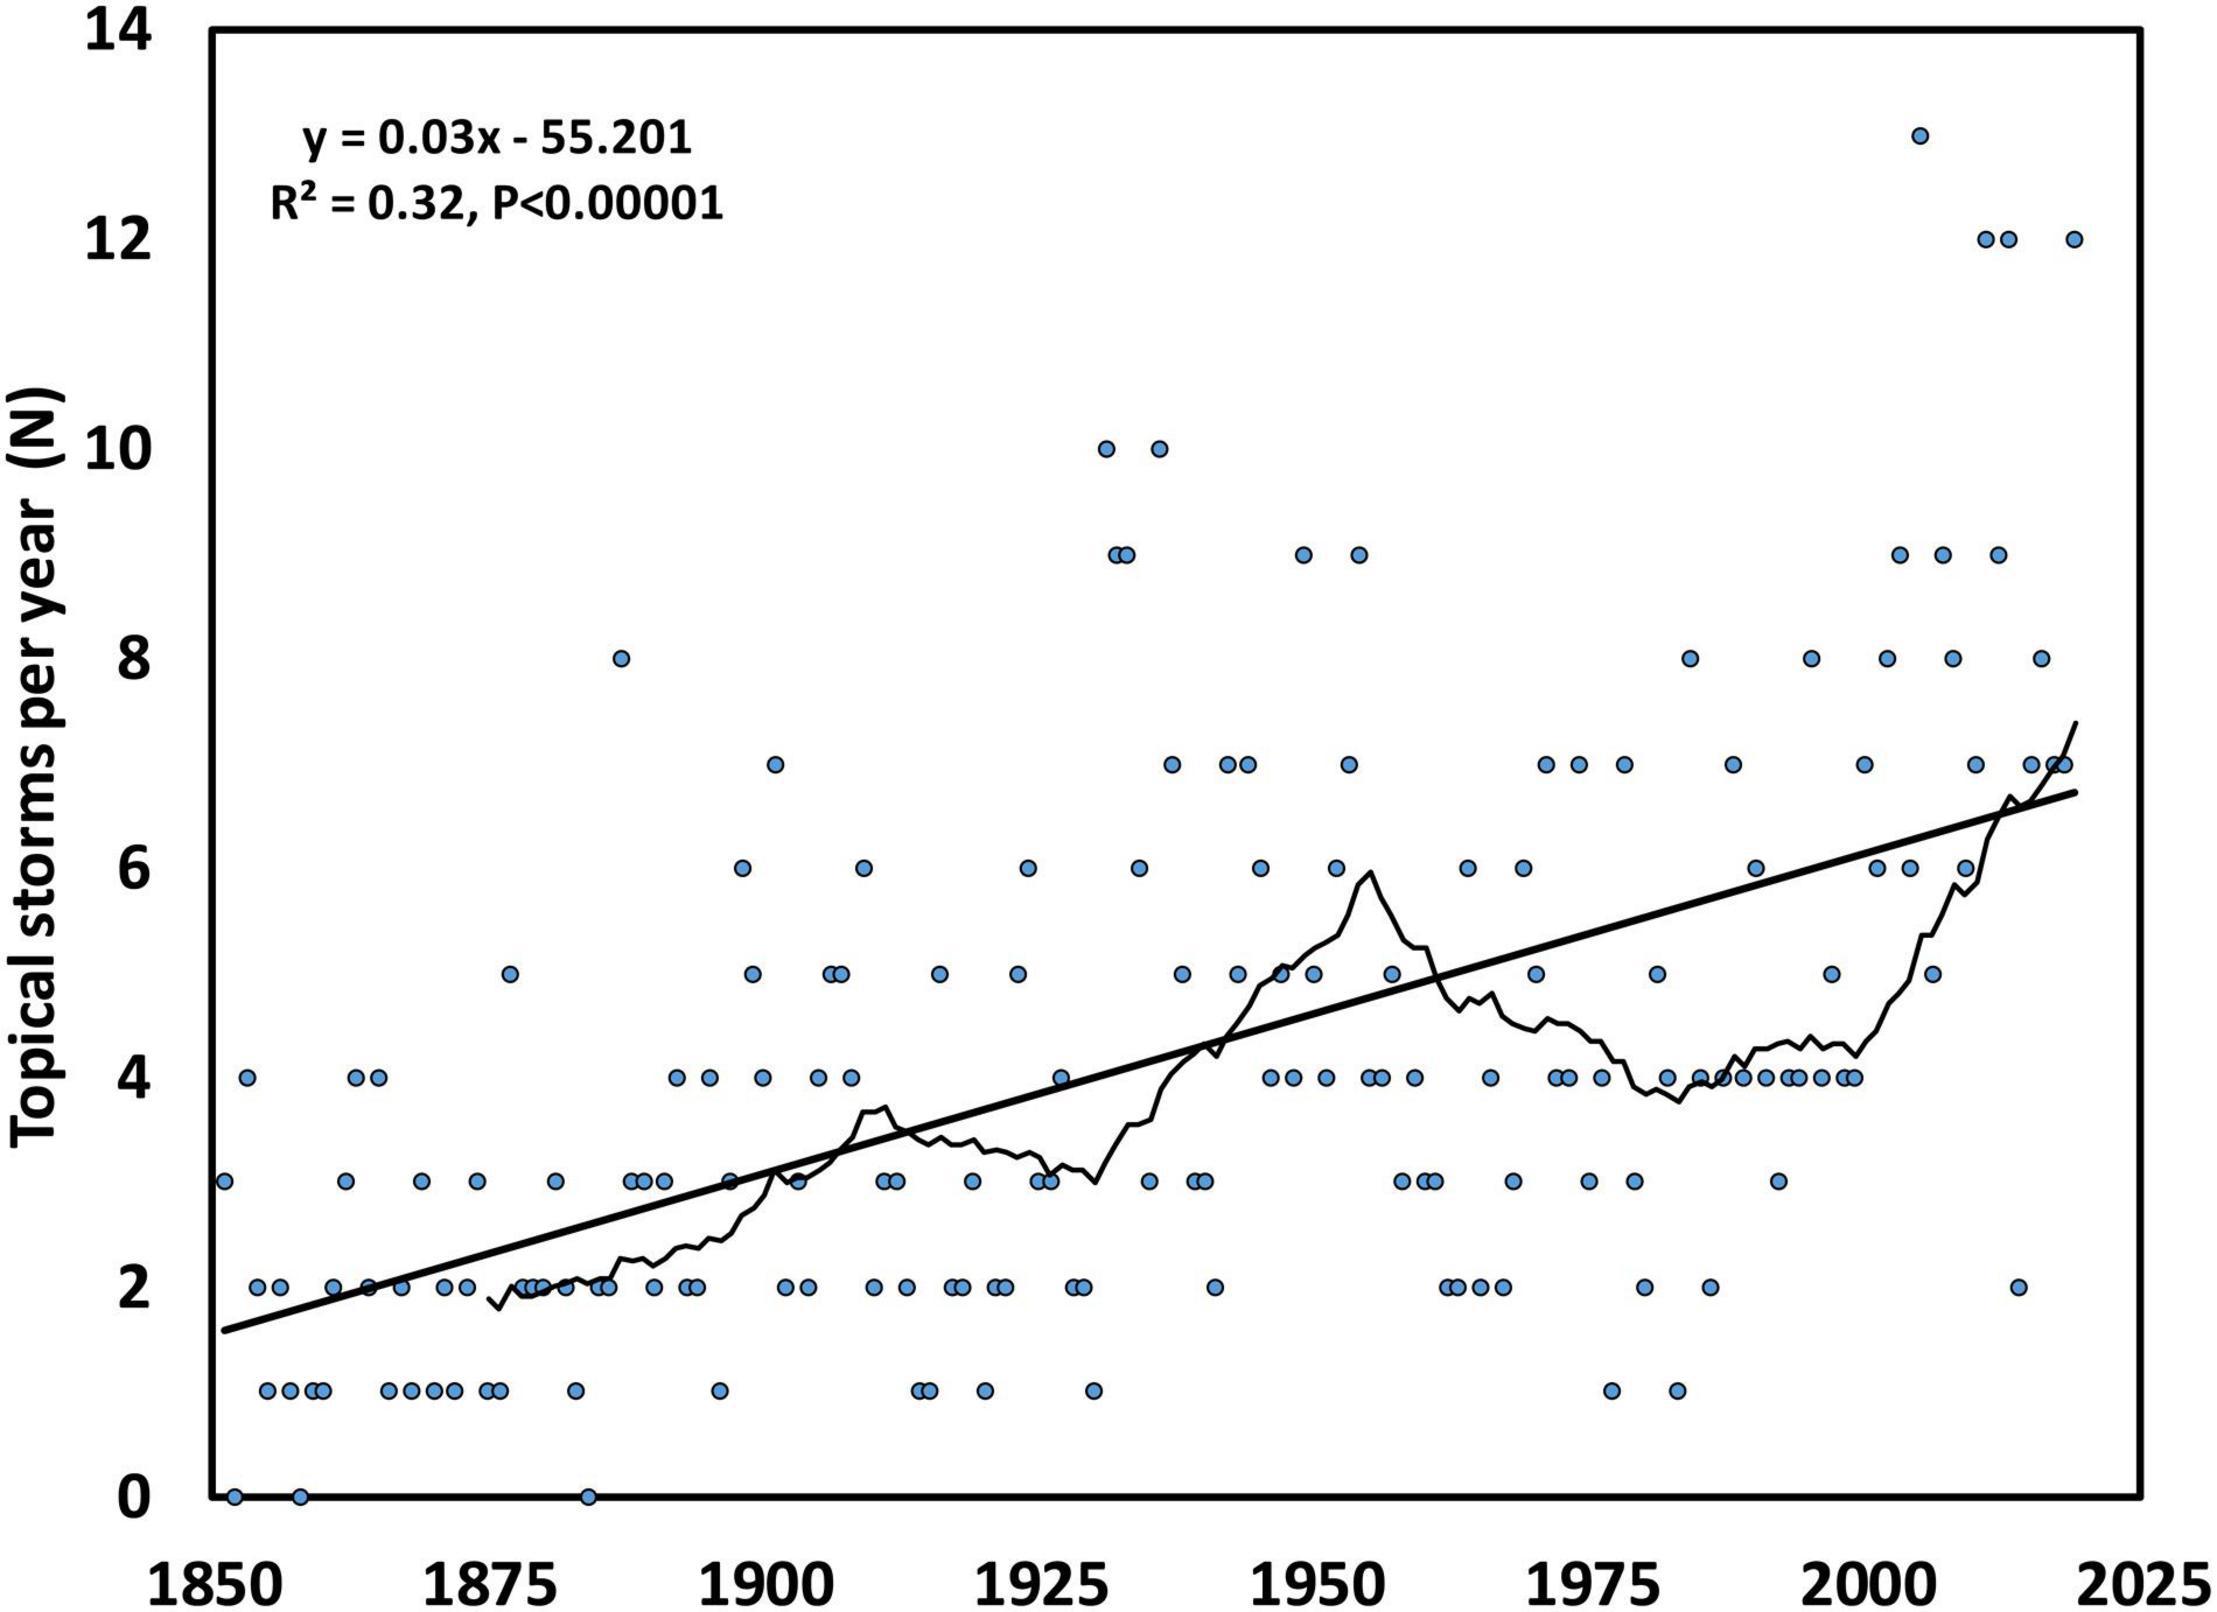
Figure 11. Frequency of annual tropical storms for North Atlantic Ocean, 1850–present. Thick straight line is the result of linear regression; thin, varying line is the 25-year moving average.
Likely due to much lower frequencies than tropical storms, the magnitude of change through time is not as pronounced for hurricanes and major hurricanes. Nonetheless, both have increased significantly from 1850 to the present (P < 0.002 and P < 0.0002, respectively) (Figure 12). Notable on the X-axis is the asymmetrical distribution of points for major hurricanes, indicating years with no major hurricanes. To further examine this pattern, data were grouped by decade in two categories: number of years without major hurricanes (rarity) versus number years with major hurricanes (commonness) (Figure 13). These categories contrast sharply from the decades of the late 19th and early 20th centuries versus recent decades. That is, although years without major hurricanes were once quite common (>3 year/decade from 1850 to 1920), there have only been 6 years total without a major hurricane from 1950 to the present. Years with major hurricanes have become increasingly more common, averaging ∼1 year/decade from 1850 to 1920, but >4 year/decade from 1950 to the present (Figure 13).
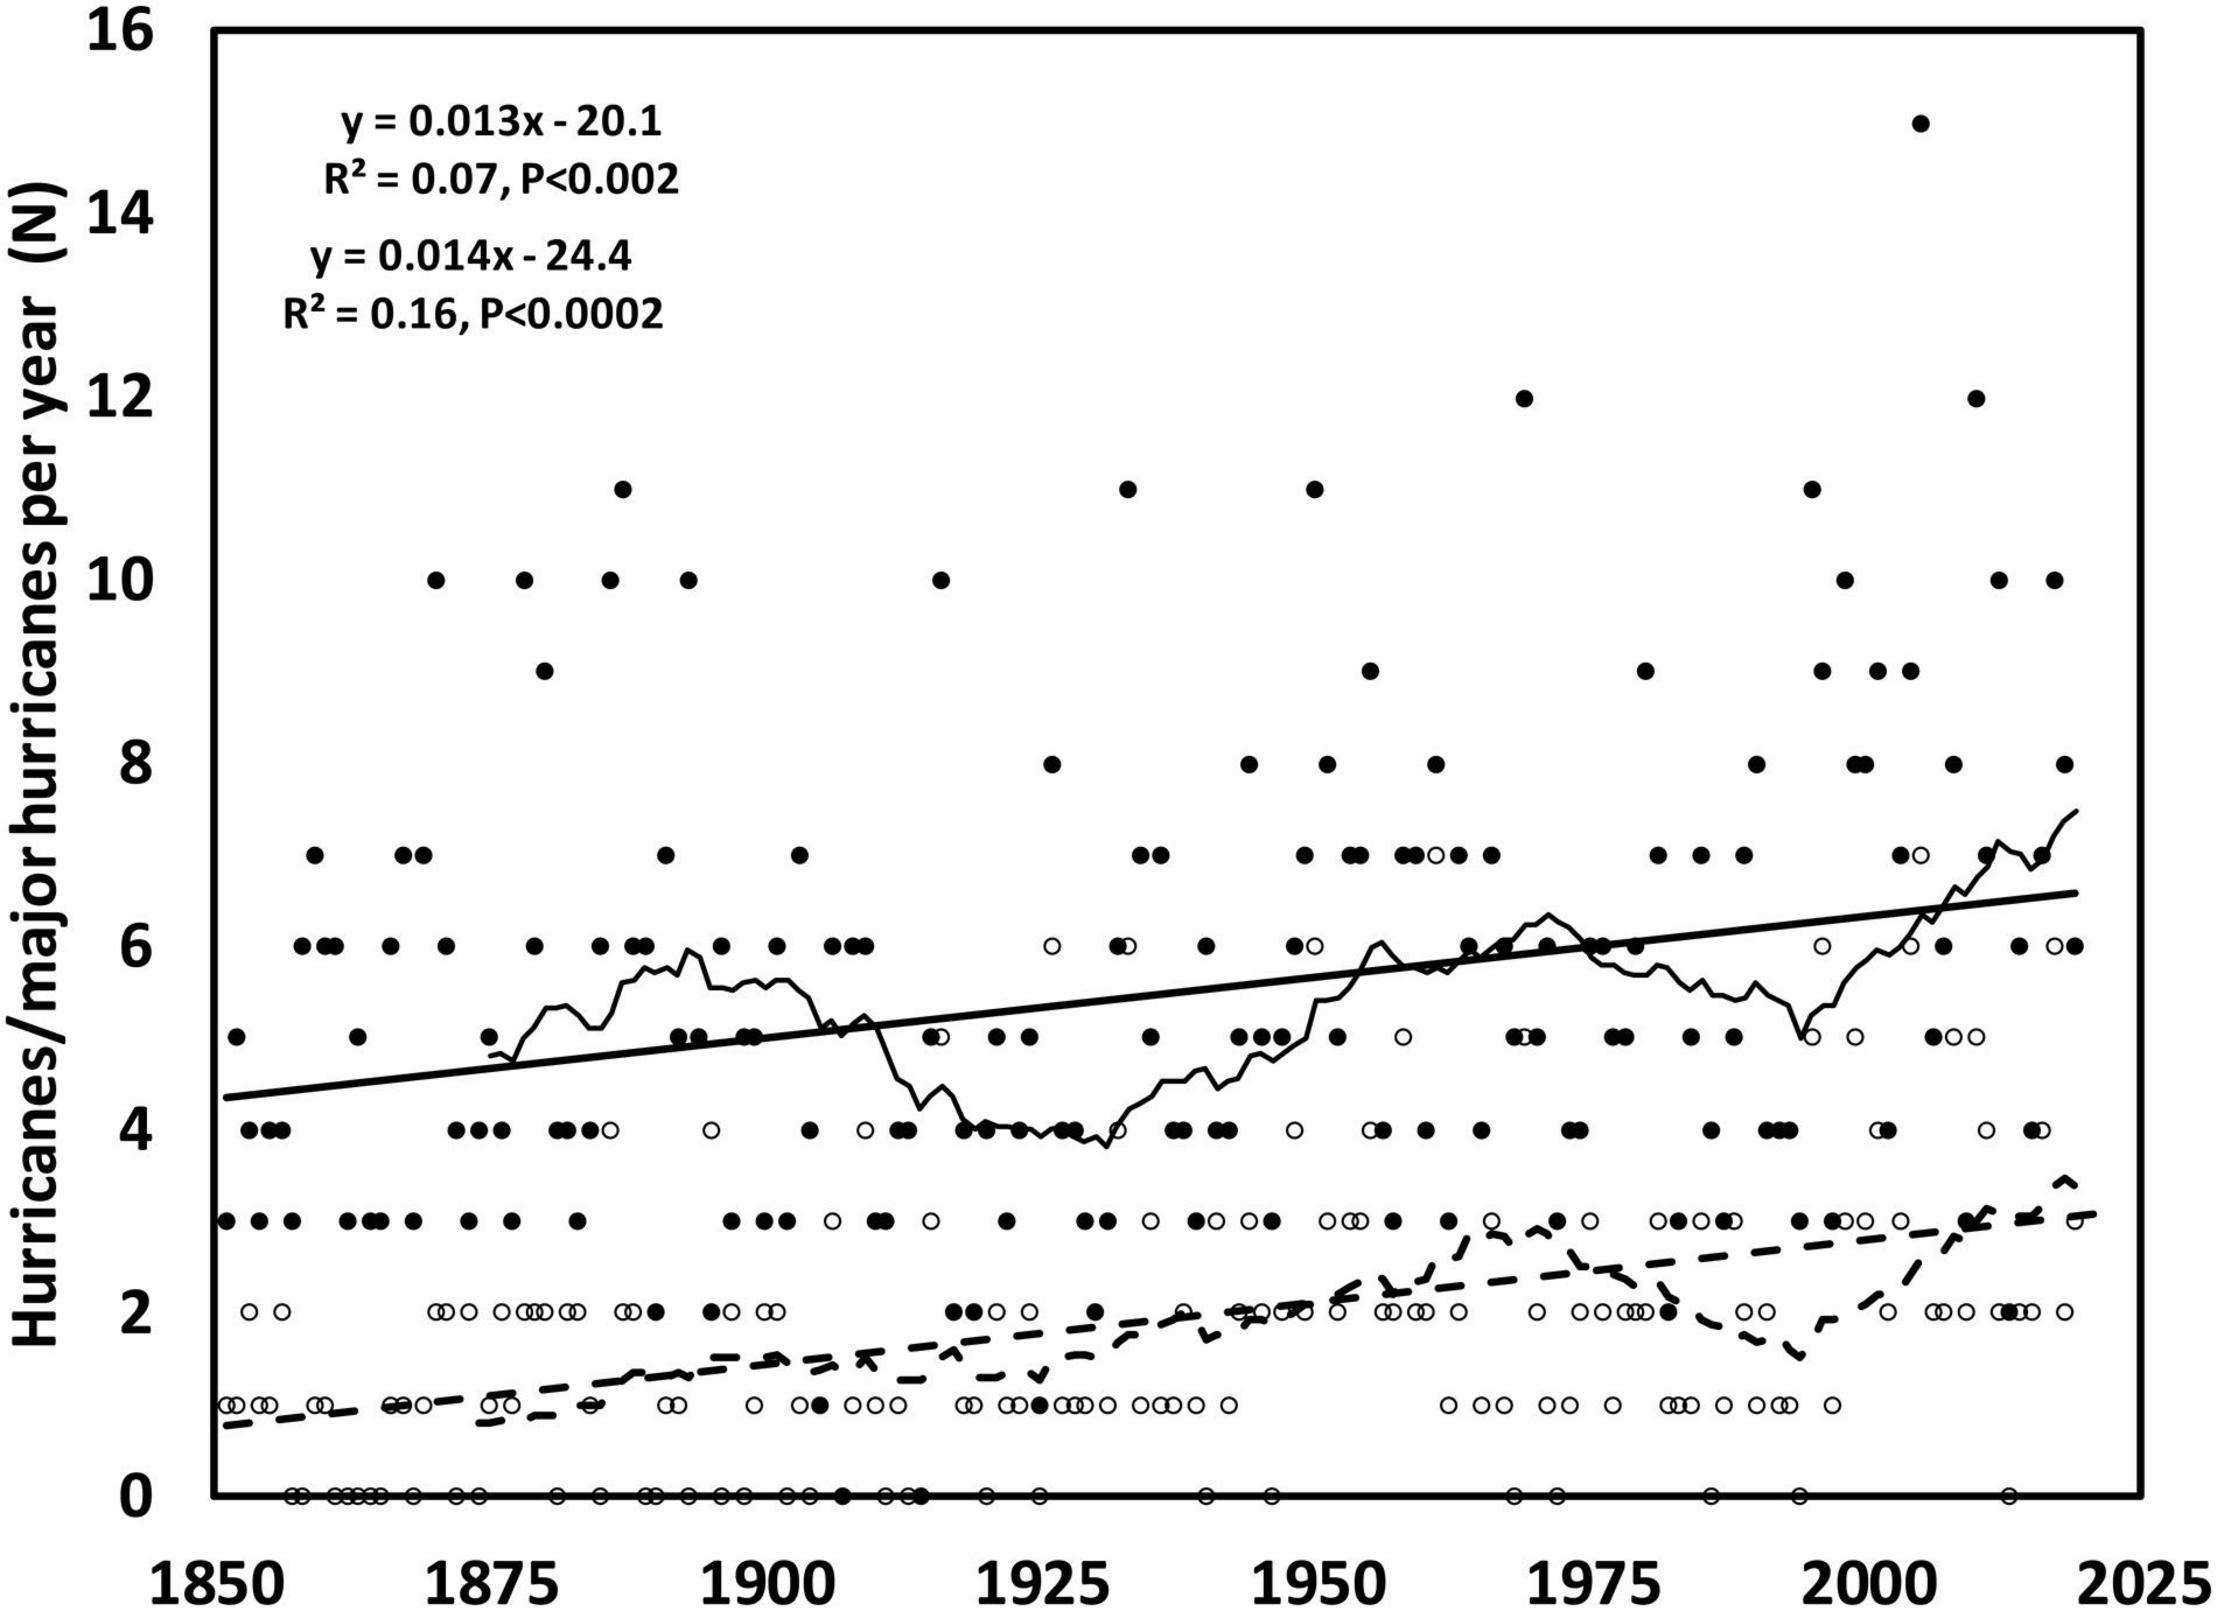
Figure 12. Frequency of annual hurricanes and major hurricanes for North Atlantic Ocean, 1850–present. Thick straight lines are the results of linear regression; thin, varying lines are the 25-year moving averages.
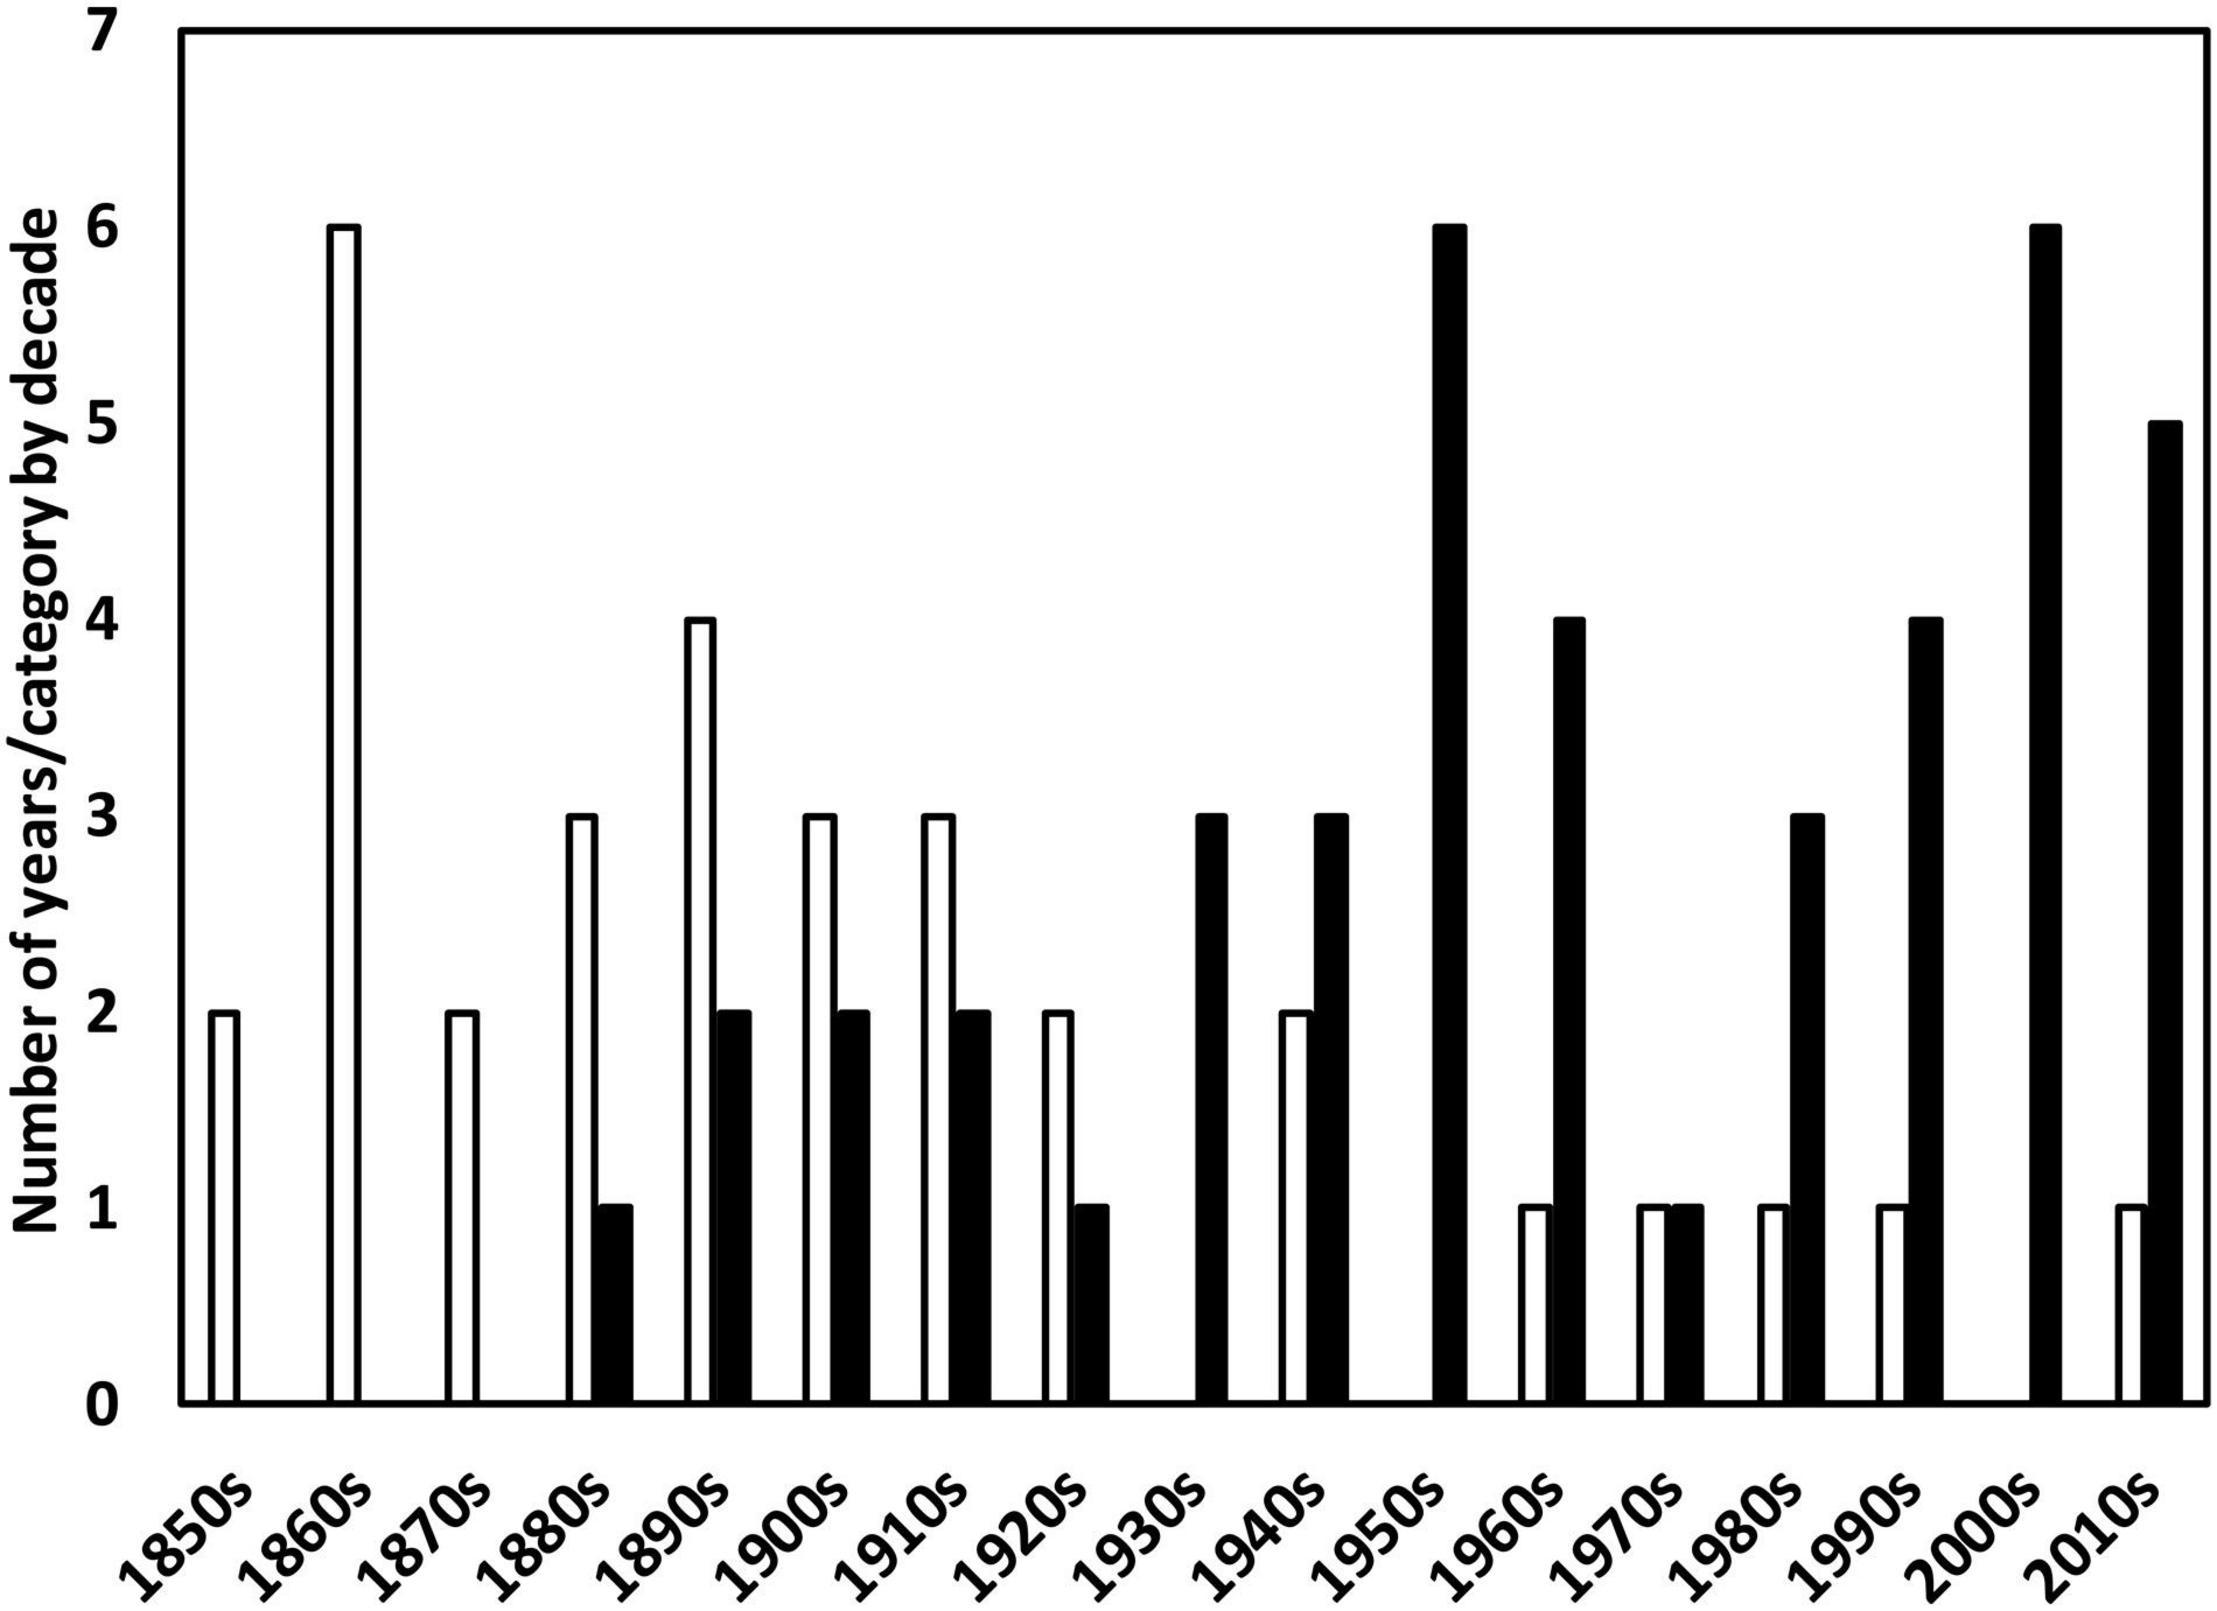
Figure 13. Number of years per decade of no major hurricanes (open bars) and three or more major hurricanes (closed bars).
Clearly, the number of tropical cyclones in the North Atlantic Ocean has increased over the period of record, and has done so across all types—tropical storms, hurricanes, and major hurricanes—suggesting that both frequency and intensity of cyclones are increasing. This indeed represents a “new normal,” as discussed by Lewis et al. (2017). In other words, what is currently considered an “average year” for tropical cyclones is far different from the past (Figure 14). From 1850 to 2000, the mean annual cyclones were 3.5, 3.0, and 2.0 for tropical storms, hurricanes, and major hurricanes, respectively. In the first two decades of the new millennium, these increased to 8.1, 7.0, and 3.2. Thus, from a long-term mean of 6.5 tropical cyclones/year, the North Atlantic now averages 15.1/year.
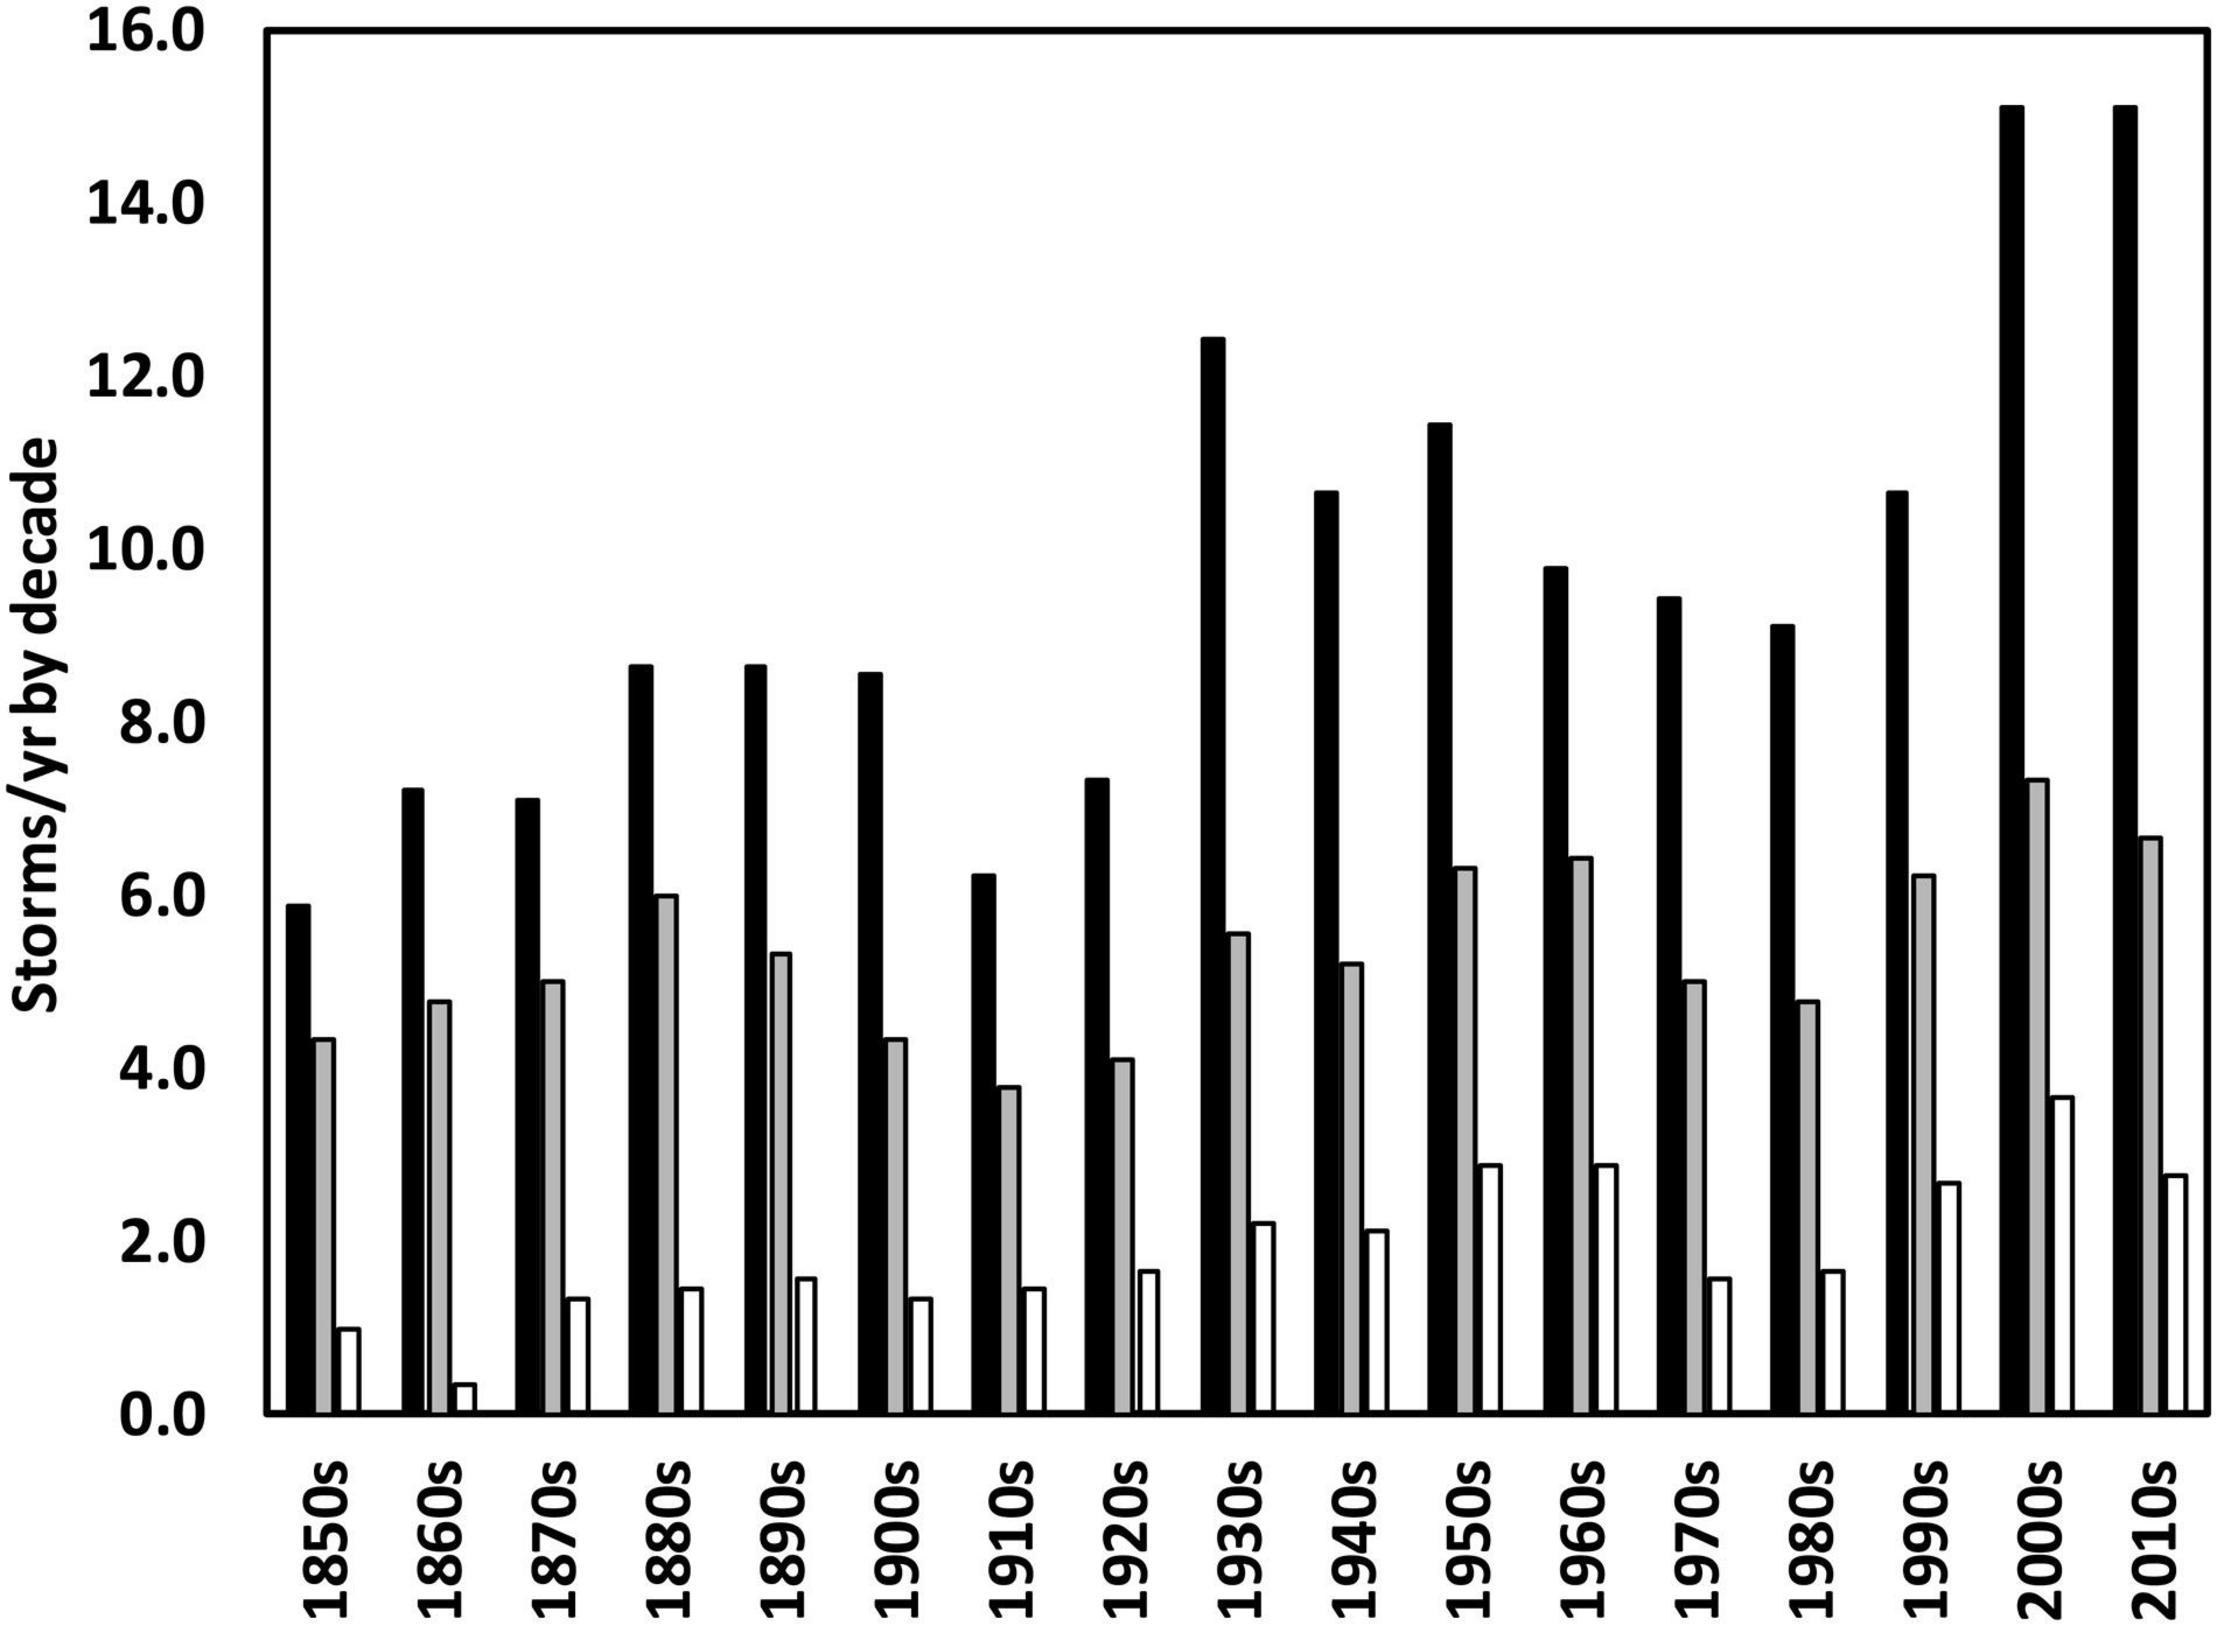
Figure 14. Mean events per year by decade of tropical storms (black bars), hurricanes (gray bars), and major hurricanes (white bars).
The second question addresses the potential relationship between frequency/intensity of tropical cyclones and global warming, and does so using the Pearson product-moment correlation of cyclone number by type and three readily accessed indices of temperature2 : global mean temperature, mean temperature of the Northern Hemisphere, and global mean SSTs. In addition, to address the possibility of a lag time in the response of cyclones to temperature, correlations were also run between cyclone types and the temperature indices of the previous year.
Among the types of tropical cyclones, tropical storms and hurricanes were correlated significantly (P < 0.0001) with all direct (i.e., same year) measures of global temperatures, whereas major hurricanes were correlated significantly with global SST and temperatures of the Northern Hemisphere (Table 2), supporting similar findings for an earlier time period (Gilliam and Platt, 2006). Using temperature anomalies from the previous year improved correlation for tropical storms and, to a lesser extent, major hurricanes. Surprisingly, this was not the case for hurricanes; correlation of hurricanes with current global temperatures was significant (P < 0.003), but not with the previous year’s global temperatures. Thus, there appears to be a lag effect for tropical storms, but less so for higher intensity cyclones. Of all temperature indices, the best correlation with any type of cyclone was the mean temperature for the Northern Hemisphere, which was further improved by using previous years’ data (Table 2).
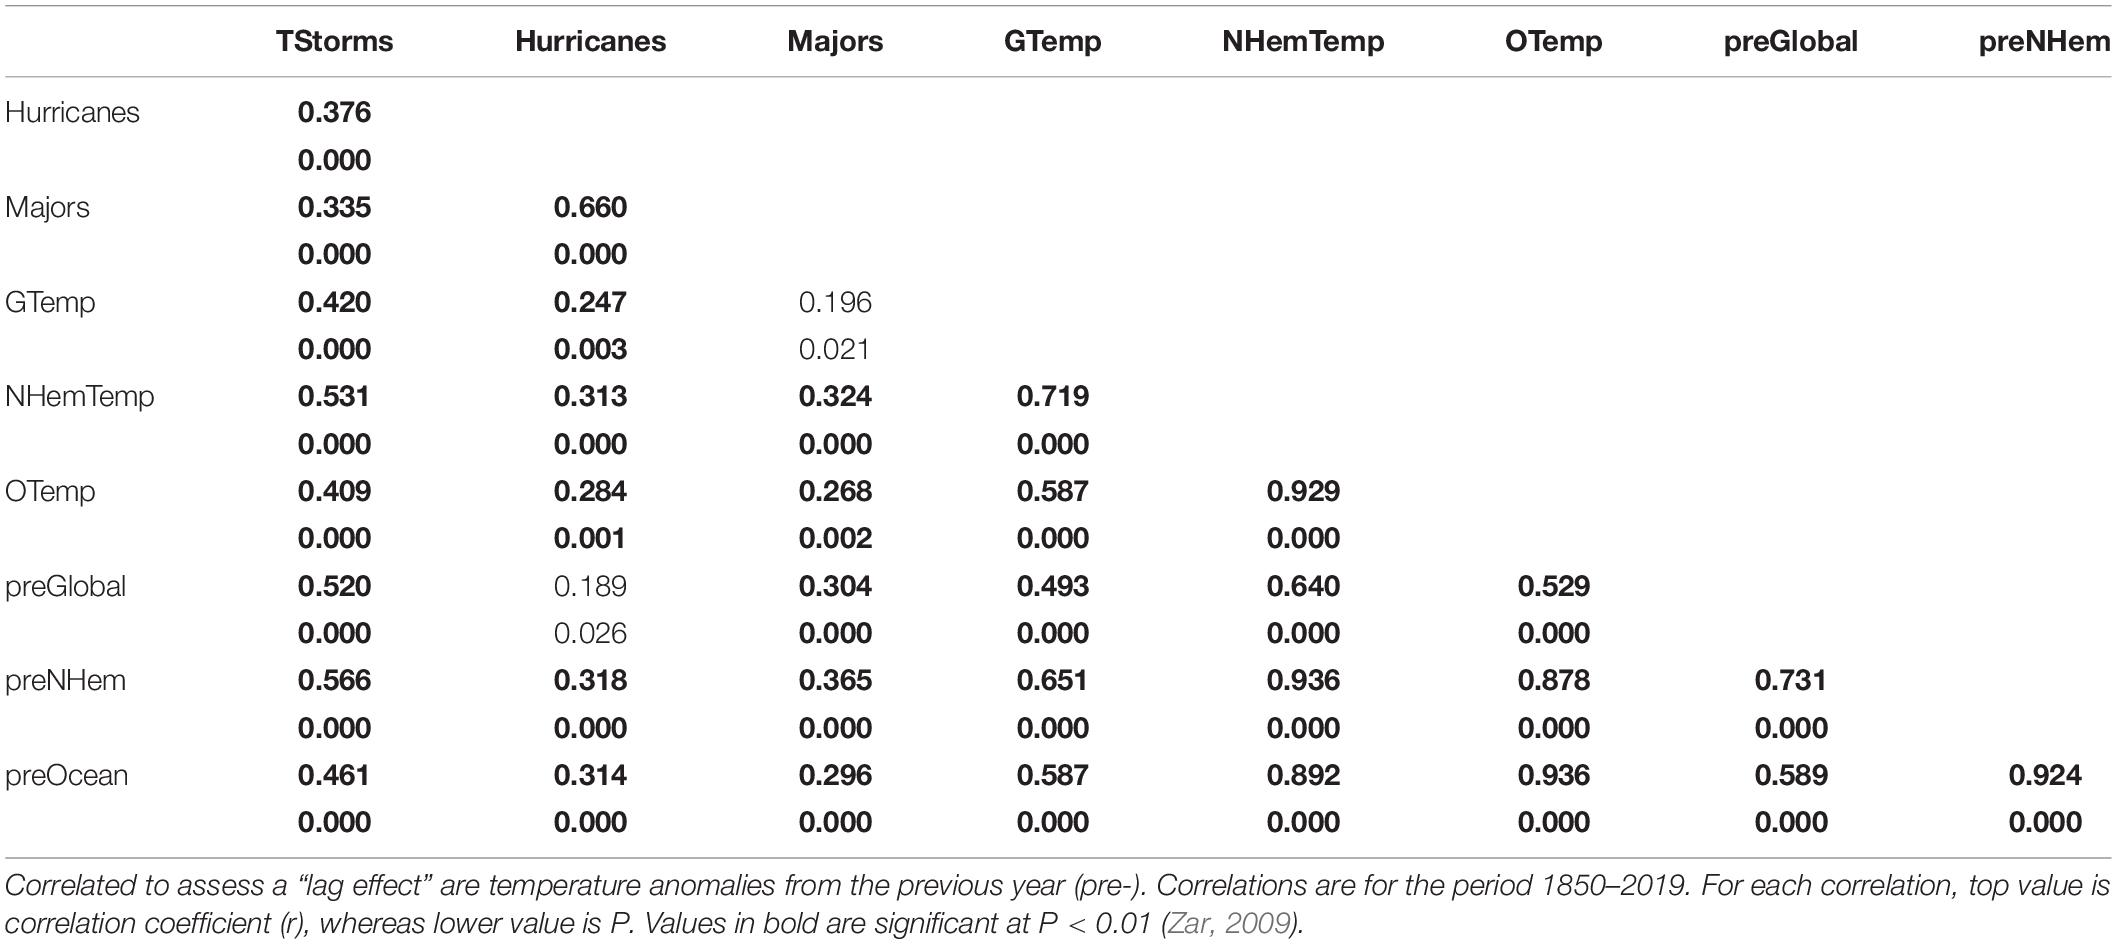
Table 2. Pearson product-moment correlations of annual frequencies of tropical cyclone types [tropical storms (TStorms), hurricanes, and major hurricanes (Majors)] with corresponding annual mean temperature anomalies: mean global temperature (GTemp), mean Northern Hemisphere temperature (NHemTemp), and mean ocean temperature (OTemp).
Summary and Conclusions
Because of currently enhanced sophistication of methods of measurement and computer-driven models, increasingly more is known about tropical cyclogenesis. The essential factors comprise the following: (1) high SST, (2) high relative humidity in the mid-troposphere, (3) large surface-to-500 mb lapse rates of equivalent potential temperature, (4) small tropospheric vertical wind shear, (5) high low-level relative vorticity, and (6) sufficiently high Coriolis force. These vary on both spatial and temporal scales. For example, the Coriolis force is synoptic in scale, increasing with distance from the Equator and exhibiting essentially no diurnal variation; this explains the virtual absence of tropical cyclones along the Equator (Figure 4). By contrast, wind shear affects a much smaller area and can exhibit pronounced diurnal fluctuation. The combination of all factors often generates a considerable interannual variability in the frequency/intensity of tropical cyclones (Figures 11, 12).
Although landfall of tropical cyclones represents only a small percentage of their formation in the North Atlantic (Figure 6), landfall is far more common in the state of Florida than other states (Figure 7). This is largely the result of its location and peninsular shape which results in a great distance of shoreline with the Gulf of Mexico and the Atlantic Ocean. Not surprisingly, most landfall cyclones strike the southern-most tip of the state (Figure 8). Despite past debates on the potential relationship between tropical cyclones and anthropogenic climate warming (e.g., Emanuel, 2005b, c; Landsea, 2005; Pielke, 2005), it is clear that tropical cyclones are increasing in frequency and intensity over time in the North Atlantic Ocean (Figures 11, 12), an increase that appears to be driven, at least in part, by anthropogenic climate warming, consistent with more recent studies (Zhao and Held, 2010; Hosseini et al., 2018).
The degree to which the current scenario for tropical cyclones represents a future threat to longleaf pine ecosystems in general, and in Florida in particular, is unknown. Some models predict that global warming alone—with associated changes in ambient temperatures, growing seasons, and phenologies—may shift the distribution of longleaf pine out of its current extent in Florida (Hansen et al., 2001; Gilliam, 2016). Certainly, more frequent and more intense storms would exacerbate this. As current empirical evidence indicates (e.g., Gang et al., 2020; Zampieri et al., 2020), tropical cyclones no longer occur within the constraints previously suggested by “natural disturbance” models that emphasize the historical role of cyclones in the natural physiognomy of longleaf pine ecosystems (Gilliam et al., 2006).
Coda—The 2020 Atlantic Hurricane Season
All told, including temporal patterns and cyclone/temperature correlations, these data support the contention that global warming has increased both the frequency and intensity of tropical cyclones in the North Atlantic. NOAA refers to the period of June 1 to November 30 of each year as the Atlantic hurricane season, and the 2020 hurricane season has been exceptional in several respects, breaking numerous records. As of the writing of the initial submission of this article, 13 named storms had formed before the end of August 2020, including four hurricanes (Hanna, Isaias, Laura, and Marco, with Laura making landfall as a Category 4 storm) and seven landfalls. This was the earliest on record to have at least 13 named storms in the North Atlantic. As of mid-November, 30 named storms had formed, the most in recorded history. Thus, in the ∼10-week period of September 1 (Hurricane Marco) to November 13, 2020 (Hurricane Iota), an average of 1.7 named storms formed per week. Of the 30 named storms, 13 were hurricanes, including six major hurricanes (1, 4, and 1 each of Category 3, 4, and 5, respectively); 14 storms made landfall.
The toll of the 2020 hurricane season has been substantial, with more than $40 billion in damage and, more tragically, nearly 400 fatalities. From a personal perspective, having experienced the eyewall of Hurricane Sally (Category 2, 165 km/h winds, >76 cm rainfall) for 12 h in Pensacola, Florida, I certainly hope that the 2020 hurricane will remain exceptional, in that we do not experience another like it. Regrettably, data presented in this article, along with those of other studies, suggest otherwise.
Author Contributions
FG conceived of and wrote this review manuscript.
Conflict of Interest
The author declares that the research was conducted in the absence of any commercial or financial relationships that could be construed as a potential conflict of interest.
Footnotes
References
Batista, W. B., and Platt, W. J. (2003). Tree population response to hurricane disturbance: syndromes in a southeastern United States old-growth forest. J. Ecol. 91, 197–212.
Bierly, G. (2005). “Vorticity,” in Encyclopedia of World Climatology. Encyclopedia of Earth Sciences Series, ed. J. E. Oliver (Dordrecht: Springer).
Blaustein, R. J. (2008). Biodiversity hotspot: the Florida Panhandle. Bioscience 58, 784–790. doi: 10.1641/b580904
Booth, B. B. B., Dunstone, N. J., Halloran, P. R., Andrews, R., and Bellouin, N. (2012). Aerosols implicated as a prime driver of twentieth-century North Atlantic climate variability. Nature 484, 228–232. doi: 10.1038/nature10946
Church, J. A., and White, N. J. (2011). Sea-level rise from the late 19th to the early 21st century. Surv. Geophys. 32, 585–602. doi: 10.1007/s10712-011-9119-1
Clement, A., Bellomo, K., Murphy, L. N., Cane, M. A., Mauritsen, T., Radel, G., et al. (2015). The Atlantic Multidecadal Oscillation without a role for ocean circulation. Science 350, 320–324. doi: 10.1126/science.aab3980
Doran, P. T., and Zimmerman, M. K. (2009). Estimating the scientific consensus on climate change. EOS 90, 22–23.
DuBois, M. J., Putman, N. F., and Piacenza, S. E. (2020). Hurricane frequency and intensity my decrease dispersal of Kemp’s ridley sea turtle hatchlings in the Gulf of Mexico. Front. Mar. Sci. 7:301. doi: 10.3389/fmars.2020.00301
Elsner, J. B., and Bossak, B. H. (2004). “Hurricane landfall probability and climate,” in Hurricanes and Typhoons: Past, Present, and Future, eds R. J. Murname and K.-B. Liu (New York, NY: Columbia University Press).
Emanuel, K. A. (1999). The power of a hurricane: an example of reckless driving on the information superhighway. Weather 54, 107–108. doi: 10.1002/j.1477-8696.1999.tb06435.x
Emanuel, K. A. (2005c). Increasing destructiveness of tropical cyclones over the past 30 years. Nature 436, 686–688. doi: 10.1038/nature03906
Frost, C. C. (1993). Four centuries of changing landscape patterns in the longleaf pine ecosystem. Proc. Tall Timbers Fire Ecol. Conf. 18, 17–44.
Gang, C., Pan, S., Tian, H., Wang, Z., Xu, R., Bian, Z., et al. (2020). Satellite observations of forest resilience to hurricanes along the northern Gulf of Mexico. For. Ecol. Manage. 472:118243. doi: 10.1016/j.foreco.2020.118243
Gilliam, F. S. (2016). Forest ecosystems of temperate climatic regions: from ancient use to climate change. New Phytol. 212, 871–887. doi: 10.1111/nph.14255
Gilliam, F. S., and Platt, W. J. (1999). Effects of long-term fire exclusion on tree species composition and stand structure in an old-growth Pinus palustris (Longleaf pine) forest. Plant Ecol. 140, 15–26. doi: 10.1023/A:1009776020438
Gilliam, F. S., and Platt, W. J. (2006). Conservation and restoration of the Pinus palustris ecosystem. Appl. Veg. Sci. 9, 7–10. doi: 10.1111/j.1654-109X.2006.tb00650.x
Gilliam, F. S., Platt, W. J., and Peet, R. K. (2006). Natural disturbances and the physiognomy of pine savannas: a phenomenological model. Appl. Veg. Sci. 9, 83–96. doi: 10.1111/j.1654-109x.2006.tb00658.x
Goldberg, M. H., van der Linden, S., Maibach, E., and Leiserowitz, A. (2019). Discussing global warming leads to greater acceptance of climate science. Proc. Nat. Acad. Sci. U.S.A. 116:14805.
Goldenberg, S. B., and Shapiro, L. J. (1996). Physical mechanisms for the association of El Niño and West African rainfall with Atlantic major hurricane activity. J. Clim. 9, 1169–1187.
Graham, N. E., and Barnett, T. P. (1987). Sea surface temperature, surface wind divergence, and convection over tropical oceans. Science 238, 657–659. doi: 10.1126/science.238.4827.657
Grossmann, I., and Klotzbach, P. J. (2009). A review of North Atlantic modes of natural variability and their driving mechanisms. J. Geophys. Res. 114:D24107.
Hansen, A. J., Neilson, R. P., Dale, V. H., Flather, C. H., Iverson, L. R., Currie, D. J., et al. (2001). Global change in forests: responses of species, communities, and biomes. BioScience 51, 765–779. doi: 10.1641/0006-3568(2001)051[0765:gcifro]2.0.co;2
Hansen, J., Fung, I., Lacis, A., Rind, D., Lebedeff, S., Ruedy, R., et al. (1988). Global climate changes as forecast by goddard institute for space studies three-dimensional model. J. Geophys. Res. 93, 9341–9364. doi: 10.1029/jd093id08p09341
Hansen, J., Johnson, D., Lacis, A., Lebedeff, S., Lee, P., Rind, D., et al. (1981). Climate impact of increasing atmospheric carbon dioxide. Science 213, 957–966. doi: 10.1126/science.213.4511.957
Heyward, F. (1939). The relation of fire to stand composition of longleaf pine forests. Ecology 20, 287–304. doi: 10.2307/1930747
Hiers, J. K., O’Brien, J. J., Will, R. E., and Mitchell, R. J. (2007). Forest floor depth mediates understory vigor in xeric Pinus palustris ecosystems. Ecol. Appl. 17, 806–814. doi: 10.1890/06-1015
Hogland, J., Affleck, D. L. R., Anderson, N., Seielstad, C., Dobrowski, S., Graham, J., et al. (2020). Estimating forest characteristics for longleaf pine restoration using normalized remotely sensed imagery in Florida USA. Forests 11:426. doi: 10.3390/f11040426
Hosseini, S. R., Scaioni, M., and Marani, M. (2018). On the influence of global warming on Atlantic hurricane frequency. Int. Arch. Photogramm. Remote Sens. Spatial Inf. Sci. XLII-3, 527–532. doi: 10.5194/isprs-archives-xlii-3-527-2018
Kirkman, L. K., and Jack, S. B. (2018). Ecological Restoration and Management of Longleaf Pine Forests. Boca Raton, FL: CRC Press.
Klotzbach, P. J., Bowen, S. G., Pielke, R. Jr., and Bell, M. (2018). Continental U.S. hurricane landfall frequency and associated damage: observations and future risks. Bull. Amer. Meteor. Soc. 99, 1359–1376. doi: 10.1175/bams-d-17-0184.1
Knutson, T. R., and Tuleya, R. E. (2004). Impact of CO2-induced warming on simulated hurricane intensity and precipitation: sensitivity to the choice of climate model and convective parameterization. J. Clim. 17, 3477–3495. doi: 10.1175/1520-0442(2004)017<3477:iocwos>2.0.co;2
Landsea, C. W., Franklin, J., and Beven, J. (2015). The Revised Atlantic Hurricane Database (HURDAT2). (May). 1–6. Available online at: http://www.nhc.noaa.gov/data/?text#annual (accessed July 2020).
Landsea, C. W., Pielke, R. A. Jr., Mestas-Nunez, A. M., and Knaff, J. A. (1999). Atlantic basin hurricanes: indices of climatic changes. Clim. Change 42, 89–119. doi: 10.1007/978-94-015-9265-9_9
Leeder, M., and Perez-Arlucea, M. (2006). Physical Processes in Earth and Environmental Sciences. Malden, MA: Blackwell Publishing.
Lewis, S. C., King, A. D., and Perkins-Kirkpatrick, S. E. (2017). Defining a new normal for extremes in a warming world. Bull. Amer. Meteor. Soc. 98, 1139–1151. doi: 10.1175/bams-d-16-0183.1
Mackey, B., Berry, S., Hugh, S., Ferrier, S., Harwood, T. D., and Williams, K. J. (2012). Ecosystem greenspots: identifying potential drought, fire, and climate-change micro-refuges. Ecol. Appl. 22, 1852–1864. doi: 10.1890/11-1479.1
Mann, M. E., and Emanuel, E. A. (2006). Atlantic hurricane trends linked to climate change. EOS 87, 233–244. doi: 10.1029/2006eo240001
Marlon, J. R., Bartlein, P. J., Walsh, M. K., Harrison, S. P., Brown, K. J., Edwards, M. E., et al. (2009). Wildfire responses to abrupt climate change in North America. Proc. Nat. Acad. Sci. U.S.A. 106, 2519–2524.
National Research Council (1979). Carbon Dioxide and Climate: A Scientific Assessment. Washington, DC: The National Academies Press.
Noss, R. F., Platt, W. J., Sorrie, B. A., Weakley, A. S., Means, D. B., Costanza, J., et al. (2015). How global biodiversity hotspots may go unrecognized: Lessons from the North American Coastal Plain. Divers. Distrib. 21, 236–244. doi: 10.1111/ddi.12278
Oreskes, N. (2004). The scientific consensus on climate change. Science 306:1686. doi: 10.1126/science.1103618
Parmesan, C., and Yohe, G. (2003). A globally coherent fingerprint of climate change impacts across natural systems. Nature 421, 37–42. doi: 10.1038/nature01286
Platt, W. J. (1997). “Southeastern pine savannas,” in The Savanna, Barren, and Rock Outcrop Communities of North America, eds R. C. Anderson, J. S. Fralish, and J. Baskin (Cambridge: Cambridge University Press).
Platt, W. J., Evans, G. W., and Rathbun, S. C. (1988). The population dynamics of a long-lived conifer (Pinus palustris). Am. Nat. 131, 491–525. doi: 10.1086/284803
Provencher, L., Litt, A. R., Gordon, D. R., Rodgers, H. L., Herring, B. J., Galley, K. E. M., et al. (2001). Restoration fire and hurricanes in longleaf sandhills. Ecol. Restor. 19, 92–98. doi: 10.3368/er.19.2.92
Renno, N. O., and Ingersoll, A. P. (1996). Natural convection as a heat engine: a theory for CAPE. J. Atmos. Sci. 53, 572–585. doi: 10.1175/1520-0469(1996)053<0572:ncaahe>2.0.co;2
Rosenberg, N. J., Blad, B. L., and Verma, S. B. (1983). Microclimate: The Biological Environment. New York, NY: J. Wiley and Sons.
Rutledge, B. T., Cannon, J. B., McIntyre, R. K., Holland, A. M., and Jack, S. B. (2021). Tree, stand, and landscape factors contributing to hurricane damage in a coastal plain forest: post-hurricane assessment in a longleaf pine landscape. For. Ecol. Manag. 481:118724. doi: 10.1016/j.foreco.2020.118724
Shepherd, J. M., and Knutson, T. (2007). The current debate on the linkage between global warming and hurricanes. Geogr. Compass 1, 1–24. doi: 10.1111/j.1749-8198.2006.00002.x
Sherwood, S., Webb, M. J., Annan, J. D., Armour, K. C., Forster, P., Hargreaves, J. C., et al. (2020). An assessment of Earth’s climate sensitivity using multiple lines of evidence. Rev. Geophys. 58:e2019RG000678.
Stone, G. W., and Finkl, C. W. (eds) (1995). Impacts of hurricane andrew on the coastal zones of Florida and Louisiana: 22-26 August, 1992. J. Coastal Res. 21, 1–364.
Tang, B. H., and Neelin, J. D. (2004). ENSO influence on Atlantic hurricanes via tropospheric warming. Geophys. Res. Lett. 31:L24204.
United States Geological Survey [USGS] (2005). Mount St. Helens—From the 1980 Eruption to 2000. Reston, VA: USGS. USGS Fact Sheet 036-00.
Wong, M. L. M., and Chan, J. C. L. (2004). Tropical cyclone intensity in vertical wind shear. J. Atmos. Sci. 61, 1859–1876. doi: 10.1175/1520-0469(2004)061<1859:tciivw>2.0.co;2
Yan, X., Zhang, R., and Knutson, T. R. (2017). The role of Atlantic overturning circulation in the recent decline of Atlantic major hurricane frequency. Nat. Commun. 8:1695.
Zampieri, N. E., Pau, S., and Okamoto, D. K. (2020). The impact of Hurricane Michael on longleaf pine habitats in Florida. Sci. Rep. 10:8483.
Zehr, R. M. (1992). Tropical Cyclogenesis in the Western North Pacific. NOAA Technical Report NESDIS 61. Washington, DC: U. S. Department of Commerce.
Keywords: tropical cyclogenesis, global warming, Florida, tropical storms, hurricanes, longleaf pine
Citation: Gilliam FS (2021) Impacts of Tropical Cyclones on Longleaf Pine Ecosystems of Florida: Tropical Cyclogenesis, Landfall Frequencies, and Climate Change. Front. Ecol. Evol. 9:595791. doi: 10.3389/fevo.2021.595791
Received: 17 August 2020; Accepted: 05 January 2021;
Published: 09 February 2021.
Edited by:
Roksana Majewska, North-West University, South AfricaReviewed by:
Albertus J. Smit, University of the Western Cape, South AfricaM. M. Ali, Florida State University, United States
Copyright © 2021 Gilliam. This is an open-access article distributed under the terms of the Creative Commons Attribution License (CC BY). The use, distribution or reproduction in other forums is permitted, provided the original author(s) and the copyright owner(s) are credited and that the original publication in this journal is cited, in accordance with accepted academic practice. No use, distribution or reproduction is permitted which does not comply with these terms.
*Correspondence: Frank S. Gilliam, ZmdpbGxpYW1AdXdmLmVkdQ==