 Zackary J. Delisle
 Elizabeth A. Flaherty
 Mackenzie R. Nobbe
 Cole M. Wzientek
 Robert K. Swihart
- Department of Forestry and Natural Resources, Purdue University, West Lafayette, IN, United States
Camera trapping is an effective non-invasive method for collecting data on wildlife species to address questions of ecological and conservation interest. We reviewed 2,167 camera trap (CT) articles from 1994 to 2020. Through the lens of technological diffusion, we assessed trends in: (1) CT adoption measured by published research output, (2) topic, taxonomic, and geographic diversification and composition of CT applications, and (3) sampling effort, spatial extent, and temporal duration of CT studies. Annual publications of CT articles have grown 81-fold since 1994, increasing at a rate of 1.26 (SE = 0.068) per year since 2005, but with decelerating growth since 2017. Topic, taxonomic, and geographic richness of CT studies increased to encompass 100% of topics, 59.4% of ecoregions, and 6.4% of terrestrial vertebrates. However, declines in per article rates of accretion and plateaus in Shannon's H for topics and major taxa studied suggest upper limits to further diversification of CT research as currently practiced. Notable compositional changes of topics included a decrease in capture-recapture, recent decrease in spatial-capture-recapture, and increases in occupancy, interspecific interactions, and automated image classification. Mammals were the dominant taxon studied; within mammalian orders carnivores exhibited a unimodal peak whereas primates, rodents and lagomorphs steadily increased. Among biogeographic realms we observed decreases in Oceania and Nearctic, increases in Afrotropic and Palearctic, and unimodal peaks for Indomalayan and Neotropic. Camera days, temporal extent, and area sampled increased, with much greater rates for the 0.90 quantile of CT studies compared to the median. Next-generation CT studies are poised to expand knowledge valuable to wildlife ecology and conservation by posing previously infeasible questions at unprecedented spatiotemporal scales, on a greater array of species, and in a wider variety of environments. Converting potential into broad-based application will require transferable models of automated image classification, and data sharing among users across multiple platforms in a coordinated manner. Further taxonomic diversification likely will require technological modifications that permit more efficient sampling of smaller species and adoption of recent improvements in modeling of unmarked populations. Environmental diversification can benefit from engineering solutions that expand ease of CT sampling in traditionally challenging sites.
Introduction
Modern society values versatile technological tools. Consider, e.g., the popularity of smartphones, which allow users to send and receive email, text messages, and photographs while simultaneously serving as a calculator, alarm clock, route mapper, and barcode scanner, among other tasks. Similarly, scientists place a premium on versatile tools to advance discovery. Indeed, the term “jackknife” was bestowed by John Tukey on the now-popular statistical resampling method to highlight its versatility in aiding a variety of research tasks (Miller, 1974; Mantel et al., 1982).
Even technological tools that ultimately enjoy widespread use rarely achieve instantaneous popularity. Instead, adoption of a technological innovation depends on communication among members of a population over time, a process termed diffusion (Rogers, 2003). Models of technology adoption via diffusion vary in theoretical motivations (Sarkar, 1998), but an S-shaped product life cycle often depicts a tool's growth in popularity, maturation, and eventual decline (Rogers, 2003). Notable predictors of adoption are the interests and possible uses of the technology by prospective adopters, which may fuel innovative ideas that further enhance adoption while simultaneously diversifying the suite of applications (e.g., Rice, 2017). We are unaware of Rogers's (2003) diffusion model applied to ecology or conservation, and explicit integration of adoption and application diversity into models of diffusion appears uncommon (Atkin et al., 2015). Herein, we enlist an integrated diffusion model to study trends in camera-trapping studies of wildlife.
Camera trap (CT) technology is designed to permit non-invasive data collection motivated by interest in behavior, ecology, and conservation (O'Connell et al., 2011). CT studies first appeared in the early 20th century (Chapman, 1927) and have expanded to encompass a range of species inhabiting freshwater, marine, terrestrial, fossorial, and arboreal habitats (O'Connell et al., 2011).
Prior systematic reviews with a global scope have reported trends in CT adoption and provided useful insight into several aspects of CT research. Five systematic reviews have focused on CT methodology or study design. Cutler and Swann (1999) categorized 107 papers published before 1998 to assess advantages and disadvantages of early trigger mechanisms for different study objectives. Wearn and Glover-Kapfer (2019) used meta-analyses of 104 comparative papers published from 1990 to 2017 to quantify effectiveness of CT vs. other sampling methods and demonstrate 65% greater effectiveness for digital CTs than other methods. Hofmeester et al. (2019) used 47 studies published from 2008 to 2018 to estimate effects on detection for 36 factors related to cameras, CT set-up, target animals, and environment. They concluded that factors affecting detection at the microsite and camera scale likely were most important and offered recommendations for correcting detection issues. Smith et al. (2020) reviewed 331 CT predator-prey studies published from 1994 to 2019, documented that only 9% used experimental approaches, and illustrated temporal trends in observational and experimental predator-prey CT studies as well as their geographic and topic distribution. They presented a conceptual guide and examples for experimental CT studies of predator-prey ecology. Green et al. (2020a) examined 88 CT papers that used spatially explicit capture-recapture (SECR) to estimate population density. Nearly 61% of SECR studies estimated density of wild felids. Green et al. (2020a) noted constraints on precision of SECR estimates, offered suggestions for design-based improvements, and predicted expanded taxonomic application of SECR models that allow inclusion of unidentifiable individuals.
Two additional systematic reviews offered broader treatment of CT research applications. Burton et al. (2015) analyzed 266 CT studies published between 2008 and 2013 that dealt with occurrence, abundance, or behavior. They noted a doubling of papers every 2.9 years over the 6-year period. In addition to evaluating CT equipment, design, and effort, they assessed study composition in relation to geographic, topic, taxonomic, and trait-based (body mass, home-range size) categories. Their review documented increasing prominence of spatial capture-recapture methods for density estimation from 2011 to 2013, reliance on occupancy or relative abundance measures for unmarked populations, and the need for better reporting of methodological details and assumptions. McCallum (2013) reviewed 414 CT studies published from 1994 to 2011 and noted a 73% increase in publications after 2005. Similar to Burton et al. (2015), he assessed study composition in relation to geographic, habitat, topic, and taxonomic categories, noting that 62% of papers included forest habitat, and 53 and 13% of papers addressed felids and canids, respectively. McCallum (2013) also computed rank correlations to show positive temporal trends in fraction of papers devoted to population density and occupancy. He noted that CT research application at the time was restricted taxonomically and by habitat but could be used more broadly in the future.
In this review we assess trends in diffusion of CT technology for wildlife research by jointly considering: (1) adoption of CTs in wildlife research, and (2) diversification of applications by adopters. Wildlife research using camera traps is dynamic, and from 1994 to 2013 CT studies experienced a long lag phase followed by exponential growth (McCallum, 2013, Burton et al., 2015). Our review seeks answers to the following questions: Has adoption of CT technology continued unabated, or has growth decelerated to signify maturation and possible limits to CT research capacity? Has the suite of CT applications expanded geographically, taxonomically, and topically over time, and if so, how? Prior systematic reviews have not formally modeled trends in diversification of CT research applications, perhaps because earlier reviews on average dealt with an order of magnitude fewer articles. We believe modeling of trends offers value for revealing historic patterns and identifying possible constraints and opportunities for future growth in CT use. We introduce a heuristic model to illustrate the development of trajectories along axes of CT adoption and application diversification (Figure 1). The model's key feature is the simultaneous diffusion of CT technology through the population of wildlife researchers and across a portfolio of possible applications. Specifically, growth in adoption by researchers is predicted to be logistic (Rogers, 2003), whereas change in the application trajectory can vary with many factors including technological innovation, shifts in research funding priorities, and interests of other adopters. Although beyond the scope of our review, we believe the adoption-diversification model framework developed here could be usefully applied in other systematic reviews and by social scientists interested in testing competing hypotheses for the evolution and impact of CT or other technology used for research purposes.
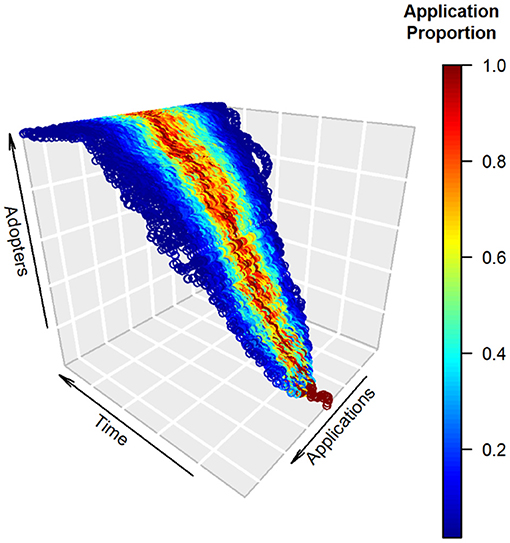
Figure 1. A simple heuristic model of technological diffusion in camera trapping (CT) for which development and ingenuity lead to growth over time in both total adoption and diversification of research applications. The vertical axis depicts growth in technology adopters, which follows the S-shape characteristic of innovation diffusion (Sarkar, 1998). The horizontal applications axis depicts uses of the technology by researchers at a given point in time. Colors represent the relative fraction of uses for each application at a given time, scaled so the application with maximum use at that time receives a value of one. In this example, a core set of applications receives the bulk of uses (red), with peripheral applications receiving lower relative use (blue). The overall breadth of applications grows steadily over time, is accompanied by an expanded set of central “high use” applications, and exhibits reasonable temporal constancy in those applications deemed core vs. peripheral (i.e., stationarity of mean application). Our formulation assigns each adopter in a time step to the application of one of the current CT practitioners with equal probability. It thus allows for interpersonal effects; differential influence of CT researchers also could be modeled in this framework using unequal weights (Magsamen-Conrad and Dillon, 2020). The model assumes: (1) logistic growth with a capacity of 1,000 adopters, and (2) the possibility of application diversification at each time step according to a symmetric trinomial distribution with fidelity (probability = 0.5) to the adopter's current application and equal probability (0.25) of adoption of applications immediately adjacent to the current application. Many alternative mechanisms of diffusion could be formulated; a second simple example is provided online (Supplementary Figure 1). In our review, we measured adoption by number of articles published and considered diversification for three categories of CT applications: research topics, taxonomy, and geography.
Three related objectives guided our comprehensive, quantitative analysis of temporal trends in CT studies from 1994 to 2020. The first two objectives rely on independent examination of the adoption and application axes of our heuristic model (Figure 1). Specifically, we assessed trends in CT adoption by growth in research output, thus serving as an update to the “early adopter” trends already published. Next, we assessed trends in CT applications along three dimensions—topics, taxonomy, and geography—using diversity metrics as indicators of the breadth of CT applications to wildlife research. For our first two objectives, we interpret positive, stabilized, and declining trends as reflecting continued technological diffusion, maturation, and senescence, respectively (Figure 1). We pay special attention to recent trends in components of diversity (2016–2020), because they could signify emerging areas tied to innovation and further expansion of the CT research portfolio. Third, we examined development of CT research in the context of study extent. Large-scale CT networks monitored over long timespans are necessary to address many of the most vexing problems in ecology and conservation, and represent a logical progression for CT growth in the era of big data (Rowcliffe and Carbone, 2008; Steenweg et al., 2017; Kays et al., 2020b). To measure the extent to which progress toward large-scale CT research has occurred, we assessed trends in sampling effort, spatial extent, and temporal duration of CT studies.
Methods
Literature Review
We conducted a keyword search on all databases of Web of Science© for articles published in English from 1994 through 14 August 2020 that contained the key words “camera trap,” “infrared triggered camera,” “trail camera,” “automatic camera,” “photo trap,” “remote camera,” or “remotely triggered camera.” The search was further refined to research areas in the domain of biology and technology (details in online supplement “Web of Science Search”). We excluded duplicate appearances of articles, those not focused on applications to wildlife, and review papers lacking novel field data or methodological advances.
After refinement, we extracted information regarding the research focus of each remaining article. We assigned ≥1 research topic from a list of 26 categories (Table 1) modified from those used by McCallum (2013) and Burton et al. (2015). Topics addressed research objectives that dealt with population-level parameters, occurrence/use of an area, individual-level attributes reflecting behavioral decisions, and advances in technology or analysis (Table 1). We also assigned ≥1 study themes with the intent of categorizing articles into 6 broad classes: (1) “basic science” characterized studies designed to test predictions of theory or increase understanding of biological processes or natural history; (2) “faunal survey” denoted articles whose objective was systematic monitoring or development of species lists or assessment of richness; (3) “conservation” identified studies related to protection or restoration of biodiversity; (4) “management” applied to studies with an objective to further sound consumptive use of harvested species, to control human-wildlife conflict, or to understand wildlife responses to humans and their logging, grazing, farming, or development of land; (5) “method” characterized studies with an objective to evaluate or demonstrate a sampling or analysis method using field data; (6) “trends” denoted articles that assessed long-term or large-scale patterns or projections, typically for conservation, or management purposes.
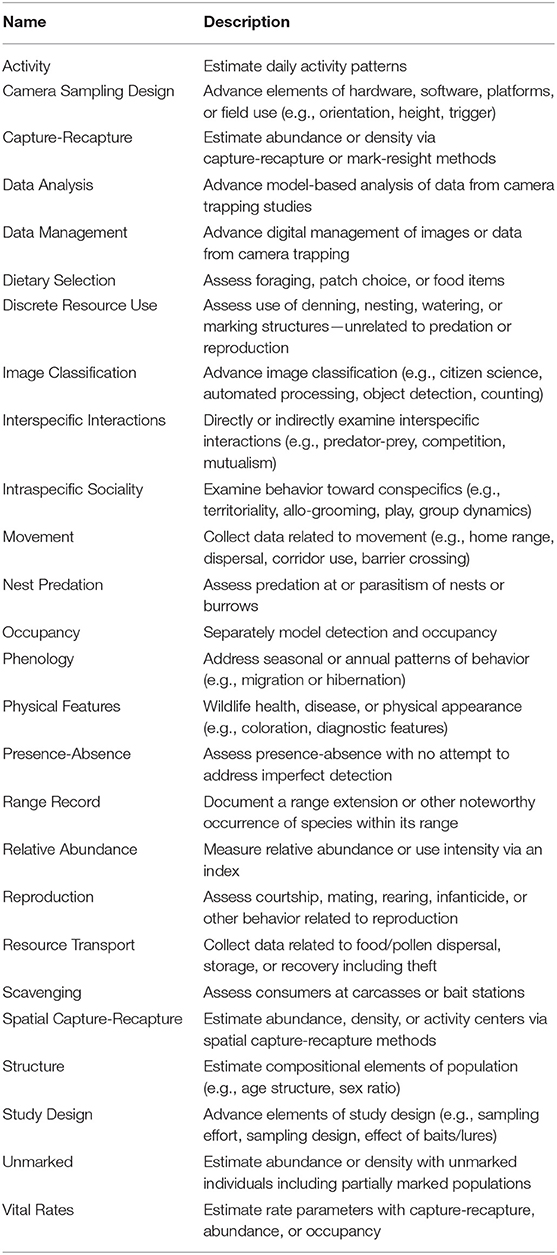
Table 1. Names and descriptions of the 26 topic categories for which camera-trapping studies were scored.
For articles with field data (95% of papers), we assembled lists of the species studied. We used the Global Biodiversity Information System (GBIF) taxonomy as implemented in R package “traitdataform” (Schneider, 2020) to resolve taxonomic synonymies. Classification of mammals was further checked against the taxonomy in Wilson and Reeder (2005), and a few inconsistencies from the fuzzy matching results of “traitdataform” were corrected.
We also recorded locality and habitat information for field-based studies. Specifically, we extracted latitude and longitude in conjunction with maps of study areas to record information about sampled areas (Dinerstein et al., 2017). We used Ecoregions2017©Resolve (https://ecoregions2017.appspot.com/) to assign study sites to continents and countries as well as 846 ecoregions, 14 biomes, and 7 biogeographical realms. At the finest resolution, we recorded whether a study sampled anthropogenic habitat, defined as manmade or highly modified habitat including urban or residential sites, farmland, pastureland, tree plantations, orchards, and cleared, or degraded tropical forest.
We computed indexes of sampling effort and spatiotemporal extent for articles providing relevant information. We used camera days (the sum of days of sampling across all cameras used in a study) as an index of effort because it integrates two separate dimensions of effort (number of cameras and days of sampling). Temporal duration of sampling (in years) was computed whenever start and end dates for sampling were provided. Temporal intensity of sampling was indexed by dividing the number of months in which sampling occurred by the temporal extent of the study, yielding a metric ranging from 0 to 12. Spatial extent of sampling (km2) was recorded when the sizes of focal survey areas were clearly presented in methods or estimated in analyses. We also sought to derive measures of spatial grain, but variability in study designs and descriptions of camera spacing rendered the objective infeasible.
To avoid bias that might result from subtle changes in scoring as we proceeded with the review, articles published from 1994 to 2019 were processed alphabetically by the last names of first authors. While it is conceivable that an alphabetized list could covary with year, we can think of no reason why such covariation should arise. The partial year 2020 was sorted in reverse chronological order and processed after completion of articles published during 1994–2019. Upon completion, a second check of articles was conducted to confirm scoring consistency, correct errors, and catch inadvertent omissions.
Data Analysis
Trends in Adoption and Diversification
For simplicity, we constructed separate models of trends along the adoption axis and the application diversification axis of our model (Figure 1). We assessed changes over time in adoption by modeling number of articles published annually. An exponential pattern is predicted if CT growth witnessed in prior reviews (McCallum, 2013; Burton et al., 2015) has continued unabated. We fitted an exponential model of the form articles = αeβ(year), where eβ is the annual rate of growth. In contrast, a logistic pattern is expected if growth has matured and thus embodies a deceleration phase and asymptote (Rogers, 2003). We fitted a logistic model of the form , where ϕ1 is the asymptotic number of articles and -ϕ2/ϕ3 is the inflection point beyond which time growth decelerates. Models were fitted in R using non-linear least squares, and comparisons were made with AICc (Burnham and Anderson, 2002).
Changes in topic, taxonomic, and geographic diversity of CT studies were assessed with three approaches. First, we constructed accumulation curves to display the rate at which new topics, taxa, and ecoregions were added to the community of CT studies. Greater accumulation is expected in years with more published CT studies, all else equal. Therefore, our second approach assessed trends in the annual per article rate of accretion of new topics, taxa, and ecoregions; a measure akin to per capita growth rate. For our third approach, we computed Shannon's Index (Spellerburg and Fedor, 2003) for each year, i.e., , where pi is the proportional contribution of topic (or taxon or biome) i for the period, and S is the total number of topical (or taxonomic or biome) categories. Proportional contributions, pi, were computed as the number of occurrences of i divided by total occurrences for the S categories in the focal period. For taxa, we conducted three analyses: (1) major taxa, i.e., class or above; (2) orders within Mammalia; and (3) families within Carnivora. Too few CT articles were published from 1994 to 2010 to yield unbiased diversity estimates for each year separately. Consequently, we used simulations to determine that mean estimates of H stabilized at n ≥ 100, and assigned years to bins to satisfy this threshold. Similarly, some pooling of rarely studied taxa was necessary.
Temporal trends in diversification measured by H and per article accretion rate were regressed against year using generalized additive models (GAMs) in R package “mgcv” (Wood, 2020) with low-rank isotropic smooths (Wood, 2003). Adequacy of the smoothing dimension was checked using P-values from simulated residual-variance estimates (Wood, 2017). When we combined articles from multiple years, the year used for regression was determined by weighting each year in the interval by the frequency of articles published in that year divided by the total number of articles in the interval.
Trends in Composition
We analyzed trends in topic, taxonomic, and geographic composition of CT studies using multivariate regression to simultaneously model the probability of occurrence of each topic, taxon, or geographic area as a quadratic or linear function of year using R package “mvabund” (Wang et al., 2012). Unstructured correlation matrices were used to account for large sample size and possible correlation between variables. We fit both complementary log-log and log-odds models, and selected final models using Akaike's Information Criterion and Dunn-Smyth residual checks (Dunn and Smyth, 1996). Analysis of deviance with likelihood ratio tests was used to assess the degree to which covariates improved model fit (Warton et al., 2017), and univariate effects with quasi P < 0.10 were plotted and included in results. We also tested separately for homogeneity of proportions across years using Chi-square tests with quasi P-values determined from 2000 Monte Carlo trials derived from the set of all contingency tables with the observed marginal row and column totals (Hope, 1968). Temporal trends in the study of anthropogenic habitat were assessed via GAM with a binary response.
Trends in Effort and Scale
We analyzed trends in sampling effort and spatiotemporal extent with quantile GAMs (QGAMs) for 0.50 and 0.90 quantiles using R package “qgam” (Fasiolo et al., 2020). We used QGAMs because we reasoned that notable changes in effort and scale were more likely to occur in a small fraction of studies published in a given year. Trend models were constructed for the response variables camera days, area sampled (km2), temporal duration (years), and temporal intensity (months per year sampled). We used low-rank isotropic smooths for QGAM fitting (Wood, 2003), and adequacy of the smoothing dimension was checked using P-values from simulated residual-variance estimates (Wood, 2017). All analyses were performed in R version 4.0.2 (R Development Core Team, 2020).
Results
The Web of Science© search resulted in 2,515 articles. Of these, 2,167 met our criteria for inclusion in the review (see online supplement for PRISMA Flow Diagram and ecoregion, effort, species, and topic data). Most articles addressed multiple topics (49.2%) and species (51.8%), and the proportional contribution of these articles remained fairly consistent over time. Growth in published articles has continued throughout the 2000s, to >300 per year (Figure 2). For applications, diversification in total number of research topics peaked in 2011 and leveled off, whereas growth in total number of species and ecoregions has continued throughout their respective time series (Figure 2). Details of trends along the adoption and application axes are considered in separate sections below.
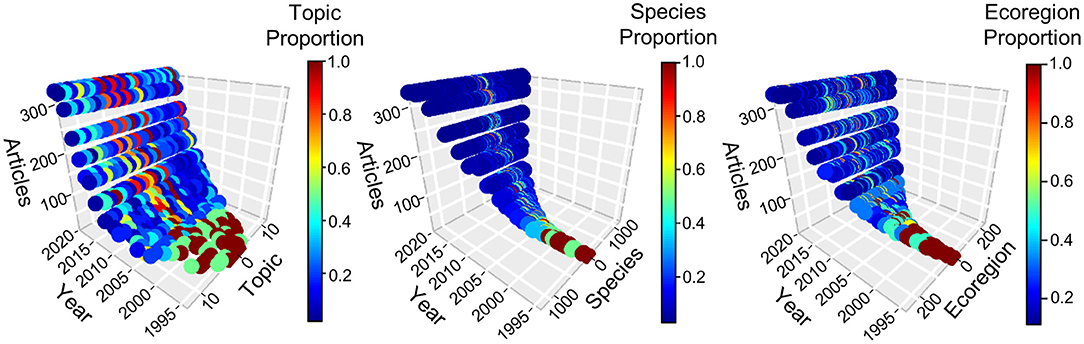
Figure 2. Technological diffusion in camera trapping, 1994–2020. Each panel depicts adoption as number of published articles and one of three categories of CT application: topic, species, and ecoregion. Colors represent the relative fraction of uses for applications at a given time, scaled so the application with maximum use at that time received a value of one. Numeric values were assigned arbitrarily to an application but remained fixed throughout the time series. Detailed assessments of application diversification are presented in subsequent figures. Counts for 2020 were prorated to an annual basis from a search conducted 14 August 2020.
Trends in Adoption
CT research growth has been strong in the 2000s, but that growth appears to have slowed recently. CT articles initially experienced a decade-long lag phase during which annual number of publications never exceeded 10 (Figure 2). Since 2005 CT studies increased at an average annual rate of 1.26 (SE = 0.068). Indeed, annual publication of CT articles increased 5.2-fold in the past decade, and 81-fold since 1994 (Figure 2). Despite robust growth, the logistic model provided a better fit than the exponential model (ΔAICc = 32.9), with deceleration since 2017 and an estimated asymptote of 496 articles (Table 2).
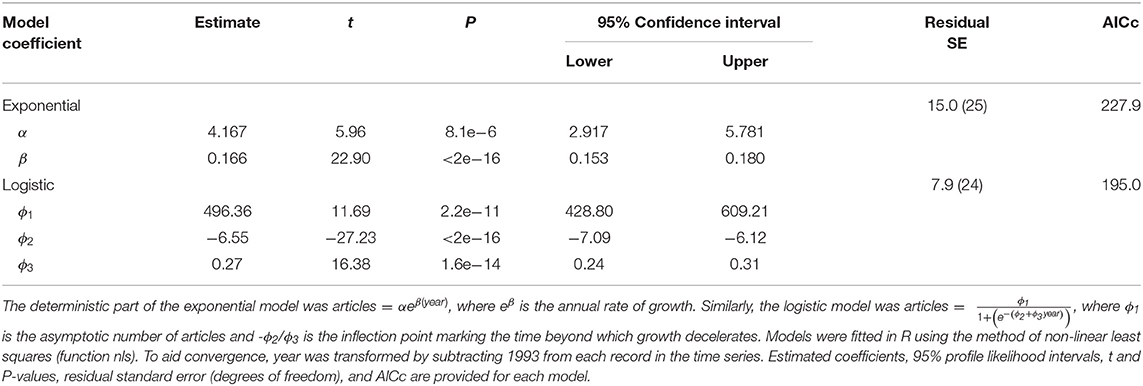
Table 2. Exponential and logistic models fitted to camera-trap articles published annually from 1994 to 2020.
Trends in Diversification
Across the three approaches to measuring change in diversification, evidence for attaining an upper limit was especially strong for topics, with some evidence that diversification has slowed taxonomically and geographically. Species studied by camera trapping totaled 2,416, including 1,080 mammals, 1,023 birds, 169 reptiles and amphibians, 18 fishes, 25 invertebrates, and 101 plants and fungi. Since 2013, a greater mean annual rate of accumulation has occurred for birds (1.22, SE = 0.050) than for mammals (1.09, SE = 0.013). Reptiles and amphibians also increased notably from 2013 to 2020 (Figure 3). CT studies have occurred in 503 of 846 terrestrial ecoregions (Figure 4), increasing at an average annual rate of 1.15 (SE = 0.019) from 2005 to 2020 (Figure 3). Underrepresented areas for CT studies include extreme latitudes, northern Africa, the Middle East, and western Australia (Figure 4). Species and ecoregions (Figure 3) accumulated in a pattern that closely matched the rate of increase in CT articles (Figure 2). In contrast to the concave accumulation curves for species and ecoregions, the rate of topic accumulation gradually slowed until all 26 topics had been included in CT research by 2011 (Figure 3).

Figure 3. Accumulation of topics, species, and ecoregions in camera-trapping articles, 1994–2020.
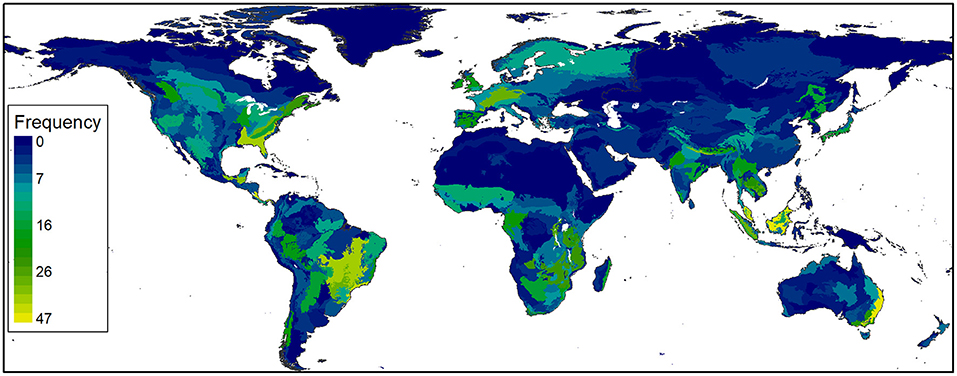
Figure 4. Heat map for frequency of published camera-trapping studies by ecoregion, 1994–2020.
Although overall diversity of species, topics, and ecoregions accumulated steadily in CT studies (Figure 3), the annual per article rate of diversity accretion for each dimension of diversity declined over time (Figure 5). This decline was most dramatic for topics, the least diverse category considered (Figure 5, Supplementary Table 1a; GAM P < < 0.0001, 58.4% of deviance explained). The per article rate of diversity accretion for species was quite variable from 1994 to 2005, with a more consistent linear decline thereafter (Figure 5; GAM P < 0.0001, 49.7% of deviance explained). The trend in annual per article rate of diversity accretion for ecoregions was characterized mostly by stasis in the 1990s, followed by a decline thereafter, with an inflection at around 2013 (Figure 5; GAM P < < 0.00001, 92.3% deviance explained).
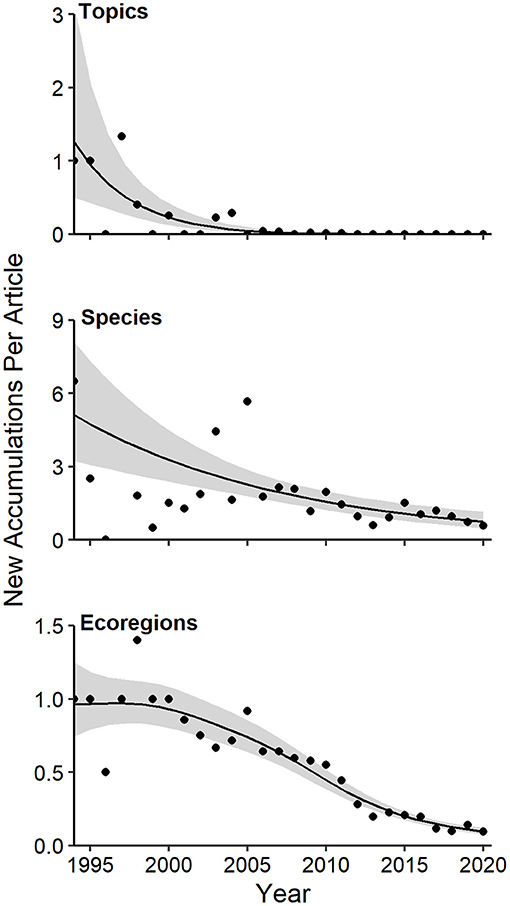
Figure 5. Generalized additive models of annual per article rates of accumulation of topics, species, and ecoregions in camera-trapping articles from 1994 to 2020. Details of model fit are provided in the text and online Supplementary Table 1a. Shaded regions represent standard errors and points represent observed annual per article accumulation rates.
Values of Shannon's H based on the 26 topic areas increased from 2007 to a peak in 2015, and then leveled off (Figure 6, Supplementary Table 1b; GAM P = 0.003, 85.3% of deviance explained). A similar trend was evident for values of Shannon's H based on taxonomic groups at the class or higher level, although GAM smoothing terms were less important (Figure 6, P = 0.052, 67.5% of deviance explained). No temporal trend in diversification of mammalian orders was apparent (GAM P = 0.113, 42.7% of deviance explained). Values of Shannon's H based on families of Carnivora exhibited a steady increase from 2016 to 2020 (Figure 6, GAM P = 0.04, 66.3% of deviance explained). Similarly, values of Shannon's H based on biomes exhibited a strong, non-linear trend, with a decade-long decrease followed by a steady increase since 2012 (Figure 6, GAM P = 0.0005, 90.2% of deviance explained).
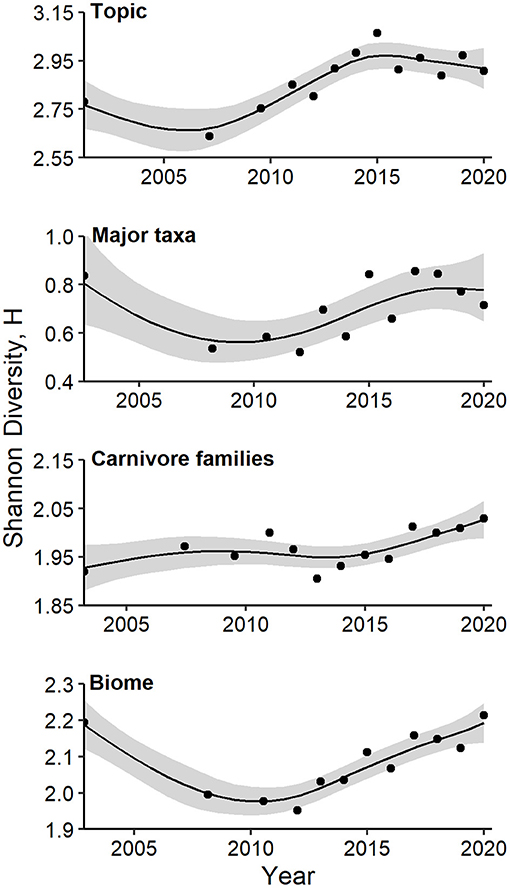
Figure 6. Generalized additive models of Shannon's diversity index, H, as a function of year. Models were fitted for topics, major taxa, and families of carnivores in camera-trapping articles. Details of model fit are provided in the text and Supplementary Table 1b. Shaded regions represent standard errors and points represent observed indices for each time interval.
Trends in Composition
Overall, modeled trends in individual components of diversification revealed increased representation of some topics (e.g., image classification, occupancy) at the expense of studies of marked populations, increased prevalence of some mammalian orders (e.g., Primates, Rodentia) at the expense of carnivores, and shifting representation of biogeographical realms. Multivariate regression and Pearson residuals from tests of homogeneity of proportions produced convergent results for all compositional analyses, hence, we report only the former here (see Supplementary Figures 4–10 for latter result). A strong quadratic association existed between the log-odds of themes and year (Wald X2 for quadratic term = 5.9, P = 0.001). Specifically, the probability of faunal surveys (quadratic Wald = 3.65, P = 0.004) and conservation (quadratic Wald = 3.34, P = 0.005) increased until 2012 and declined thereafter (Figure 7). The probability of methods-oriented articles (quadratic Wald = 3.92, P = 0.002) declined at a decelerating rate to a low in 2018, with a slight uptick more recently (Figure 7). In contrast, the probability of articles addressing management (linear Wald = 3.75, P = 0.002) and trends (linear Wald = 3.03, P = 0.011) generally increased in relative frequency over time. Representation of basic science showed neither linear (Wald = 1.27, P = 0.342) nor quadratic (Wald = 0.13, P = 0.989) trends.
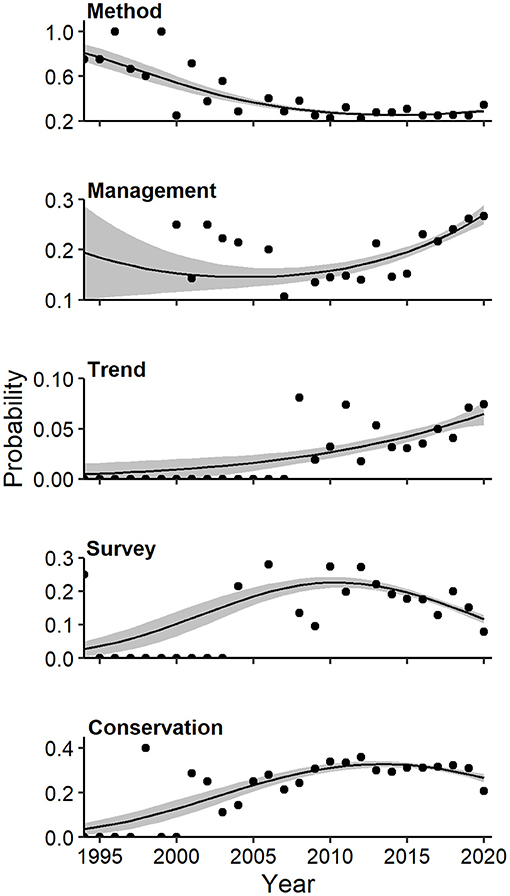
Figure 7. Effects plots of multivariate regression for themes of camera-trapping studies that exhibited temporal trends (P < 0.10) in probability of occurrence. Shaded regions represent standard errors and points represent observed annual proportions.
Multivariate regression identified a strong quadratic component relating log-odds of study topics and year (Wald X2 for quadratic term = 9.77, P = 0.001). The probability of capture-recapture studies (quadratic Wald = 4.75, P = 0.002), spatial capture-recapture studies (quadratic Wald = 3.01, P = 0.058), and range record studies (quadratic Wald = 3.07, P = 0.042) increased to peaks in 2005, 2015, and 2012, respectively, and declined thereafter (Figure 8). In contrast, probability of articles devoted to occupancy (linear Wald = 6.49, P = 0.001), interspecific interactions (linear Wald = 4.16, P = 0.001), and image classification (linear Wald = 4.35, P = 0.001) increased linearly over time, with the latter jumping sharply in the last 2 years (Figure 8).
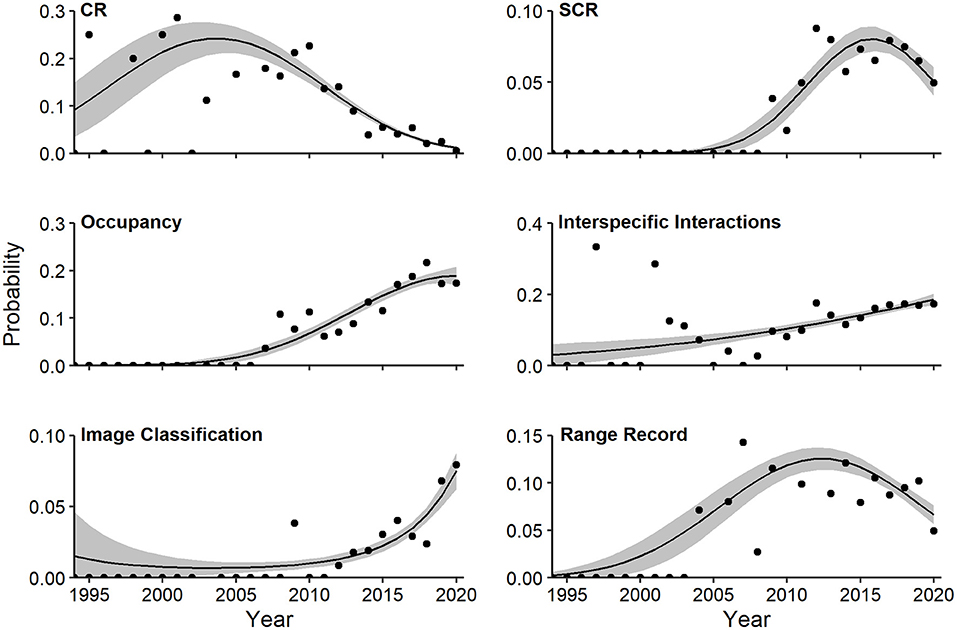
Figure 8. Effects plots of multivariate regression for topics exhibiting temporal trends (P < 0.10) in probability of occurrence in camera-trapping articles. Shaded regions represent standard errors and points represent observed annual proportions. CR, capture-recapture; SCR, spatial capture-recapture. All topics are defined in Table 1.
Mammals predominated among major taxa studied, representing 82.5% of all occurrences. Multivariate regression indicated a strong quadratic trend relating log-odds of major taxonomic classes and year (Wald X2 = 5.55, P = 0.001). The probability of articles devoted to mammals (quadratic Wald = 2.48, P = 0.019) rose slightly to a plateau in the first decade of the millennium (Figure 9). The probability of CT articles on fish/invertebrates (quadratic Wald = 4.21, P = 0.001), herpetofauna (quadratic Wald = 2.65, P = 0.019), and birds (quadratic Wald = 2.86, P = 0.019) all decreased, with rebounds since 2015 in the latter two (Figure 9).
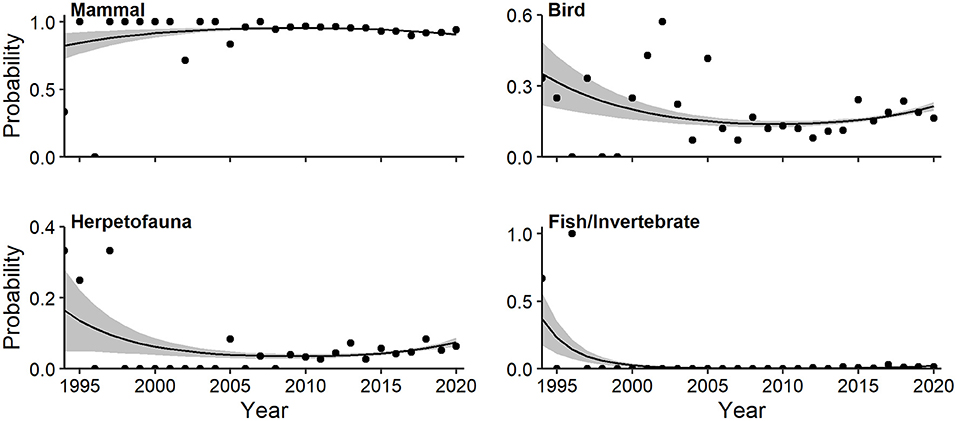
Figure 9. Effects plots of multivariate regression for taxonomic classes exhibiting temporal trends (P < 0.10) in probability of occurrence in camera-trapping articles. Shaded regions represent standard errors and points represent observed annual proportions.
A more focused multivariate regression documented a quadratic trend for log-odds of mammalian orders (Wald X2 = 4.23, P = 0.012). Carnivore probability (quadratic Wald = 3.646, P = 0.004) initially increased, but has declined over the past decade (Figure 10). The probability of primates (linear Wald = 2.806, P = 0.026), rodents (linear Wald = 3.667, P = 0.003), and lagomorphs (linear Wald = 2.448, P = 0.062) have all steadily increased (Figure 10). A family-level multivariate regression documented a significant linear trend for Carnivora (Wald X2 = 5.10, P = 0.006). Both canid (linear Wald = 3.512, P = 0.001) and mustelid (linear Wald = 2.729, P = 0.050) probability increased since 1994 (Supplementary Figure 3).
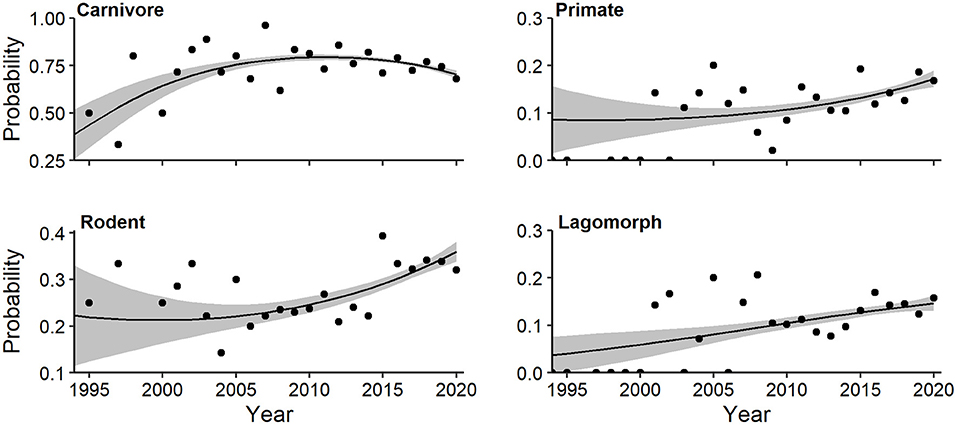
Figure 10. Effects plots of multivariate regression for mammalian orders exhibiting temporal trends (P < 0.10) in probability of occurrence in camera-trapping articles. Shaded regions represent standard errors and points represent observed annual proportions.
Multivariate regression identified a strong quadratic trend relating log-odds of realm and year (Wald X2 for quadratic term = 6.82, P = 0.002). The probability of CT studies in the Afrotropic (linear Wald = 3.644, P = 0.003) and Palearctic (linear Wald = 2.73, P = 0.024) realms increased (Figure 11). Both the probability of Neotropic (quadratic Wald = 3.42, P = 0.004) and Indomalayan (linear Wald = 3.14, P = 0.011) realms peaked near 2010, and declined soon after (Figure 11). The probability of both Nearctic (quadratic Wald = 4.70, P = 0.002) and Oceania (quadratic Wald = 2.50, P = 0.045) realms decreased since 1994, with a slight uptick recently in the former (Figure 11). In contrast, multivariate regression identified a linear trend relating log-odds of biome and year (Wald X2 for quadratic term = 5.09, P = 0.033), but we found no notable univariate relationships. At a finer spatial scale, the probability of anthropogenic habitat in CT studies decreased until 2010, then increased, although model fit was poor (Supplementary Table 1c, Supplementary Figure 2).
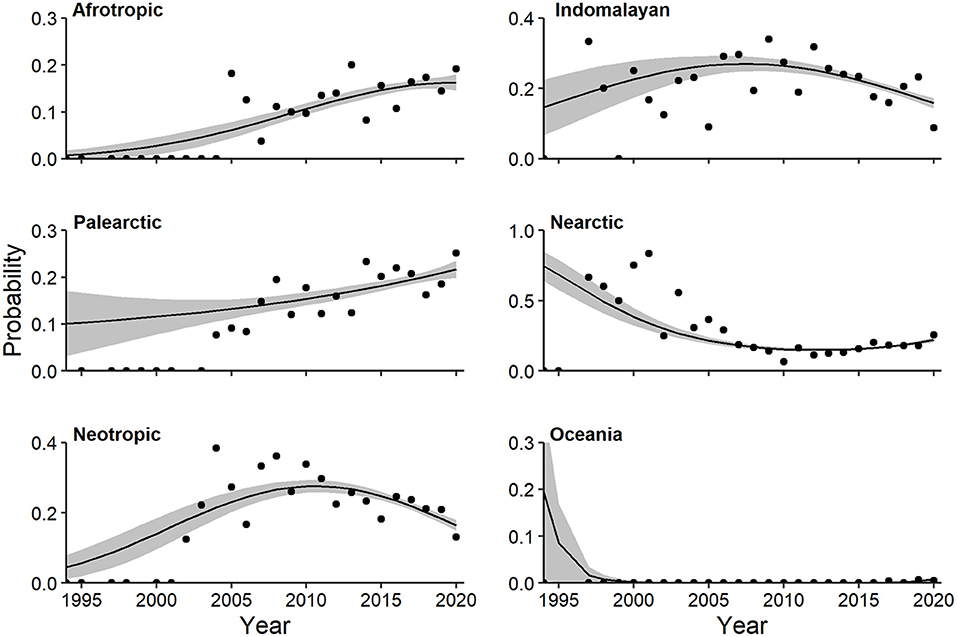
Figure 11. Multivariate regression effects plot of realms exhibiting temporal trends (P < 0.10). Shaded regions represent standard errors and points represent observed annual proportions.
Trends in Effort and Scale
Effort and scale variables exhibited strong positive skew, and 6 of 8 QGAMs yielded smoothing terms with strong (P ≤ 0.02) support for increasing trends (Supplementary Table 1d). For camera days, median values increased steadily over time, whereas the 0.9 quantile did not increase consistently until 2013 but rose at a more rapid rate thereafter (Figure 12). The median and 0.90 quantiles for spatial extent of CT studies increased steadily from 1994 to 2020, with a greater rate for the latter (Figure 12). No trend was evident for the median temporal extent, whereas a positive trend was notable for the 0.90 quantile (Figure 12). Temporal intensity, the number of months of camera sampling per year of study, increased at the median but not at the 0.90 quantile (Figure 12).
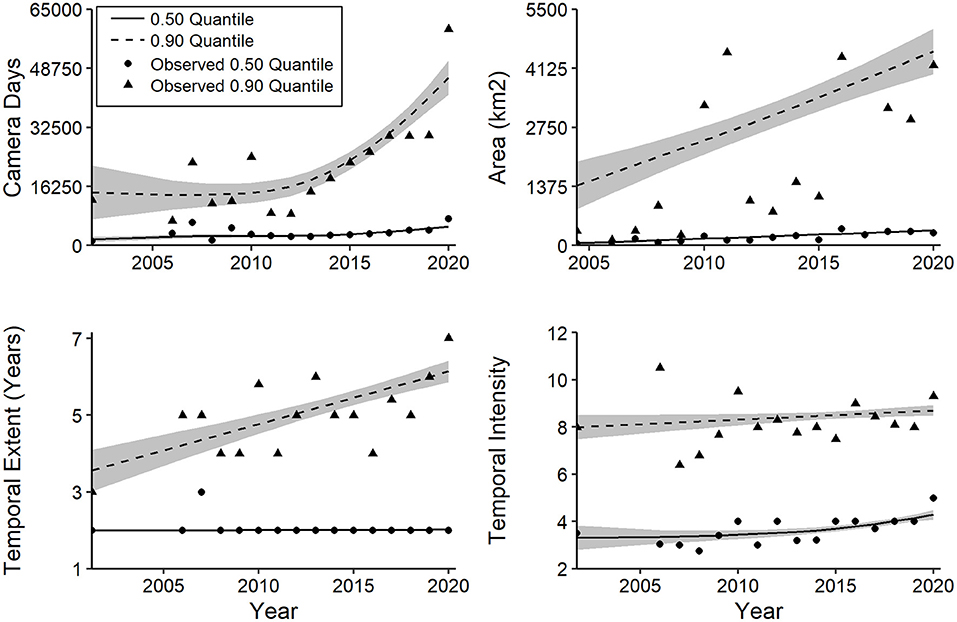
Figure 12. Generalized additive quantile models for trends in camera-trapping effort and scale based on median and 0.90 quantiles. Details of model fit are provided in the text and Supplementary Table 1d. Shaded regions represent standard errors.
Discussion
Trends in Camera Trap Adoption and Applications
Wildlife research with camera traps has exhibited pronounced trends in overall adoption and in diversification of its application to topics, ecoregions, and taxa. Adoption experienced a prolonged lag phase followed by strong growth since 2005 (Figure 2), as is typical during technological diffusion (Rogers, 2003). Importantly, our modeling suggests that CT adoption is approaching the early stages of technology maturation, with some deceleration in publication rate since 2017 and a predicted asymptote of 496 papers per year. We urge caution when interpreting this result, as the estimates are based on few points beyond the estimated inflection midpoint and thus could change substantially in the next few years. Nonetheless, the period of unabated growth in CT articles appears to have ended.
Diversification trends for CT applications were more complex, but tended to show signs that diffusion has slowed recently. For a constant rate of technological diffusion and a finite number of applications, universal adoption occurs sooner for a smaller number of available applications. In our topic, ecoregion, and taxonomic categories, we considered 26 research topics, 846 ecoregions, and >35,000 species (mammals, birds, and herpetofauna) and observed 100, 59.4, and 6.4% coverage, respectively. At least for simple accumulation metrics, CT research has thus reached the upper limit set by our system of categorizing topics, whereas in the 7.5 months of 2020 covered by our systematic review there were 19 new ecoregions and 118 new species studied using CTs.
Accumulation metrics (Figure 3), while informative, constrain inference about diversification of CT applications in the same ways that reliance on species richness limits inference about biodiversity. Specifically, trends from accumulation metrics reveal nothing about per capita rates of accretion, how CT research is distributed among applications, or the extent to which the study of individual topics, taxa or ecoregions has changed. Topics, taxa, and ecoregions all exhibited declining per article accretion rates over time, with research topics exhibiting the steepest decline, as expected for a category with greater density (i.e., application) dependence. Shannon's diversity index plateaued for research topics and major taxa in the last 5 years following a decade of growth, suggesting attainment of upper limits to topic and taxonomic diversification in CT research. Surpassing these limits will require scientific or technological innovation that expands the application niche space for future CT research to enable greater study of under-represented topics, species or environments for which current CT study is difficult or impossible. Within this context we explore six limitations to CT diversification suggested by our review, present possible solutions, and speculate on whether solutions will offer incremental improvements to “hard” limits of CT technology or more sweeping growth opportunities.
Next-Generation Camera Trap Research: Elements of an Expanded Portfolio
The Challenge of Individual Identification
Trends in individual research topics revealed shifts that may reflect new developments, conservation priorities, or efforts to overcome technological obstacles. We observed a dramatic decline in capture-recapture CT studies since 2005, a more recent dip in spatial capture-recapture studies since 2016, and a consistent increase in occupancy studies since 2007. These changes reflect shifts in the focus of CT studies.
An inability to identify individuals is a limitation common to most of the taxa increasingly represented in CT studies. We suspect that many researchers unable to identify individuals shifted their focus to estimates of occupancy (Burton et al., 2015; Sollmann, 2018) or to indexes of abundance, both of which can be useful and cost-effective alternatives (Steenweg et al., 2019). In particular, occupancy can be linearly related to abundance if survey length is short in relation to animal movement and variation among areas does not affect behavior (Parsons et al., 2017; Steenweg et al., 2018). However, occupancy generally is less informative than abundance, and failure of indexes to incorporate imperfect detection in the sampling process can lead to flawed inference (Kellner and Swihart, 2014; Kéry and Royle, 2015). Moreover, station- and animal-level variation in detectability of CTs can be considerable (McIntyre et al., 2020; Moll et al., 2020). Gilbert et al. (2020) reviewed methods for estimating abundance of unmarked populations with CTs, explicitly considered underlying assumptions, and provided decision rules for practitioners contemplating their use. Methods reviewed include unmarked spatial mark-resight (Chandler and Royle, 2013), partial-identity models (Augustine et al., 2019; Macaulay et al., 2020), site-structured models (Kéry and Royle, 2015), the random-encounter model and extensions (Rowcliffe et al., 2008; Nakashima et al., 2018, 2020), time-to-event, space-to-event, and instantaneous-sampling models (Moeller et al., 2018), and CT distance sampling (Howe et al., 2017, 2019; Cappelle et al., 2019). In the short term we expect the fraction of studies dealing with unmarked populations to grow, with increasing reliance on recently developed methods by those seeking estimates of abundance. The guidance provided by Gilbert et al. (2020), coupled with improved accessibility of software and continued methodological refinement including integrated likelihood models (e.g., Ngoprasert et al., 2019; Maronde et al., 2020), should result in improved decision making and possibly greater adoption by future CT studies focused on abundance estimation.
Inference on Interspecific Interactions
Increases in studies examining interspecific interactions also emerged from our analysis. Indirect assessments of predator-prey interactions predominated, based primarily on estimated activity overlap and, less frequently, spatial co-occurrence (e.g., Bischof et al., 2014; Delibes-Mateos et al., 2014). As noted by Smith et al. (2020), experimental studies of interspecific interactions were relatively rare. We suspect that greater focus on experiments designed to test mechanistic drivers of interspecific interactions will fuel continued growth in CT studies. Increased experimental focus of anthropogenic and environmental factors on behavior generally and interspecific interactions specifically would benefit understanding even more if coordinated across studies and sites (Frey et al., 2017). Recent advances in the use of CT data to model dynamics of perceived risk (Palmer et al., 2017), use intensity from spatially recurrent events (Keim et al., 2019), and joint overlap along spatiotemporal dimensions (Cusack et al., 2017; Hepler and Erhardt, 2020) promise to expand study of interspecific interactions still further.
Automated Image Classification
The most dramatic recent rate of increase in CT topics occurred in the area of automated image classification. Our findings are consistent with Christin et al. (2019), who found that nearly 70% of 87 papers published on deep neural network applications in ecology, when considering papers published by December 2018, were published in 2017 or 2018. Among these papers, the dominant use was for image processing. The increased attention reflects attempts to address a major constraint of CT studies conducted at large spatial or temporal scales, namely, the effort necessary to classify the staggering number of images often collected. The observed increases in camera days, spatial extent, and temporal extent for the top 10% of large-scale CT studies reflect their value to improve ecological understanding and aid conservation and management efforts at local and global spatial scales (Pollock et al., 2002; Rich et al., 2017; Steenweg et al., 2017). The high rates of increase for the top 10% relative to the median are likely because the objectives of many studies can be addressed at smaller spatiotemporal scales. At the largest spatiotemporal scales, though, many researchers could be limited by hardware costs and the capacity to process images. Further proliferation of non-invasive CT sampling will rely on inexpensive hardware to enable widespread image collection, and software to automate extraction of data (Kitzes and Schricker, 2019). We focus on software needs, since needs related to hardware development were considered by Glover-Kapfer et al. (2019; also see Other considerations). Large-scale studies can quickly amass hundreds of thousands to millions of images that can take years to classify. For example, during a study of white-tailed deer (Odocoileus virginianus) in Indiana, USA (Swihart et al., 2020), we accumulated >2.2 million images in two winters (55,621 CT nights from an average of 432 cameras) and achieved a manual classification rate of ~450 images/hour for 582,000 images. Manual processing of one million images at these rates would require 1.1 person-years of effort (40 h/week), a level of effort that is seldom feasible, even though it improves on the 2.7 person-years required by citizen science volunteers (Swanson et al., 2015). Image classification clearly poses a substantial impediment to continued growth in large-scale CT studies (Ahumada et al., 2020).
Automated image classification using machine-learning algorithms has the potential to break the bottleneck imposed by manual classification and substantially expand CT adoption among researchers. Specifically, deep convolutional neural networks (DNN) can classify one million images in <10 h on a standard laptop computer (Tabak et al., 2019) and can identify empty images as well as humans (96.6–99.8%; Norouzzadeh et al., 2018; Ahmed et al., 2019; Sundaram and Loganathan, 2020). Unfortunately, these models suffer from two shortcomings when identifying species (Schneider et al., 2020a): (1) worse performance for rarer species with few (<500) training images; and (2) poor transferability, i.e., declines in performance when classifying images from cameras not in the model training set (Miao et al., 2019; Green et al., 2020b). Worse performance on rare species is concerning because rare species are of greatest conservation interest, but poor transferability is arguably more serious because it limits classification performance for rare species by augmentation with training images from other sites/sources. Therefore, transferability is a major obstacle to application of DNN models for CT studies in which camera locations, and thus backgrounds, change over time. Approaches to improving transferability include: (1) increasing the diversity of sites, and hence backgrounds, on which to train DNN models (Tabak et al., 2020), and (2) filtering out the background and focusing classification on animal features contained within images. The second currently has two variants: (1) process images using k-means cluster analysis and graph cutting to construct animal regions in each image and subject animal regions to a DNN for species classification (Ahmed et al., 2019), and (2) use coupled pre-trained object detection and DNN models with active learning on cropped animal images (Norouzzadeh et al., 2021). Additional contributions in machine learning for CT images will likely streamline data extraction, including automation of individual identification (Schneider et al., 2020b), distance estimation (Egri et al., 2019), labeling of behaviors, and counting of individuals (Norouzzadeh et al., 2018, 2021). Integrating machine learning with citizen science programs can further improve conversion of images to data (Green et al., 2020b). Data extraction from videos using machine learning may also provide opportunities for quick retrieval of behavioral data and species identification (Conway et al., 2020).
Enhanced Sampling of Microfauna
CT research thus far has focused predominantly on mammals >1 kg, even though the median body weights for mammals and birds are 86 g and 38 g, respectively (Blackburn and Gaston, 1994, 1998). Technological CT advances that heighten trigger response, improve sensor performance, and diminish weather-related inefficiencies are needed to reduce field-related issues with data acquisition (Glover-Kapfer et al., 2019), and we urge modifications devoted specifically to sampling small species. Minor modifications of existing technology will suffice in some cases, although resulting growth in species studied likely will be incremental rather than transformational. For example, Tennant et al. (2020) found that camera traps modified to a close-focal distance of 40 cm detected endangered shrews (Sorex ornatus, <10 g) at 89% of stations, and Mos and Hofmeester (2020) sharpened images of weasels (Mustela nivalis and M. erminea, <250 g) by placing a +2-diopter lens in front of the camera. Without any modifications to a close-focusing Bushnell camera, Ortmann and Johnson (2020) documented detection probabilities >0.8 for brown rats (Rattus norvegicus) traveling 0.6−2.0 m from the CT, 0.4−1 for nectar-feeding birds 0.6 m away, and <0.1 for the same birds at 2 m. Yoshioka et al. (2020) devised an inexpensive and energy-efficient CT that successfully detected Sympetrum dragonflies at perching sites, and concluded that automated monitoring of small insects with CTs was realistic.
Enhanced Sampling of Habitats and Strata
CT studies have been restricted largely to terrestrial species, even though many vertebrates are primarily arboreal, fossorial, or aquatic. Expanding CT sampling into novel ecoregions, strata, and habitats is likely; indeed, McCallum (2013) noted early evidence of this trend in grasslands and wetlands. Challenges to expansion often will be largely logistical, and CT use will remain low in novel environments as long as more suitable sampling alternatives exist with more favorable information return per unit of investment. Nonetheless, arboreal CT sampling has been used to detect species of conservation concern (Mills et al., 2016; Suzuki and Ando, 2019), survey arboreal fauna (Gregory et al., 2014), and gain insight into ecological processes such as seed dispersal and frugivory (Rivas-Romero and Soto-Shoender, 2015; Godoy-Güinao et al., 2018). For instance, Nekaris et al. (2020) and Chan et al. (2020) used CTs to monitor endangered vertebrates crossing manmade arboreal canopy bridges in fragmented forest landscapes. Aquatic CT sampling has been more limited, although McCleery et al. (2014) designed a floating camera trap to sample small mammals in tidal habitats, and applications in fisheries science are accumulating (Struthers et al., 2015; Salman et al., 2019). Modifications also are needed to expand CT sampling of seasonally inaccessible terrestrial species. For instance, Soininen et al. (2015) designed a camera trap capable of detecting small mammals in subnivean environments.
Infrastructure to Facilitate Complex, Coordinated Studies
Steenweg et al. (2017) articulated a vision for interconnected global networks of CTs, and our trend assessment supports the need for such networks. Especially as the spatial and temporal extent of CT sampling expands, coordination of investigators to address sophisticated questions will benefit from accessibility to large repositories of labeled CT images and the development of flexible software to be used for data processing and analysis. Several large repositories already exist. These include Wildlife Insights powered by Google (Thau et al., 2019; http://wildlifeinsights.org; 6.6 million classified images of 1,064 species worldwide), the North American Camera Trap Images data set (Tabak et al., 2019; http://lila.science/datasets/nacti; 3.7 million classified images of 28 animal groups across North America), the Snapshot Serengeti data set (Swanson et al., 2015; http://lila.science/datasets/snapshot-serengeti; 7.1 million classified images of 60 animal groups across the African Serengeti), and the eMammal repository (McShea et al., 2016; https://emammal.si.edu/; ca. 16 million images). Wildlife Insights (Ahumada et al., 2020) and Microsoft AI for Earth (https://www.microsoft.com/en-us/ai/ai-for-earth) host trained classification models to which CT users can submit unlabeled images for classification, or contribute labeled images for further model improvement. The trained DNN model MLWIC2 is available as an R Shiny App (Tabak et al., 2020), and customized pre-trained object detection software using YOLOv2 is also available (Falzon et al., 2020). Useful software for organization and analysis of CT data exists in open source format, e.g., R packages “camtrapR” (Niedballa et al., 2016) “activity” (Rowcliffe et al., 2014; Rowcliffe, 2019), “unmarked” (Chandler et al., 2020), and “AHMbook” (Kéry et al., 2017). Testing sophisticated hypotheses related to, e.g., population dynamics, will become more feasible as databases expand and are accompanied by advances in modeling methods (Kéry and Royle, 2020). We agree with the premise of Ahumada et al. (2020); armed with tools to improve image acquisition, streamline image processing, facilitate data sharing, and guide and enhance data analysis, next-generation CT studies promise to expand our understanding of wildlife species and aid in their conservation over unprecedented spatial and temporal scales.
Other Considerations
We have stressed six considerations that our trend analyses suggest are important to future CT research, but we do not presume the list to be exhaustive. We acknowledge that important advances on other fronts, such as study design (Steenweg et al., 2018; Kays et al., 2020a), are needed to improve the reliability of knowledge obtained from next-generation CT research. More generally, economic, engineering, and political considerations will influence future adoption and applications of CT. Specifically, cost of cameras is perhaps the single greatest limitation to expanded CT adoption (Glover-Kapfer et al., 2019). In addition to cheaper cameras, engineering solutions for improved sensor performance, faster triggers, extended battery life, and protection from temperature, humidity and theft were identified as important current constraints or development priorities in global surveys of researchers using CTs (Rovero et al., 2013; Glover-Kapfer et al., 2019), and are likely essential to significant expansion of the CT research portfolio. Many of these constraints arise because wildlife researchers represent a secondary market for CT manufacturers; most cater to the recreational hunter rather than the needs of the wildlife research community (Ahumada et al., 2020). Consequently, differences in sensor sensitivity occur across brands and even different models of the same brand (Meek et al., 2015; Heiniger and Gillespie, 2018). Such variation has implications for whether CT data are repeatable and comparable (Apps and McNutt, 2018; Hofmeester et al., 2019). In particular, reliable knowledge emanating from large collaborative studies using merged data sets will require quality control standards that encompass sensor quality and metadata structure (Meek et al., 2014; Forrester et al., 2016). Empirical measurement of CT sensitivity in the field (Hofmeester et al., 2017; Apps and McNutt, 2018) including systematic measurement and reporting of factors affecting detectability (Hofmeester et al., 2019) are important elements to successful integration of data from multiple sources. Notwithstanding the progress noted for large CT data repositories in the preceding section, numerous operational obstacles to CT data sharing exist including restrictive policies by some national, provincial, and state governments, lack of consensus on data rights and intellectual property, and limited financial support for digital data curation (Kays et al., 2020b). Practical solutions have been proposed for several of these issues, with Wildlife Insights as an implementation platform (Ahumada et al., 2020).
Conclusion
The adoption-application diversification model of technological diffusion provided a useful context in which to evaluate trends in CT research. Overall adoption has grown at a robust rate but shows recent signs of slowing. Trends in application diversity showed signs of recent plateaus, with greater evidence of stagnation for research topics than for taxa and ecoregions. Will future CT research diversify to address new topics, capture more species, and sample a wider array of environmental conditions? We are optimistic and believe that further topical diversification of next-generation CT research likely will rely on an ability to ask complex questions using images collected over unprecedented spatiotemporal extents, processed into data with the aid of machine learning, shared across multiple platforms in a coordinated manner, and analyzed with increasingly sophisticated statistical tools. Taxonomic diversification will require technological modifications that permit more efficient sampling of smaller species and adoption of recent improvements for modeling unmarked populations. Environmental diversification will rely on engineering solutions that allow sampling in previously inaccessible sites. We believe the elements identified by our review are important to an expanded next-generation portfolio of CT applications.
Data Availability Statement
The original contributions presented in the study are included in the article/Supplementary Material, further inquiries can be directed to the corresponding author/s.
Author Contributions
ZD and RS conceptualized and designed the study, collected data, and drafted the manuscript. ZD conducted data analysis, with input from RS. EF, MN, and CW collected data, commented on earlier drafts and data collection procedures, and assisted with manuscript formatting. All authors approved the final version for submission.
Funding
Funding was provided by Indiana DNR grant W-48-R-02 and by Purdue University. Support for EF provided by the USDA National Institute of Food and Agriculture, Hatch Project #1019737.
Conflict of Interest
The authors declare that the research was conducted in the absence of any commercial or financial relationships that could be construed as a potential conflict of interest.
Acknowledgments
We thank P. McGovern, E. May, L. Guang, A. Reibman, F. Zhu, and Y-H. Lu for helpful discussions on camera trapping generally and image processing specifically. P. McGovern provided comments on an earlier version of the manuscript. We are indebted to Jason Fisher and William McShea for helpful comments on the manuscript. This paper is a contribution of the Integrated Deer Management Project, a collaborative research effort between Purdue University and the Indiana Department of Natural Resources (DNR)—Division of Fish and Wildlife.
Supplementary Material
The Supplementary Material for this article can be found online at: https://www.frontiersin.org/articles/10.3389/fevo.2021.617996/full#supplementary-material
References
Ahmed, A., Yousif, H., Kays, R., and He, Z. (2019). Semantic region of interest and species classification in the deep neural network feature domain. Ecol. Inform. 52, 57–68. doi: 10.1016/j.ecoinf.2019.05.006
Ahumada, J. A., Fegraus, E., Birch, T., Flores, N., Kays, R., O'Brien, T. G., Palmer, J., et al. (2020). Wildlife insights: a platform to maximize the potential of camera trap and other passive sensor wildlife data for the planet. Environ. Conserv. 47, 1–6. doi: 10.1017/S0376892919000298
Apps, P., and McNutt, J. W. (2018). Are camera traps fit for purpose? A rigorous, reproducible and realistic test of camera trap performance. Afr. J. Ecol. 56, 710–720. doi: 10.1111/aje.12573
Atkin, D. J., Hunt, D. S., and Lin, C. A. (2015). Diffusion theory in the new media environment: toward an integrated technology adoption model. Mass Commun. Soc. 18, 623–650. doi: 10.1080/15205436.2015.1066014
Augustine, B. C., Royle, J. A., Murphy, S. M., Chandler, R. B., Cox, J. J., and Kelly, M. J. (2019). Spatial capture-recapture for categorically marked populations with an application to genetic capture-recapture. Ecosphere 10:e02627. doi: 10.1002/ecs2.2627
Bischof, R., Ali, H., Kabir, M., Hameed, S., and Nawaz, M. A. (2014). Being the underdog: an elusive small carnivore uses space with prey and time without enemies. J. Zool. 293, 40–48. doi: 10.1111/jzo.12100
Blackburn, T. M., and Gaston, K. J. (1994). The distribution of body sizes of the world's bird species. Oikos 70, 127–130. doi: 10.2307/3545707
Blackburn, T. M., and Gaston, K. J. (1998). The distribution of mammal body masses. Divers. Distrib. 4, 121–133. doi: 10.1046/j.1365-2699.1998.00015.x
Burnham, K. P., and Anderson, D. R. (2002). Model Selection and Inference: A Practical Information-Theoretic Approach. New York, NY: Springer-Verlag.
Burton, A. C., Neilson, E., Moreira, D., Ladle, A., Steenweg, R., Fisher, J. T., et al. (2015). Wildlife camera trapping: a review and recommendations for linking surveys to ecological processes. J. Appl. Ecol. 52, 675–685. doi: 10.1111/1365-2664.12432
Cappelle, N., Després-Einspenner, M. L., Howe, E. J., Boesch, C., and Kühl, H. S. (2019). Validating camera trap distance sampling for chimpanzees. Am. J. Primatol. 81:e22962. doi: 10.1002/ajp.22962
Chan, B. P. L., Lo, Y. F. P., Hong, X. J., Mak, C. F., and Ma, Z. (2020). First use of artificial canopy bridge by the world's most critically endangered primate the Hainan gibbon Nomascus hainanus. Sci. Rep. 10, 1–9. doi: 10.1038/s41598-020-72641-z
Chandler, R., Kellner, K., Fiske, I., Miller, D., Royle, A., Hostetler, J, et al. (2020). R Package Unmarked: Models for Data From Unmarked Animals. Version 1.0.0. Available online at: https://cran.r-project.org/web/packages/unmarked/index.html
Chandler, R. B., and Royle, J. A. (2013). Spatially explicit models for inference about density in unmarked or partially marked populations. Ann. Appl. Stat. 7, 936–954. doi: 10.1214/12-AOAS610
Christin, S., Hervetm, É., and Lecomte, N. (2019). Applications for deep learning in ecology. Methods Ecol. Evol. 10, 1632–1644. doi: 10.1111/2041-210X.13256
Conway, A. M., Durbach, I. N., McInnes, A., and Harris, R. N. (2020). Frame-by-frame annotation of video recordings using deep neural networks. bioRxiv. 1–21. doi: 10.1101/2020.06.29.177261
Cusack, J. J., Dickman, A. J., Kalyahe, M., Rowcliffe, J. M., Carbone, C., Macdonald, D. W., et al. (2017). Revealing kleptoparasitic and predatory tendencies in an African mammal community using camera traps: a comparison of spatiotemporal approaches. Oikos 126, 812–822. doi: 10.1111/oik.03403
Cutler, T. L., and Swann, D. E. (1999). Using remote photography in wildlife ecology: a review. Wildl. Soc. Bull. 27, 571–581.
Delibes-Mateos, M., Diaz-Ruiz, F., Caro, J., and Ferreras, P. (2014). Activity patterns of the vulnerable guina (Leopardus guigna) and its main prey in the Valdivian rainforest of southern Chile. Mamm. Biol. 79, 393–397. doi: 10.1016/j.mambio.2014.04.006
Dinerstein, E., Olson, D., Joshi, A., Vynne, C., Burgess, N. D., Wikramanayake, E., et al. (2017). An ecoregion-based approach to protecting half the terrestrial realm. BioScience 67, 534–545. doi: 10.1093/biosci/bix014
Dunn, P. K., and Smyth, G. K. (1996). Randomized quantile residuals. J. Comput. Graph. Stat. 5, 236–244. doi: 10.1080/10618600.1996.10474708
Egri, O., Zak, E., and C3d Augmented Reality Solutions Ltd. (2019). Distance Estimation Using Multi-Camera Device. U.S. Patent No 10,192,312 B2. Washington, DC: U.S. Patent and Trademark Office.
Falzon, G., Lawson, C., Cheung, K. W., Vernes, K., Ballard, G. A., Fleming, P. J. S., et al. (2020). ClassifyMe: a field-scouting software for the identification of wildlife in camera trap images. Animals 10:58. doi: 10.3390/ani10010058
Fasiolo, M., Wood, S. N., Zaffran, M., Nedellec, R., and Goude, Y. (2020). R Package ‘qgam’: Smooth Additive Quantile Regression Models. Version 1.3.2. Available online at: https://cran.r-project.org/web/packages/qgam/index.html
Forrester, T., O'Brien, T., Fegraus, E., Jansen, P. A., Palmer, J., Kays, R., et al. (2016). An open standard for camera trap data. Biodiversity Data Journal 4:e10197. doi: 10.3897/BDJ.4.e10197
Frey, S., Fisher, J. T., Burton, A. C., and Volpe, J. P. (2017). Investigating animal activity patterns and temporal niche partitioning using camera-trap data: challenges and opportunities. Remote Sens. Ecol. Conserv. 3, 123–132. doi: 10.1002/rse2.60
Gilbert, N. A., Clare, J. D., Stenglein, J. L., and Zuckerberg, B. (2020). Abundance estimation methods for unmarked animals with camera traps. Conserv. Biol. 1–12. doi: 10.1111/cobi.13517
Glover-Kapfer, P., Soto-Navarro, C. A., and Wearn, O. R. (2019). Camera-trapping version 3.0: current constraints and future priorities for development. Remote Sens. Ecol. Conserv. 5, 209–223. doi: 10.1002/rse2.106
Godoy-Güinao, J., Diaz, I. A., and Celis-Diez, J. L. (2018). Confirmation of arboreal habits in Dromiciops gliroides: a key role in chilean temperate rainforests. Ecosphere 9:e02424. doi: 10.1002/ecs2.2424
Green, A. M., Chynoweth, M. W., and Sekercioglu, C. H. (2020a). Spatially explicit capture-recapture through camera trapping: A review of benchmark analyses for wildlife density estimation. Front. Ecol. Evol. 8:563477. doi: 10.3389/fevo.2020.563477
Green, S. E., Rees, J. P., Stephens, P. A., Hill, R. A., and Giordano, A. J. (2020b). Innovations in camera trapping technology and approaches: the integration of citizen science and artificial intelligence. Animals 10:132. doi: 10.3390/ani10010132
Gregory, T., Rueda, F. C., Deichmann, J., Kolowski, J., and Alonso, A. (2014). Arboreal camera trapping: taking a proven method to new heights. Methods Ecol. Evol. 5, 443–451. doi: 10.1111/2041-210X.12177
Heiniger, J., and Gillespie, G. (2018). High variation in camera trap-model sensitivity for surveying mammal species in northern Australia. Wildl. Res. 45, 578–585. doi: 10.1071/WR18078
Hepler, S. A., and Erhardt, R. J. (2020). A spatiotemporal model for multivariate occupancy data. Environmetrics e2657. doi: 10.1002/env.2657
Hofmeester, T. R., Cromsigt, J. P. G. M., Odden, J., Andrén, H., Kindberg, J., and Linnell, J. D. C. (2019). Framing pictures: a conceptual framework to identify and correct for biases in detection probability of camera traps enabling multi-species comparison. Ecol. Evol. 9, 2320–2336. doi: 10.1002/ece3.4878
Hofmeester, T. R., Rowcliffe, J. M., and Jansen, P. A. (2017). A simple method for estimating the effective detection distance of camera traps. Remote Sens. Ecol. Conserv. 3, 81–89. doi: 10.1002/rse2.25
Hope, A. C. A. (1968). A simplified Monte Carlo significance test procedure. J. R. Stat. Soc. Ser. B Stat. Methodol. 30, 582–598. doi: 10.1111/j.2517-6161.1968.tb00759.x
Howe, E. J., Buckland, S. T., Després-Einspenner, M. L., and Kühl, H. S. (2017). Distance sampling with camera traps. Methods Ecol. Evol. 8, 1558–1565. doi: 10.1111/2041-210X.12790
Howe, E. J., Buckland, S. T., Després-Einspenner, M. L., and Kühl, H. S. (2019). Model selection with overdispersed sampling data. Methods Ecol. Evol. 10, 38–47. doi: 10.1111/2041-210X.13082
Kays, R., Arbogast, B. S., Baker-Whatton, M., Beirne, C., Boone, H. M., Bowler, M., et al. (2020a). An empirical evaluation of camera trap study design: how many, how long and when? Methods Ecol. Evol. 11, 700–713. doi: 10.1111/2041-210X.13370
Kays, R., McShea, W. J., and Wikelski, M. (2020b). Born-digital biodiversity data: millions and billions. Divers. Distrib. 26, 644–648. doi: 10.1111/ddi.12993
Keim, J. L., Lele, S. R., DeWitt, P. D., Fitzpatrick, J. J., and Jenni, N. S. (2019). Estimating the intensity of use by interacting predators and prey using camera traps. J. Anim. Ecol. 88, 690–701. doi: 10.1111/1365-2656.12960
Kellner, K. F., and Swihart, R. K. (2014). Accounting for imperfect detection in ecology: a quantitative review. PLoS ONE 9:e111436. doi: 10.1371/journal.pone.0111436
Kéry, M., Royle, A., and Meredith, M. (2017). R Package AHMbook: Functions and Data for the Book “Applied Hierarchical Modeling in Ecology”. Version 0.1.4. Available online at: https://cran.r-project.org/web/packages/AHMbook/index.html
Kéry, M., and Royle, J. A. (2015). Applied Hierarchical Modeling in Ecology: Analysis of Distribution, Abundance and Species Richness in R and BUGS. Volume 1: Prelude and Static Models. London: Academic Press.
Kéry, M., and Royle, J. A. (2020). Applied Hierarchical Modeling in Ecology: Analysis of Distribution, Abundance and Species Richness in R and BUGS. Volume 2: Dynamics and Advanced Models. London: Academic Press.
Kitzes, J., and Schricker, L. (2019). The necessity, promise and challenge of automated biodiversity surveys. Environ. Conserv. 46, 247–250. doi: 10.1017/S0376892919000146
Macaulay, L. T., Sollmann, R., and Barrett, R. H. (2020). Estimating deer populations using camera traps and natural marks. J. Wildl. Manag. 84, 301–310. doi: 10.1002/jwmg.21803
Magsamen-Conrad, K., and Dillon, J. M. (2020). Mobile technology adoption across the lifespan: a mixed methods investigation to clarify adoption stages, and the influence of diffusion attributes. Comput. Human. Behav. 112:106456. doi: 10.1016/j.chb.2020.106456
Mantel, N., Tukey, J. W., Ciminera, J. L., and Heyse, J. F. (1982). Tumorigenicity assays, including use of the jackknife. Biom. J. 24, 579–596. doi: 10.1002/bimj.4710240607
Maronde, L., McClintock, B. T., Breitenmoser, U., and Zimmermann, F. (2020). Spatial capture-recapture with multiple noninvasive marks: An application to camera-trapping data of the European wildcat (Felis silvestris) using R package multimark. Ecol. Evol. 10, 13968–13979. doi: 10.1002/ece3.6990
McCallum, J. (2013). Changing use of camera traps in mammalian field research: habitats, taxa and study types. Mammal. Rev. 43, 196–206. doi: 10.1111/j.1365-2907.2012.00216.x
McCleery, R. A., Zweig, C. L., Desa, M. A., Hunt, R., Kitchens, W. M., and Percival, H. F. (2014). A novel method for camera-trapping small mammals. Wildl. Soc. Bull. 38, 887–891. doi: 10.1002/wsb.447
McIntyre, T., Majelantle, T. L., Slip, D. J., and Harcourt, R. G. (2020). Quantifying imperfect camera-trap detection probabilities: implications for density modelling. Wildl. Res. 47, 177–185. doi: 10.1071/WR19040
McShea, W. J., Forrester, T., Costello, R., He, Z., and Kays, R. (2016). Volunteer-run cameras as distributed sensors for macrosystem mammal research. Landsc. Ecol. 31, 55–66. doi: 10.1007/s10980-015-0262-9
Meek, P. D., Ballard, G., Claridge, A., Kays, R., Moseby, K., O'Brien, T., et al. (2014). Recommended guiding principles for reporting on camera trapping research. Biodivers. Conserv. 23, 2321–2343. doi: 10.1007/s10531-014-0712-8
Meek, P. D., Ballard, G. A., and Fleming, P. J. S. (2015). The pitfalls of wildlife camera trapping as a survey tool in Australia. Aust. Mammal. 37, 13–22. doi: 10.1071/AM14023
Miao, Z., Gaynor, K. M., Wang, J., Liu, Z., Muellerklein, O., Norouzzadeh, M. S., et al. (2019). Insights and approaches using deep learning to classify wildlife. Sci. Rep. 9:8137. doi: 10.1038/s41598-019-44565-w
Mills, C. A., Godley, B. J., and Hodgson, D. J. (2016). Take only photographs, leave only footprints: novel applications of non-invasive survey methods for rapid detection of small, arboreal animals. PLOS ONE 11:e0146142. doi: 10.1371/journal.pone.0146142
Moeller, A. K., Lukacs, P. M., and Horne, J. S. (2018). Three novel methods to estimate abundance of unmarked animals using remote cameras. Ecosphere 9:e02331. doi: 10.1002/ecs2.2331
Moll, R. J., Ortiz-Calo, W., Cepek, J. D., Lorch, P. D., Dennis, P. M., Robison, T., et al. (2020). The effect of camera-trap viewshed obstruction on wildlife detection: implications for inference. Wildl. Res. 47, 158–165. doi: 10.1071/WR19004
Mos, J., and Hofmeester, T. R. (2020). The Mostela: an adjusted camera trapping device as a promising non-invasive tool to study and monitor small mustelids. Mamm. Res. 65, 843–853. doi: 10.1007/s13364-020-00513-y
Nakashima, Y., Fukasawa, K., and Samejima, H. (2018). Estimating animal density without individual recognition using information derivable exclusively from camera traps. J. Appl. Ecol. 55, 735–744. doi: 10.1111/1365-2664.13059
Nakashima, Y., Hongo, S., and Akomo-Okoue, E. F. (2020). Landscape-scale estimation of forest ungulate density and biomass using camera traps: applying the REST model. Biol. Conserv. 241:108381. doi: 10.1016/j.biocon.2019.108381
Nekaris, K. A. I., Handby, V., Campera, M., Birot, H., Hedger, K., Eaton, J., et al. (2020). Implementing and monitoring the use of artificial canopy bridges by mammals and birds in an Indonesian agroforestry environment. Diversity 12, 399. doi: 10.3390/d12100399
Ngoprasert, D., Gale, G. A., and Tyre, A. J. (2019). Abundance estimation from multiple data types for group-living animals: an example using dhole (Cuon alpinus). Glob. Ecol. Conserv. 20:e00792. doi: 10.1016/j.gecco.2019.e00792
Niedballa, J., Sollmann, R., Courtiol, A., and Wilting, A. (2016). camtrapR: an R package for efficient camera trap data management. Methods Ecol. Evol. 7, 1457–1462. doi: 10.1111/2041-210X.12600
Norouzzadeh, M. S., Morris, D., Beery, S., Joshi, N., Jojic, N., and Clune, J. (2021). A Deep Active Learning System for Species Identification and Counting in Camera Trap Images. Methods Ecol. Evol. 12, 150–161. doi: 10.1111/2041-210X.13504
Norouzzadeh, M. S., Nguyen, A., Kosmala, M., Swanson, A., Palmer, M. S., Packer, C., et al. (2018). Automatically identifying, counting, and describing wild animals in camera-trap images with deep learning. Proc. Natl. Acad. Sci U.S.A. 115, E5716–E5725. doi: 10.1073/pnas.1719367115
O'Connell, A. F., Nichols, J. D., and Karanth, K. U. (2011). Camera Traps in Animal Ecology: Methods and Analyses. New York, NY: Springer. doi: 10.1007/978-4-431-99495-4
Ortmann, C. R., and Johnson, S. D. (2020). How reliable are motion-triggered camera traps for detecting small mammals and birds in ecological studies? J. Zool. doi: 10.1111/jzo.12849
Palmer, M. S., Fieberg, J., Swanson, A., Kosmala, M., and Packer, C. (2017). A ‘dynamic’ landscape of fear: prey responses to spatiotemporal variations in predation risk across the lunar cycle. Ecol. Lett. 20, 1364–1373. doi: 10.1111/ele.12832
Parsons, A. W., Forrester, T., McShea, W. J., Baker-Whatton, M. C., Millspaugh, J. J., and Kays, R. (2017). Do occupancy or detection rates from camera traps reflect deer density? J. Mammal. 98, 1547–1557. doi: 10.1093/jmammal/gyx128
Pollock, K. H., Nichols, T. R., Simons, G. L., Farnsworth, G. L., Bailey, L. L., and Sauer, J. R. (2002). Large scale wildlife monitoring studies: statistical methods for design and analysis. Environmetrics 13, 105–119. doi: 10.1002/env.514
R Development Core Team (2020). R: A Language and Environment for Statistical Computing. Vienna: R Foundation for Statistical Computing. Available online at: http://www.R-project.org
Rice, R. E. (2017). Intermediality and the diffusion of innovations. Hum. Commun. Res. 43, 531–544. doi: 10.1111/hcre.12119
Rich, L. N., Davis, C. L., Farris, Z. J., Miller, D. A., Tucker, J. M., Hamel, S., et al. (2017). Assessing global patterns in mammalian carnivore occupancy and richness by integrating local camera trap surveys. Glob. Ecol. Biogeogr. 26, 918–929. doi: 10.1111/geb.12600
Rivas-Romero, J. A., and Soto-Shoender, J. R. (2015). Filling in the gaps: evaluating the use of camera traps in the canopy to examine frugivore visits to Oreopanax echinops in the highlands of Guatemala. Southwest. Nat. 60, 366–370. doi: 10.1894/0038-4909-60.4.366
Rovero, F., Zimmermann, F., Berzi, D., and Meek, P. (2013). “Which camera trap type and how many do I need?” A review of camera features and study designs for a range of wildlife research applications. Hystrix 24, 148–156. doi: 10.4404/hystrix-24.2-8789
Rowcliffe, J. M., and Carbone, C. (2008). Surveys using camera traps: are we looking to a brighter future? Anim. Conserv. 11, 185–186. doi: 10.1111/j.1469-1795.2008.00180.x
Rowcliffe, J. M., Field, J., Turvey, S. T., and Carbone, C. (2008). Estimating animal density using camera traps without the need for individual recognition. J. Appl. Ecol. 45, 1228–1236. doi: 10.1111/j.1365-2664.2008.01473.x
Rowcliffe, J. M., Kays, R., Kranstauber, B., Carbone, C., and Jansen, P. A. (2014). Quantifying levels of animal activity using camera trap data. Methods Ecol. Evol. 5, 1170–1179. doi: 10.1111/2041-210X.12278
Rowcliffe, M. (2019). R Package Activity: Animal Activity Statistics. Version 1.3. Available online at: https://cran.r-project.org/web/packages/activity/index.html
Salman, A., Siddiqui, S. A., Shafait, F., Mian, A., Shortis, M. R., Khurshid, K., et al. (2019). Automatic fish detection in underwater videos by a deep neural network-based hybrid motion learning system. ICES J. Mar. Sci. 77, 1295–1307. doi: 10.1093/icesjms/fsz025
Sarkar, J. (1998). Technological diffusion: alternative theories and historical evidence. J. Econ. Surv. 12, 131–176. doi: 10.1111/1467-6419.00051
Schneider, F. D. (2020). R package ‘Traitdataform’: Formatting and Harmonizing Ecological Trait-Data. Version 0.5.7. Available online at: https://cran.r-project.org/web/packages/traitdataform/index.html
Schneider, S., Greenberg, S., Taylor, G. W., and Kremer, S. C. (2020a). Three critical factors affecting automated image species recognition performance for camera traps. Ecol. Evol. 10, 3503–3517. doi: 10.1002/ece3.6147
Schneider, S., Taylor, G. W., and Kremer, S. C. (2020b). “Similarity learning networks for animal individual re-identification-beyond the capabilities of a human observer,” in Proceedings of the IEEE Winter Conference on Applications of Computer Vision Workshops (Snowmass village, CO), 44–52. doi: 10.1109/WACVW50321.2020.9096925
Smith, J. A., Suraci, J. P., Hunter, J. S., Gaynor, K. M., Keller, C. B., Palmer, M. S., et al. (2020). Zooming in on mechanistic predator-prey ecology: integrating camera traps with experimental methods to reveal the drivers of ecological interactions. J. Anim. Ecol. 89, 1997–2012. doi: 10.1111/1365-2656.13264
Soininen, E. M., Jensvoll, I., Killengreen, S. T., and Ims, R. A. (2015). Under the snow: a new camera trap opens the white box of subnivean ecology. Remote. Sens. Ecol. Conserv. 1, 29–38. doi: 10.1002/rse2.2
Sollmann, R. (2018). A gentle introduction to camera-trap data analysis. African J. Ecol. 56, 740–749. doi: 10.1111/aje.12557
Spellerburg, I. F., and Fedor, P. J. (2003). A tribute to Claude Shannon (1916-2001) and a plea for more rigorous use of species richness, species diversity, and the “Shannon-Wiener” index. Glob. Ecol. Biogeogr. 12, 177–179. doi: 10.1046/j.1466-822X.2003.00015.x
Steenweg, R., Hebblewhite, M., Kays, R., Ahumada, J., Fisher, J. T., Burton, C., et al. (2017). Scaling-up camera traps: monitoring the planet's biodiversity with networks of remote sensors. Front. Ecol. Environ. 15, 26–34. doi: 10.1002/fee.1448
Steenweg, R., Hebblewhite, M., Whittington, J., Lukacs, P., and McKelvey, K. (2018). Sampling scales define occupancy and underlying occupancy–abundance relationships in animals. Ecology 99, 172–183. doi: 10.1002/ecy.2054
Steenweg, R., Hebblewhite, M., Whittington, J., and McKelvey, K. (2019). Species-specific differences in detection and occupancy probabilities help drive ability to detect trends in occupancy. Ecosphere 10:e02639. doi: 10.1002/ecs2.2639
Struthers, D. P., Danylchuk, A. J., Wilson, A. D. M., and Cooke, S. J. (2015). Action cameras: bringing aquatic and fisheries research into view. Fisheries 40, 502–512. doi: 10.1080/03632415.2015.1082472
Sundaram, D. M., and Loganathan, A. (2020). A new supervised clustering framework using multi discriminative parts and expectation-maximization approach for a fine-grained animal breed classification (SC-MPEM). Neural Process. Lett. 52, 727–766. doi: 10.1007/s11063-020-10246-3
Suzuki, K., and Ando, M. (2019). Early and efficient detection of an endangered flying squirrel by arboreal camera trapping. Mammalia 83, 372–378. doi: 10.1515/mammalia-2018-0055
Swanson, A., Kosmala, M., Lintott, C., Simpson, R., Smith, A., and Packer, C. (2015). Snapshot Serengeti, high-frequency annotated camera trap images of 40 mammalian species in an African savanna. Sci. Data 2:150026. doi: 10.1038/sdata.2015.26
Swihart, R. K., Caudell, J. N., Brooke, J. M., and Ma, Z. (2020). A flexible model-based approach to delineate wildlife management units. Wildl. Soc. Bull. 44, 77–85. doi: 10.1002/wsb.1037
Tabak, M. A., Norouzzadeh, M. S., Wolfson, D. W., Newton, E. J., Boughton, R. K., Ivan, J. S., et al. (2020). Improving the accessibility and transferability of machine learning algorithms for identification of animals in camera trap images: MLWIC2. Ecol. Evol. 10, 10374–10383. doi: 10.1101/2020.03.18.997700
Tabak, M. A., Norouzzadeh, M. S., Wolfson, D. W., Sweeney, S. J., VerCauteren, K. C., Snow, N. P., et al. (2019). Machine learning to classify animal species in camera trap images: applications in ecology. Methods Ecol. Evol. 10, 585–590. doi: 10.1111/2041-210X.13120
Tennant, E. N., Cypher, B. L., Saslaw, L. R., Westall, T. L., Mohay, J. L., Kelly, E. C., et al. (2020). Evaluation of noninvasive survey methods for detecting endangered shrews. Wildl. Soc. Bull. 44, 610–616. doi: 10.1002/wsb.1103
Thau, D., Ahumada, J. A., Birch, T., Fegraus, E., Flores, N., Jetz, W., et al. (2019). Artificial intelligence's role in global camera trap data management and analytics via Wildlife Insights. Biodivers. Inf. Sci. Stand. 3:e32833. doi: 10.3897/biss.3.38233
Wang, Y., Naumann, U., Wright, S. T., and Warton, D. I. (2012). mvabund – an R package for model-based analysis of multivariate abundance data. Methods Ecol. Evol. 3, 471–474. doi: 10.1111/j.2041-210X.2012.00190.x
Warton, D. I., Thibaut, L., and Wang, Y. A. (2017). The PIT-trap—a “model-free” bootstrap procedure for inference about regression models with discrete, multivariate responses. PLoS ONE 12:e0181790. doi: 10.1371/journal.pone.0181790
Wearn, O. R., and Glover-Kapfer, P. (2019). Snap happy: camera traps are an effective sampling tool when compared with alternative methods. R. Soc. Open Sci. 6:181748. doi: 10.1098/rsos.181748
Wilson, D. E., and Reeder, D. M. (2005). Mammal Species of the World: A Taxonomic and Geographic Reference, 3rd Edn. Baltimore: JHU Press.
Wood, S. (2020). R Package ‘mgcv’: Mixed GAM Computation Vehicle With Automatic Smoothness Estimation. Version 1.8-33. Available online at: https://cran.r-project.org/web/packages/mgcv/index.html
Wood, S. N. (2003). Thin plate regression splines. J. R. Stat. Soc. Series B Stat. Methodol. 65, 95–114. doi: 10.1111/1467-9868.00374
Wood, S. N. (2017). Generalized Additive Models: An Introduction with R, 2nd Edn. Chapman and Hall/CRC Press.
Keywords: camera trap, diversity, ecoregions, image classification, occupancy, population attributes, technological diffusion, wildlife
Citation: Delisle ZJ, Flaherty EA, Nobbe MR, Wzientek CM and Swihart RK (2021) Next-Generation Camera Trapping: Systematic Review of Historic Trends Suggests Keys to Expanded Research Applications in Ecology and Conservation. Front. Ecol. Evol. 9:617996. doi: 10.3389/fevo.2021.617996
Received: 15 October 2020; Accepted: 08 February 2021;
Published: 26 February 2021.
Edited by:
Xuan Zhu, Monash University, AustraliaReviewed by:
Jason Fisher, University of Victoria, CanadaWilliam J. McShea, Smithsonian Conservation Biology Institute (SI), United States
Copyright © 2021 Delisle, Flaherty, Nobbe, Wzientek and Swihart. This is an open-access article distributed under the terms of the Creative Commons Attribution License (CC BY). The use, distribution or reproduction in other forums is permitted, provided the original author(s) and the copyright owner(s) are credited and that the original publication in this journal is cited, in accordance with accepted academic practice. No use, distribution or reproduction is permitted which does not comply with these terms.
*Correspondence: Zackary J. Delisle, emRlbGlzbGVAcHVyZHVlLmVkdQ==