 Takaya Hirohara
 Kenji Tsuri1
 Robert T. R. Paine
 Hiroki Yamanaka
- 1Department of Environmental Solution Technology, Faculty of Science and Technology, Ryukoku University, Otsu, Japan
- 2Cooperative Fishery Research Unit, Tennessee Technological University, Cookeville, TN, United States
- 3Center for Biodiversity Science, Ryukoku University, Otsu, Japan
Environmental DNA (eDNA) analysis has enabled more sensitive and efficient biological monitoring than traditional methods. However, since the target species is not directly observed, interpretation of results cannot preclude process Type I errors. Specifically, there may be a spatial or temporal gap between the target eDNA and the eDNA source in the sampled area. Moreover, eDNA surveillance lacks the ability to distinguish whether eDNA originated from a living or non-living source. This kind of Type I error is difficult to control for, in part, because the relationship between the state of eDNA (i.e., intracellular or extracellular) and the degradation rate is still unclear. Here, we applied PMA (Propidium monoazide) to eDNA analysis which enabled us to differentiate “intact cells” from “disrupted cells.” PMA is a dye that has a high affinity for double-stranded DNA and forms a covalent bond with double-stranded DNA and inhibits amplification of the bonded DNA molecules by PCR. Since PMA is impermeable to the cell membrane, DNA protected by an intact cell membrane can be selectively detected. In this study, we investigated the workability of PMA on vertebrate eDNA using zebrafish, Danio rerio. Aquarium water was incubated for 1 week to monitor the eDNA degradation process of both intracellular and extracellular eDNA. We developed ten species-specific quantitative PCR assays for D. rerio with different amplification lengths that enabled independent quantification of total eDNA (sum of intracellular and extracellular eDNA, commonly measured in other studies) and intracellular eDNA (DNA in intact cells) and allow for analyses of sequence length-dependent eDNA degradation in combination with PMA. We confirmed that PMA is effective at differentiating “intact” and “disrupted” fish cells. We found that total eDNA and intracellular eDNA have different degradation processes that are dependent on the length of target sequence. For future conservation efforts using eDNA analyses, it is necessary to increase the reliability of the analysis results. The research presented here provides new analysis tools that expand our understanding of the ecology of eDNA, so that more accurate and reliable conclusions can be determined.
Introduction
Aquatic ecosystems are disproportionately affected by anthropogenic influences, such as pollution, habitat degradation, introduction of invasive species, and overuse of natural resources (Abell et al., 2008; Strayer and Dudgeon, 2010; Collen et al., 2014). Conservation efforts that are used to help mitigate the damage caused to aquatic ecosystems have to be empirically monitored to determine which strategies are effective. One way to monitor the effectiveness of various conservation strategies is to survey the biodiversity within a system. Surveillance of biodiversity includes monitoring the distribution of species of interest (e.g., alien or endangered species), estimating population abundance or biomass of targeted species, estimating occupancy at a site, or assessing the presence or absence of species in targeted systems (Lodge et al., 2012; Pilliod et al., 2013, 2014; Thompson, 2013). Traditional monitoring of the activity ranges and habitat usages of aquatic organisms typically includes a variety of surveillance approaches (e.g., direct capture or visual surveys), which employ different gears and techniques that can be difficult to learn and standardize, and require a considerable amount of labor and cost (Hayes et al., 1996; Rees et al., 2014; Hajibabaei et al., 2016; Evans et al., 2017).
There has been growing interest over the last decade in eDNA (environmental DNA) surveillance as a biological monitoring method for aquatic species, due to several advantages over traditional methods. Costs, labor, and environmental disturbance associated with eDNA surveillance are often smaller compared to direct capture or visual surveys because eDNA surveys only require small volumes of water to be collected at targeted sites (Jerde et al., 2011; Takahara et al., 2013; Smart et al., 2015, 2016; Evans et al., 2017). Furthermore, eDNA monitoring has also been demonstrated to have higher detection sensitivity compared to traditional methods, especially at low target species densities (Dejean et al., 2012; Pilliod et al., 2013; Takahara et al., 2013). Since the target species is not directly observed, however, the results of eDNA analyses can potentially include errors in ecological interpretation (process Type I errors) (Darling and Mahon, 2011; Rees et al., 2014; Barnes and Turner, 2016; also see Taberlet et al., 2018). For example, in both natural and experimental systems, legacy eDNA of the target species can still be accurately amplified and detected even though there are no living individuals of the target species in the system (Merkes et al., 2014; Lance et al., 2017; Tsuji et al., 2017; Kamoroff and Goldberg, 2018). Simply, positive detection of legacy eDNA reported as “presence” of the target species are not analytical false-positives (method-based Type I error), but ecological misinterpretations (sensu Darling and Mahon, 2011). While method-based Type I errors are fairly easy to control for in eDNA designs (e.g., inclusion of negative controls during all field, extraction, and PCR processes, multiple biological and technical replicates) (Champlot et al., 2010; Darling and Mahon, 2011; Ficetola et al., 2015), there are no empirically tested protocols that allow eDNA surveys to reduce or eliminate process Type I errors, aside from tandem traditional surveillance methods.
Our understanding of eDNA ecology regarding the existing states and degradation rates that influence eDNA detection is limited, in part, due to the inability to demarcate spatial or temporal relationships between eDNA and the source of eDNA. For example, positive eDNA detection could result from DNA derived from dead individuals or transported from another site via bird droppings (Merkes et al., 2014). Furthermore, it is unknown when the detected eDNA was released from the target species or if the individual is still in the immediate surveyed area (Barnes and Turner, 2016; Jo et al., 2017). Several studies using experimental systems have demonstrated that eDNA signals can be detected many days (17–25) after the target organism is removed from the system (Dejean et al., 2011, 2012; Goldberg et al., 2013). Environmental DNA from common carp (Cyprinus carpio) remained detectable in sediment over 132 days (Turner et al., 2015). Moreover, eDNA that has an anthropogenic origin could be a source of process Type I error as shown in a reported case where effluent from fish markets along the Maizuru Bay area (Japan) yielded positive eDNA detection for Japanese jack mackerel (Trachurus japonicus) (Yamamoto et al., 2016). Clearly, a contributing factor of process Type I error in eDNA analysis and interpretation is the limited spatio-temporal nature of eDNA caused by various aspects associated with the origin, state, and fate of eDNA (Barnes and Turner, 2016).
In addition to the aforementioned issues related to eDNA decay, various biotic/abiotic factors associated with the state of eDNA also impact the detectability and persistence of eDNA in various aquatic environments (Thomsen et al., 2012a,b; Maruyama et al., 2014; Pilliod et al., 2014; Lance et al., 2017; Mächler et al., 2018; Murakami et al., 2019). Turner et al. (2014) suggested that eDNA is released from organisms as relatively large particles (1–10 μm), indicating that eDNA shed from fish is likely within cells and mitochondria, at least at the time point of release. In other words, eDNA is released as intracellular eDNA, which are relatively large particles, that undergo degradation and change their physical state and structure to become smaller (extracellular) particles (Jo et al., 2019). Moreover, Jo et al. (2017) clarified that long eDNA fragments degraded faster than shorter eDNA fragments using two different qPCR assays for Japanese jack mackerel and suggested the potential of longer eDNA fragments as a better proxy for the presence of the target fish. The concentrations of longer eDNA fragments also gave better correlation with estimations of fish distribution/biomass (based on quantitative echo intensity) than shorter eDNA fragments (Jo et al., 2017). These conclusions suggest that the length of a target sequence in eDNA analysis is a key factor for reliable detection and determination of true presence for the target organism. Thus, the degradation process as it relates to DNA fragment length requires further experimental testing and clarification.
The eDNA degradation patterns observed so far have been measured as the degradation of total eDNA (DNA of target sequence in samples commonly measured in other studies) containing both extra- and intracellular eDNA. It is suggested that DNA molecules within intact cell membranes (intracellular DNA) would be less vulnerable to the attacks from microbes and extracellular enzymes in the environment than extracellular DNA (Levy-Booth et al., 2007). Therefore, the independent examination of both intra- and extracellular eDNA would also be beneficial to understanding the mechanisms of the eDNA degradation process. Clarification of the state of eDNA and the dynamics of degradation will contribute to improve the reliability of eDNA analysis and interpretations for more accurate decision making in future conservation efforts.
Here, we applied PMA (propidium monoazide) to eDNA analysis to differentiate “intact cells” from “disrupted cells,” which has been mainly used in microbial research. PMA is a photoreactive dye that has a high affinity for double-stranded DNA and forms a covalent bond with double-stranded DNA when exposed to strong visible light, and inhibits amplification of the bonded DNA molecules by PCR (Nocker et al., 2007). In addition, since PMA is impermeable to the cell membrane, DNA protected by an intact cell membrane can be selectively detected (Figure 1; García-Fontana et al., 2016; Emerson et al., 2017). Although there are a few research examples which used PMA on other taxa such as phytoplankton (Microcystis aeruginosa, Anabaena sp., Aphanizomenon sp., Synechocystis sp., Cryptomonas ovata, Scenedesmus obliquus, and Nitzschia apiculata; Joo et al., 2019) and shellfish (Dreissena polymorpha; Lance and Carr, 2012), to the best of our knowledge, there are no research examples which applied PMA on vertebrates such as fish.
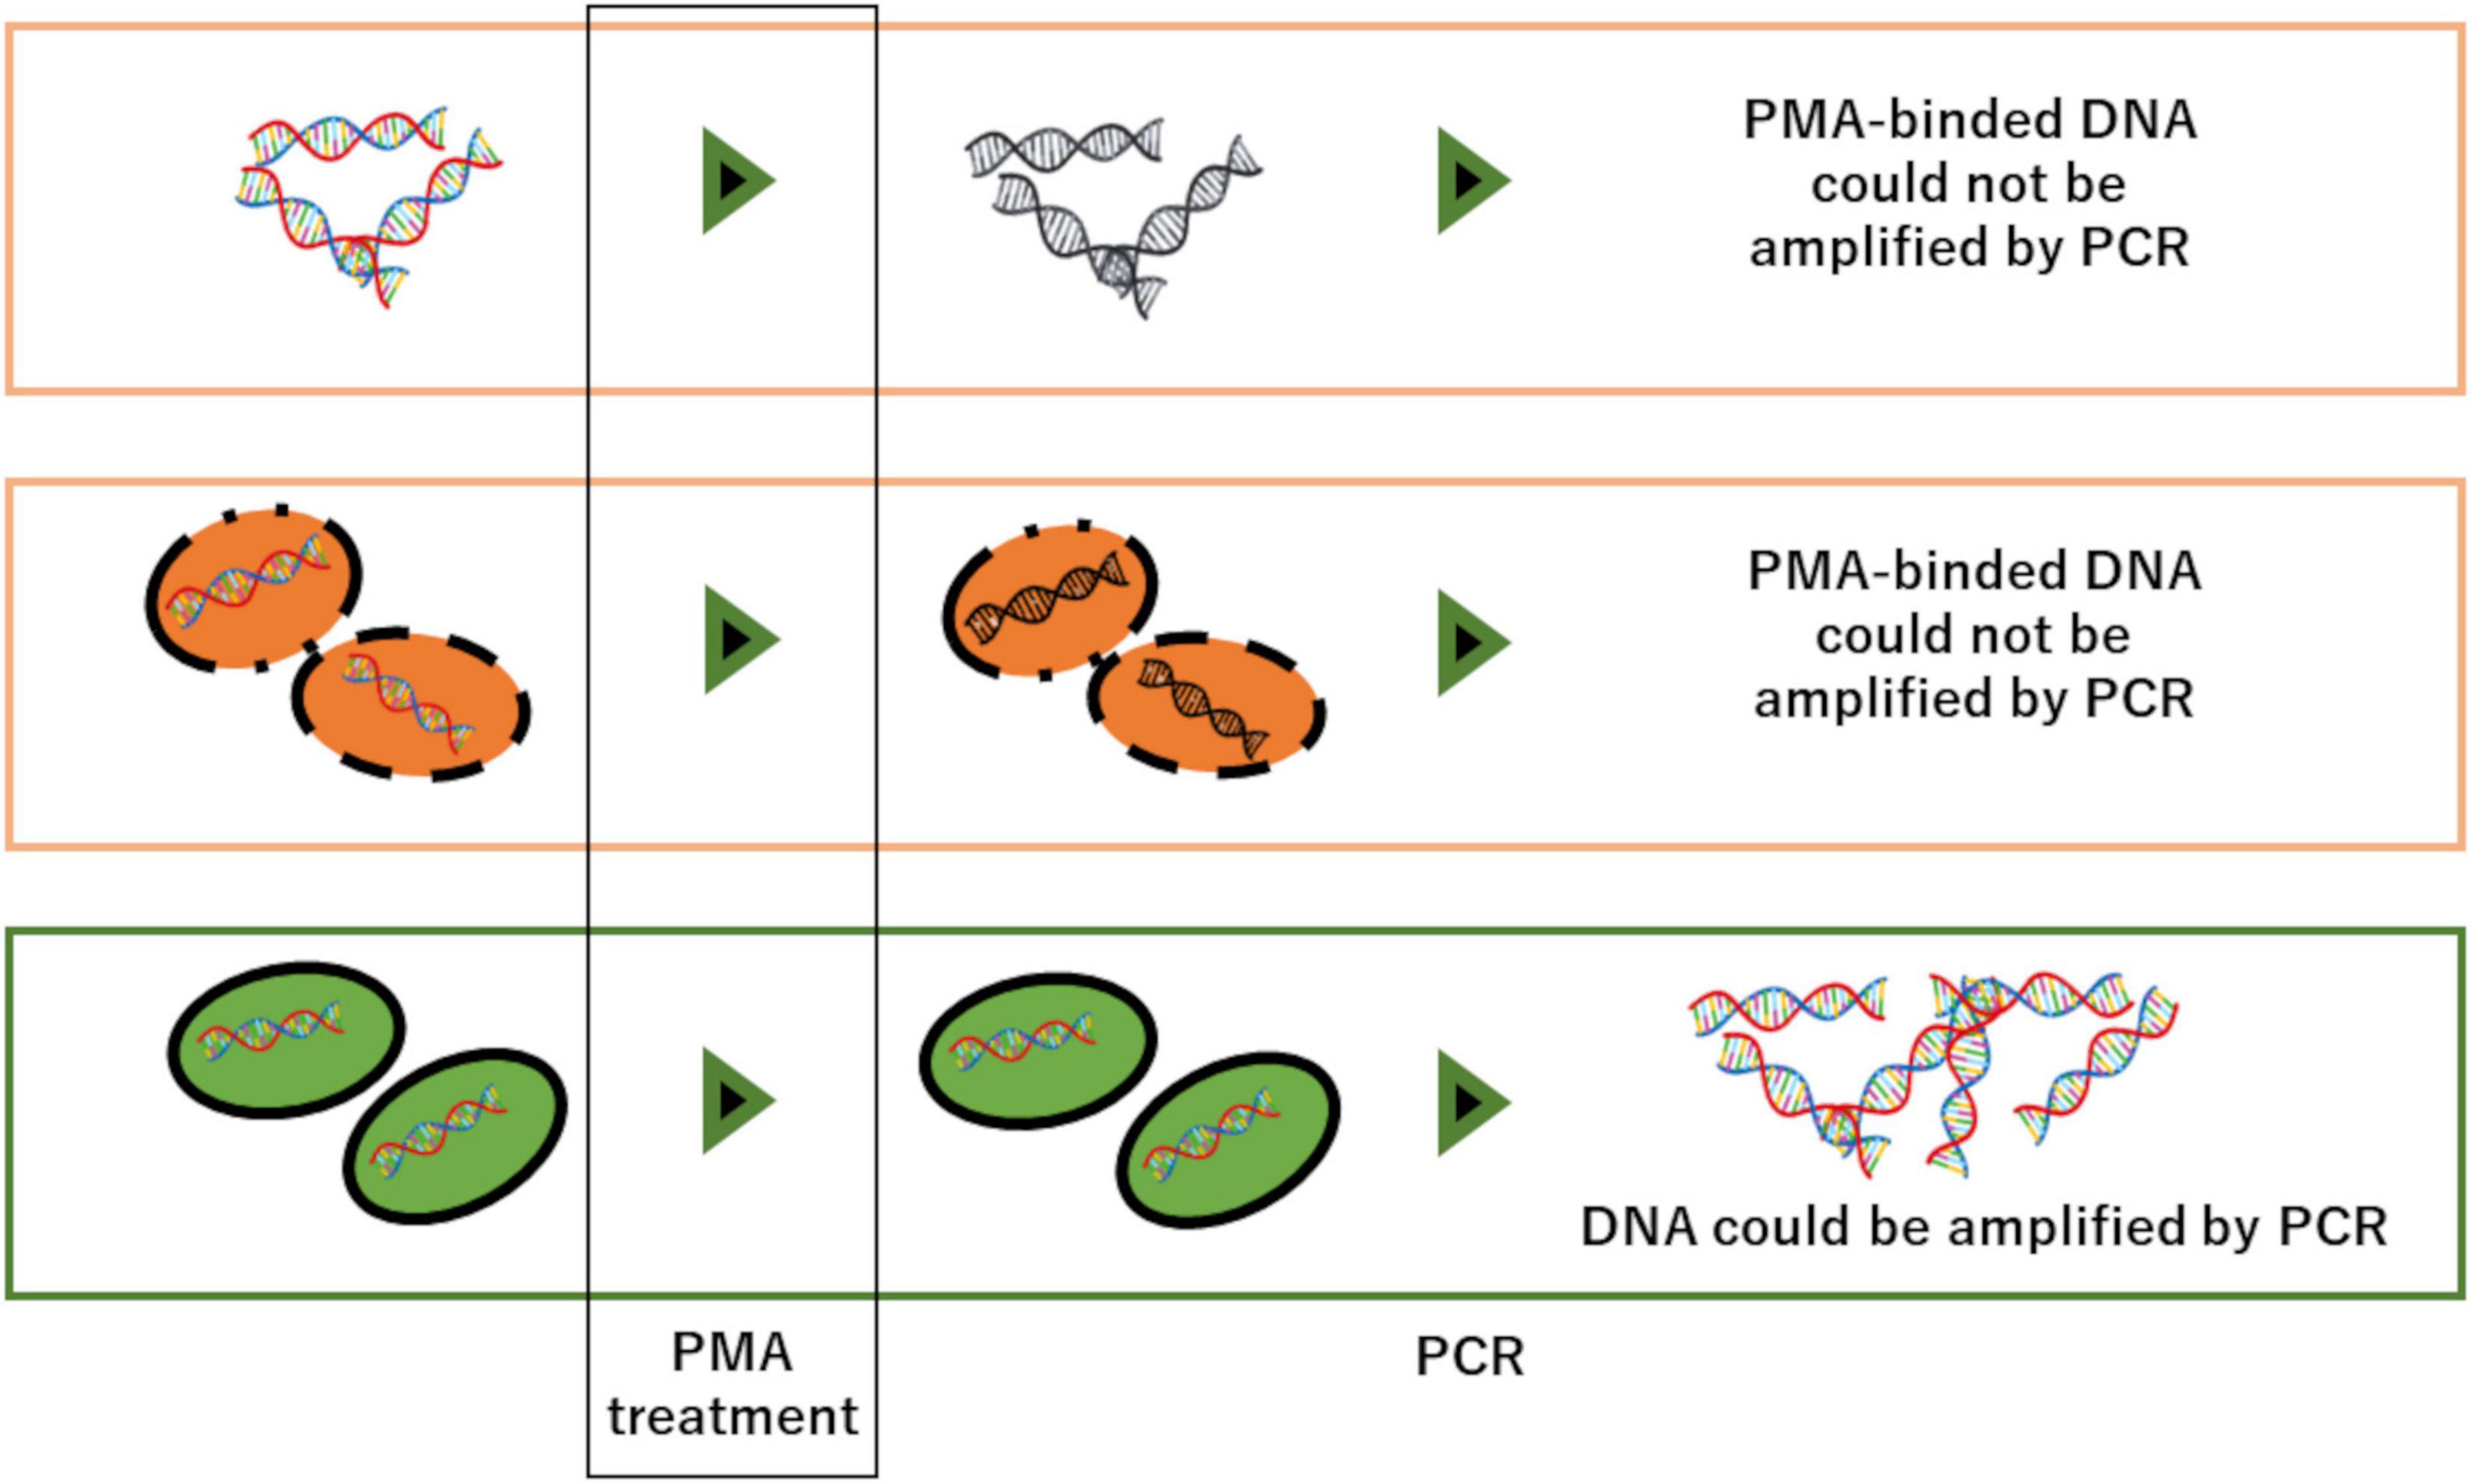
Figure 1. Functional mechanism of PMA-DNA interaction: PMA-bound DNA cannot be amplified by PCR. The cell membrane is impermeable against PMA, thus DNA inside of intact cell membranes are protected from PMA-binding and can be selectively detected in PCR test.
In this study, we investigated the workability of PMA on vertebrate eDNA using zebrafish, Danio rerio. Water samples collected from aquaria were boiled to disrupt the membrane of fish cells in the water to make mock “damaged” samples. PMA was applied to each of the boiled samples and the non-boiled samples, and detectable eDNA copy numbers were quantified using quantitative real-time PCR (qPCR). Next, water samples were collected from the aquaria and incubated for 1 week to monitor the eDNA degradation process between intracellular and extracellular eDNA. For examining the length-dependent degradation of eDNA, we developed 10 species-specific qPCR assays for D. rerio with different amplification lengths. The combined usage of PMA and the 10 qPCR assays enabled independent quantification of total eDNA (commonly measured in other studies) and intracellular eDNA (DNA in intact cells). We believe that clarification on the eDNA state (i.e., eDNA from intact vs. disrupted cells) and their respective degradation rates will help provide a basis for reducing process Type I errors and the continual improvement of eDNA techniques.
Materials and Methods
In this study, two types of experiments were conducted using D. rerio as a model organism: (1) confirming if PMA could be effective for preventing amplification of extracellular DNA, and limiting amplification to DNA from intact cells or organelles, (2) determining the degradation rate for total eDNA (intracellular and extracellular) and for eDNA in intact cells only, using PMA. In experiment 1, a control experiment was performed to quantify eDNA in PMA-treated and non-treated samples by qPCR. In experiment 2, the time-dependent degradation of eDNA was measured for total eDNA and intracellular eDNA by analyzing PMA-treated and non-treated eDNA samples from D. rerio tank water. Water samples obtained from the D. rerio tank were stored in a water bath and incubated at the same temperature as the D. rerio tank. Thereafter, the incubated water samples were sampled in a time series (0, 1, 2, 3, 5, and 7 days). After filtration, extraction and purification of eDNA from the sample, DNA copy numbers were quantified by qPCR using 10 newly developed qPCR assays with different amplification lengths which share the same probe and reverse primer but have 10 different forward primers. The DNA concentrations from all samples were analyzed to compare the degradation rate and degradation pattern of each treatment. Copy numbers of intracellular eDNA and total eDNA (intra- and extracellular eDNA) were all measured as the copy numbers of target sequence fragments in the eDNA samples by qPCR using the new assays.
Assay Design
Sequences of the mitochondrial genes including cytb (cytochrome b), tRNA-Glu and ND6 of the target species D. rerio as well as the other non-target species were downloaded from NCBI (the National Center for Biotechnology Information)1. The accession numbers for both target and non-target species used are shown in Supplementary Table 1. The non-target species were Cyprinus carpio, Carassius auratus auratus, Opsariichthys platypus, which are kept in our fish keeping facility on a regular basis and belong to the same family (Cyprinidae) as D. rerio. The sequences were aligned using MAFFT v. 72 with default settings. We searched for base pair differences between D. rerio and other non-target species in the 3′ end of each primer to generate species-specific assays. Expected amplicon lengths generated by each assay were 132, 225, 333, 430, 529, 621, 715, 823, 935, and 1,021 bp, respectively (Table 1). All primers had a minimum of 2 bp differences between the target species and all non-target species, with at least 1 bp difference in the last 5 bases of the 3′ end, except the forward primer for 529 bp assay (Supplementary Figure 1). The probe had 2 bp mismatches between the target species and other non-target species. The probe was designed between the primers for the shortest target sequence length (132 bp) and therefore can be used for all assays (Supplementary Figure 1). We confirmed the specificity of the primer pairs in silico using the Primer-BLAST with default settings3. The workability of the assays was tested on the target in vitro by qPCR in triplicate with a 10-fold dilution series generated from an artificially synthesized DNA fragment (gBlocksTM: Integrated DNA Technologies, Inc., Coralville, IA, United States). We defined the limit of detection (LOD) as the lowest number of copies that could be detected in one of the three qPCR replicas and the limit of quantification (LOQ) as the lowest number of copies that could be detected in all of the three qPCR replicas (Table 1). The details of qPCR settings are shown in a section “qPCR Conditions.”
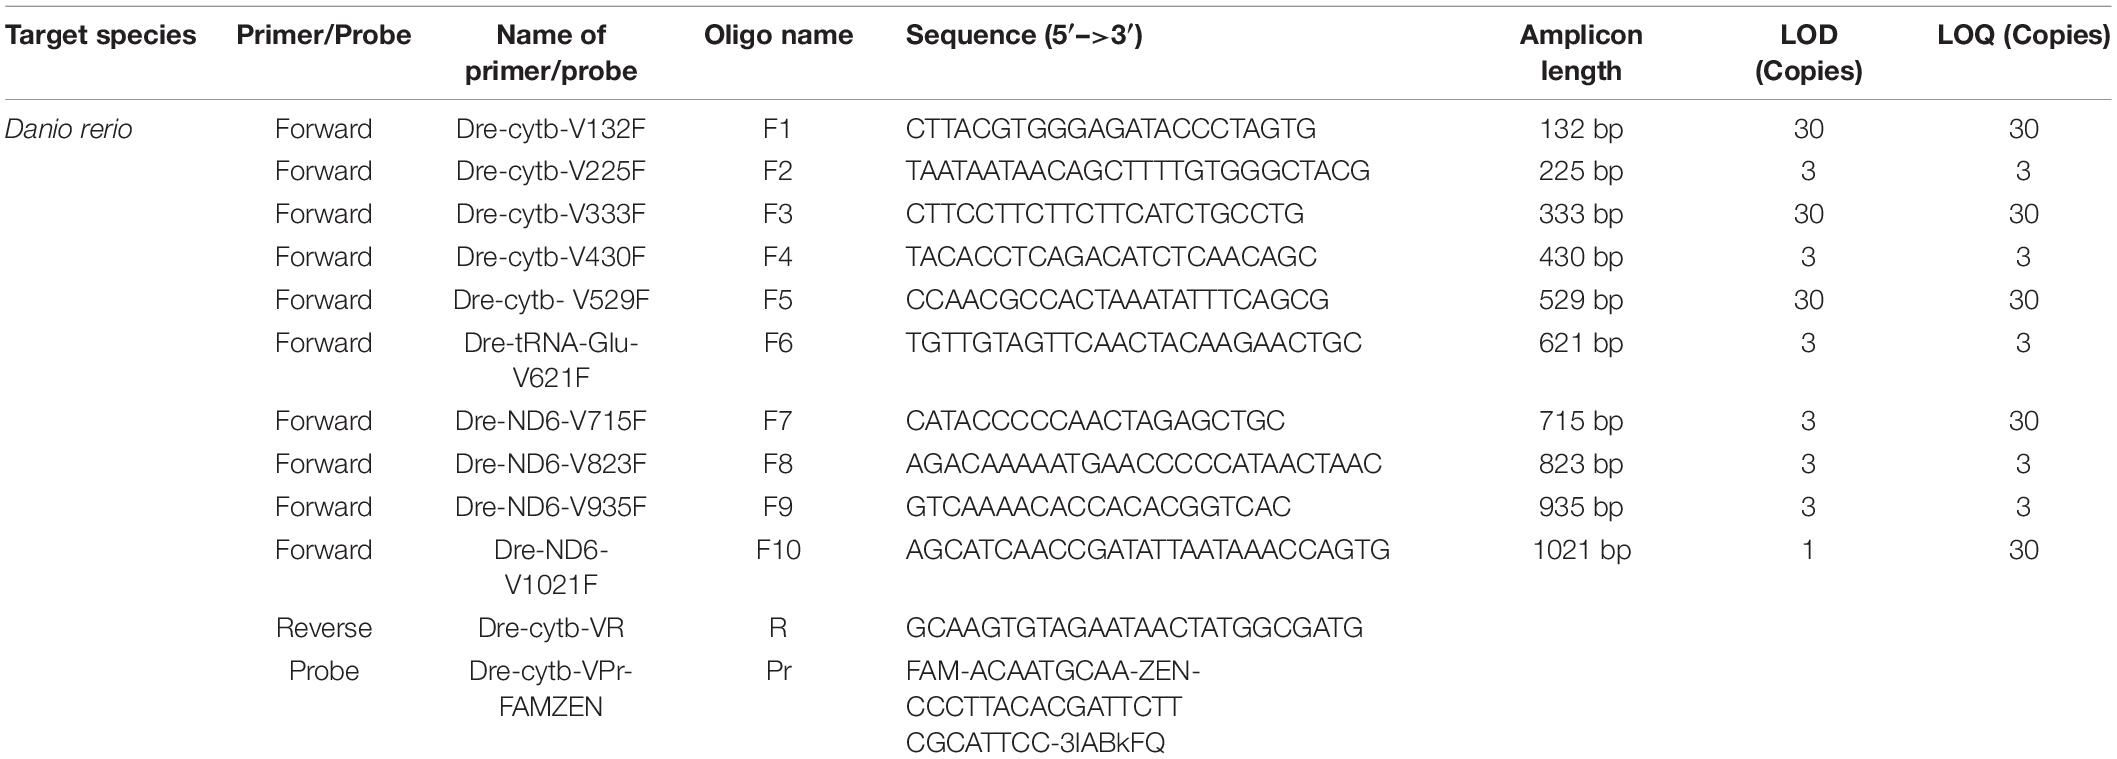
Table 1. Sequences of primers and a probe used in this study.
Experiment 1: PMA Confirmation Test
An acrylic 54 L aquarium was filled with 20 L of dechlorinated tap water and used as an experimental tank and D. rerio was held at a density of 5 individuals ⋅ L–1. Water temperature was adjusted to 25°C and a photoperiod was set to light: dark = 12:12 h. An air stone and a heater were installed, and water sampling was performed after fish were acclimatized for 3 days. All equipment, including the aquarium used for the sampling, were all decontaminated with 10% bleach solution prior to use.
A disposable plastic cup was used to transfer 6 L of water from the aquarium into a 10 L plastic container. The 6 L water sample was thoroughly mixed by shaking, and was divided into two 3 L samples (contained in 4 L plastic containers). One 3 L sample was boiled for 10 min to disrupt the membrane of fish cells in the water (Martin et al., 2013). The other 3 L sample was left at room temperature while the boiling treatment was performed. Both of the 3 L samples were divided into six subsamples with 500 mL each in new disposable plastic cups, and filtered through Sterivex cartridge filters (pore size 0.45 μm; Merck, Darmstadt, Germany) using a sterile 50 mL luer-lock syringe (SS-50LZ; Terumo Co., Tokyo, Japan). The water was aspirated into the syringe from the disposable cup and then the Sterivex filter is connected to the syringe. The water was then slowly forced through the filter that was inside the Sterivex filter. The water inside the Sterivex filter was removed by pushing air into the Sterivex filter three times using the syringe. The inlet and outlet port on the Sterivex filter were capped (VRMP6 and VRSP6, respectively, ISIS Co., Osaka, Japan). This operation was repeated until all water samples were processed. The Sterivex filters were all stored at room temperature until all filtrations were complete.
PMA treatment (see section “PMA Treatment” for details) was performed on 3 of 6 samples for each of the boiled and non-boiled controls following the procedure shown in Figure 2A. The remaining three samples from each of the boiled and non-boiled controls were not treated with PMA. All DNA extractions from all samples were performed just after the PMA processing and stored at −20°C until qPCR testing. The details of PMA treatment and DNA extraction are shown in sections “PMA Treatment” and “DNA Extraction” respectively. Figure 2A shows the flowchart of experiment 1.
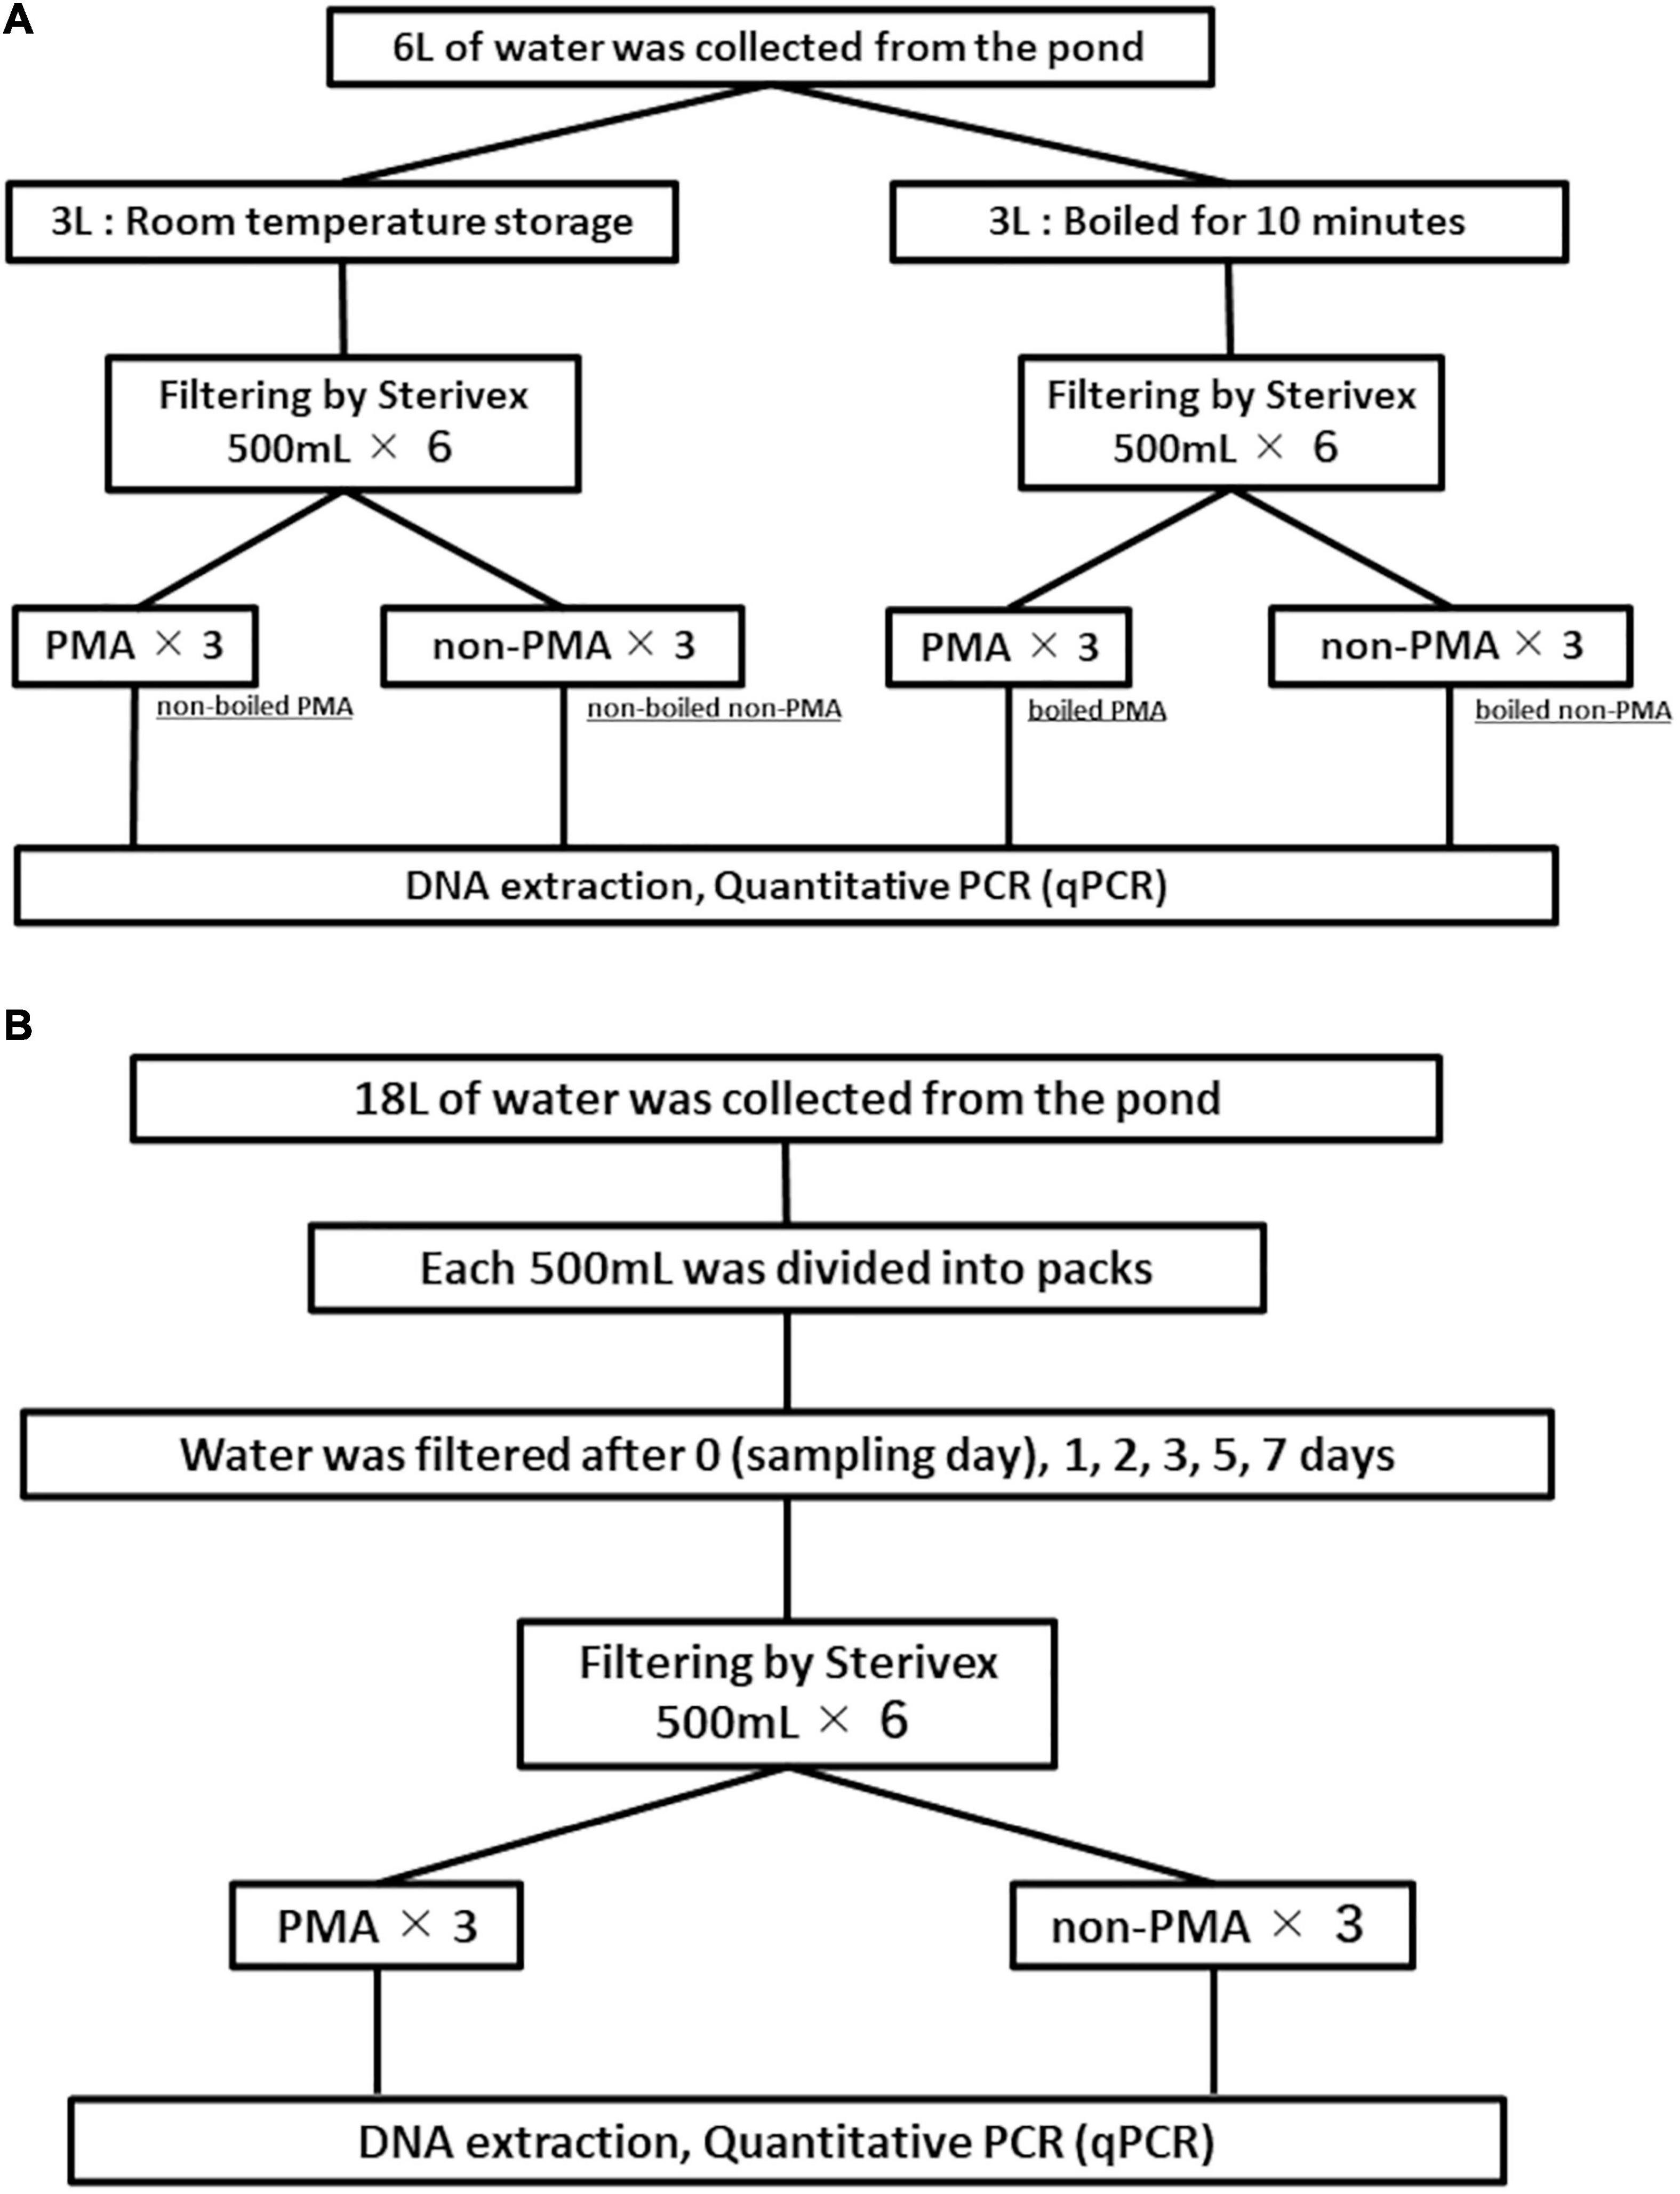
Figure 2. Flowcharts for experiment 1 (A) and experiment 2 (B). Filtration negative controls are not included in the figure.
Experiment 2: Elucidation of Degradation Process of Intracellular/Extracellular eDNA
Aquarium conditions for experiment 2 matched those in experiment 1 (section “Experiment 1: PMA Confirmation Test”) with two exceptions. The volume of water was 30 L, and the fish were kept at a density of 3 individuals ⋅ L–1. We reduced the density of fish in experiment 2 based on the results of experiment 1, because a sufficient DNA copy number was expected to be obtained for quantification by qPCR.
Using a disposable plastic cup, 18 L of water was transferred from the aquarium into a 20 L plastic container. The 18 L water sample was thoroughly mixed by shaking and 500 mL samples (n = 36) were dispensed into disposable plastic packs (DP16-TN1000; Yanagi Co., Nagoya, Japan) and stored in a water bath maintained at 25.14 ± 0.12°C using a heater for incubation. We randomly selected six samples and one FNC (filtration negative control: 500 mL ultrapure water) to process for each point in our time-series (day 0, 1, 2, 3, 5, and 7). All six samples and one FNC for each time-point were filtered through a Sterivex filter. The filtration was performed following Miya et al. (2016) with minor modifications. Briefly, the lid of the plastic pack was replaced with a rubber cap before filtration. A plastic needle with a silicon tube (4987458150067; NIPRO Co., Osaka, Japan) was put into the rubber cap and the end of the other side of the tube was connected to the inlet port of Sterivex filter via plastic luer connector (VR306; ISIS Co.). The outlet port of the Sterivex filter was connected to a vacuum tube with a 10 μL pipette tip. The inlet and outlet ports of the Sterivex filters were capped with VRMP6 and VRSP6, respectively, after filtration and stored at room temperature until all filtrations were completed. PMA treatment was performed on three of the six subsamples from each time-point. The remaining three subsamples from each time-point were not treated with PMA for comparison. DNA was extracted from all samples just after the PMA treatment (see section “PMA Treatment” for details) and stored at −20°C until qPCR testing. Figure 2B shows the flowchart of experiment 2.
PMA Treatment
Two milliliter of 50 μM PMA (PMAxxTM: Biotium, Fremont, CA, United States; adjusted to the concentration with ultrapure water) was added into each Sterivex filter, which was assigned to PMA treatment, from the inlet port using a thin pipette tip. Each Sterivex filter was incubated at room temperature for 10 min while covered by aluminum foil to avoid premature exposure to the light. Then, each Sterivex filter assigned to PMA treatment was exposed to strong visible light (465–470 nm wavelength) for 15 min, activating PMA to form a covalent bond with double-stranded DNA, while non-PMA samples (including FNC) were continuously covered by aluminum foil to avoid premature exposure to the light and stored at room temperature during the PMA treatment. We confirmed that there was not a significant difference in DNA copy numbers between the controls kept in dark and light during non-PMA treatment in a preliminary experiment. Adequate wavelength and sufficient luminance were attained using LED bulbs that met the requirements for the PMA reaction based on information provided from the manufacturer (Biotium). The functional mechanism of the PMA-eDNA interaction is shown in Figure 1. As all the residues containing eDNA are trapped on the surface of the tubular filter in the Sterivex cartridge, we performed PMA treatment by irradiating the filter surface with visible light from all directions from the outside of the cartridge, referring to Ribeiro et al. (2019) that performed PMA treatment on the eDNA samples trapped on sieve clothes.
DNA Extraction
DNA was extracted from all Sterivex filters using a commercial DNA extraction kit (DNeasy Blood and Tissue Kit: Qiagen, Hilden, Germany) following Miya et al. (2016) with minor modifications. Briefly, we removed the cap from the outlet port of the Sterivex filter and inserted the outlet port into a 3 mL test tube (cat.No.5821-255, WATSON Co., Tokyo, Japan). The Sterivex filter was connected in the test tube using surgical grade tape (1530SP-1, 3M Japan Limited, Tokyo, Japan). The combined Sterivex-test tube unit was centrifuged at 4,000 × g for 2 min to remove PMA solution from PMA-treated samples and the remaining water from non-PMA treated samples. The 3 mL test tube was removed from Sterivex filter and discarded, and the outlet port of Sterivex filter was recapped. Then, the inlet port cap was removed, and 20 μL of proteinase-K and 200 μL of Buffer AL was added to Sterivex filter using a thin pipette tip. The inlet port of Sterivex filter was recapped and the Sterivex filter was incubated for 20 min at 56°C on a shaker at 20 rpm (ROLLER6 digital, IKA, Staufenberg, Germany). After the incubation, the inlet cap was removed and the inlet port side of the Sterivex filter was connected to a 3 mL test tube. The Sterivex-test tube unit was tightly connected using surgical grade tape and centrifuged at 4,000 × g for 2 min to collect the DNA solution from Sterivex filter. The Sterivex filter was discarded and 200 μL of absolute ethanol was added to the filtrate in the 3 mL test tube. The DNA in the mixture was purified using a DNeasy kit following the manufacturer’s instruction. During the final elution step, DNA trapped on the silica membrane of the spin column was eluted with 100 μL of Buffer AE. The buffers (Buffer AL and AE) and the proteinase K were provided from the DNeasy kit.
qPCR Conditions
We used StepOnePlus® Real-Time PCR System (Life Technologies, Carlsbad, CA, United States) for qPCR. All qPCR reactions were performed in a total volume of 12 μL, which included 6-μL of 2 × TaqPathTM qPCR Master Mix (Thermo Fisher Scientific, Waltham, United States), 900 nM of each primer and 125 nM of a probe at final concentrations, a 2 μL DNA template and ultrapure water to adjust the total volume. All qPCR was conducted as singleplex with triplicated technical replications. A 1,085 bp fragment of the D. rerio mitochondrial DNA sequence was synthesized as gBlocksTM Gene Fragments (Integrated DNA Technologies Inc.) and used to develop a standard curve for DNA quantification. The synthesized fragment crosses small regions of the three genes (cytb, tRNA-Glu, and ND6) and includes the 10 qPCR assays described in section “Experiment 1: PMA Confirmation Test.” The standards were adjusted to the copy numbers of 3 × 101 – 3 × 10⁴ copies per reaction and were included in triplicate in each qPCR run. Thermal conditions were as follows: 2 min at 50°C and 10 min at 95°C followed by 55 cycles of 95°C for 15 s and 64°C for 90 s. The cycling temperature was determined based on a preliminary experiment to enable all assays to work properly under the same conditions. Negative controls (NTC: non-template control) were conducted in triplicate in all qPCR assays for all qPCR runs, to assess the occurrence of unintended cross contamination using ultrapure water instead of the DNA template. The r2 values of the standard curve for qPCR exceeded 0.98 in all runs in experiment 1 and 2. In addition, the average slope and y-intercept of the standard curve for qPCR were −3.54 ± 0.16 and 37.28 ± 1.38 (average ± standard deviation), respectively.
Statistical Analysis
The eDNA copy number was calculated by averaging technical replicates for each sample. If any of the triplicate reactions for any sample had no amplification, then the copy number for that reaction was regarded as zero and included into the calculation of the average (Ellison et al., 2006). Also, data below the LOQ were excluded from the following analysis. We used R version 3.6.1 for all the statistical analyses (R Core Team, 2019). For experiment 1, analysis of variance (ANOVA) was conducted to test the effect of boiling treatment, PMA treatment, and target sequence length on the eDNA copy number. All of the interactions among the factors were also included to the test as factors.
For experiment 2, we performed multivariate analysis of variance (MANOVA) and post hoc ANOVAs to test the effect of sampling time and target sequence length on the eDNA copy numbers in the non-PMA and PMA treated samples. MANOVA can simultaneously evaluate the effects of each factor on multiple response variables and reduce the likelihood of Type I errors and increase the statistical power (Warne, 2014). A general linear model (GLM) was used to examine how eDNA copy number changes depending on the target sequence length. Furthermore, in order to analyze the eDNA degradation, the degradation constant and the half-life were calculated as indices instead of the time to be undetected which should depend on the initial copy number of eDNA, allowing comparisons between studies (Maruyama et al., 2014; Sassoubre et al., 2016). We assumed that DNA degrades at a constant rate over time, exhibiting exponential degradation, which can be modeled by the following equation:
where N(t) is the estimated number of copies of eDNA at time t, N0 is the number of copies of eDNA at time zero, λ is the decay rate (sometimes denoted as β; Thomsen et al., 2012b; Maruyama et al., 2014), and t is time (i.e., the number of days). Using the nls function in R, the eDNA copy number obtained over the time of each target sequence length in experiment 2 was fitted to an exponential decay curve to calculate the decay rate. The half-life was calculated as follows:
Results
Primer-Probe Design
Both qPCR and agarose gel electrophoresis results indicated that D. rerio DNA was successfully amplified by all 10 assays. However, in silico tests suggested that a single D. nigrofasciatus sequence was potentially amplified with the primer sets F6–F10 (Accession number: KR606519.1). This species had never been kept at our facility nor is it common as an experimental organism, so it was determined that it did not affect the results of this study.
Experiment 1: PMA Confirmation Test
DNA of D. rerio was detected by all assays (F1–F10) in non-boiled-non-PMA, non-boiled-PMA and boiled-non-PMA treatments. Environmental DNA was detected and quantified with only two assays (F1 and F2; 132 and 225 bp) in boiled-PMA samples, while the eDNA copy numbers for assays F3 – F10 (333 bp or longer) fell below the LOQ (Tables 2, 3 and Figure 3). Samples that fell below the LOQ were excluded from further analyses. For non-boiled-PMA treated samples, the percentage decrease in mean eDNA copy number ranged from (95.04–99.17%), where greater decreases in copy number corresponded with increasing target sequence length (Table 2 and Figure 3). The mean eDNA copy number for non-boiled-non-PMA treated samples did not significantly change as target sequence length increased (Table 2 and Figure 3). Comparatively, boiled-PMA treated samples had a greater decrease in mean eDNA copy number, 98.72% (132 bp) and 99.55% (225 bp), while the remaining assays (333 bp or longer) fell below the LOQ. Similar to the non-boiled-non-PMA samples, the mean eDNA copy number for boiled-non-PMA treated samples also did not statistically change (Figure 3) across all target sequence lengths (Table 2 and Figure 3), although the overall mean eDNA copy number was lower. The ANOVA test indicated that eDNA copy number was significantly affected by boiling treatment, where both total eDNA (non-PMA) and intracellular eDNA (PMA) copy number decreased significantly after boiling (all p < 0.05; Table 3 and Figure 3). All FNCs and NTCs were negative for the amplification of D. rerio DNA. All of the raw data obtained by qPCR are shown in Supplementary Table 3.
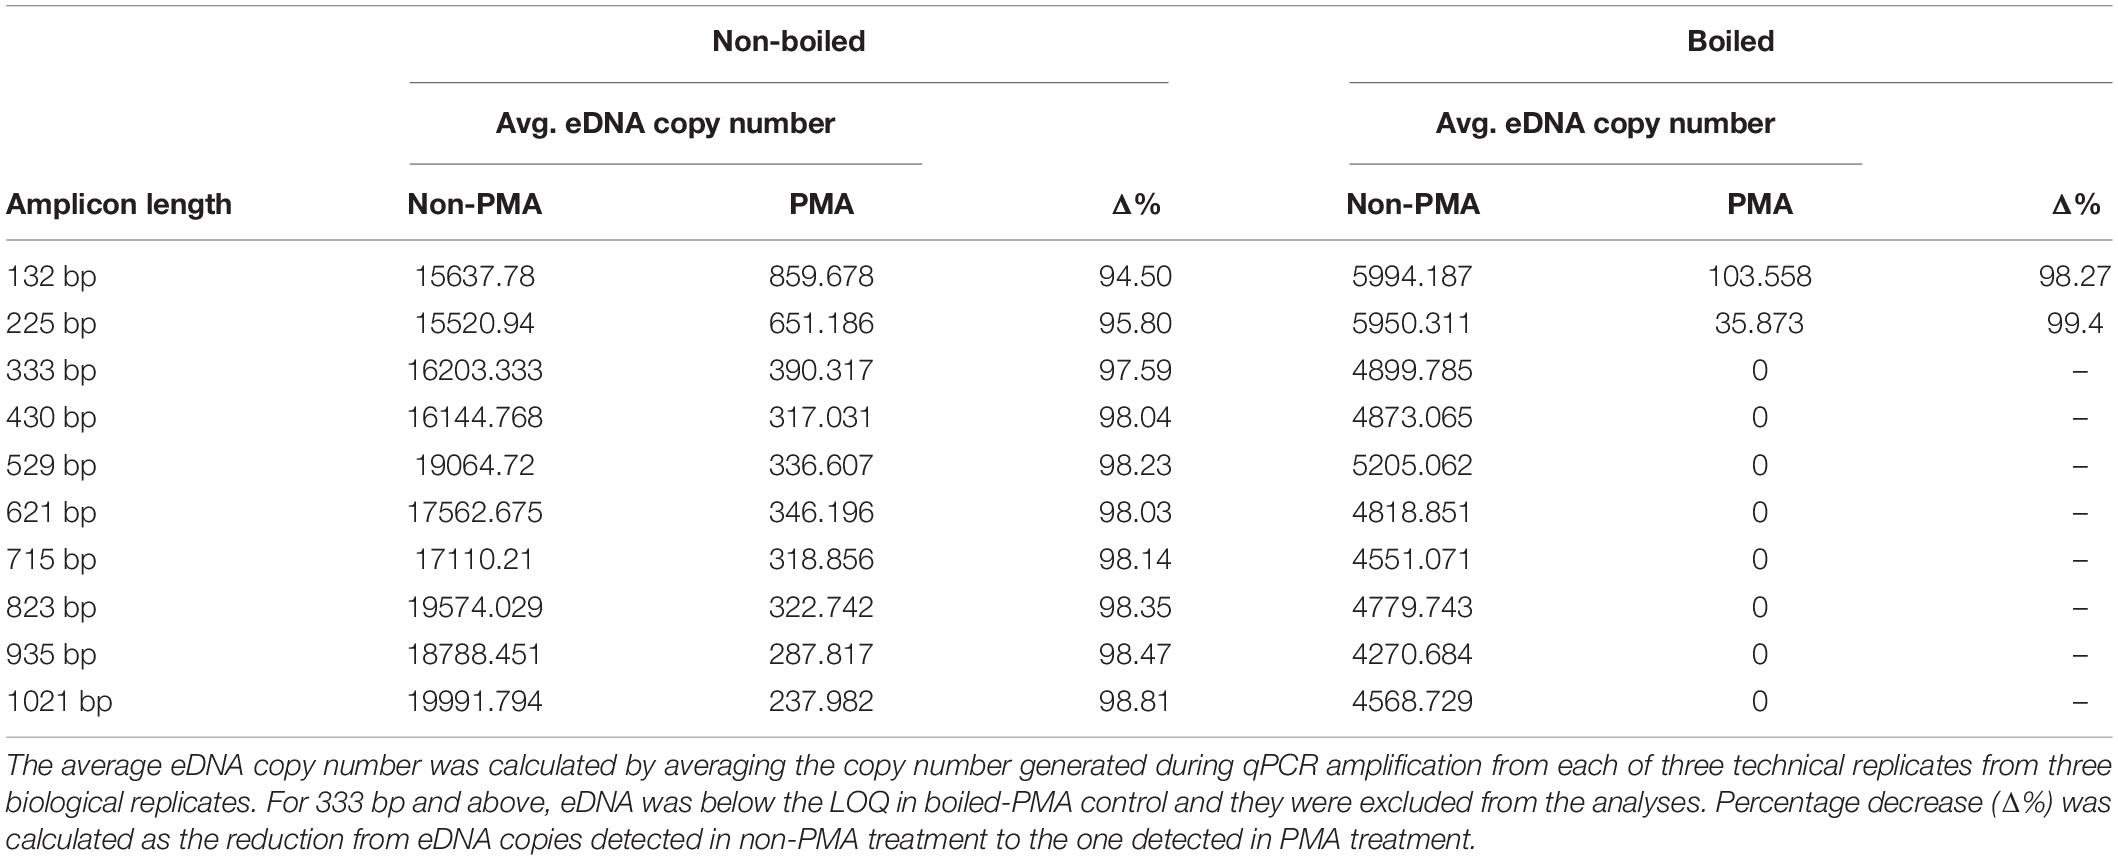
Table 2. Percentage decrease of average eDNA copy number (shown as Δ%) for each assay by PMA treatment in non-boiled and boiled treatments.
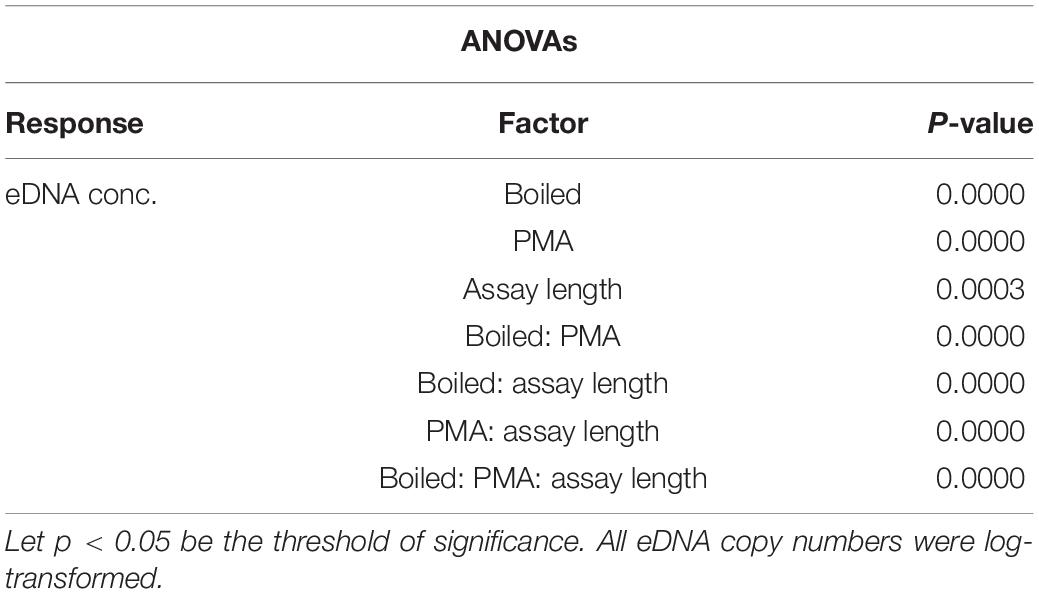
Table 3. ANOVA results for the difference in eDNA copy number as a response to boiled and non-boiled treatment.
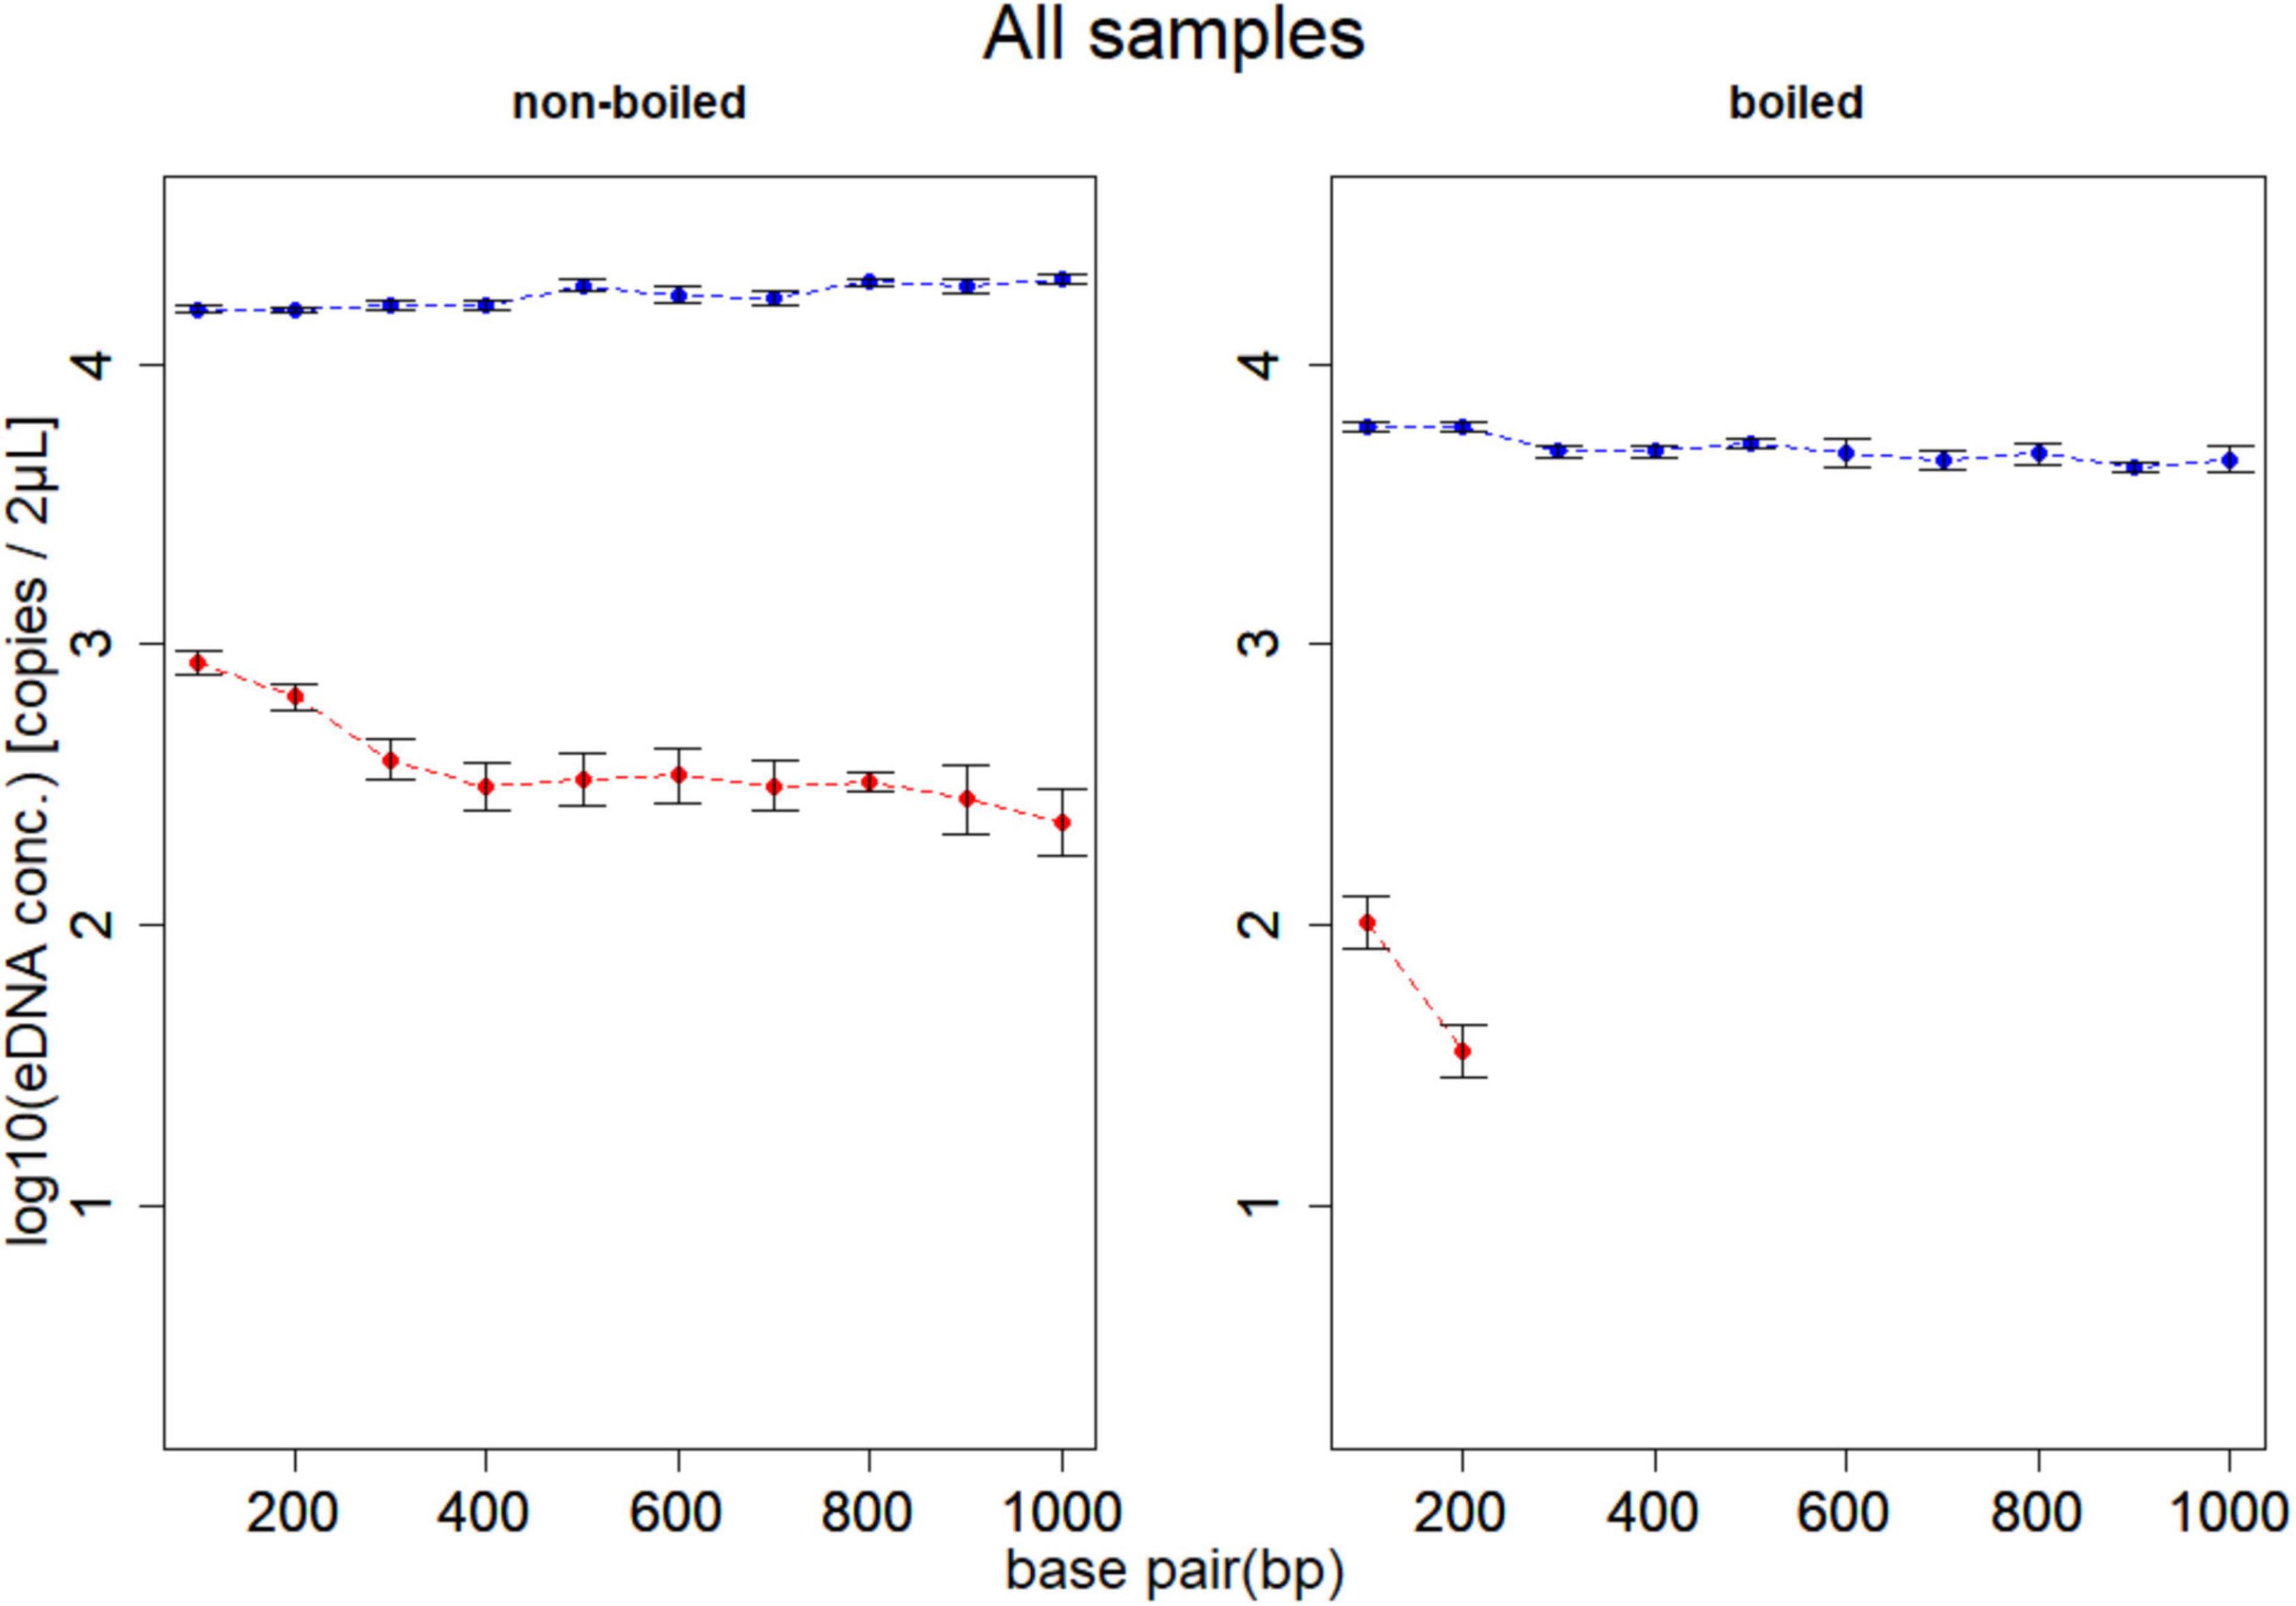
Figure 3. Results of experiment 1. Mean eDNA copy number of samples for boiling and PMA treatments at each of 10 target sequence lengths (132, 225, 333, 440, 529, 621, 715, 832, 935, and 1,021 bp). The left panel shows the non-boiled samples, and the right panel shows the boiled samples. Dashed lines show change in total eDNA copy number (blue; non-PMA) and intracellular eDNA copy number (red; PMA). The total eDNA copy number (blue line) did not change even if the target sequence length increased, and the intracellular eDNA (red line) tended to decrease as the target sequence length increased. In addition, no eDNA above 333 bp was detected in the boiled PMA sample. The effects of the boiling treatment are found on both total and intracellular eDNA, but intracellular eDNA is more significantly affected.
Experiment 2: Elucidation of the Degradation Process of Intracellular eDNA
eDNA copy number data was used as a response to assess the effects that sampling time and target sequence length had on PMA and non-PMA treated samples. Time and target sequence length had significant effects on eDNA copy number (MANOVA, all p < 0.05 Table 4). Post hoc test confirmed that eDNA copy number was significantly affected by target sequence length only in PMA treated samples (intracellular eDNA; ANOVA, p < 0.05 Table 4). While eDNA copy number gradually decreased in both PMA and non-PMA treatments as target sequence length increased (Figure 4), intracellular eDNA copy numbers (PMA treated samples) were significantly lower in 225, 333, 430, 621, and 823 bp assay when using eDNA copy number from 132 bp as a baseline (GLM, Table 5). As for the total eDNA copy number (non-PMA samples), no significant difference was found among the target sequence lengths (MANOVA, p > 0.05 Table 4), so GLM was performed only on the result for intracellular eDNA. The decay rates and the half-life calculations are shown in Supplementary Table 2 and Figure 5, respectively. The half-life of the total eDNA was almost unchanged with respect to the target sequence length (To be exact, it decreased with the target sequence length, but the p-value was not significant; MANOVA, p > 0.05 Table 4), whereas the half-life of intracellular eDNA tended to decrease with increasing target sequence length (Figure 5). The calculated half-life was longer for intracellular eDNA at all (testable) target sequence lengths, and nearly double at 132 bp (Figure 5). In addition, as target sequence length increased, the difference in half-life tended to decrease. All of FNC and NTC were negative for the amplification of D. rerio DNA. All of the raw data obtained by qPCR are shown in Supplementary Table 4.
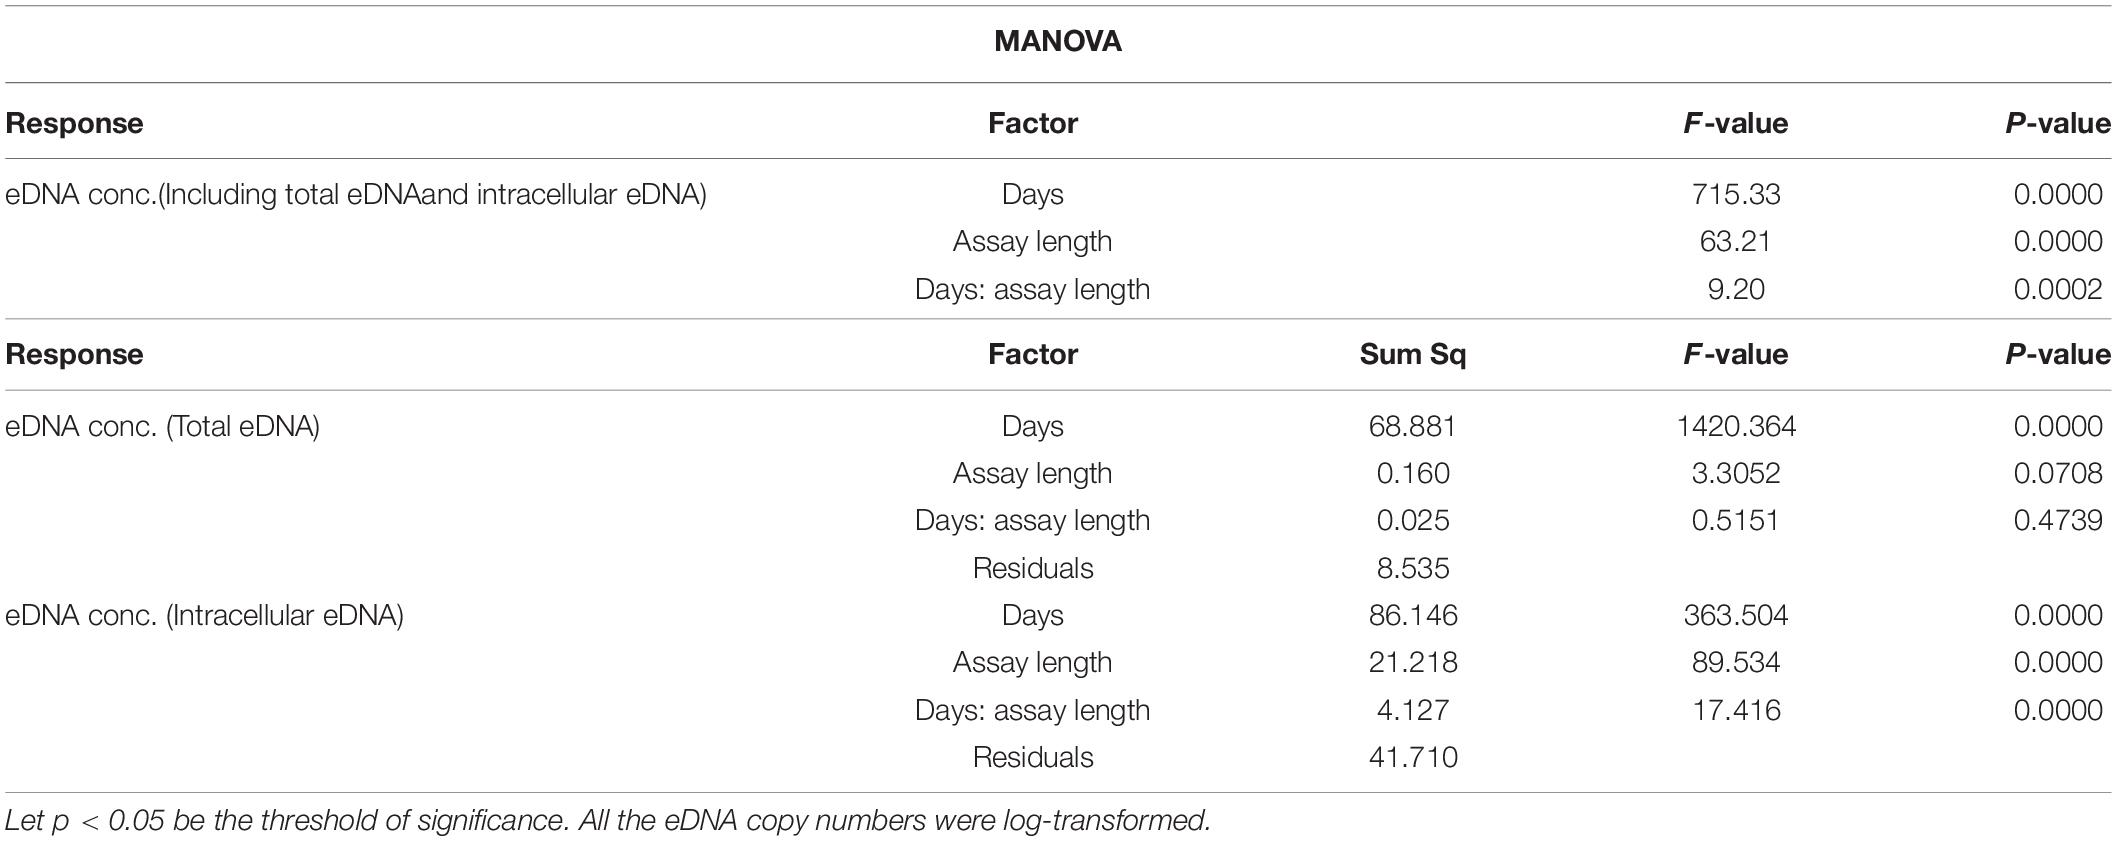
Table 4. Results of MANOVA (upper) and post hoc test (lower) for the relationships between eDNA copy numbers at each treatment (PMA/intracellular eDNA vs. non-PMA/total eDNA) and each factor (days and assay length).
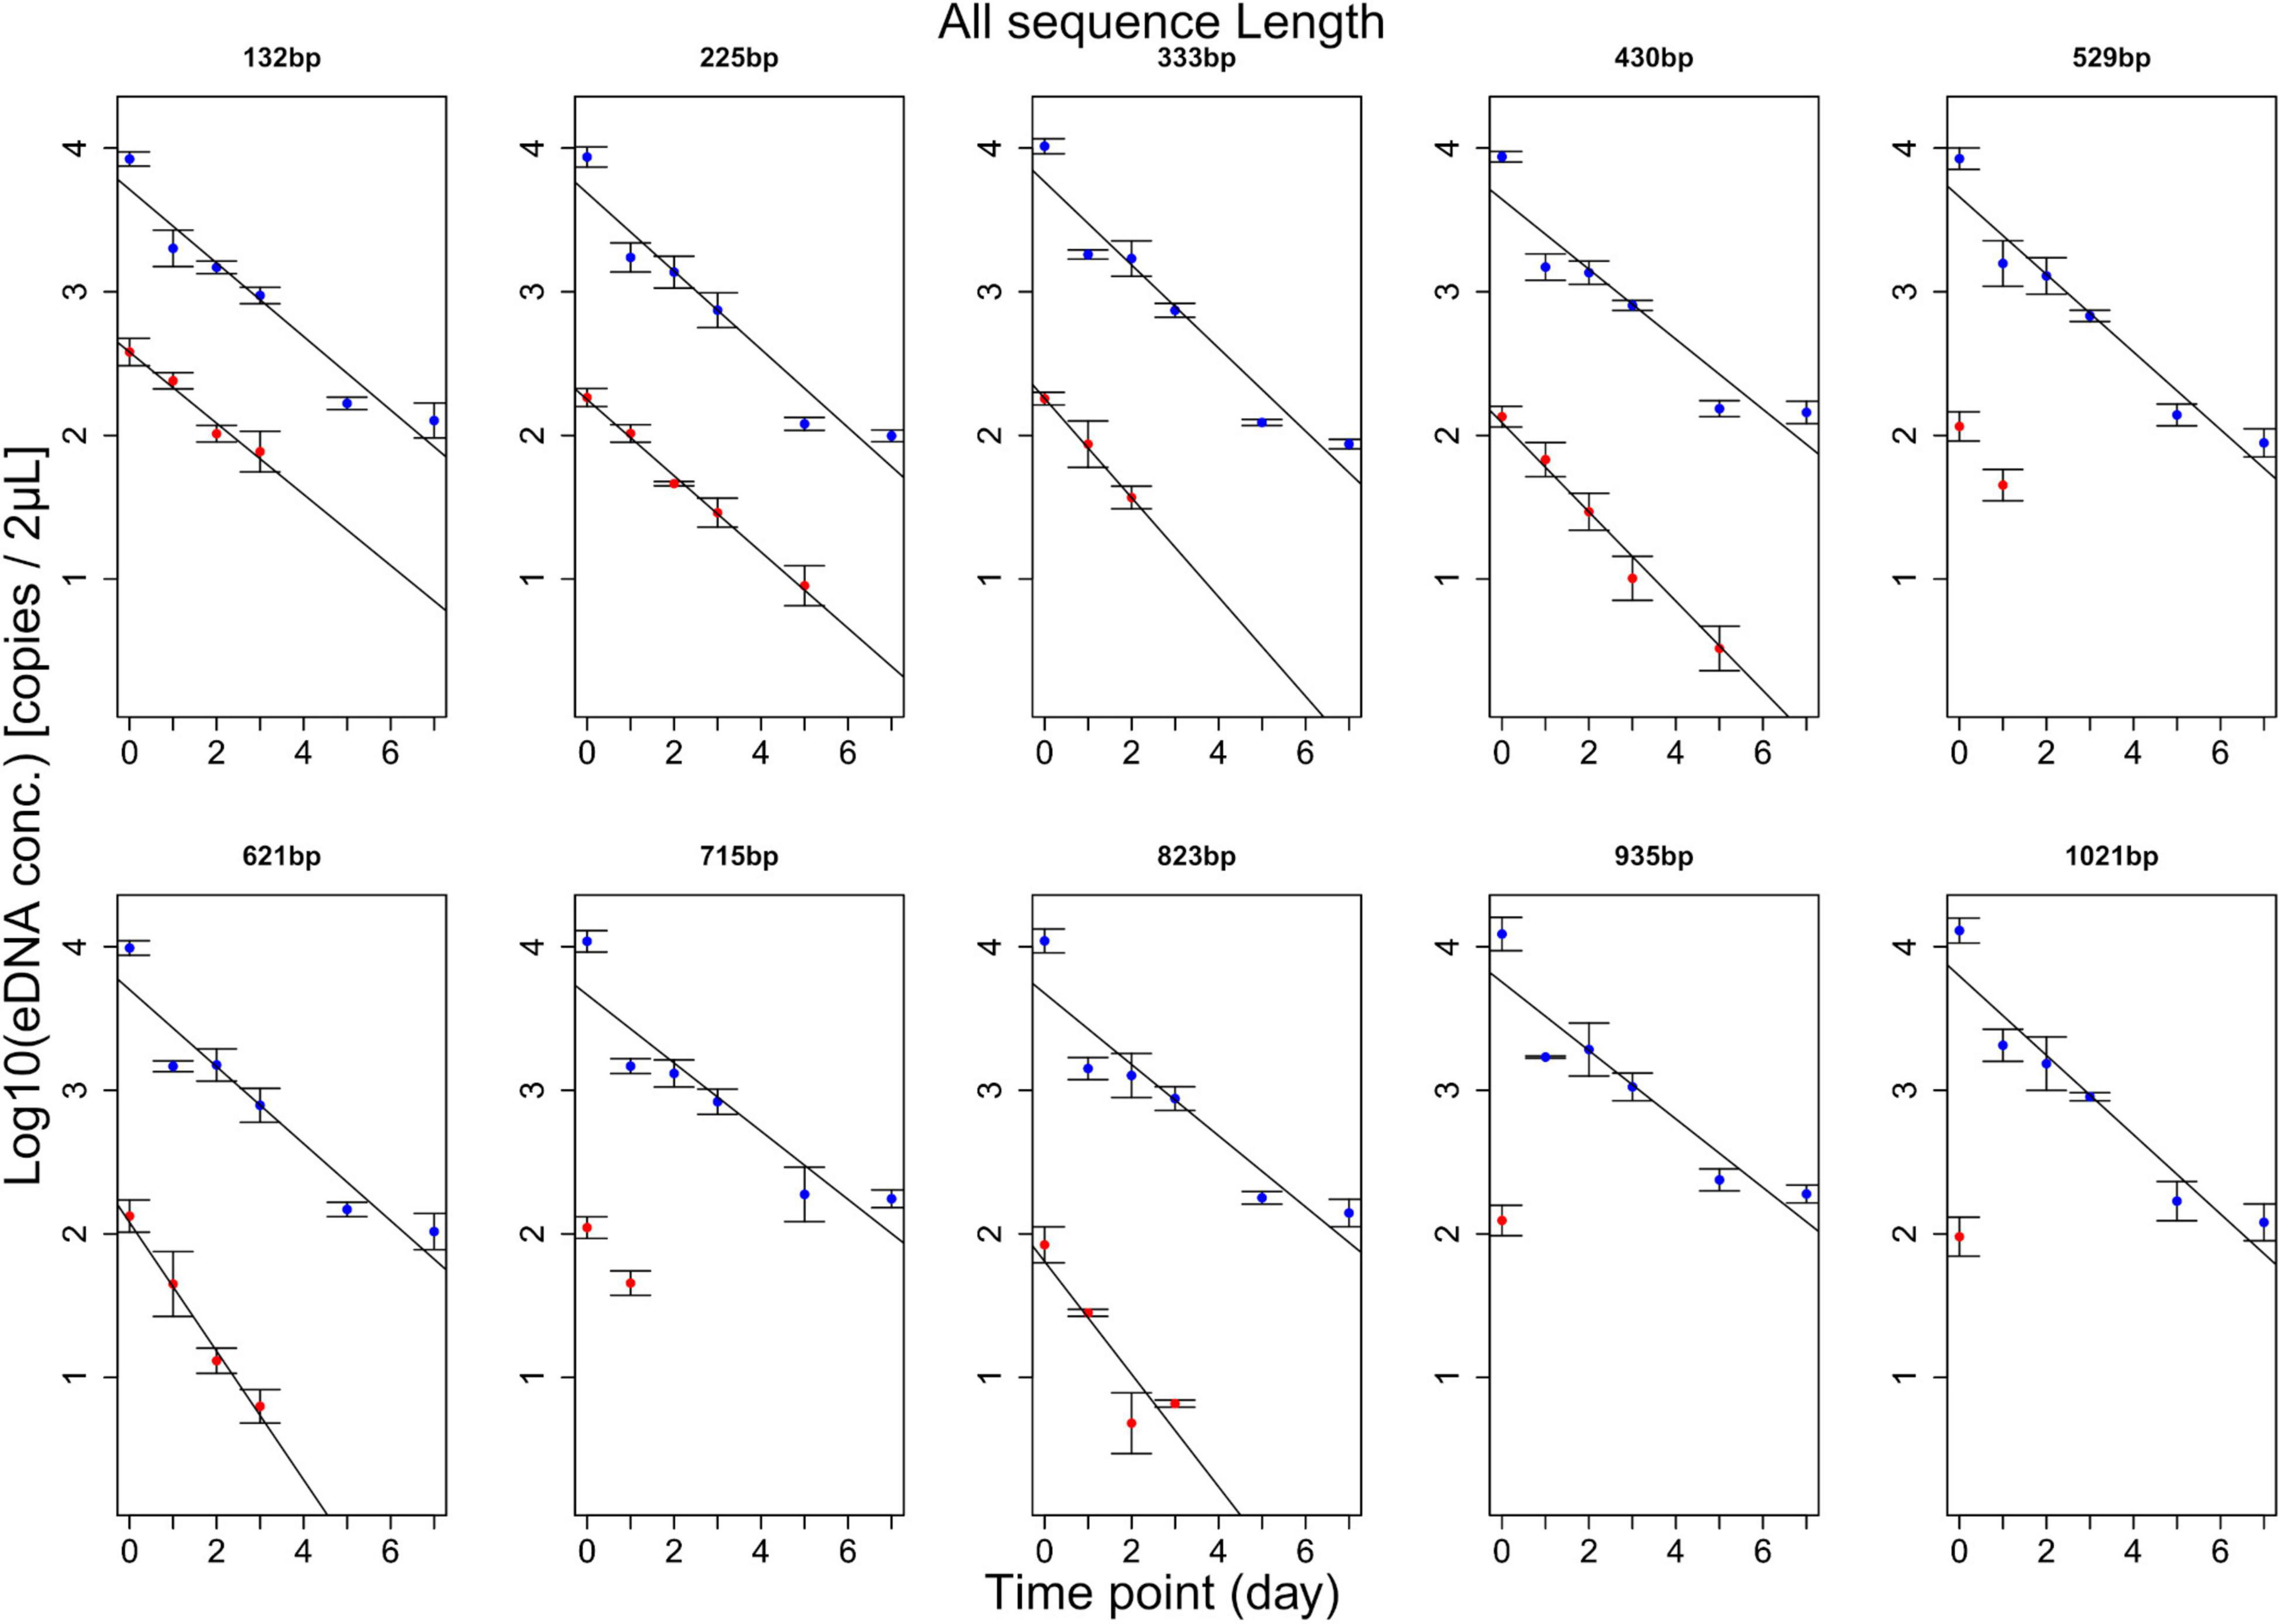
Figure 4. Results of experiment 2. The change over time for each amplicon length is shown. The blue line shows the change in total eDNA copy number, and the red line shows the change in intracellular eDNA copy number. For 529, 715, 935, and 1,021 bp, only two or less time points were detected, so statistical processing was not performed. The total eDNA has the same result regardless of the target sequence length, but the intracellular eDNA tends to have a slight change in the regression line as the target sequence length increases.
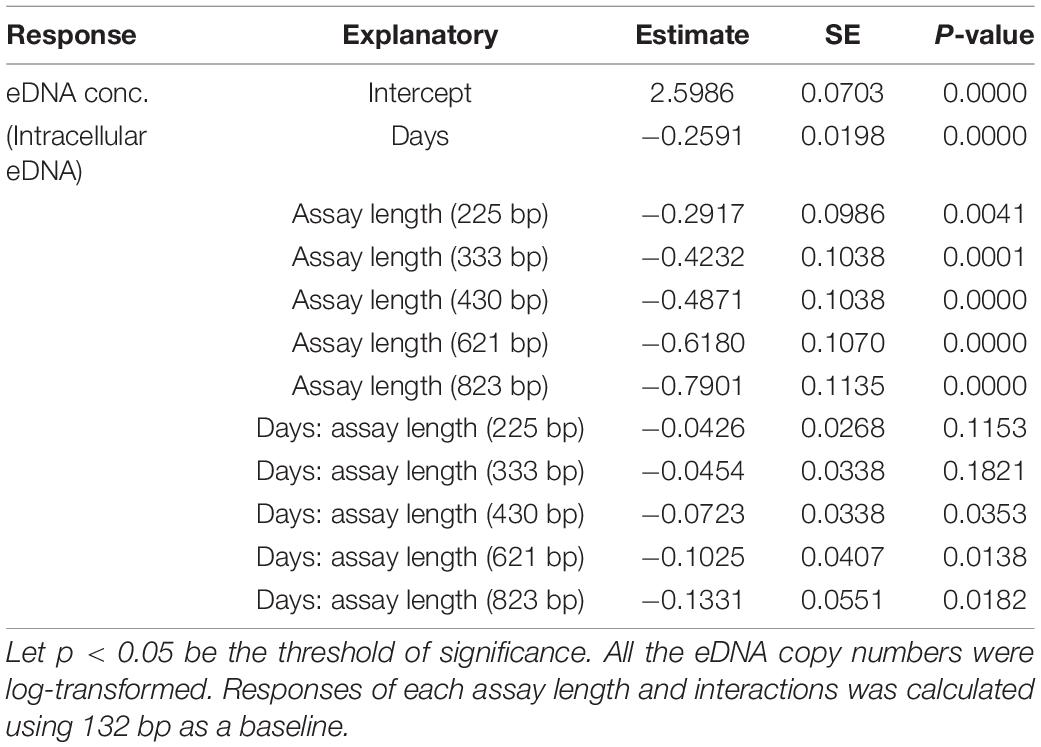
Table 5. GLM analysis results for testing response of intracellular (PMA) eDNA copy numbers to days and assay length.
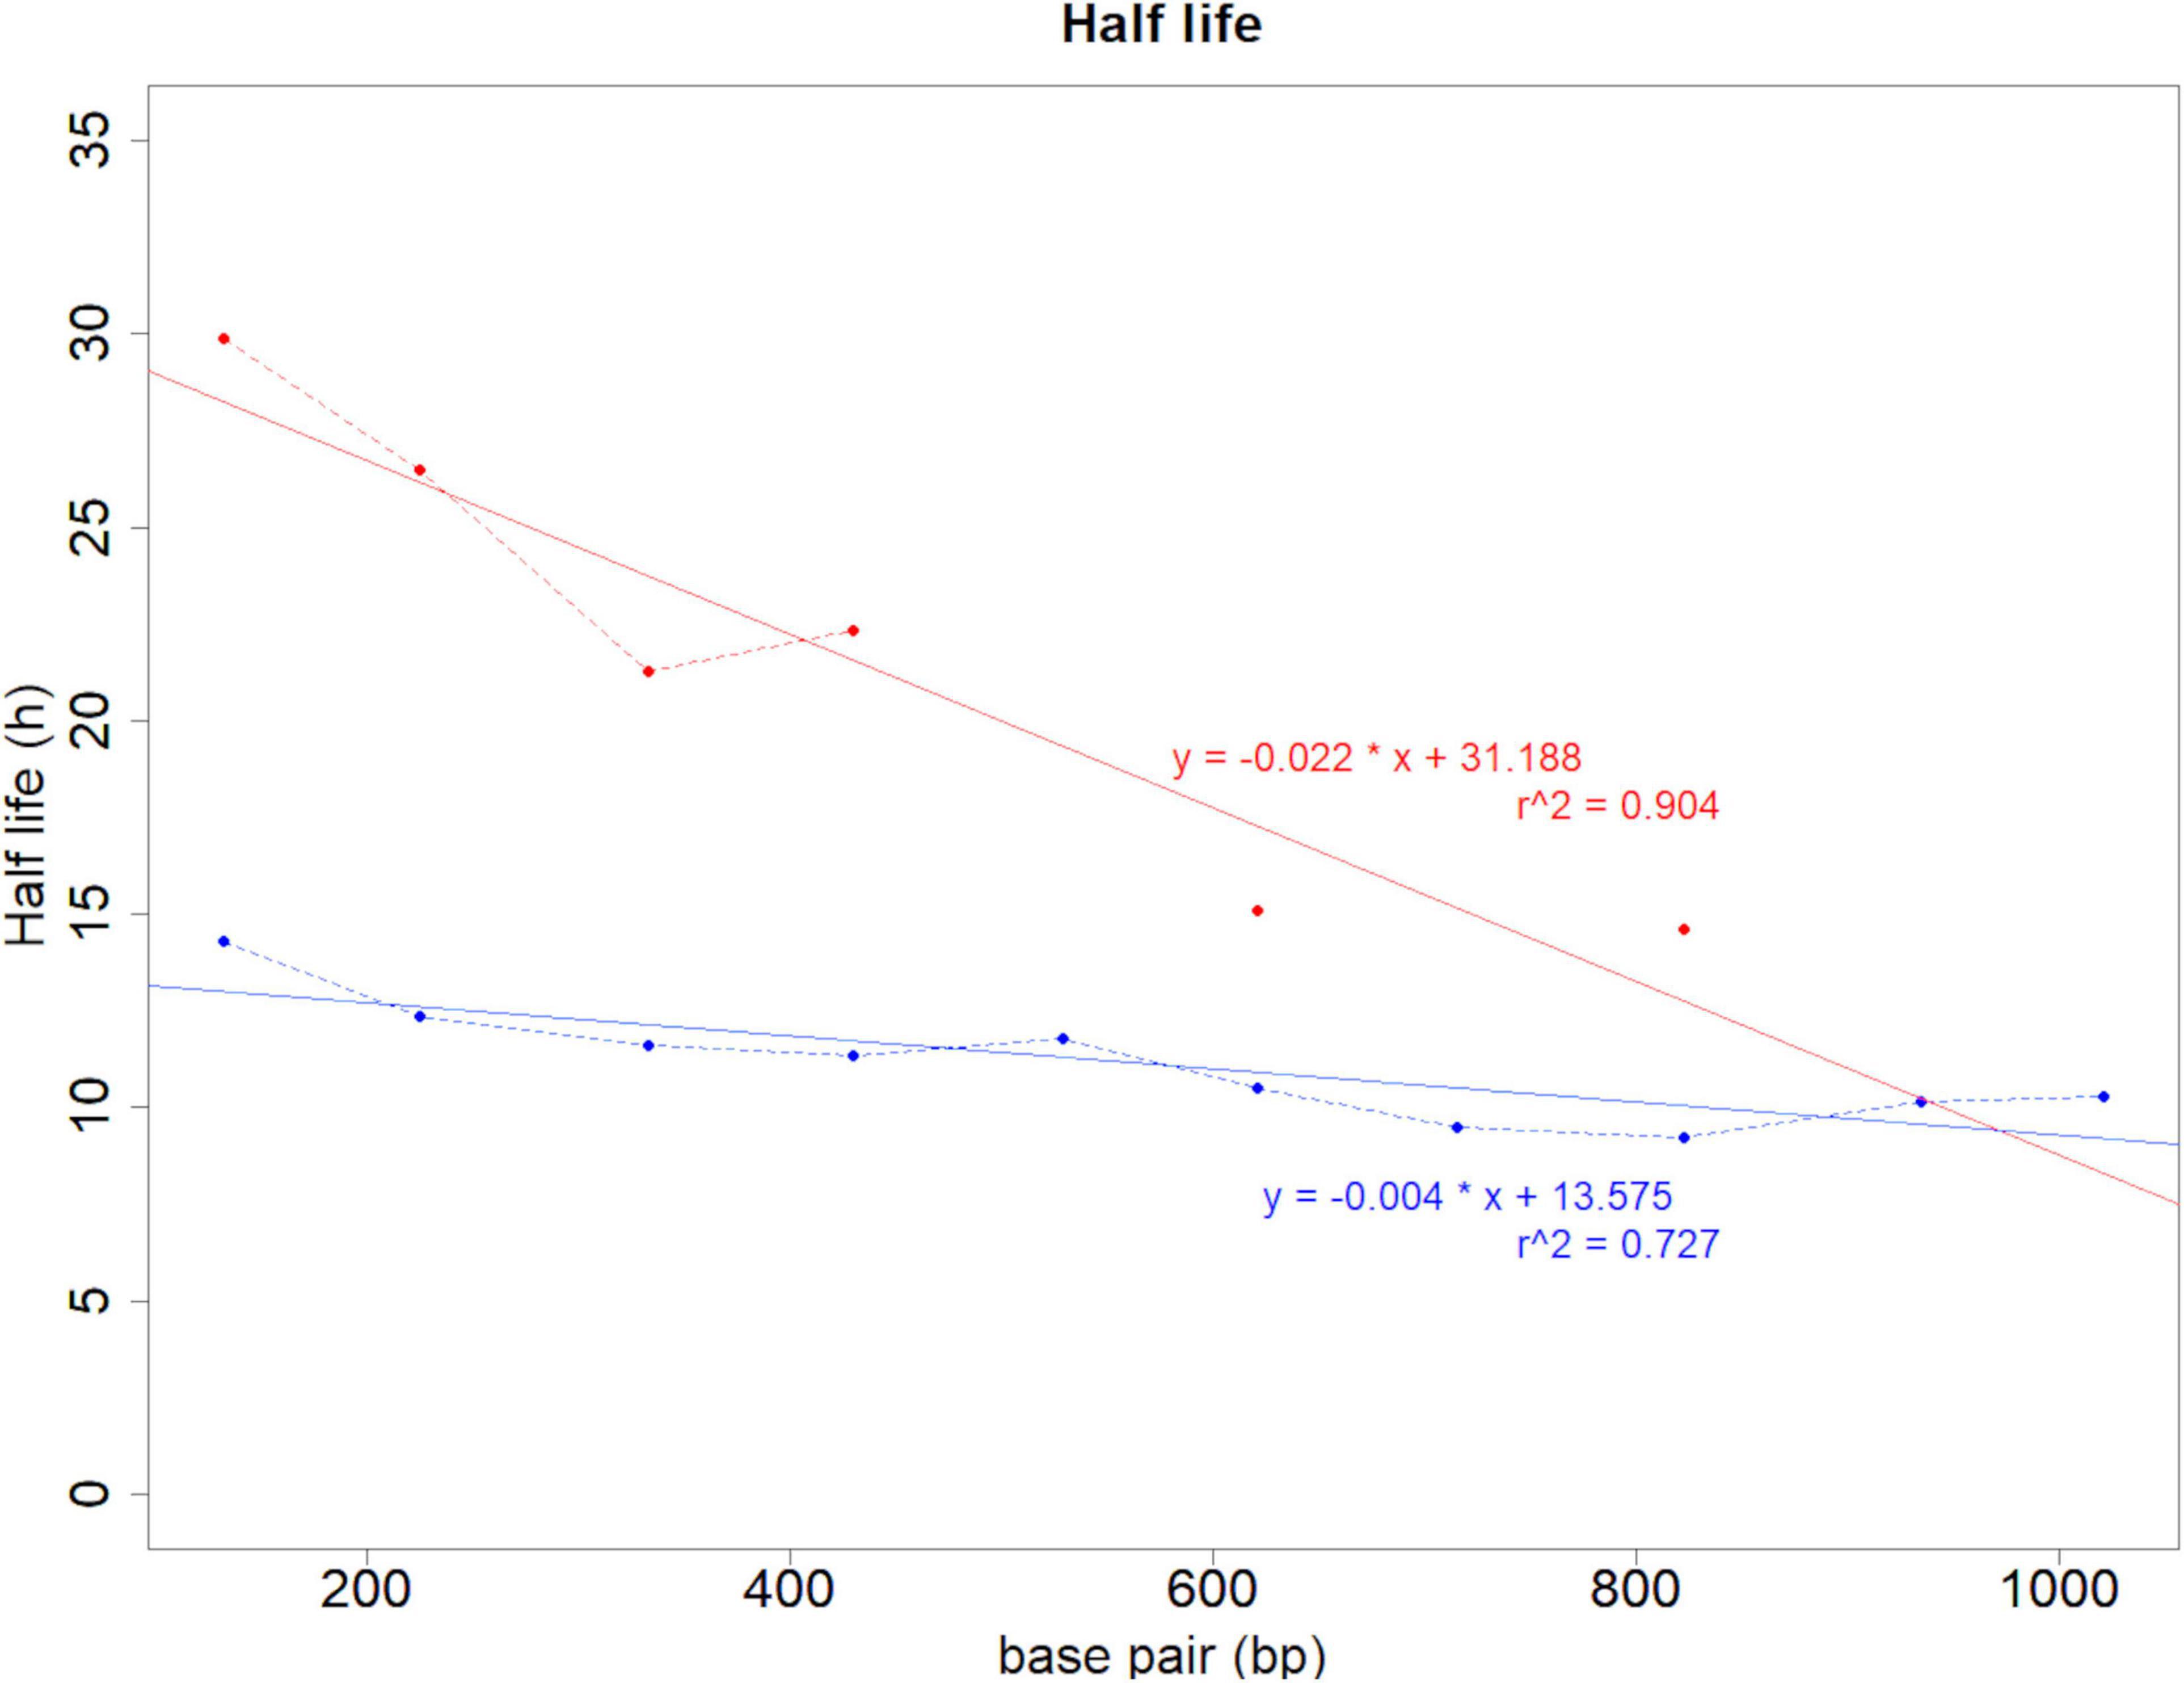
Figure 5. Half-life results calculated from the decay rate. The vertical axis shows the half-life (hours), and the horizontal axis shows the sequence lengths. The blue line shows the change in total eDNA copy number, and the red line shows the change in intracellular eDNA copy number. At 529, 715, 935, and 1,021 bp of intracellular eDNA (red line), the half-life could not be statistically calculated because the eDNA copy number was obtained only at 2 time points or less.
Discussion
Experiment 1: PMA Confirmation Test
For the first time, we have shown that PMA is effective for selectively amplifying DNA from intact vertebrate cells. However, while PMA could not completely exclude extracellular and disrupted cell-derived DNA from PCR amplification, we confirmed that PMA could work on damaged fish cells to cause a significant reduction in the detected amount of DNA (Tables 2, 3 and Figure 3). As we expected, there was a drastic difference in the mean eDNA copy number between the boiled and non-boiled, PMA treated samples. Boiling disrupted cell membranes thereby allowing PMA to bind to DNA and either prevent amplification all together or reduce amplification below the LOQ (Figure 3) for all the assays, except the two shortest target sequence lengths (132 and 225 bp). The significant decrease in eDNA copy number of the boiled and non-boiled samples after PMA treatment, and the (expected) small decrease of eDNA copy number for non-PMA treated samples (Figure 3) suggests that boiling caused DNA degradation. It is probable that longer fragments in our samples that were boiled (100°C) for 10 min would have been degraded, which would cause an increase in smaller fragments (i.e., < 333 bp). Studies looking at the effects of thermal degradation on DNA for plants and bacteria indicate that prolonged exposure to high temperatures (50–200°C) will cause longer fragments to degrade, but smaller amplifiable fragments can persist (Zhang and Wu, 2005; Hrnčírová et al., 2008; Lo et al., 2015; Bitskinashvili et al., 2018). Given the short thermal exposure time in our experiment, any DNA degradation caused by high temperature is likely small and probably associated with other degradation processes (e.g., lipid peroxidation; sensu Zhang and Wu, 2005); however, this mechanism is outside the scope of our study, and our hypotheses are limited. Furthermore, there is evidence to suggest that PMA cannot completely suppress PCR amplification in cases where the target fragment is too short (e.g., 190 bp) (Luo et al., 2010). Given the increase in smaller fragments as extracellular DNA caused by boiling and the inability of PMA to complete inhibit PCR for short fragments, this may explain why amplification was still observed with the 132 and 225 bp fragments after PMA treatment was applied.
Experiment 2: Elucidation of Degradation Process of Intracellular eDNA
Also, for the first time, we were able to selectively amplify and quantify intracellular eDNA, and model the associated degradation rate. The MANOVA results suggested that the total eDNA present in the sample maintained comparable copy numbers between different target sequence lengths, even in the longest sequence (1,021 bp), and this pattern was maintained during the 7-day incubation period. Conversely, the intracellular eDNA copy number showed significant decreases as assay length increased over the 7-day incubation period. An interesting pattern that was observed was the significant interactions between the incubation time and three of the target sequence lengths, 430, 621, 823 bp for PMA treated samples (MANOVA and GLM; Tables 4, 5). There is a distinct difference in the slopes for these three assays that indicates a drastic decrease in mean eDNA copy number with increased time. However, the cause of the drastic slope of these three assays may affect the decay rates of smaller fragments (132, 225, and 333 bp). At any given timepoint, a leptokurtic pattern is expected regarding the number of fragments, such that there will be a significantly larger number of small fragments compared to a smaller number of larger fragments (sensu Deagle et al., 2006). Specifically, when larger fragments degrade, they are broken into smaller fragments and these smaller fragments add to the overall quantity of smaller fragments, which lend themselves to “slowing” the decay rate for smaller fragments.
Our results for total eDNA follow similar patterns seen in other studies that assessed target sequence length and time as a factor of eDNA degradation (Sassoubre et al., 2016; Lance et al., 2017; Bylemans et al., 2018; Jo et al., 2019). GLM was not performed on total eDNA, as no effect of target sequence length was observed (Table 4), indicating that the degradation process of total eDNA might be similar regardless of the target sequence length, at least in the aquarium setup of the present study. Alternatively, our results demonstrate that intracellular eDNA may have a different degradation process from that of total eDNA (Table 4 and Figures 4, 5). The half-life calculated for each target sequence length was greater for intracellular eDNA, but was negatively correlated with increasing target sequence length (Figure 5 and Supplementary Table 2). While lack of amplification (or amplification meeting the LOQ) prevented statistical analyses of half-life indices for larger fragment sizes in intracellular eDNA, it might be assumed that total and intracellular eDNA decay rates are similar at larger fragments sizes based on regression (Figure 5). This is, in part, supported by our inability to detect larger fragments after the initial sampling (Day 0) which indicates a short half-life (Figure 4). Other studies have reported that longer amplicons amplified by PCR have lower quantity and faster degradation when analyzing total eDNA (Deagle et al., 2006; Jo et al., 2017), although the fraction of intracellular eDNA as part of the total eDNA was much smaller in the case of our aquarium water compared to the larger systems used in Deagle et al. (2006) and Jo et al. (2017). Furthermore, the interpretation of eDNA degradation results could be better supported if accurate estimates of intact vertebrate cells in total eDNA could be calculated.
Synthesis
In this study, PMA was confirmed to be effective to differentiate “intact cells” from “disrupted cells” in vertebrate eDNA analysis, enabling the independent detection of intracellular eDNA among the total eDNA. It has been suggested that intracellular DNA represents a specific fraction of total eDNA (Turner et al., 2014; Jo et al., 2019) but this study is the first to present a method to quantify the fraction more clearly using PMA. Our results suggested that the decay rate is dependent on both the existing state of eDNA, i.e., intracellular vs. extracellular, and the length of the target sequence. The process of eDNA degradation may differ between experimental conditions and in the natural environment, and thus it is important to confirm the degradation pattern of intracellular eDNA in environmental water samples under various environmental conditions (e.g., pH, trophic state, temperature and biomass; Jo et al., 2019). For example, intracellular DNA is suggested to degrade much less efficiently than extracellular DNA, by extracellular enzymes, due to the presence of cell membranes (Paul et al., 1987; Levy-Booth et al., 2007; Corinaldesi et al., 2008). Our results from experiment 2, where the half-life of intracellular eDNA was longer than the half-life of total eDNA, suggest that intracellular eDNA is protected from external degradation factors by the cell membrane. Many cells begin to degrade by apoptosis before shedding from the individual (Hotchkiss et al., 2009). However, during normal apoptotic shedding of epithelial cells, intact mitochondria may be released from the cell and mtDNA may be protected from endonuclease degradation (Murgia et al., 1992; Tepper and Studzinski, 1993). In aquatic animals, this process releases the entire mitochondria into the water column, where the bilayer resists degradation and mitochondrial nucleoids further protect mtDNA (Rickwood and Chambers, 1981). The mitochondrial bilayer and tissue cell membrane could provide a greater level of protection against DNA degradation that is not seen with just one cell membrane alone (Foran, 2006).
Conversely, while protected from external decomposition factors, internal degradation factors may act on eDNA before it is released from the target species. In Experiment 1, the total eDNA copy number of the non-boiled samples did not change as the target sequence length increased, but the intracellular eDNA copy number changed. Although intracellular eDNA is protected from external degradation factors in the environment and has a longer half-life, there is a possibility that DNA fragmentation is progressing due to internal degradation factors associated with apoptotic processes (Nagata, 2005; Hotchkiss et al., 2009). This indicates that extracellular eDNA (free eDNA), damaged intracellular eDNA and intracellular eDNA may be subject to separate degradation processes. In the future, in order to further clarify mechanisms driving eDNA degradation rates and processes, it is necessary to study the dynamics of each existing state, as well as, total eDNA. This will ultimately provide a basis for developing more robust analyses that help limit or prevent process Type I and II errors.
PMA has been effective as a molecular surveillance tool for human health issues, but has a great potential to assist with future conservation efforts of aquatic systems. Removing the “noise,” such as eDNA resuspended from sediments or transported from upstream sites, can increase the accuracy eDNA surveillance by allowing researchers to detect contemporary signals from of targeted species. As discussed earlier, process Type I errors in current eDNA analyses may results due to the (unintentional) misinterpretation of the eDNA sources (e.g., the transport of eDNA by predator droppings, boats, or wetland birds) (Deiner and Altermatt, 2014; Merkes et al., 2014). In cases where rapid and accurate biosurveillance information is needed, like determining if an invasive species has entered a new body of water, combined PMA-treatment with multi-assay surveillance (especially assays with different amplicon lengths) may help avoid misinterpretation and determine whether the signal obtained by eDNA analysis is new or old. To this end, resource management agencies deploy various eradication measures to remove invasive species from invaded systems (Bonar et al., 2009; Booy et al., 2017). PMA-eDNA surveillance would allow researchers to discern between intact and degraded cells, to identify the effectiveness of eradication strategies, i.e., detection of intracellular eDNA after a set time period might indicate that an eradication strategy has failed. The timing of seasonal migratory patterns of fish (long-term stabilization by sediment adsorption) could be more easily and reliably assessed (Maruyama et al., 2014). Critical habitat and spawning habitat (and season) are unknown for many aquatic organisms, and thus PMA-eDNA can help researchers hone in on specific areas of an aquatic environment without the need visual surveys that require many hours and resources. To realize these applied ideas in future research, we hope that the combination of PMA with multiple-sized amplicons for target species will facilitate new research for clarifying other mechanistic underpinnings of eDNA ecology.
Data Availability Statement
The datasets presented in this study can be found in online repositories. The names of the repository/repositories and accession number(s) can be found in the article/Supplementary Material.
Ethics Statement
Ethical review and approval was not required for the animal study in accordance with the local legislation and institutional requirements, but we followed the instructions suggested by Japanese animal welfare regulations and the “Act on Welfare and Management of Animals” (Ministry of Environment of Japan) for husbandry and handling of fish.
Author Contributions
TH, RP, and HY: concept and design and data analysis. TH, KT, and KM: lab work. All authors: writing final version.
Funding
This work received financial support from the Joint Research Center for Science and Technology Fund of Ryukoku University (2019) and (2018) Ryukoku University Science and Technology Fund. The study was partly supported by the Japan Society for the Promotion of Science (JSPS) KAKENHI (26840152 and 20H03326).
Conflict of Interest
The authors declare that the research was conducted in the absence of any commercial or financial relationships that could be construed as a potential conflict of interest.
Acknowledgments
We thank Dr. Carl O. Ostberg (Western Fisheries Research Center, USGS, United States) for discussions on the interpretation of the results.
Supplementary Material
The Supplementary Material for this article can be found online at: https://www.frontiersin.org/articles/10.3389/fevo.2021.632973/full#supplementary-material
Footnotes
- ^ https://www.ncbi.nlm.nih.gov
- ^ https://mafft.cbrc.jp/alignment/server/index.html
- ^ https://www.ncbi.nlm.nih.gov/tools/primer-blast/
References
Abell, R., Thieme, M. L., Revenga, C., Bryer, M., Kottelat, M., Bogutskaya, N., et al. (2008). Freshwater ecoregions of the world: a new map of biogeographic units for freshwater biodiversity conservation. BioScience 58, 403–414. doi: 10.1641/B580507
Barnes, M. A., and Turner, C. R. (2016). The ecology of environmental DNA and implications for conservation genetics. Conserv. Genet. 17, 1–17. doi: 10.1007/s10592-015-0775-4
Bitskinashvili, K., Gabriadze, I., Kutateladze, T., Vishnepolsky, B., Mikeladze, D., and Datukishvili, N. (2018). Effects of thermal-acid treatment on degradation and amplification of wheat and maize DNA. J. Food Nutr. Res. 57, 242–251.
Bonar, S. A., Hubert, W. A., and Willis, D. W. (2009). Standard Methods for Sampling North American Freshwater Fishes. Bethesda, MA: American Fisheries Society.
Booy, O., Mill, A. C., Roy, H. E., Hiley, A., Moore, N., Robertson, P., et al. (2017). Risk management to prioritise the eradication of new and emerging invasive non-native species. Biol. Invasions 19, 2401–2417. doi: 10.1007/s10530-017-1451-z
Bylemans, J., Furlan, E. M., Gleeson, D. M., Hardy, C. M., and Duncan, R. P. (2018). Does size matter? An experimental evaluation of the relative abundance and decay rates of aquatic environmental DNA. Environ. Sci. Technol. 52, 6408–6416. doi: 10.1021/acs.est.8b01071
Champlot, S., Berthelot, C., Pruvost, M., Bennett, E. A., Grange, T., and Geigl, E.-M. (2010). An efficient multistrategy DNA decontamination procedure of PCR reagents for hypersensitive PCR applications. PLoS One 5:e13042. doi: 10.1371/journal.pone.0013042
Collen, B., Whitton, F., Dyer, E. E., Baillie, J. E., Cumberlidge, N., Darwall, W. R., et al. (2014). Global patterns of freshwater species diversity, threat and endemism. Glob. Ecol. Biogeo. 23, 40–51. doi: 10.1111/geb.12096
Corinaldesi, C., Beolchini, F., and Dell’Anno, A. (2008). Damage and degradation rates of extracellular DNA in marine sediments: implications for the preservation of gene sequences. Mol. Ecol. 17, 3939–3951. doi: 10.1111/j.1365-294X.2008.03880.x
Darling, J. A., and Mahon, A. R. (2011). From molecules to management: adopting DNA-based methods for monitoring biological invasions in aquatic environments. Environ. Res. 111, 978–988. doi: 10.1016/j.envres.2011.02.001
Deagle, B. E., Eveson, J. P., and Jarman, S. N. (2006). Quantification of damage in DNA recovered from highly degraded samples – a case study on DNA in faeces. Front Zool 3:11. doi: 10.1186/1742-9994-3-11
Deiner, K., and Altermatt, F. (2014). Transport distance of invertebrate environmental DNA in a natural river. PLoS One 9:e88786. doi: 10.1371/journal.pone.0088786
Dejean, T., Valentini, A., Duparc, A., Pellier-Cuit, S., Pompanon, F., Taberlet, P., et al. (2011). Persistence of environmental DNA in freshwater ecosystems. PLoS One 6:e23398. doi: 10.1371/journal.pone.0023398
Dejean, T., Valentini, A., Miquel, C., Taberlet, P., Bellemain, E., and Miaud, C. (2012). Improved detection of an alien invasive species through environmental DNA barcoding: the example of the American bullfrog Lithobates catesbeianus: alien invasive species detection using eDNA. J. Appl. Ecol. 49, 953–959. doi: 10.1111/j.1365-2664.2012.02171.x
Ellison, S. L., English, C. A., Burns, M. J., and Keer, J. T. (2006). Routes to improving the reliability of low-level DNA analysis using real-time PCR. BMC Biotechnol. 6:33. doi: 10.1186/1472-6750-6-33
Emerson, J. B., Adams, R. I., Román, C. M. B., Brooks, B., Coil, D. A., Dahlhausen, K., et al. (2017). Schrödinger’s microbes: tools for distinguishing the living from the dead in microbial ecosystems. Microbiome 5:86. doi: 10.1186/s40168-017-0285-3
Evans, N. T., Shirey, P. D., Wieringa, J. G., Mahon, A. R., and Lamberti, G. A. (2017). Comparative cost and effort of fish distribution detection via environmental DNA analysis and electrofishing. Fisheries 42, 90–99. doi: 10.1080/03632415.2017.1276329
Ficetola, G. F., Pansu, J., Bonin, A., Coissac, E., Giguet-Covex, C., De Barba, M., et al. (2015). Replication levels, false presences and the estimation of the presence/absence from eDNA metabarcoding data. Mol. Ecol. Resour. 15, 543–556. doi: 10.1111/1755-0998.12338
Foran, D. R. (2006). Relative degradation of nuclear and mitochondrial DNA: an experimental approach. J. Forensic Sci 51, 766–770. doi: 10.1111/j.1556-4029.2006.00176.x
García-Fontana, C., Narváez-Reinaldo, J. J., Castillo, F., González-López, J., Luque, I., and Manzanera, M. (2016). A new physiological role for the DNA molecule as a protector against drying stress in desiccation-tolerant microorganisms. Front. Microbiol. 7:2066. doi: 10.3389/fmicb.2016.02066
Goldberg, C. S., Sepulveda, A., Ray, A., Baumgardt, J., and Waits, L. P. (2013). Environmental DNA as a new method for early detection of New Zealand mudsnails (Potamopyrgus antipodarum). Freshw. Sci. 32, 792–800. doi: 10.1899/13-046.1
Hajibabaei, M., Baird, D. J., Fahner, N. A., Beiko, R., and Golding, G. B. (2016). A new way to contemplate Darwin’s tangled bank: how DNA barcodes are reconnecting biodiversity science and biomonitoring. Philos. Trans. R. Soc. Lond. B 371:20150330. doi: 10.1098/rstb.2015.0330
Hayes, D. B., Ferreri, C. P., and Taylor, W. W. (1996). “Active fish capture methods,” in Fisheries Techniques, 2nd Edn, eds B. R. Murphy and D. W. Willis (Bethesda, MD: American Fisheries Society), 193–220.
Hotchkiss, R. S., Strasser, A., McDunn, J. E., and Swanson, P. E. (2009). Cell death. N. Engl. J. Med. 361, 1570–1583. doi: 10.1056/NEJMra0901217
Hrnčírová, Z., Bergerová, E., and Siekel, P. (2008). Effects of technological treatment on DNA degradation in selected food matrices of plant origin. J. Food Nutr. Res 47, 23–28.
Jerde, C. L., Mahon, A. R., Chadderton, W. L., and Lodge, D. M. (2011). “Sight-unseen” detection of rare aquatic species using environmental DNA: EDNA surveillance of rare aquatic species. Conserv. Lett. 4, 150–157. doi: 10.1111/j.1755-263X.2010.00158.x
Jo, T., Arimoto, M., Murakami, H., Masuda, R., and Minamoto, T. (2019). Particle size distribution of environmental DNA from the nuclei of marine fish. Environ. Sci. Technol. 53, 9947–9956. doi: 10.1021/acs.est.9b02833
Jo, T., Murakami, H., Masuda, R., Sakata, M. K., Yamamoto, S., and Minamoto, T. (2017). Rapid degradation of longer DNA fragments enables the improved estimation of distribution and biomass using environmental DNA. Mol. Ecol. Resour, 17, e25–e33. doi: 10.1111/1755-0998.12685
Joo, S., Park, P., and Park, S. (2019). Applicability of propidium monoazide (PMA) for discrimination between living and dead phytoplankton cells. PLoS One 14:e0218924. doi: 10.1371/journal.pone.0218924
Kamoroff, C., and Goldberg, C. S. (2018). An issue of life or death: using eDNA to detect viable individuals in wilderness restoration. Freshw. Sci. 37, 685–696. doi: 10.1086/699203
Lance, R., Klymus, K., Richter, C., Guan, X., Farrington, H., Carr, M., et al. (2017). Experimental observations on the decay of environmental DNA from bighead and silver carps. Manag. Biol. Invasions 8, 343–359. doi: 10.3391/mbi.2017.8.3.08
Lance, R. F., and Carr, M. R. (2012). Detecting eDNA of Invasive Dreissenid Mussels: Report on Capital Investment Project. ERDC/TN ANSRP-12-2. Vicksburg, MS: US Army Engineer Research & Development Center, doi: 10.13140/2.1.1265.0887
Levy-Booth, D. J., Campbell, R. G., Gulden, R. H., Hart, M. M., Powell, J. R., Klironomos, J. N., et al. (2007). Cycling of extracellular DNA in the soil environment. Soil Biol. Biochem. 39, 2977–2991. doi: 10.1016/j.soilbio.2007.06.020
Lo, Y.-T., Li, M., and Shaw, P.-C. (2015). Identification of constituent herbs in ginseng decoctions by DNA markers. Chin. Med. 10:1. doi: 10.1186/s13020-015-0029-x
Lodge, D. M., Turner, C. R., Jerde, C. L., Barnes, M. A., Chadderton, L., Egan, S. P., et al. (2012). Conservation in a cup of water: Estimating biodiversity and population abundance from environmental DNA. Mol. Ecol. 21, 2555–2558. doi: 10.1111/j.1365-294X.2012.05600.x
Luo, J. F., Lin, W. T., and Guo, Y. (2010). Method to detect only viable cells in microbial ecology. Appl. Microbiol. Biotechnol. 86, 377–384. doi: 10.1007/s00253-009-2373-1
Mächler, E., Osathanunkul, M., and Altermatt, F. (2018). Shedding light on eDNA: Neither natural levels of UV radiation nor the presence of a filter feeder affects eDNA-based detection of aquatic organisms. PLoS One 13:e0195529. doi: 10.1371/journal.pone.0195529
Martin, B., Raurich, S., Garriga, M., and Aymerich, T. (2013). Effect of amplicon length in propidium monoazide quantitative PCR for the enumeration of viable cells of Salmonella in cooked ham. Food Anal. Methods 6, 683–690. doi: 10.1007/s12161-012-9460-0
Maruyama, A., Nakamura, K., Yamanaka, H., Kondoh, M., and Minamoto, T. (2014). The release rate of environmental DNA from juvenile and adult fish. PLoS One 9:e114639. doi: 10.1371/journal.pone.0114639
Merkes, C. M., McCalla, S. G., Jensen, N. R., Gaikowski, M. P., and Amberg, J. J. (2014). Persistence of DNA in carcasses, slime and avian feces may affect interpretation of environmental DNA data. PLoS One 9:e113346. doi: 10.1371/journal.pone.0113346
Miya, M., Minamoto, T., Yamanaka, H., Oka, S., Sato, K., Yamamoto, S., et al. (2016). Use of a filter cartridge for filtration of water samples and extraction of environmental DNA. J. Vis. Exp. 117:54741. doi: 10.3791/54741
Murakami, H., Yoon, S., Kasai, A., Minamoto, T., Yamamoto, S., Sakata, M. K., et al. (2019). Dispersion and degradation of environmental DNA from caged fish in a marine environment. Fish. Sci. 85, 327–337. doi: 10.1007/s12562-018-1282-6
Murgia, M., Pizzo, P., Sandoná, D., Zanovello, P., Rizzut, R., and Virgilio, F. D. (1992). Mitochondrial DNA is not fragmented during apoptosis. J. Biol. Chem. 276, 10939–10941.
Nagata, S. (2005). DNA degradation in development and programmed cell death. Annu. Rev. Immunol. 23, 853–875. doi: 10.1146/annurev.immunol.23.021704.115811
Nocker, A., Sossa-Fernandez, P., Burr, M. D., and Camper, A. K. (2007). Use of propidium monoazide for live/dead distinction in microbial ecology. Appl. Environ. Microbiol. 73, 5111–5117. doi: 10.1128/AEM.02987-06
Paul, J. H., Jeffrey, W. H., and DeFlaun, M. F. (1987). Dynamics of extracellular DNA in the marine environment. Appl. Environ. Microbiol. 53, 170–179. doi: 10.1128/AEM.53.1.170-179.1987
Pilliod, D. S., Goldberg, C. S., Arkle, R. S., and Waits, L. P. (2013). Estimating occupancy and abundance of stream amphibians using environmental DNA from filtered water samples. Can. J. Fish. Aquat. Sci. 70, 1123–1130. doi: 10.1139/cjfas-2013-0047
Pilliod, D. S., Goldberg, C. S., Arkle, R. S., and Waits, L. P. (2014). Factors influencing detection of eDNA from a stream-dwelling amphibian. Mol. Ecol. Resour. 14, 109–116. doi: 10.1111/1755-0998.12159
Rees, H. C., Bishop, K., Middleditch, D. J., Patmore, J. R. M., Maddison, B. C., and Gough, K. C. (2014). The application of eDNA for monitoring of the great crested newt in the UK. Ecol. Evol. 4, 4023–4032. doi: 10.1002/ece3.1272
Ribeiro, H., Martins, A., Gonçalves, M., Guedes, M., Tomasino, M. P., Dias, N., et al. (2019). Development of an autonomous biosampler to capture in situ aquatic microbiomes. PLoS One 14:e0216882. doi: 10.1371/journal.pone.0216882
Rickwood, D., and Chambers, J. A. A. (1981). Evidence for protected regions of DNA in the mitochondrial nucleoid of Saccharomyces cerevisiae. FEMS Microbiol. Lett. 12, 187–190. doi: 10.1111/j.1574-6968.1981.tb07639.x
Sassoubre, L. M., Yamahara, K. M., Gardner, L. D., Block, B. A., and Boehm, A. B. (2016). Quantification of environmental DNA (eDNA) shedding and decay rates for three marine fish. Environ. Sci. Technol. 50, 10456–10464. doi: 10.1021/acs.est.6b03114
Smart, A. S., Tingley, R., Weeks, A. R., van Rooyen, A. R., and McCarthy, M. A. (2015). Environmental DNA sampling is more sensitive than a traditional survey technique for detecting an aquatic invader. Ecol. Appl. 25, 1944–1952. doi: 10.1890/14-1751.1
Smart, A. S., Weeks, A. R., van Rooyen, A. R., Moore, A., McCarthy, M. A., and Tingley, R. (2016). Assessing the cost-efficiency of environmental DNA sampling. Methods Ecol. Evol. 7, 1291–1298. doi: 10.1111/2041-210X.12598
Strayer, D. L., and Dudgeon, D. (2010). Freshwater biodiversity conservation: recent progress and future challenges. J. N. Amer. Benthol. Soc. 29, 344–358. doi: 10.1899/08-171.1
Taberlet, P., Bonin, A., Zinger, L., and Coissac, E. (2018). Environmental DNA – For Biodiversity Research and Monitoring. Oxford: Oxford University Press, doi: 10.1093/OSO/9780198767220.001.0001
Takahara, T., Minamoto, T., and Doi, H. (2013). Using environmental DNA to estimate the distribution of an invasive fish species in ponds. PLoS One 8:e56584. doi: 10.1371/journal.pone.0056584
Tepper, C. G., and Studzinski, G. P. (1993). Resistance of mitochondrial DNA to degradation characterizes the apoptotic but not the necrotic mode of human leukemia cell death. J. Cell. Biochem. 52, 352–361. doi: 10.1002/jcb.240520311
Thompson W. (Ed.) (2013). Sampling Rare or Elusive Species: Concepts, Designs, and Techniques for Estimating Population Parameters. Washington, D.C: Island Press.
Thomsen, P. F., Kielgast, J., Iversen, L. L., Møller, P. R., Rasmussen, M., and Willerslev, E. (2012a). Detection of a diverse marine fish fauna using environmental DNA from seawater samples. PLoS One 7:e41732. doi: 10.1371/journal.pone.0041732
Thomsen, P. F., Kielgast, J., Iversen, L. L., Wiuf, C., Rasmussen, M., Gilbert, M. T. P., et al. (2012b). Monitoring endangered freshwater biodiversity using environmental DNA. Mol. Ecol. 21, 2565–2573. doi: 10.1111/j.1365-294X.2011.05418.x
Tsuji, S., Ushio, M., Sakurai, S., Minamoto, T., and Yamanaka, H. (2017). Water temperature-dependent degradation of environmental DNA and its relation to bacterial abundance. PLoS One 12:e0176608. doi: 10.1371/journal.pone.0176608
Turner, C. R., Barnes, M. A., Xu, C. C. Y., Jones, S. E., Jerde, C. L., and Lodge, D. M. (2014). Particle size distribution and optimal capture of aqueous macrobial eDNA. Methods Ecol. Evol. 5, 676–684. doi: 10.1111/2041-210X.12206
Turner, C. R., Uy, K. L., and Everhart, R. C. (2015). Fish environmental DNA is more concentrated in aquatic sediments than surface water. Biol. Conserv. 183, 93–102. doi: 10.1016/j.biocon.2014.11.017
Warne, R. T. (2014). A primer on multivariate analysis of variance (MANOVA) for behavioral scientists. Pract. Assess. Res. Eval. 19:10. doi: 10.7275/sm63-7h70
Yamamoto, S., Minami, K., Fukaya, K., Takahashi, K., Sawada, H., Murakami, H., et al. (2016). Environmental DNA as a ‘Snapshot’ of fish distribution: a case study of Japanese Jack Mackerel in Maizuru Bay, sea of Japan. PLoS One 11:e0149786. doi: 10.1371/journal.pone.0149786
Keywords: environmental DNA, decay rate, propidium monoazide, quantitative PCR, zebrafish
Citation: Hirohara T, Tsuri K, Miyagawa K, Paine RTR and Yamanaka H (2021) The Application of PMA (Propidium Monoazide) to Different Target Sequence Lengths of Zebrafish eDNA: A New Approach Aimed Toward Improving Environmental DNA Ecology and Biological Surveillance. Front. Ecol. Evol. 9:632973. doi: 10.3389/fevo.2021.632973
Received: 24 November 2020; Accepted: 16 April 2021;
Published: 04 June 2021.
Edited by:
Richard Lance, U.S. Army Engineer Research and Development Center, United StatesReviewed by:
Chris Wilson, Ontario Ministry of Natural Resources and Forestry, CanadaTomasz Suchan, Władysław Szafer Institute of Botany, Polish Academy of Sciences (PAN), Poland
Copyright © 2021 Hirohara, Tsuri, Miyagawa, Paine and Yamanaka. This is an open-access article distributed under the terms of the Creative Commons Attribution License (CC BY). The use, distribution or reproduction in other forums is permitted, provided the original author(s) and the copyright owner(s) are credited and that the original publication in this journal is cited, in accordance with accepted academic practice. No use, distribution or reproduction is permitted which does not comply with these terms.
*Correspondence: Hiroki Yamanaka, eWFtYW5ha2FAcmlucy5yeXVrb2t1LmFjLmpw