 Robin I. M. Dunbar1*
 Susanne Shultz2
- 1Department of Experimental Psychology, University of Oxford, Oxford, United Kingdom
- 2Department of Earth and Environmental Sciences, University of Manchester, Manchester, United Kingdom
Mammal social groups vary considerably in size from single individuals to very large herds. In some taxa, these groups are extremely stable, with at least some individuals being members of the same group throughout their lives; in other taxa, groups are unstable, with membership changing by the day. We argue that this variability in grouping patterns reflects a tradeoff between group size as a solution to environmental demands and the costs created by stress-induced infertility (creating an infertility trap). These costs are so steep that, all else equal, they will limit group size in mammals to ∼15 individuals. A species will only be able to live in larger groups if it evolves strategies that mitigate these costs. We suggest that mammals have opted for one of two solutions. One option (fission-fusion herding) is low cost but high risk; the other (bonded social groups) is risk-averse, but costly in terms of cognitive requirements.
Introduction
For most social animals, the group provides a buffer between the individual and its environment. In mammals, groups vary in size and structure from family groups centred around monogamous pairs (most canids, miniature antelope, some primates) to small harems of 10–20 individuals (usually but not always with one breeding male: some antelope, lion, some primates), large stable groups (some primates, dolphins, elephants) and very large, unstable herds (many herding antelope and deer) (Clutton-Brock, 2016). Parallel categorisations are recognised for birds and fish, although in this case most species fall into either the pairbonded (the vast majority in the case of birds) or large unstable social groupings (many seabirds and other flocking species) categories, or both (colonial nesters) (Ligon, 1999; mating system Taborsky and Wong, 2017), with just a few birds having small, stable primate-like groups (notably parrots, babblers and mousebirds). We focus in this paper on mammals.
Cutting across these categories is an important distinction between aggregations (unstable herds and flocks whose composition is variable and largely anonymous) and congregations (stable groups in which individuals usually remain for life and have personalised relationships) (Allee, 1927; Morris et al., 1992; Parrish et al., 1997). The distinction hinges on the stability of groupings through time, and hence on the extent to which individuals are motivated to remain with specific individuals. Herds are typically anonymous and their membership is relatively unstable (even though there may be small stable cores such as female-offspring subgroups); bonded groups have stable memberships created by a core of members who have personalised affiliative relationships.
Aggregations tend to convene and disperse on the scale of hours or days, as individual animals or subsets of animals come together or drift apart as environmental circumstances dictate. They typically form either on rich localised food patches (dispersing once the patch has been exhausted: e.g., deer, antelope, geese, many shorebirds) or as a temporary anti-predator strategy in high risk habitats (e.g., stingray: Semeniuk and Dill, 2005). Social relationships are typically casual and avoidant (such that individuals usually maintain a distance from each other), with interactions rarely involving more than dyads. Group size is adjusted on a moment-by-moment basis through individuals joining or leaving (as joiner/leaver models describe: Krause and Ruxton, 2002). In contrast, congregations are stable over time (on the scale of years, subject to the flux of births and deaths); individuals know each other as individuals and usually devote a significant amount of time to affiliative behaviours (social grooming, sitting in physical contact) with some, but never all, of their group members. These species are often distinguished by engaging in social play as juveniles (Fagen, 1981; Lewis, 2000; Iwaniuk et al., 2001). Congregations typically have a stable core (often only one sex disperses) with groups changing size mainly through group fusion (rare) or group fission (Dunbar, 1988; Dunbar et al., 2009). Unlike aggregations, these kinds of groups are based on individual bonds between individuals that are built up through social grooming or other forms of affiliative behaviour (Dunbar and Shultz, 2010; Massen et al., 2010).
Living in bonded groups increases the costs of group-living because individuals are not free to pursue their own activities when they want to, but instead must coordinate their activities with the rest of the group. The ‘flexible herd’ strategy minimises these costs: animals that have converged to form a herd simply drift apart, mainly because of differences in activity scheduling (Ruckstuhl and Kokko, 2002; Ruckstuhl and Neuhaus, 2002; Calhim et al., 2006; Dunbar and Shi, 2008; King and Cowlishaw, 2009). However, they do so at the risk of individuals being caught alone or in groups of sub-optimal size should a predator appear. Living in stable groups avoids this problem and can be viewed as a risk averse strategy that allows animals to be sure that they will always have conspecifics with them. However, it does so at the cost of incurring stresses that are not easily mitigated: these costs will naturally limit group size unless solutions can be found (Dunbar and Shultz, 2021). The intensity of bonding can vary, but in the limit the inertia created by social bonds means that these groups can only adjust their size through group fission (as opposed to individuals drifting away on their own), a process that can take many months, sometimes even years. The need to ensure that both the daughter groups are large enough to cope with the local predation risk means that groups can only undergo fission when their size is double this minimum: this results in a trajectory of group size over time that has the form of a non-linear oscillator between limits set by the environment, with the group under stress at either end of the cycle (Dunbar et al., 2009, 2018a; Dunbar and MacCarron, 2019).
This dichotomy has profound implications for the size of groups that mammals can achieve, as Figure 1 illustrates. Groupings on the scale of seabird breeding colonies or pelagic fish shoals simply do not occur, other than during brief periods of migration in some ungulates (wildebeest, saiga antelope) and some rodents (lemmings). With a handful of exceptions (e.g., spotted hyaena), most carnivores, the smaller ungulates and the prosimians forage solitarily (all felids except the lion, all galagines), are pairbonded (some canids, many small-bodied ungulates, medium-sized prosimians) or live in groups of 5–15 individuals (large-bodied canids, the social lemurs) (Shultz and Dunbar, 2007). Many of the larger-bodied ungulates, in contrast, live in large, unstable herds characterised by fission-fusion sociality that allows the animals to maintain flexible group sizes (Jarman, 1974; Shultz and Dunbar, 2007). Although very large herds can form (e.g., during mass migrations), typical herd size is actually in the region of 20–30 individuals (Figure 1). Anthropoid primates contrast with all three of these Orders: groups of 10–15 are their default social units (many New World monkeys and Old World colobines), but groups can be as large as 25–30 if they have strongly bonded relationships (cercopithecines), and >50 if they operate some form of fission-fusion sociality in addition (gelada and hamadryas baboons: Dunbar and MacCarron, 2019; chimpanzees: Lehmann et al., 2007a). This also seems to apply to a small number of other (mainly species-poor) mammalian orders (elephants, delphinids, equids, camelids), all of which share with anthropoid primates the capacity for females to form bonded coalitions (Shultz and Dunbar, 2010).
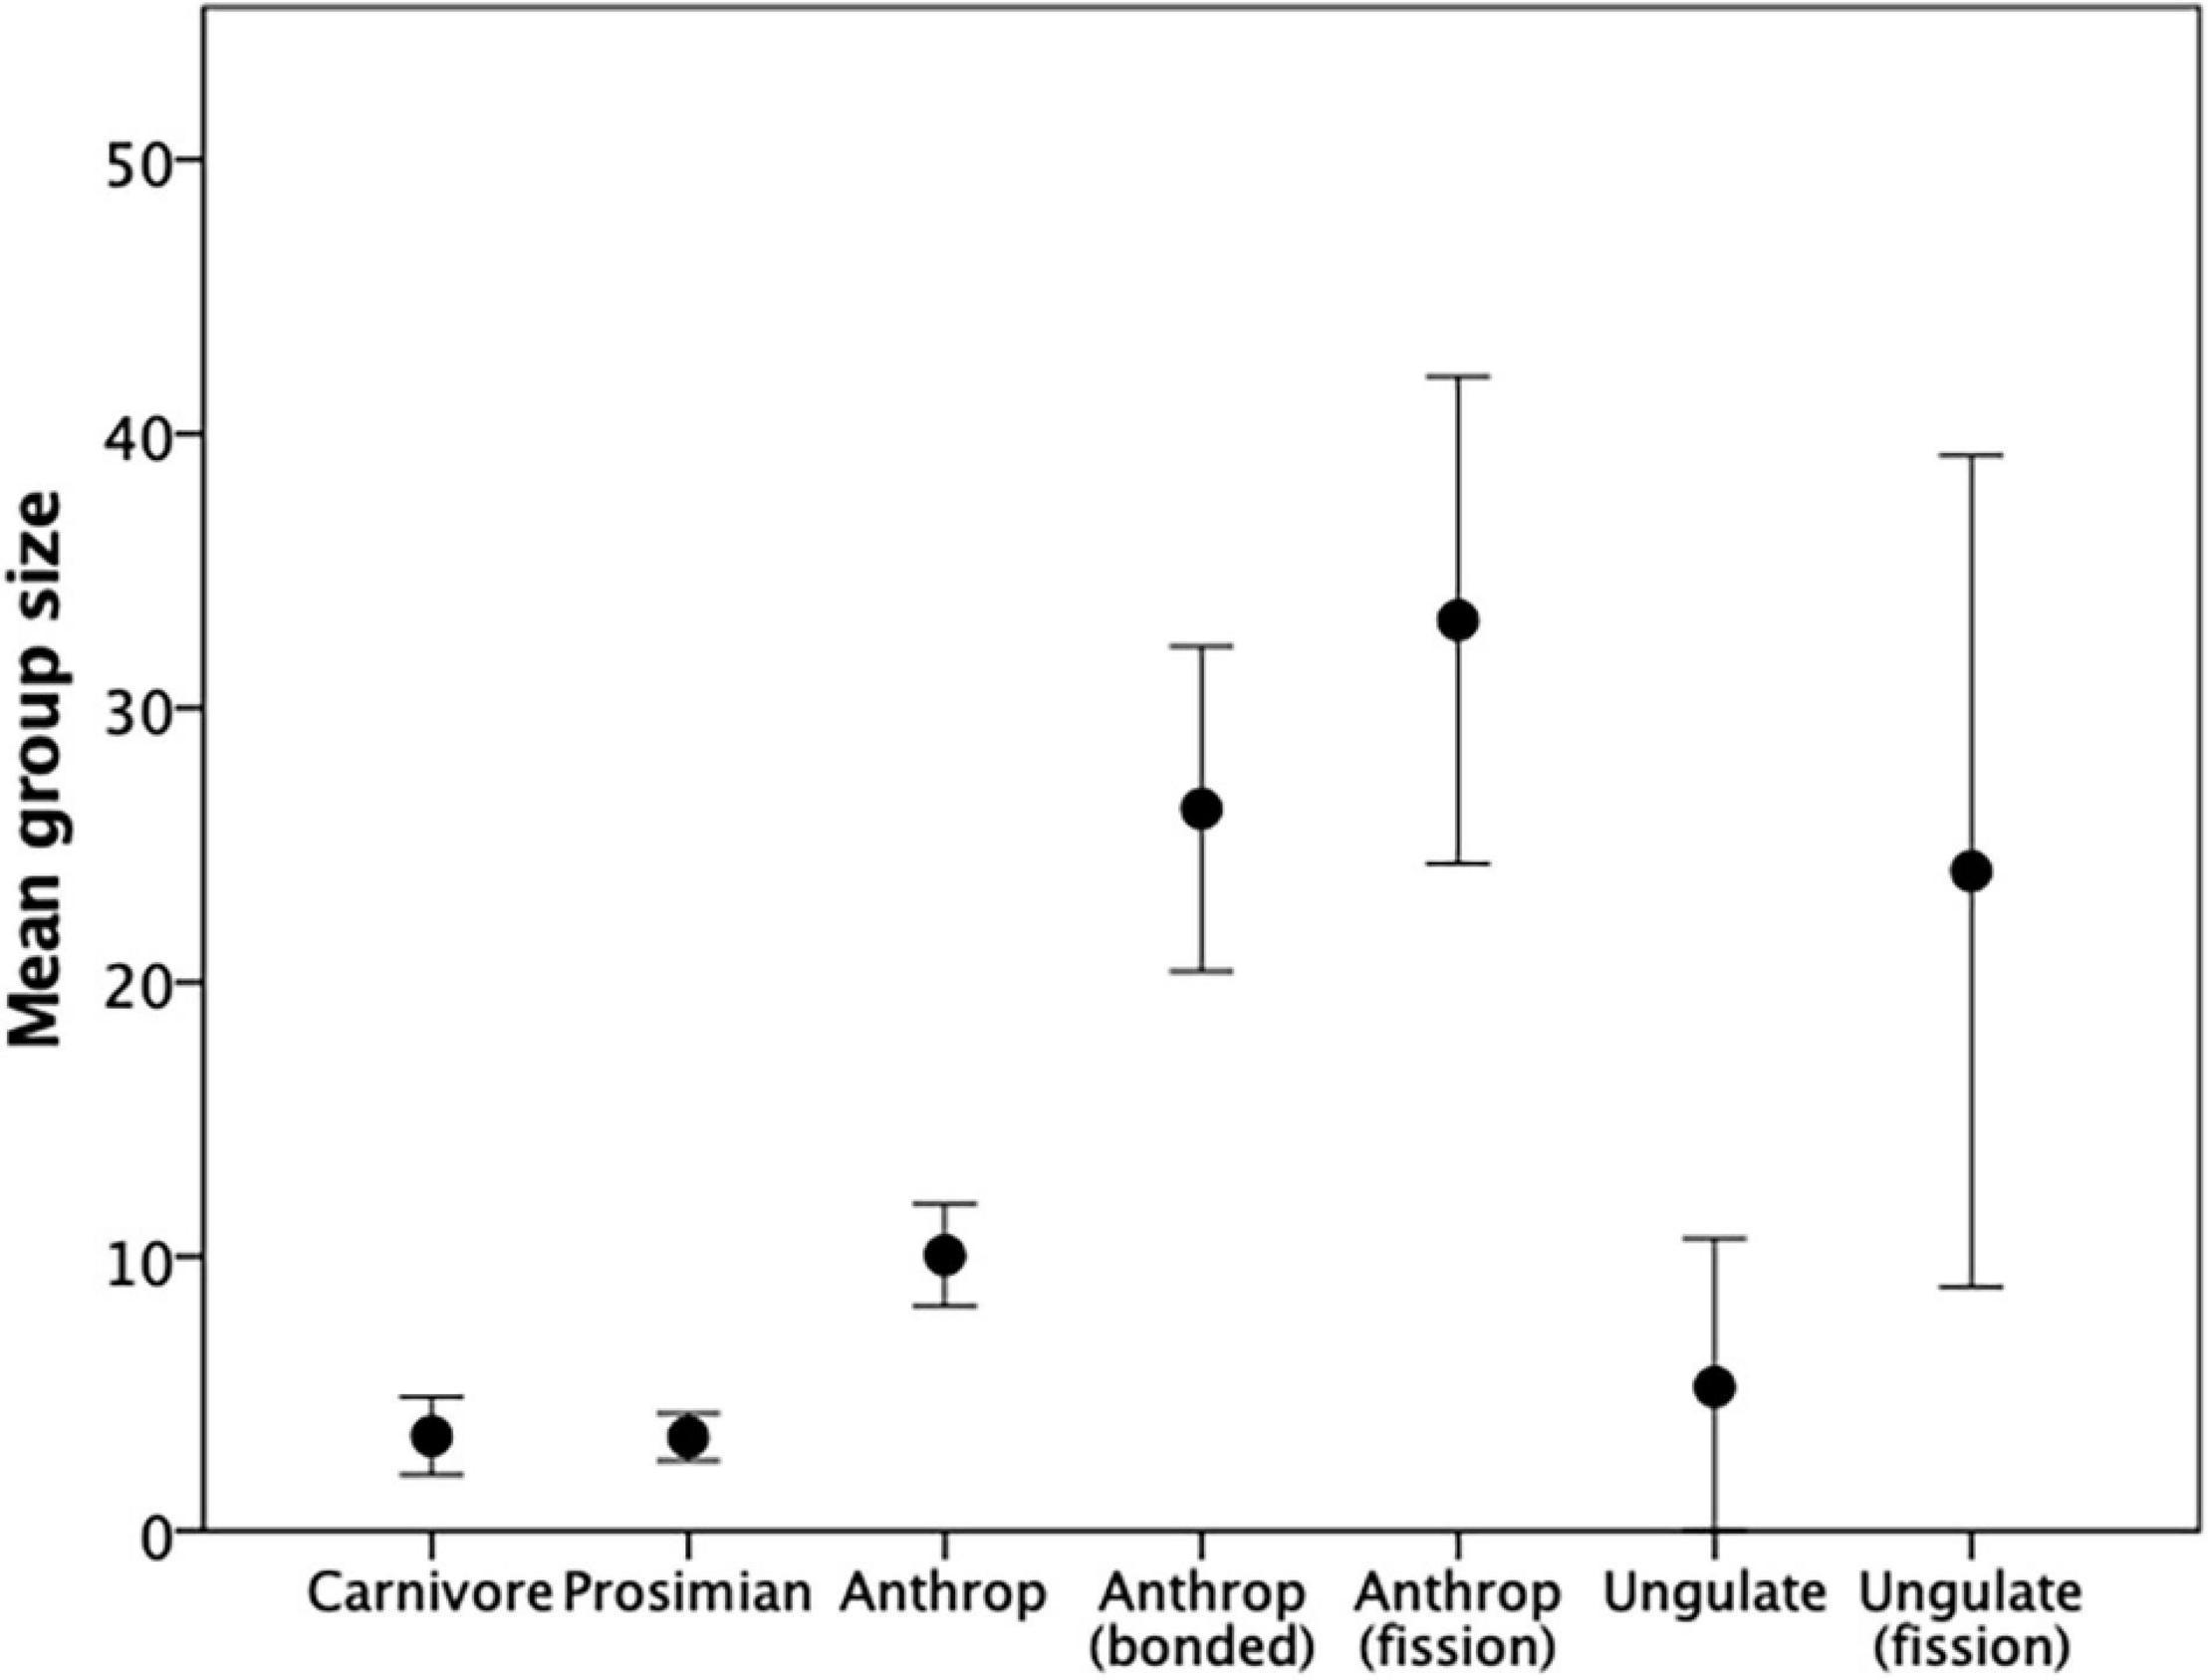
Figure 1. Mean (± 95% CI) group size for different mammal taxa. Sources Pérez-Barbería et al. (2007); Shultz and Dunbar (2007). Source: Supplementary Dataset 1.
Most small-bodied mammals, in contrast, are nocturnal and solitary, coming together only for mating (or, in a few cases, while infants are being reared: e.g., prairie voles), although some form stable breeding pairs while foraging separately (e.g., elephant shrews) (Müller and Thalmann, 2000). Many of the smaller ungulates are also de facto solitary in that, even if they occupy a joint territory as a monogamous pair, they forage and rest alone (e.g., duiker, dikdik, suni, oribi). With the latter exceptions, most of these smaller mammal species are solitary: interactions outside the breeding season are largely antagonistic, such affiliative signalling as there is associated only with mating, and most social signals likely to be olfactory (distance signals such as scent marking) rather than behavioural (close signals). This form of sociality appears to be ancestral to mammals (Müller and Thalmann, 2000).
Ultimately, the limit on group size is set by the point at which the costs of group-living exceed the benefits, or more strictly the point at which the tradeoff between the costs and benefits results in fertility dropping below replacement rate. The costs of group-living are conventionally viewed as being a consequence of density-dependent, within-group competition for resources (Clutton-Brock et al., 1983; Chapman, 1990; Molvar and Bowyer, 1994; Andersen and Linnell, 1998; Pettorelli et al., 2002; Nilsen et al., 2004; Shi and Dunbar, 2005; Thompson et al., 2007; Borowik and Jwdrzejewska, 2018). The effects of these costs are usually reflected in increased foraging competition, higher rates of aggression, longer day journeys, and elevated time budget allocations to foraging (Dunbar et al., 2009; Markham et al., 2015), all of which typically increase monotonically with the number of individuals in the group (Dunbar et al., 2009). These factors, in particular competition for access to food, are conventionally assumed to be responsible for reduced fertility when this is observed.
This assumption, however, is open to question. Although both excessive exercise (primates: Williams et al., 2001; humans: Bullen et al., 1985; Frisch, 1987; Ellison, 1990; Warren and Perlroth, 2001) and lack of food (Clutton-Brock et al., 1983; ungulates: Albon et al., 1983; mongoose: Creel et al., 2013; primates: Williams et al., 2007; Gesquiere et al., 2018; humans: Dean, 1949; Stein and Susser, 1975; Arends et al., 2012) can adversely affect fertility, this usually happens only in cases involving significant weight loss (typically >15% of body mass, or close to starvation). In a within- and between-population study of red deer living in thermally stressful environments at high latitudes, Albon et al. (1983) found that conception rates were significantly reduced only for females in the lower tercile of normal adult body weight (i.e., those already on the margin for survival).
A more serious problem with this assumption is that models of the time constraints operating on group-living anthropoid primates (representing all the ape and African Old World monkey genera, and one New World monkey genus) and one group-living ungulate (feral goats) suggest that these species only reach the limits of their respective carrying capacities on the fringes of their biogeographic distributions (Dunbar et al., 2009, 2019; Dunbar and Shi, 2013; Korstjens et al., 2018). In every case, observed group sizes are considerably smaller than those that their local habitat would allow. This suggests that while ecological constraints undoubtedly do set limits on the grouping patterns of these taxa, this only becomes an issue toward the periphery of the taxon’s biogeographic distribution. For most of their populations, something else is limiting group size at well below the local carrying capacity.
An alternative, and largely overlooked, possibility is the effect that the stresses of group-living have on female fertility independent of environmental quality or nutrient throughput. Birth rates have been reported to decline with either group size or the number of females in a group across a wide range of mammalian taxa (mammals in general: Rubenstein et al., 2016; equids: Rubenstein, 1986; Medill, 2018; babirusa: Clayton and Macdonald, 1999; most canids: Moehlman and Hofer, 1997; hyaena: Holekamp et al., 1996; badgers: Woodroffe and Macdonald, 1995; marmots: Allainé, 2000; mongoose: Creel et al., 1992; meerkats: Young et al., 2006; rodents: Huck et al., 1988; Lacey, 2004; Schradin and Pillay, 2005; Kinahan and Pillay, 2008; Wey et al., 2013). In primates, fertility has been reported to decline with either female rank (baboons: Dunbar, 1980; Smuts and Nicholson, 1989; Altmann and Alberts, 2003; Garcia et al., 2006; chimpanzees: Pusey and Schroepfer-Walker, 2013) or group size (great apes: Dunbar, 2019; baboons: Dunbar and Sharman, 1983; Huchard and Cowlishaw, 2011; colobines: Srivastava and Dunbar, 1996; Borries et al., 2008; Dunbar, 2018a; lemurs: Schülke, 2003). In humans, female fertility is lower in polygamous households than in either monogamous households (Muhsam, 1956; Smith and Kunz, 1976; Bean and Mineau, 1986; Ji et al., 2013) or polygamous families where wives occupy separate dwellings (Chojnacka, 1980; Borgerhoff Mulder, 1989). Lutz et al. (2006) showed that human fertility declines as population density increases both across countries and, within countries, over time.
In a few cases, however, ∩-shaped relationships between fertility and group size have been reported (lemurs: Takahata et al., 2006; baboons: Dunbar et al., 2018a; Dunbar and MacCarron, 2019; apes: Dunbar, 2019). In ecology, quadratic relationships of this kind usually signal a tradeoff between two or more variables that influence the dependent variable in opposite ways. Most authors test only for a linear regression when analysing data on birth rates against demographic variables, and these invariably yield little evidence for any relationship (e.g., Stokes et al., 2003). Inspection of the data in these cases, however, often suggests that the data have an obvious quadratic form (a reminder, perhaps, of the importance of looking at plots of data rather than simply relying on statistical packages).
So far, we have made two general points: first, mammals vary in both the size and dynamics of their groups; second, birth rates are a negative (or in some cases quadratic) function of group size or reproductive female cohort size. Given this, the questions that motivate this article are: (1) how widespread is the ∩-shaped pattern compared to a simple linear decline, (2) what causes the decline (on the right-hand side in the quadratic case), and (3) does the difference between the linear and quadratic forms explain the differences in group size and structure that we find in mammals? We deal with each of these questions in turn in the following three sections.
Demographic Determinants of Fertility
The data, along with their sources, are given in Online Data Sheets 1–5. The statistical methods and analytical strategy are described in the Supplementary Material. Our analyses focus on the genus, with individual group or population means as the unit of analysis. For primates, we follow previous studies in treating a genus as an ecological species because populations belonging to the same genus invariably fall on the same curve and are more strongly influenced by environmental conditions than phylogeny (Dunbar et al., 2009; Strier et al., 2014). Following longstanding convention in the primate literature, however, we treat Papio hamadryas separately from other Papio baboons because it has a very different social system and fertility regime (more akin to that of Theropithecus: see Dunbar and MacCarron, 2019; Dunbar and Shultz, 2021).
Most comparative analyses use phylogenetic methods in order to control for the inflation in the degrees of freedom that occurs when closely related species inherit a trait from a common ancestor. We do not use phylogenetic methods in our analyses for three reasons. First, all our analyses are at the level of the genus: in primates, within-genus variation in the variables of interest is much greater than the between-genus variation (Supplementary Figure 1). More importantly, there is no phylogenetic signal for any of the variables we consider (Supplementary Table 1), making the need for phylogenetic controls less necessary. Second, phylogenetic methods are important when testing causal hypotheses (to show that one variable has driven another during the course of evolution). We do not here directly test any causal hypotheses when testing between genera; all tests of causal hypotheses are within-genus. Rather, when we compare genera, we search for patterns in the distributions of variables: for this we use cluster analysis that simply looks for natural breaks in a distribution, and hence does not suffer from the problem of inflated degrees of freedom. Third, even if this was a problem, there are in fact no phylogenetic methods for analysing univariate distributions of this kind. For further details, see Supplementary Material. The data for non-primate mammals are few in number and come from different orders, so that taxonomic relationships are not an issue.
To avoid confusion, we use the term fertility to refer to reproductive output in general (precise index unspecified). We use birth rate to refer to the number of births (or litters) per female per year, and reproductive output to refer to the average number of immatures alive at any given time per female (see Supplementary Material).
Within-Taxon Variation in Fertility
We located data on birth rates as a function of demographic structure in eight non-primate and 12 primate mammalian genera that live in definable, stable groups (for details, see Supplementary Material). Despite an extensive literature search, few data are available for non-primate taxa, mainly because most species are solitary or, if social, live either in monogamous pairs or in large, unstable herds (Shultz and Dunbar, 2007, 2010). We distinguish three demographic variables: total group size (individuals of all ages and sexes living together), number of adult (i.e., post-puberty) females and number of adult (i.e., fully mature) males. In primates, there is in addition usually a class of subadult males that do not compete for breeding opportunities but do contribute to total group size (and hence the ecological pressure the group places on the its home range). Since some of the non-primate species produce litters of more than one infant, we use litters per female per year for those species that have multiple births in order to be able to compare more directly across genera.
Data on birth rates are for individual groups of known composition (where possible belonging to the same population for each genus, thus holding ecological conditions constant). In some primate taxa (e.g., Papio, Pan), only one group is ever studied in any given population, and in these cases we use data from separate populations: for at least some of these genera, demography is known to influence fertility independently of environmental effects (Dunbar and Sharman, 1983; Hill et al., 2000; Dunbar, 2018a, 2019; Dunbar et al., 2018a).
Except for taxa where males do not associate with females outside the breeding season, we analysed fertility rates separately against group size, number of adult males and number of adult females. Since the patterns are essentially the same (see Supplementary Material), we show only the analyses for female cohort size here since, for many non-primate genera, female number and group size are synonymous. However, in most cases where data are available, the statistical fit is better for females only than for the other two variables. To avoid creating graphs that are so cluttered as to be uninterpretable, we present these results graphically in three separate figures: non-primates with clear linear relationships (Figure 2), non-primates with clear quadratic relationships (Figure 3) and primates (all but one of which exhibit quadratic relationships) (Figure 4). Analyses of birth rate as a function of group size and number of males are given in Supplementary Table 2.
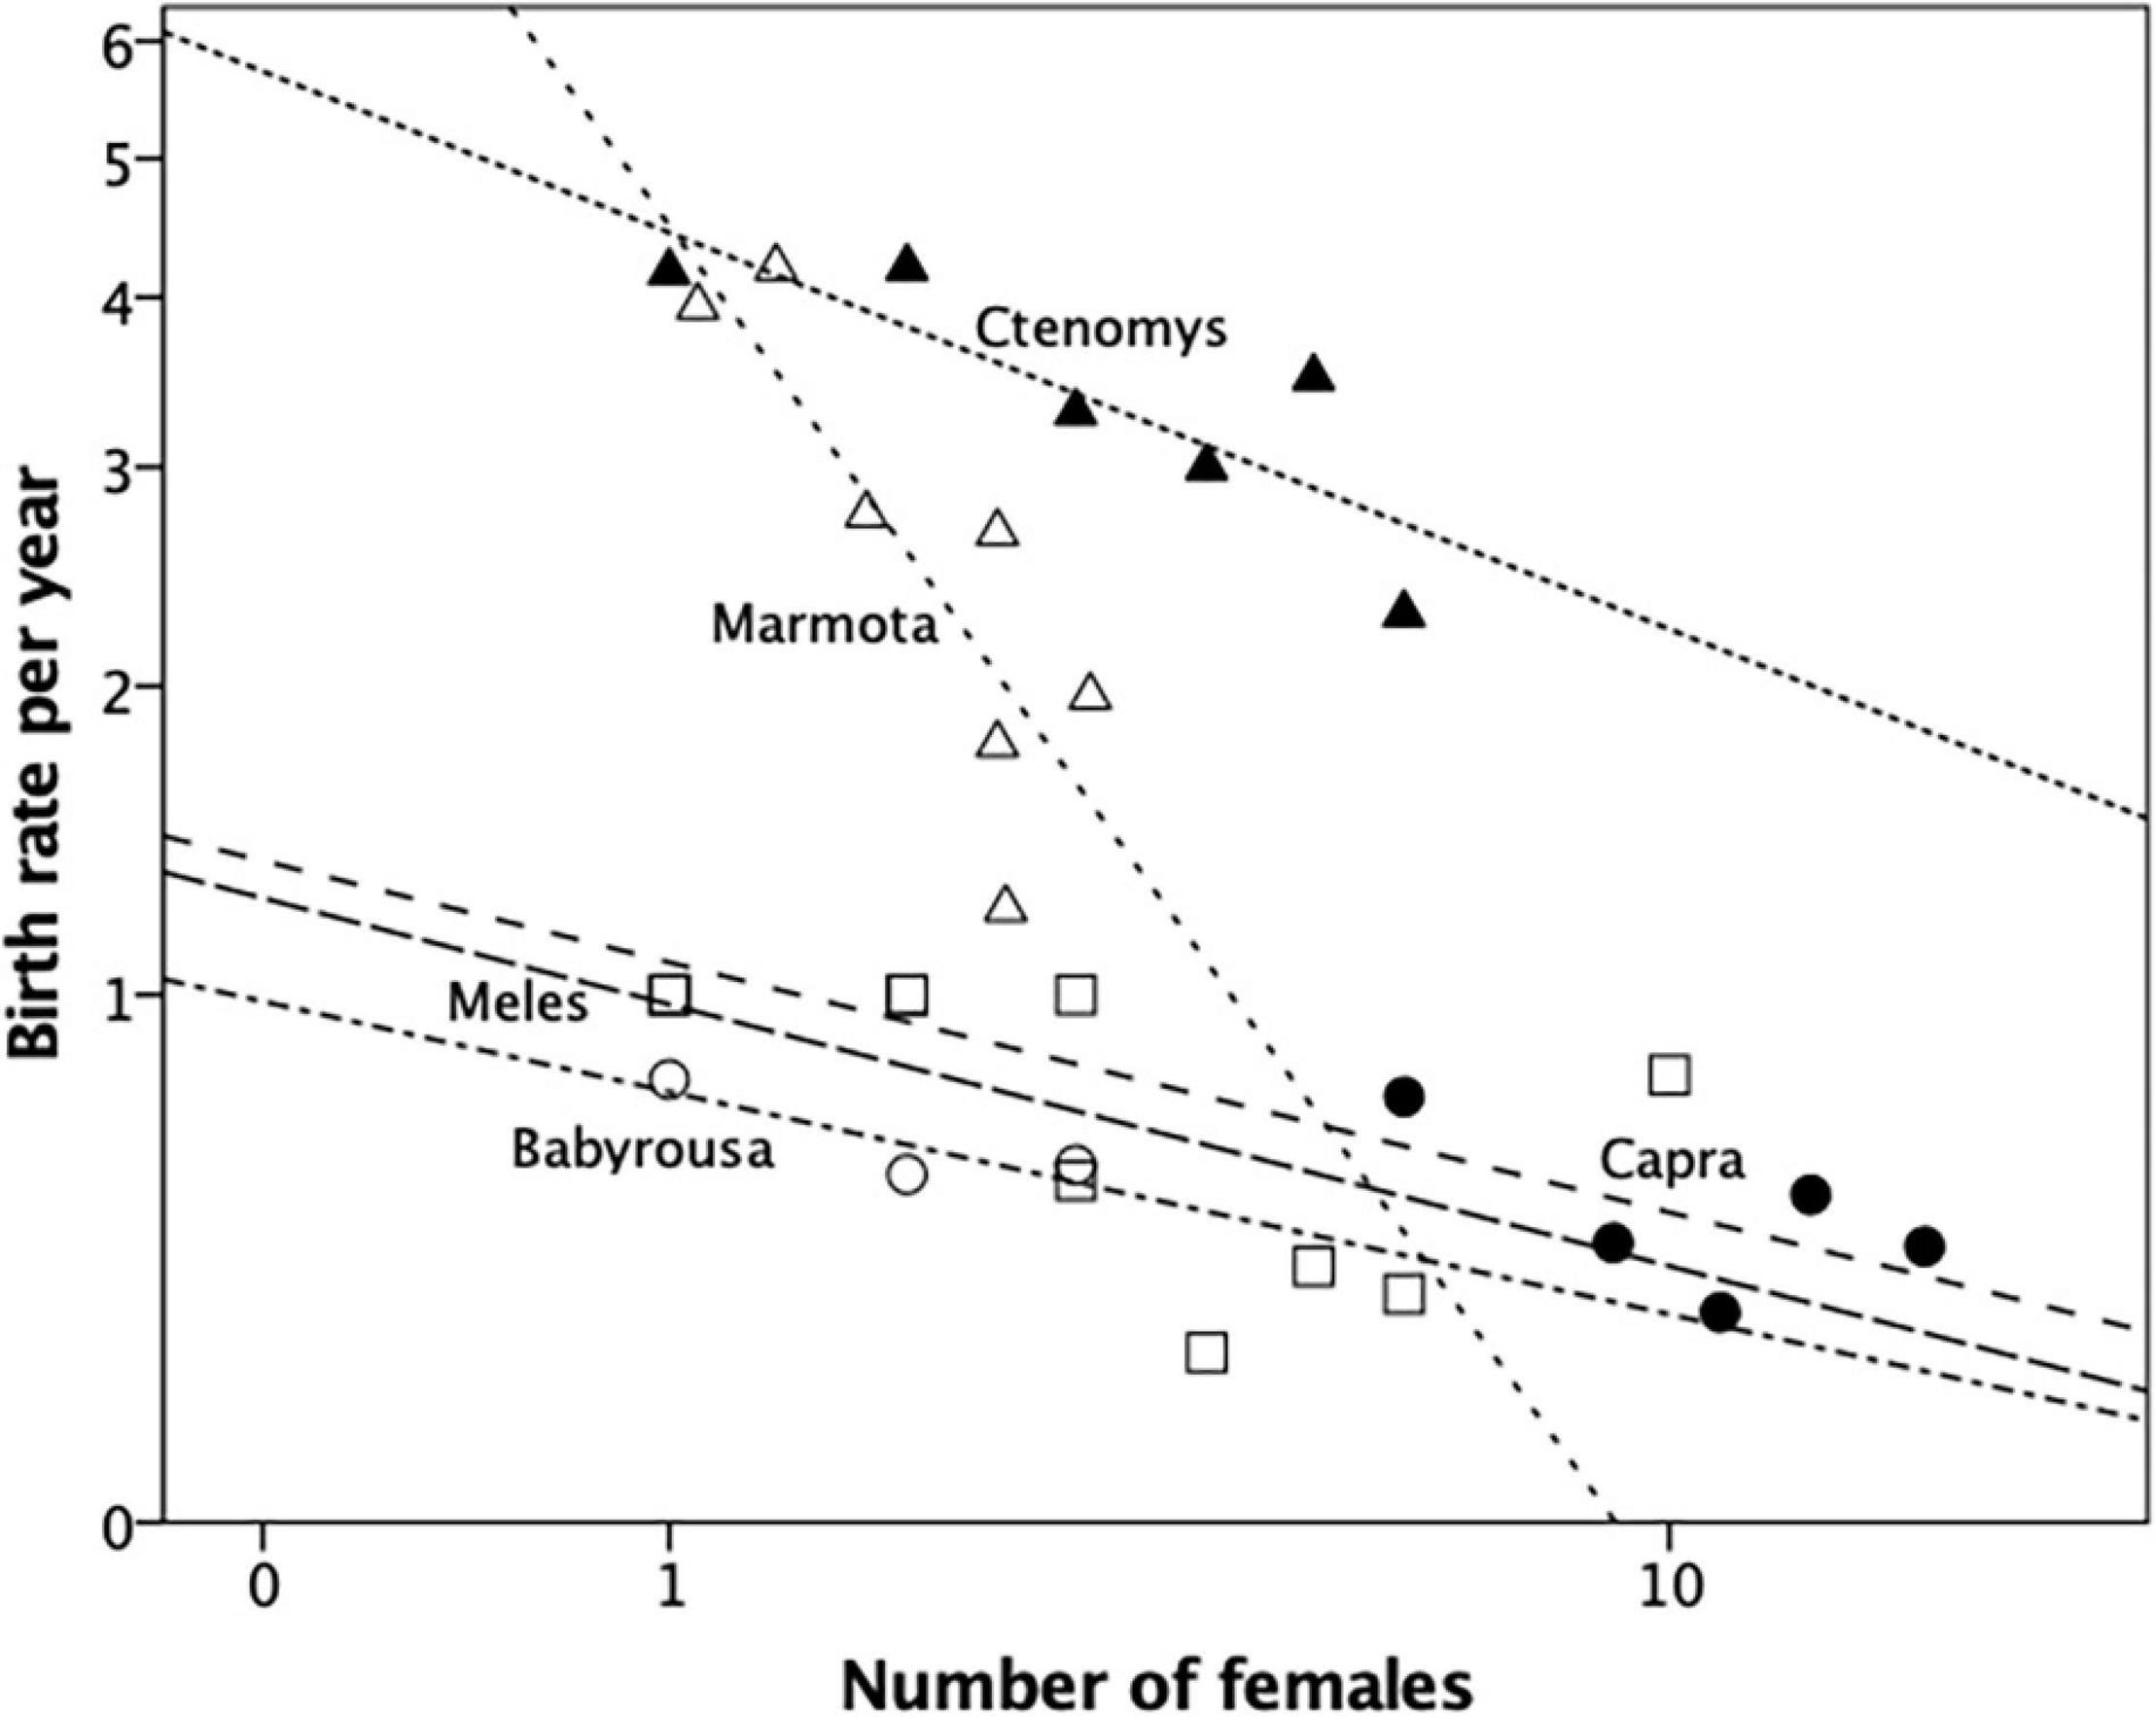
Figure 2. Mean fecundity (litters per female per year) for groups of different size for a carnivore (European badger, Meles meles: squares), two rodents (tuco-tuco, Ctenomys sociabilis: filled triangles; yellow-bellied marmots, Marmota flaviventra: unfilled triangles) and two ungulates (babirusa, Babyrousa babyrussa: unfilled circles; feral goats, Capra hircus: filled circles). All datapoints are individual groups sampled from the same population. Sources: Downhower and Armitage (1971), Woodroffe and Macdonald (1995), Clayton and Macdonald (1999); goat data from RIMD. Source: Supplementary Dataset 2.
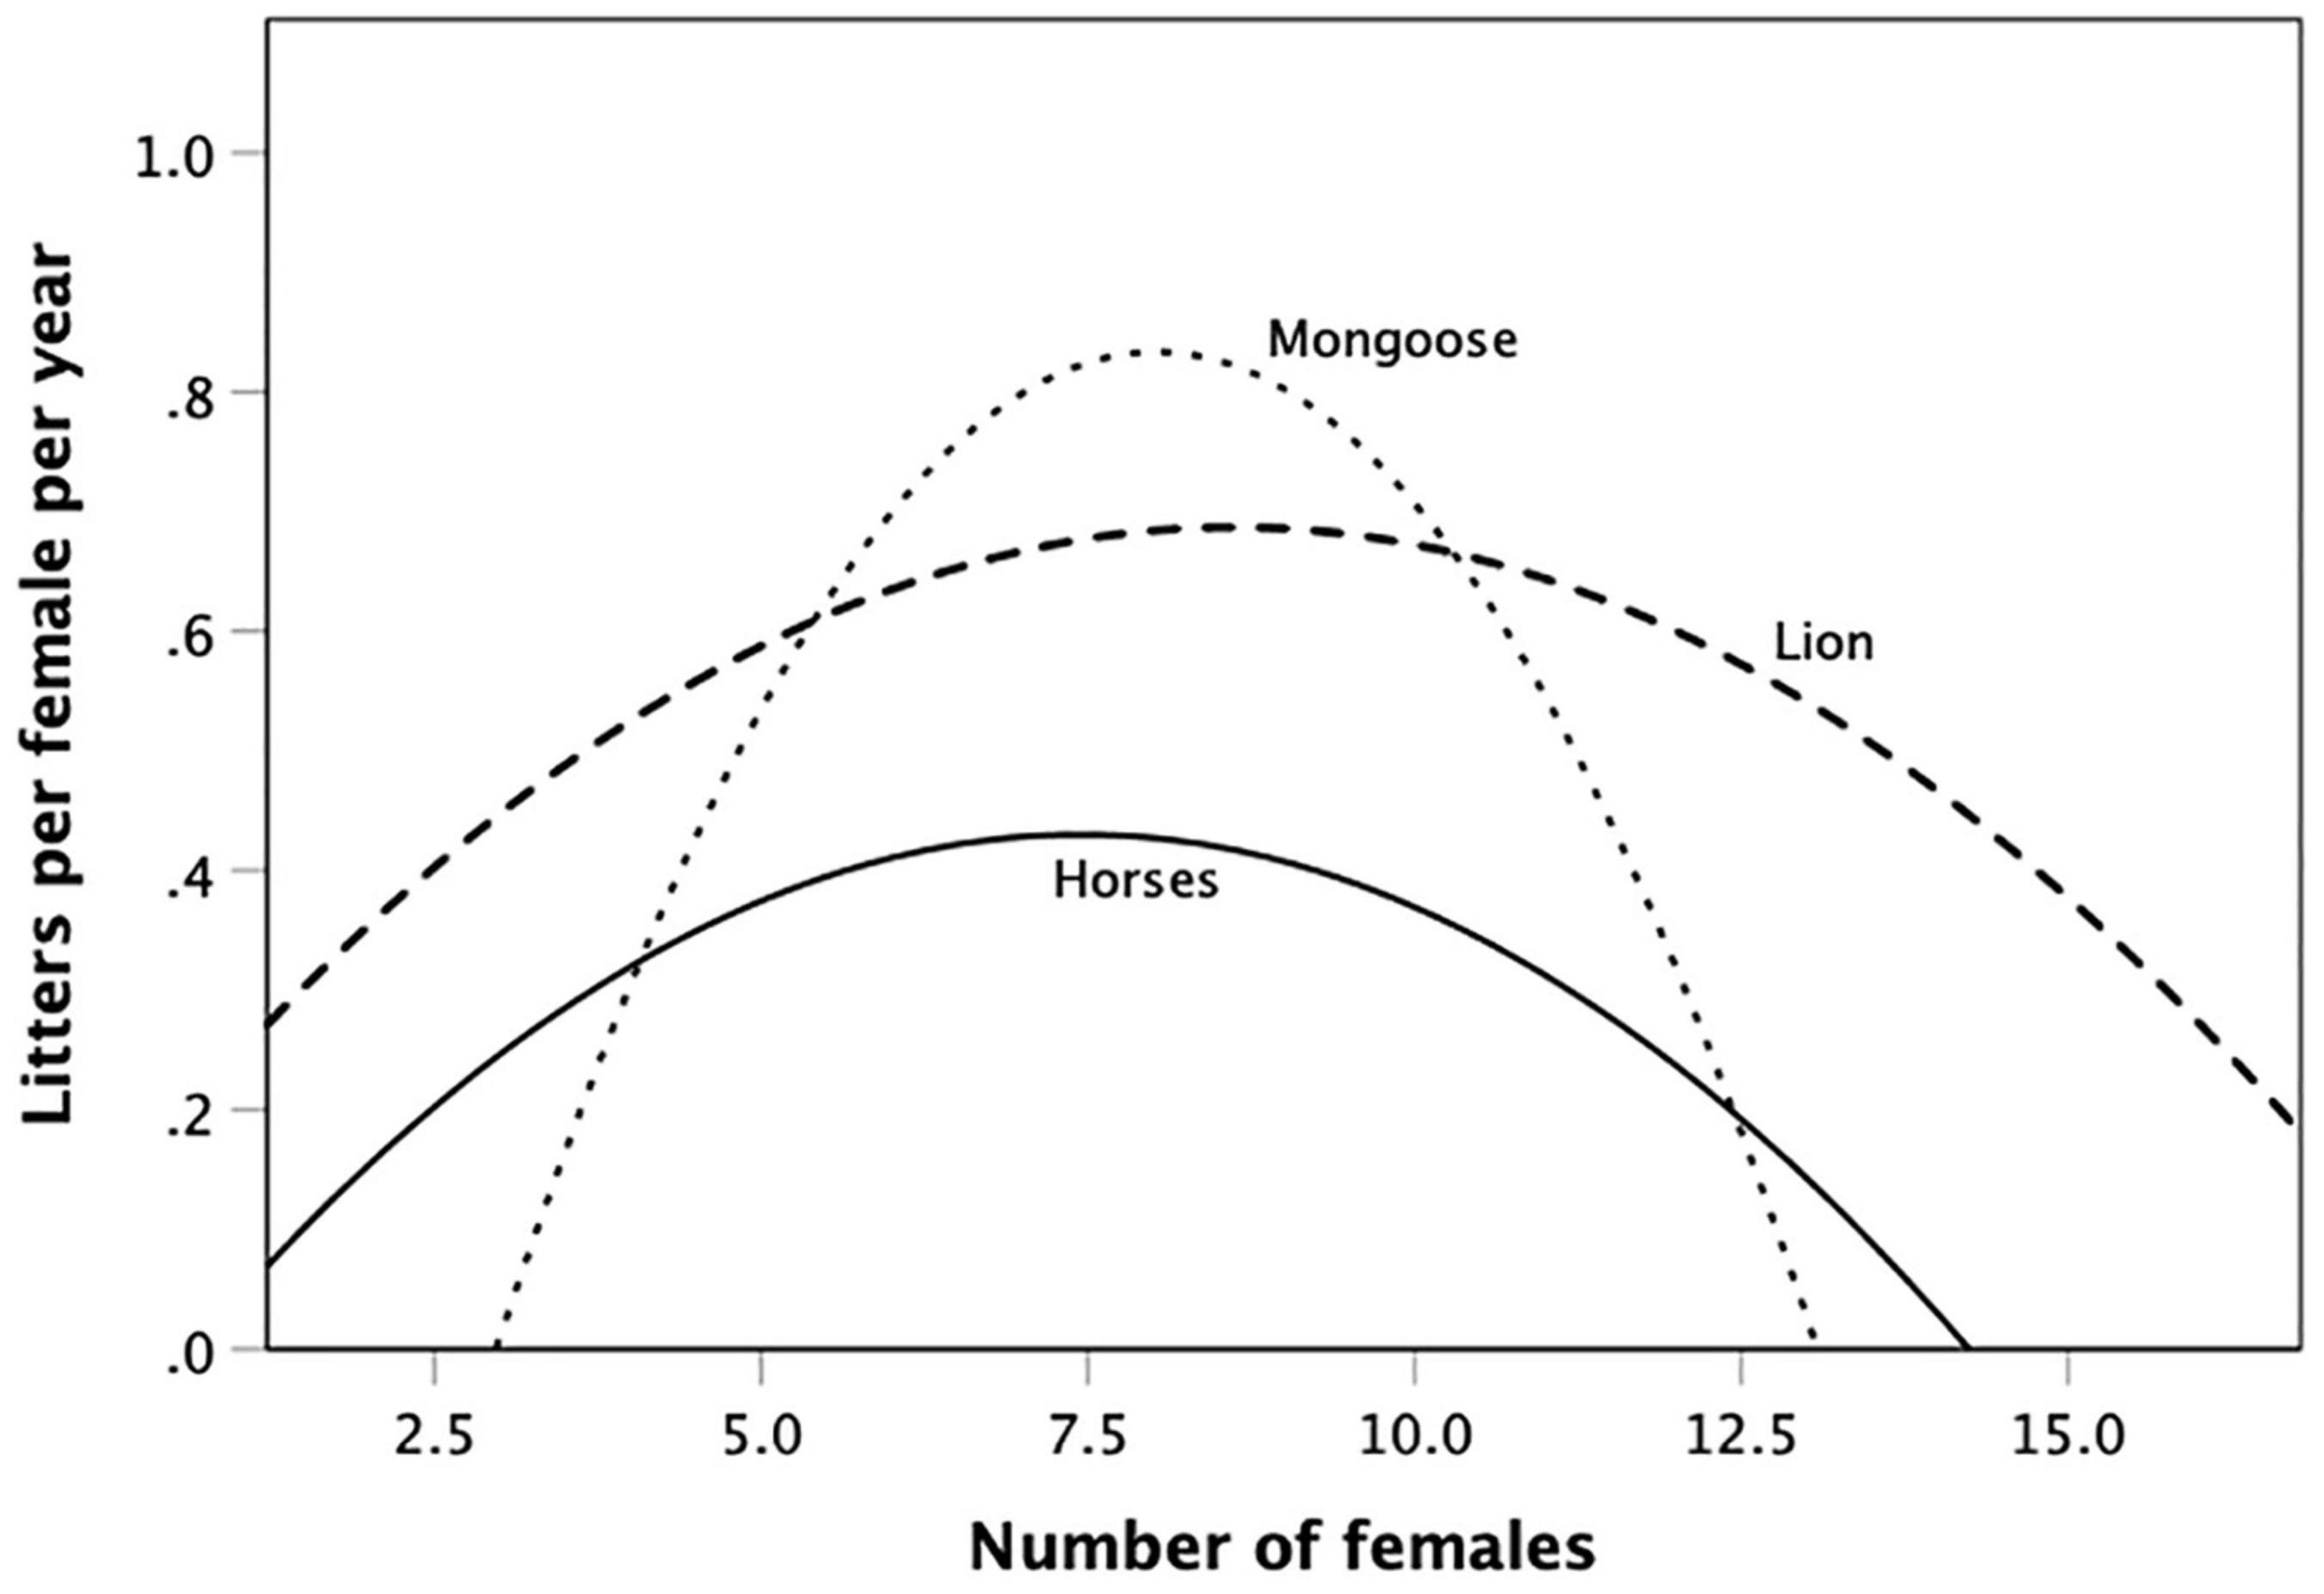
Figure 3. Mean fertility (litters per female per year) for groups of different size for banded mongoose (Mungos mungo), averaged across three separate years from the same population (De Luca and Ginsberg, 2001); lion (Panthera leo), Serengeti: the plotted curve is the equation given by Mosser and Packer (2009) with territory quality held constant; feral horses (Equus caballus), Shackleford Banks, N. Carolina, United States (Rubenstein, 1986). For individual data distributions, see Supplementary Figure 2. Source: Supplementary Dataset 2.
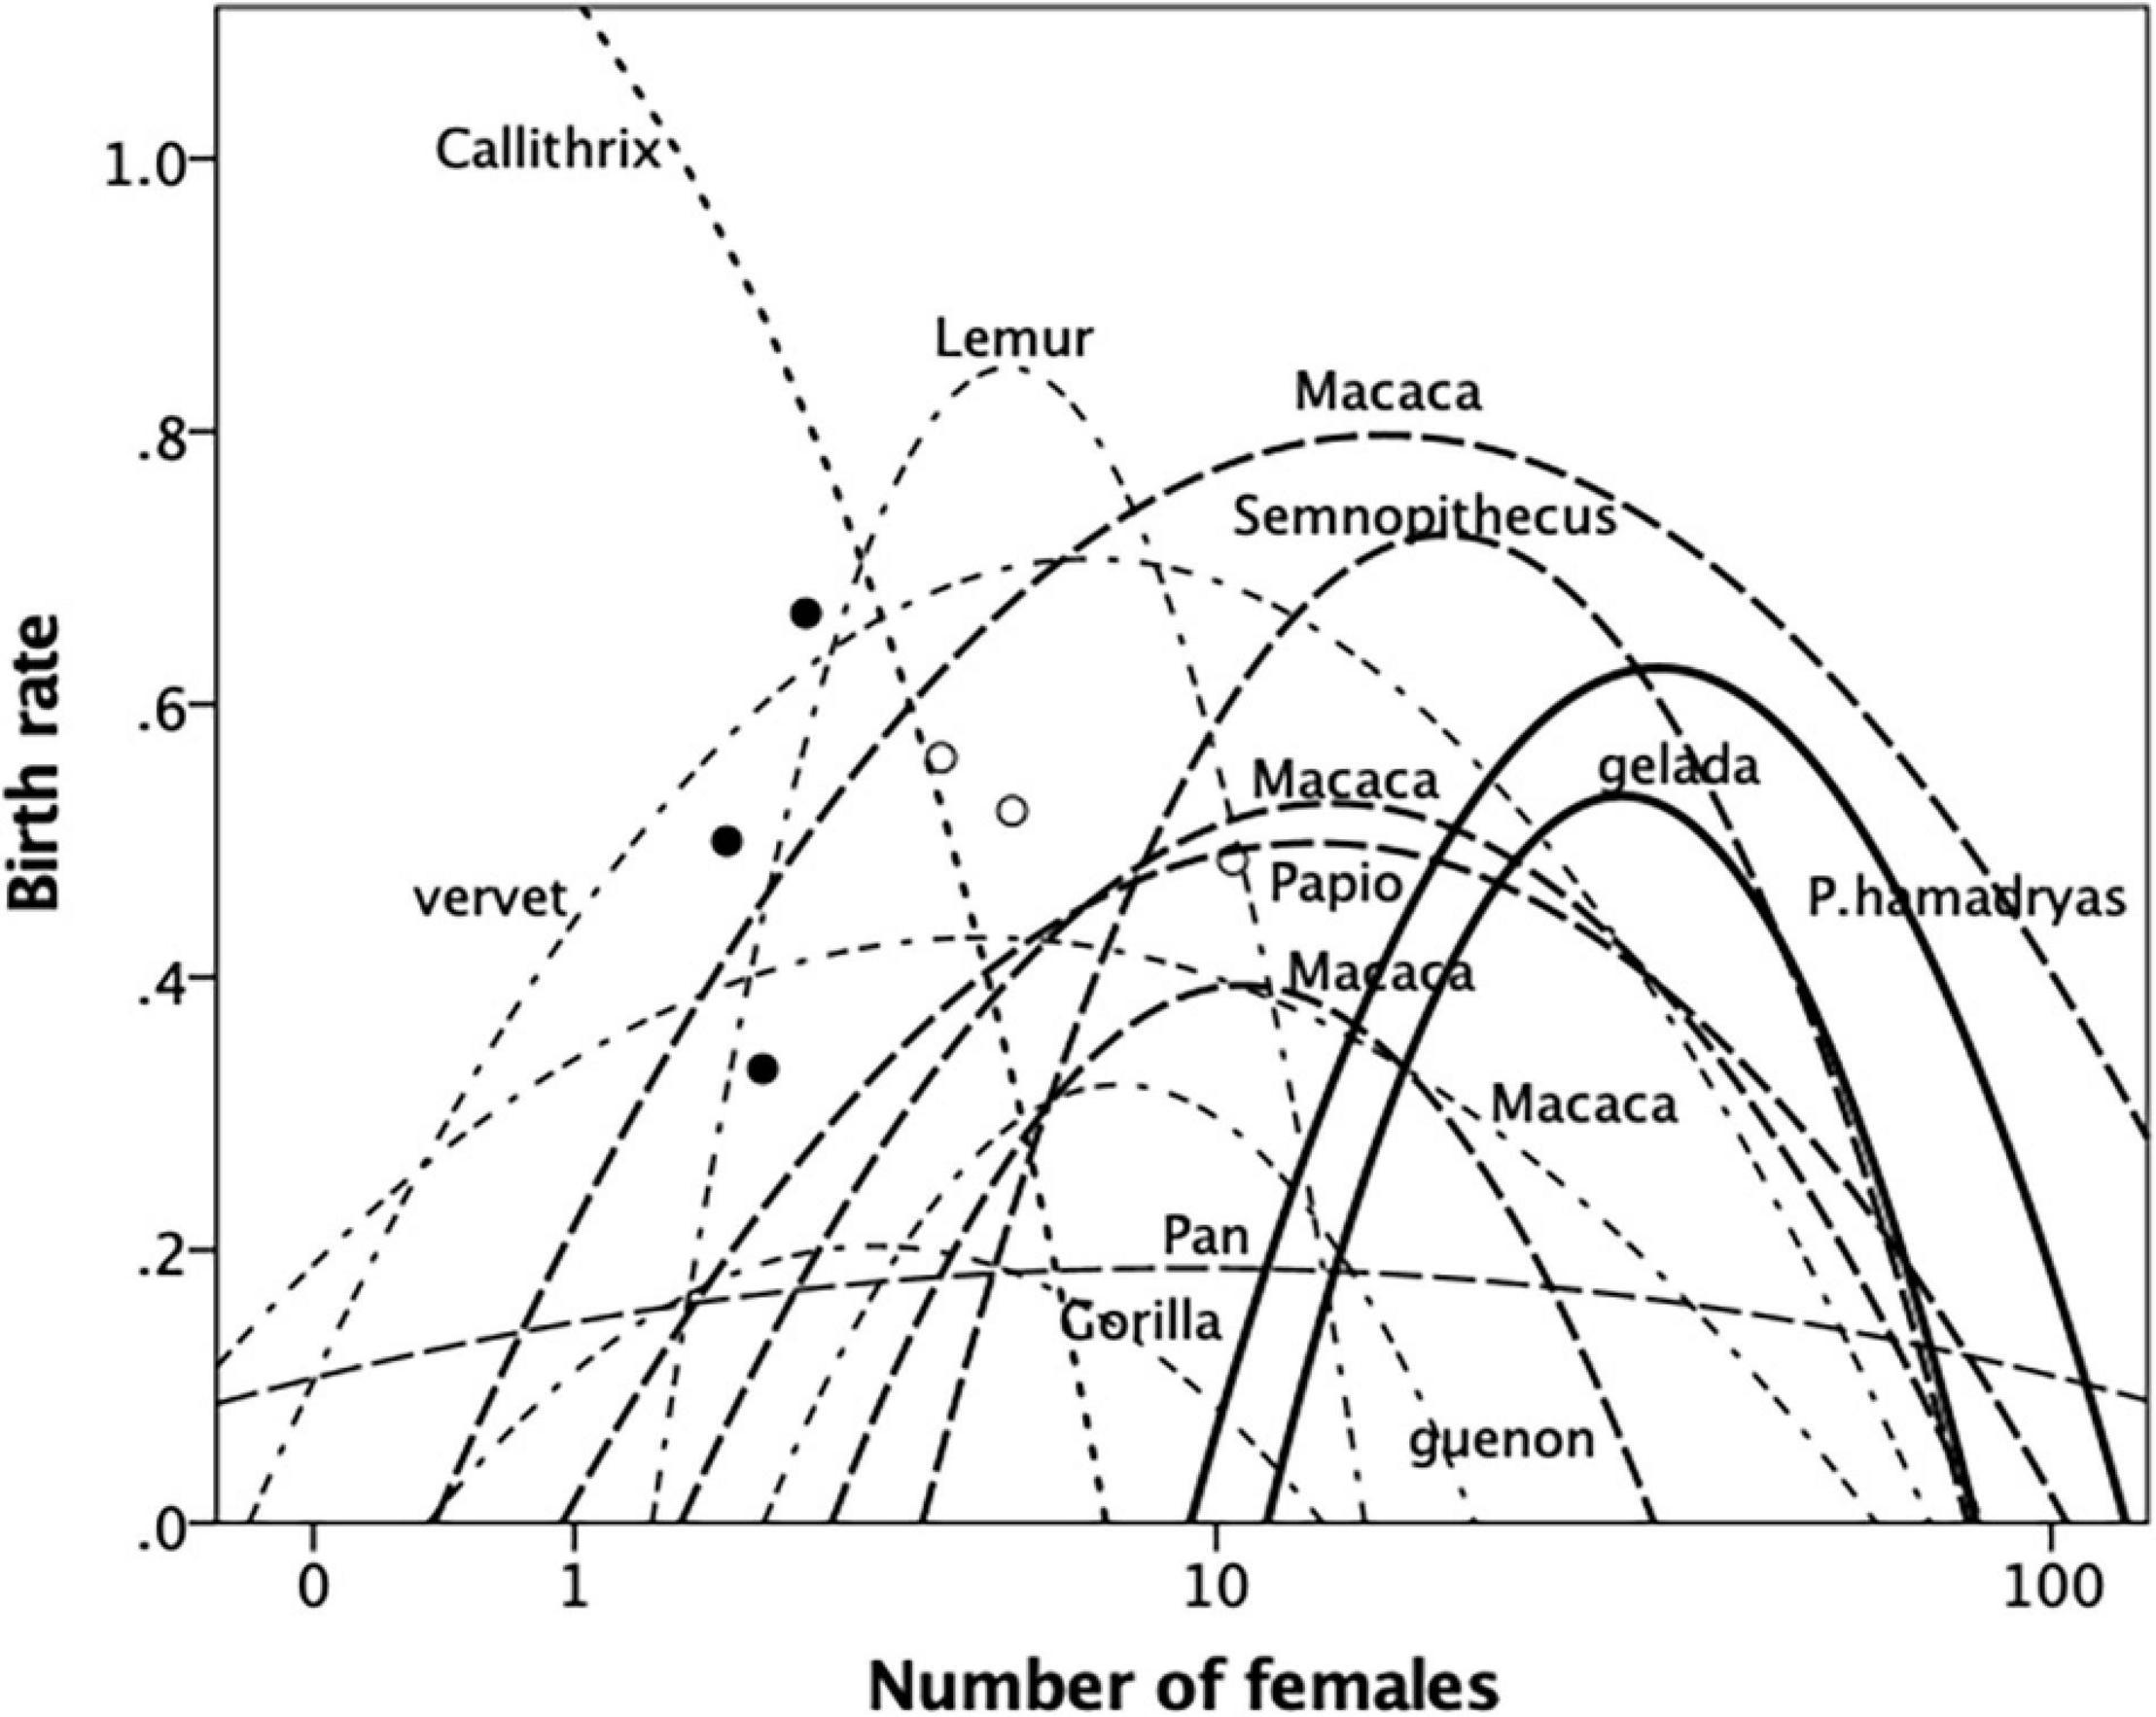
Figure 4. Best-fit quadratic regressions for birth rate (births per female per year) regressed on female group size for different genera of primates. Guenon = Cercopithecus; vervet = Chlorocebus; gelada = Theropithecus. Filled symbols: Eulemur; unfilled symbols: Trachypithecus. Lines in different format indicate clustering of regressions (for further details, see text and Supplementary Material). Source: Supplementary Dataset 3.
The five mammal species in Figure 2 all exhibit a simple linear decline in birth rate as the number of females in the group increases. This set of regressions is significantly more negative than would be expected by chance if there was no underlying trend (Fisher’s meta-analysis with 1-tailed p-values in a negative direction: χ2 = 30.23, df = 2∗5 = 10, p = 0.0008), with a mean correlation of r = −0.698 and a mean slope of b = −0.109. None of these distributions are better explained by a quadratic regression (as indexed by goodness-of-fit). With the possible exception of Capra, this steepness of the decline in fertility would limit group size to between 2.5 and 7.0 reproductive females, since anything above that would result in birth rates falling below replacement rate, and hence in negative population growth and, thus, group extinction. In all these genera, fertility is maximised if females live on their own (i.e., in groups of just one female, with or without males and/or dependent young).
In contrast, fertility rates for banded mongoose, lion and feral horses all exhibit ∩-shaped distributions (Figure 3; the original data and analyses are given in Supplementary Figure 2). For the banded mongoose, the overall quadratic equation is significant (quadratic r2 = 0.420 vs. linear r2 = 0.179, N = 6; Fisher’s log-likelihood meta-analysis combining the individual quadratic regressions for the three separate years shown in Supplementary Figure 2: quadratic: χ2 = 23.03, df = 6, p = 0.0008; linear negative slope: χ2 = 0.84, df = 6, p = 0.991). Double differentiating the regression equation to find the maximum indicates that optimal fertility occurs at ∼8 females. The regression for the lion data is the statistically significant (p < 0.001) quadratic regression for female reproductive success in lion prides given by Mosser and Packer (2009), holding other significant predictors (territory quality, takeover rate) constant (see Supplementary Material). Double-differentiating indicates that fertility is maximised in groups with 8.6 females. The quadratic regression for feral horses is also significant (r2 = 0.308, F2,22 = 4.89, p = 0.017; linear: r2 = 0.099, p = 0.125). Optimal fertility occurs in bands with 6–7 females, at exactly the transition point between territorial and non-territorial males in this population – raising the possibility that territoriality results in males attempting to corral females when it is not actually in the females’ reproductive interests. Fisher’s meta-analysis for the three genera, indicates a consistent quadratic pattern underlying all three genera (χ2 = 15.16, df = 2∗3 = 6, p = 0.019). In all three cases, optimal fertility occurs in groups with 7–8 breeding females.
To maintain comparability with Figures 2–4 plots the best-fit regressions for birth rate against the number of adult females in the group for the 12 primate genera. (The data plots and regression equations for individual genera are given in Supplementary Figure 3 and Supplementary Table 2). Overall, quadratic regressions yield much a better fit than linear relationships (Supplementary Table 3). There are, however, some exceptions. A linear relationship clearly provides a better fit for Callithrix. The callitrichids are, as a group, exceptional among the anthropoid primates in that they live in small, often unstable, groups of 1–5 females with a variable number of males (Digby et al., 2007). The only other exceptions are Eulemur and Trachypithecus, both of which have only three datapoints available. The data for the first fit neatly on the up-slope for the closely related genus Lemur (to which genus Eulemur formerly belonged); those for the second are either a weak negative relationship or arguably straddle the ∩-relationship within the same Lemur arc. Including P. hamadryas with the rest of the Papio species does not change the fact that, overall, a quadratic regression is a significantly better fit for this genus (linear: r2 = 0.038, N = 21, p = 0.396; quadratic: r2 = 0.310, N = 21, p = 0.035); however, combining them obscures the fact that the data for the other Papio species in fact form a distinct quadratic relationship on their own account.
To explore the primate patterns on a broader taxonomic scale and with a larger sample, we used census data on reproductive output, indexed as the average number of immatures (i.e., pre-pubertal young) per female for a given population. We located reliable census data for a sample of 277 populations representing 23 genera for which at least three populations had been sampled (mean number of populations sampled per genus = 12.3 ± 11.1SD). We use the number of surviving dependent offspring over a 2–5 year period (depending on species life history) since this can easily be determined from group census data. While a proxy for birth rate, it obviously also includes some discounting due to postnatal mortality. Each data point is the mean fertility and mean group composition for an individual population, averaged across several groups.
Plots for individual genera are given in Supplementary Figure 4, with regression analyses in Supplementary Table 4. A quadratic regression gives a significantly better fit than a linear regression for all three predictor variables for most genera. In this case, the differences between the three demographic variables as the predictor are less clear cut (Supplementary Table 5), although the overall fit is better for number of females (see Supplementary Material). Figure 5 plots the summary quadratic (or linear, where this gives a better fit) regressions for the individual genera (based on the assessments given in the Supplementary Material).
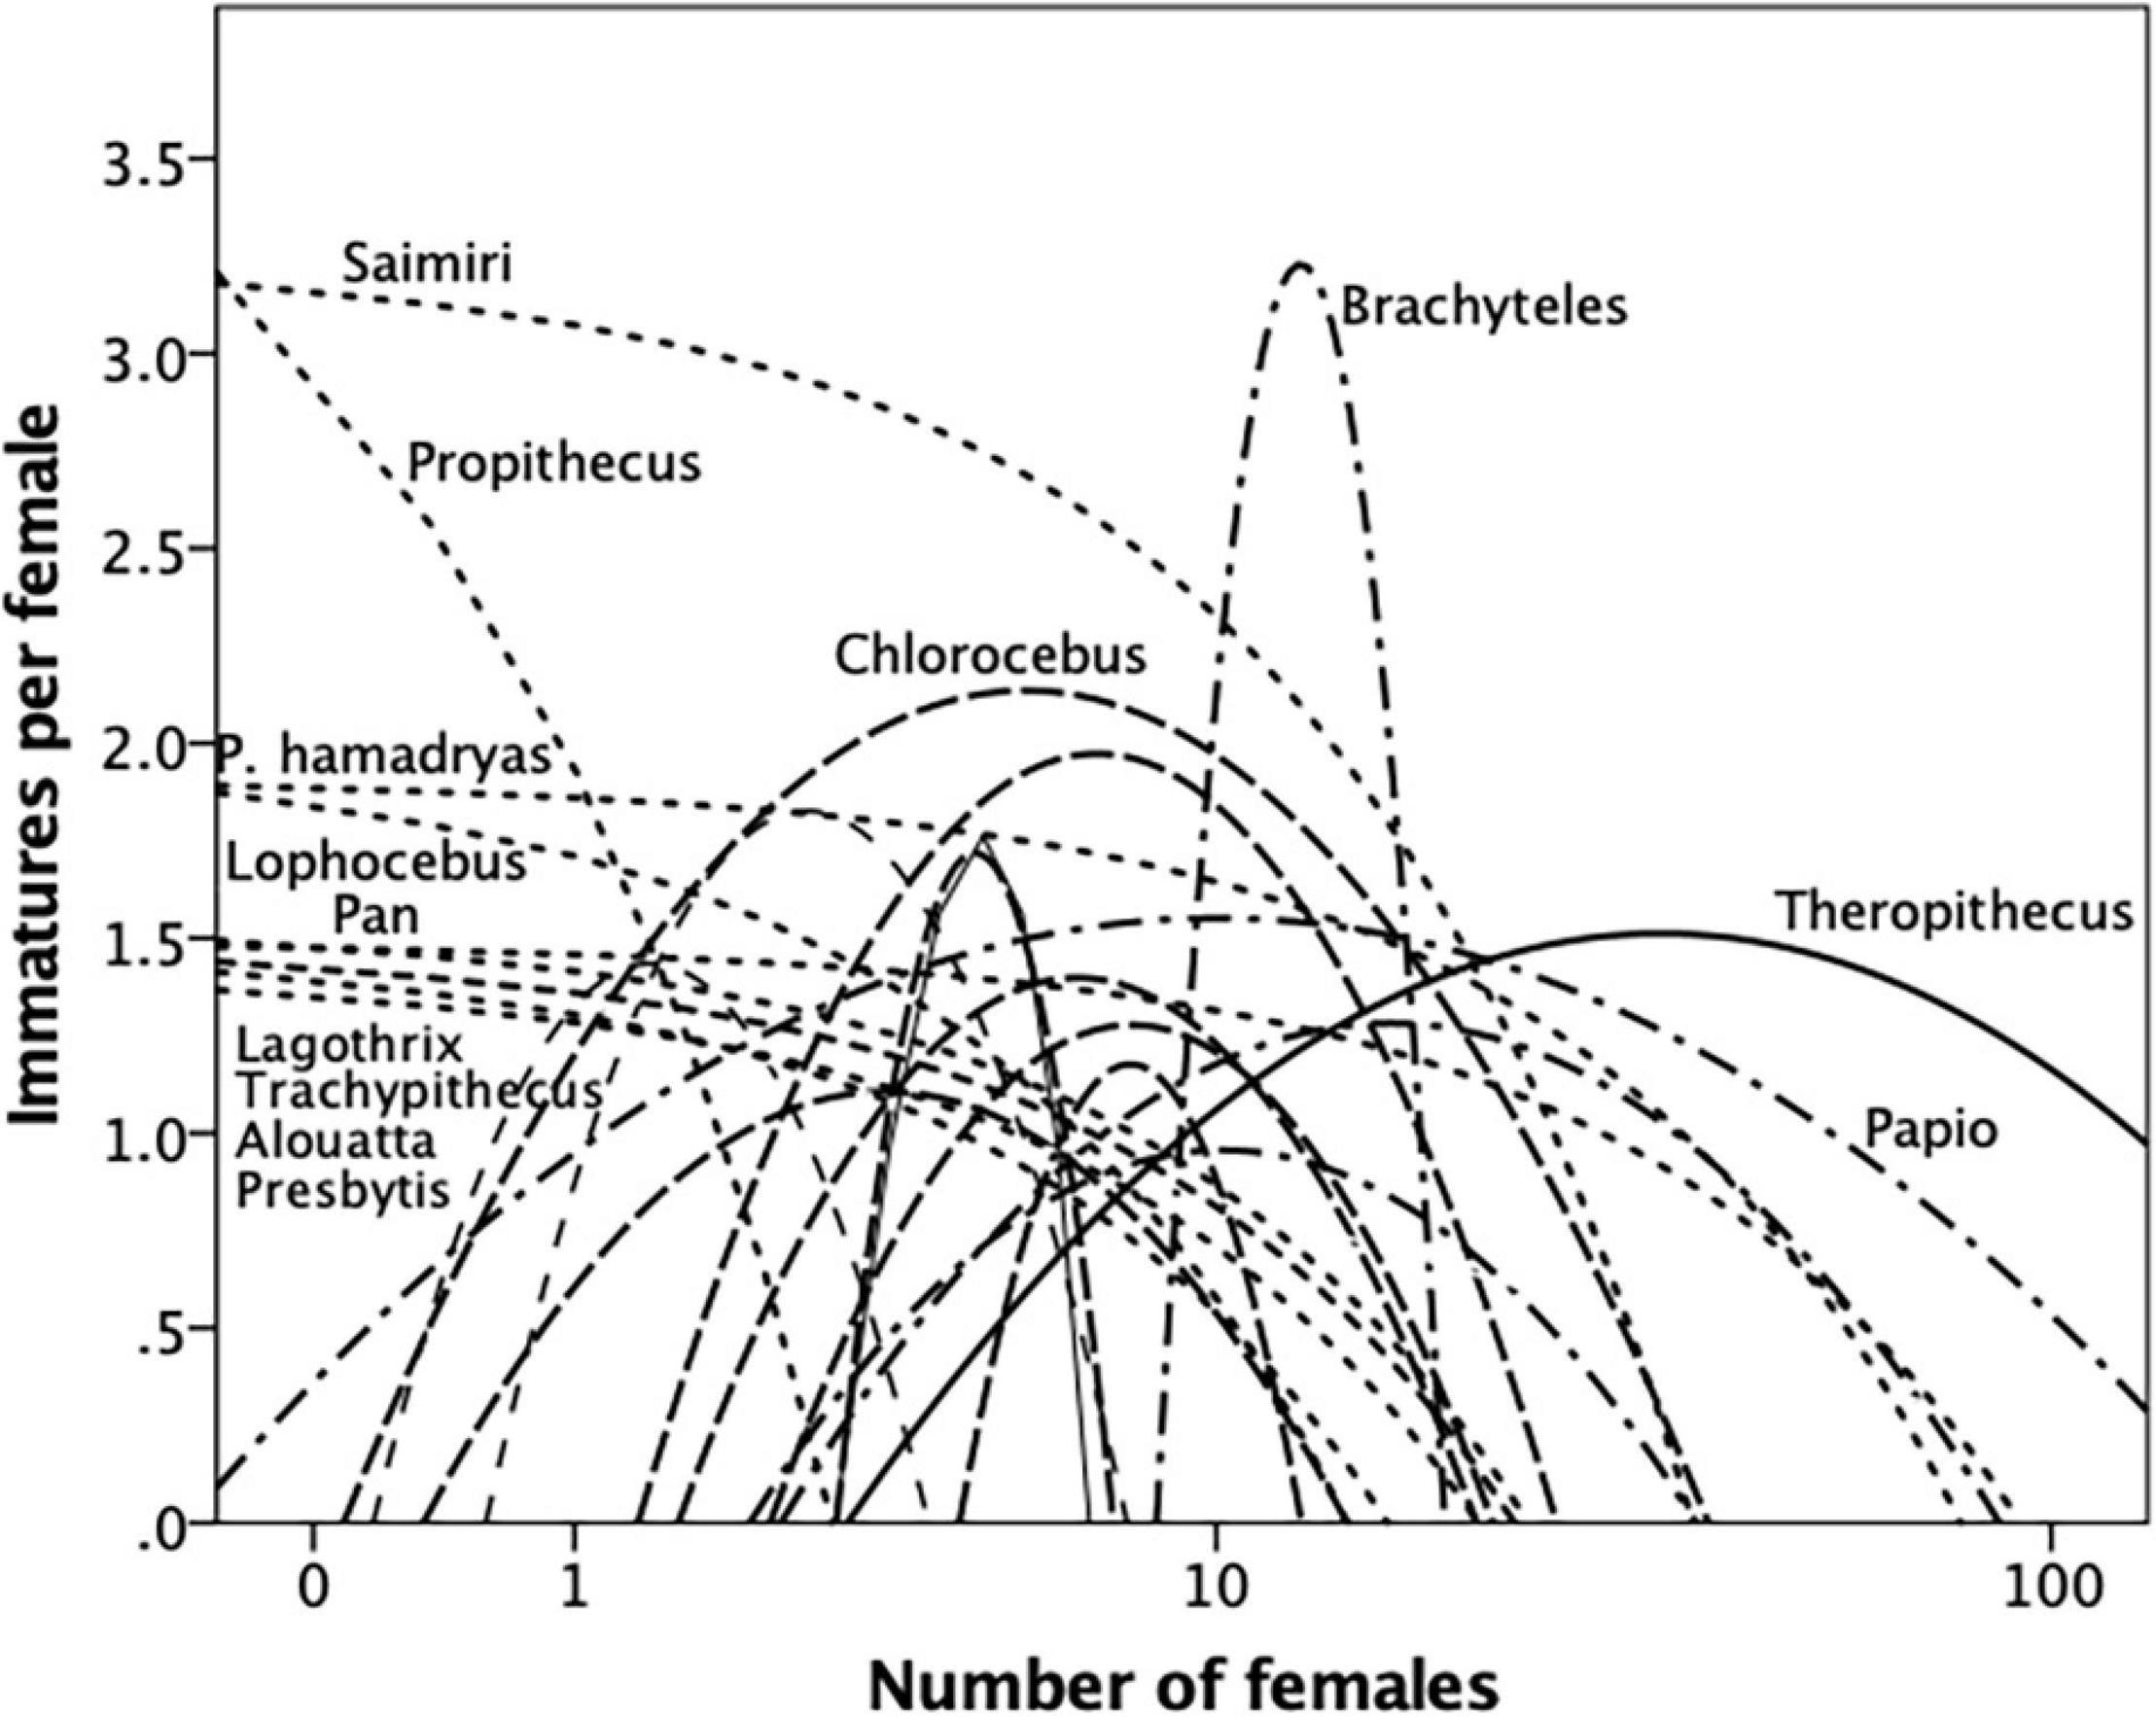
Figure 5. Best-fit quadratic regressions for reproductive output (surviving immatures per female) regressed on female group size for different genera of primates. Lines in different format indicate clustering of regressions (for further details, see text and Supplementary Material). Source: Supplementary Dataset 4.
The ∩-shaped relationships in Figures 4 and 5 imply that there is an optimal group size that maximises reproductive rate. These values ought to predict mean taxon group size if species are trying to behave optimally, as evolutionary theory would predict. To determine the optimal number of females that maximised fertility, we set the second derivative of the quadratic equation to 0 and solve for X (the number of females) for those genera where there was a clear quadratic distribution; for those genera where a quadratic regression did not provide a better fit than a linear regression, we identified the optimal number of females as that corresponding to the highest observed fertility value (for details, see Supplementary Material). The optimal number of females in each case is given in Table 1 for each dataset.
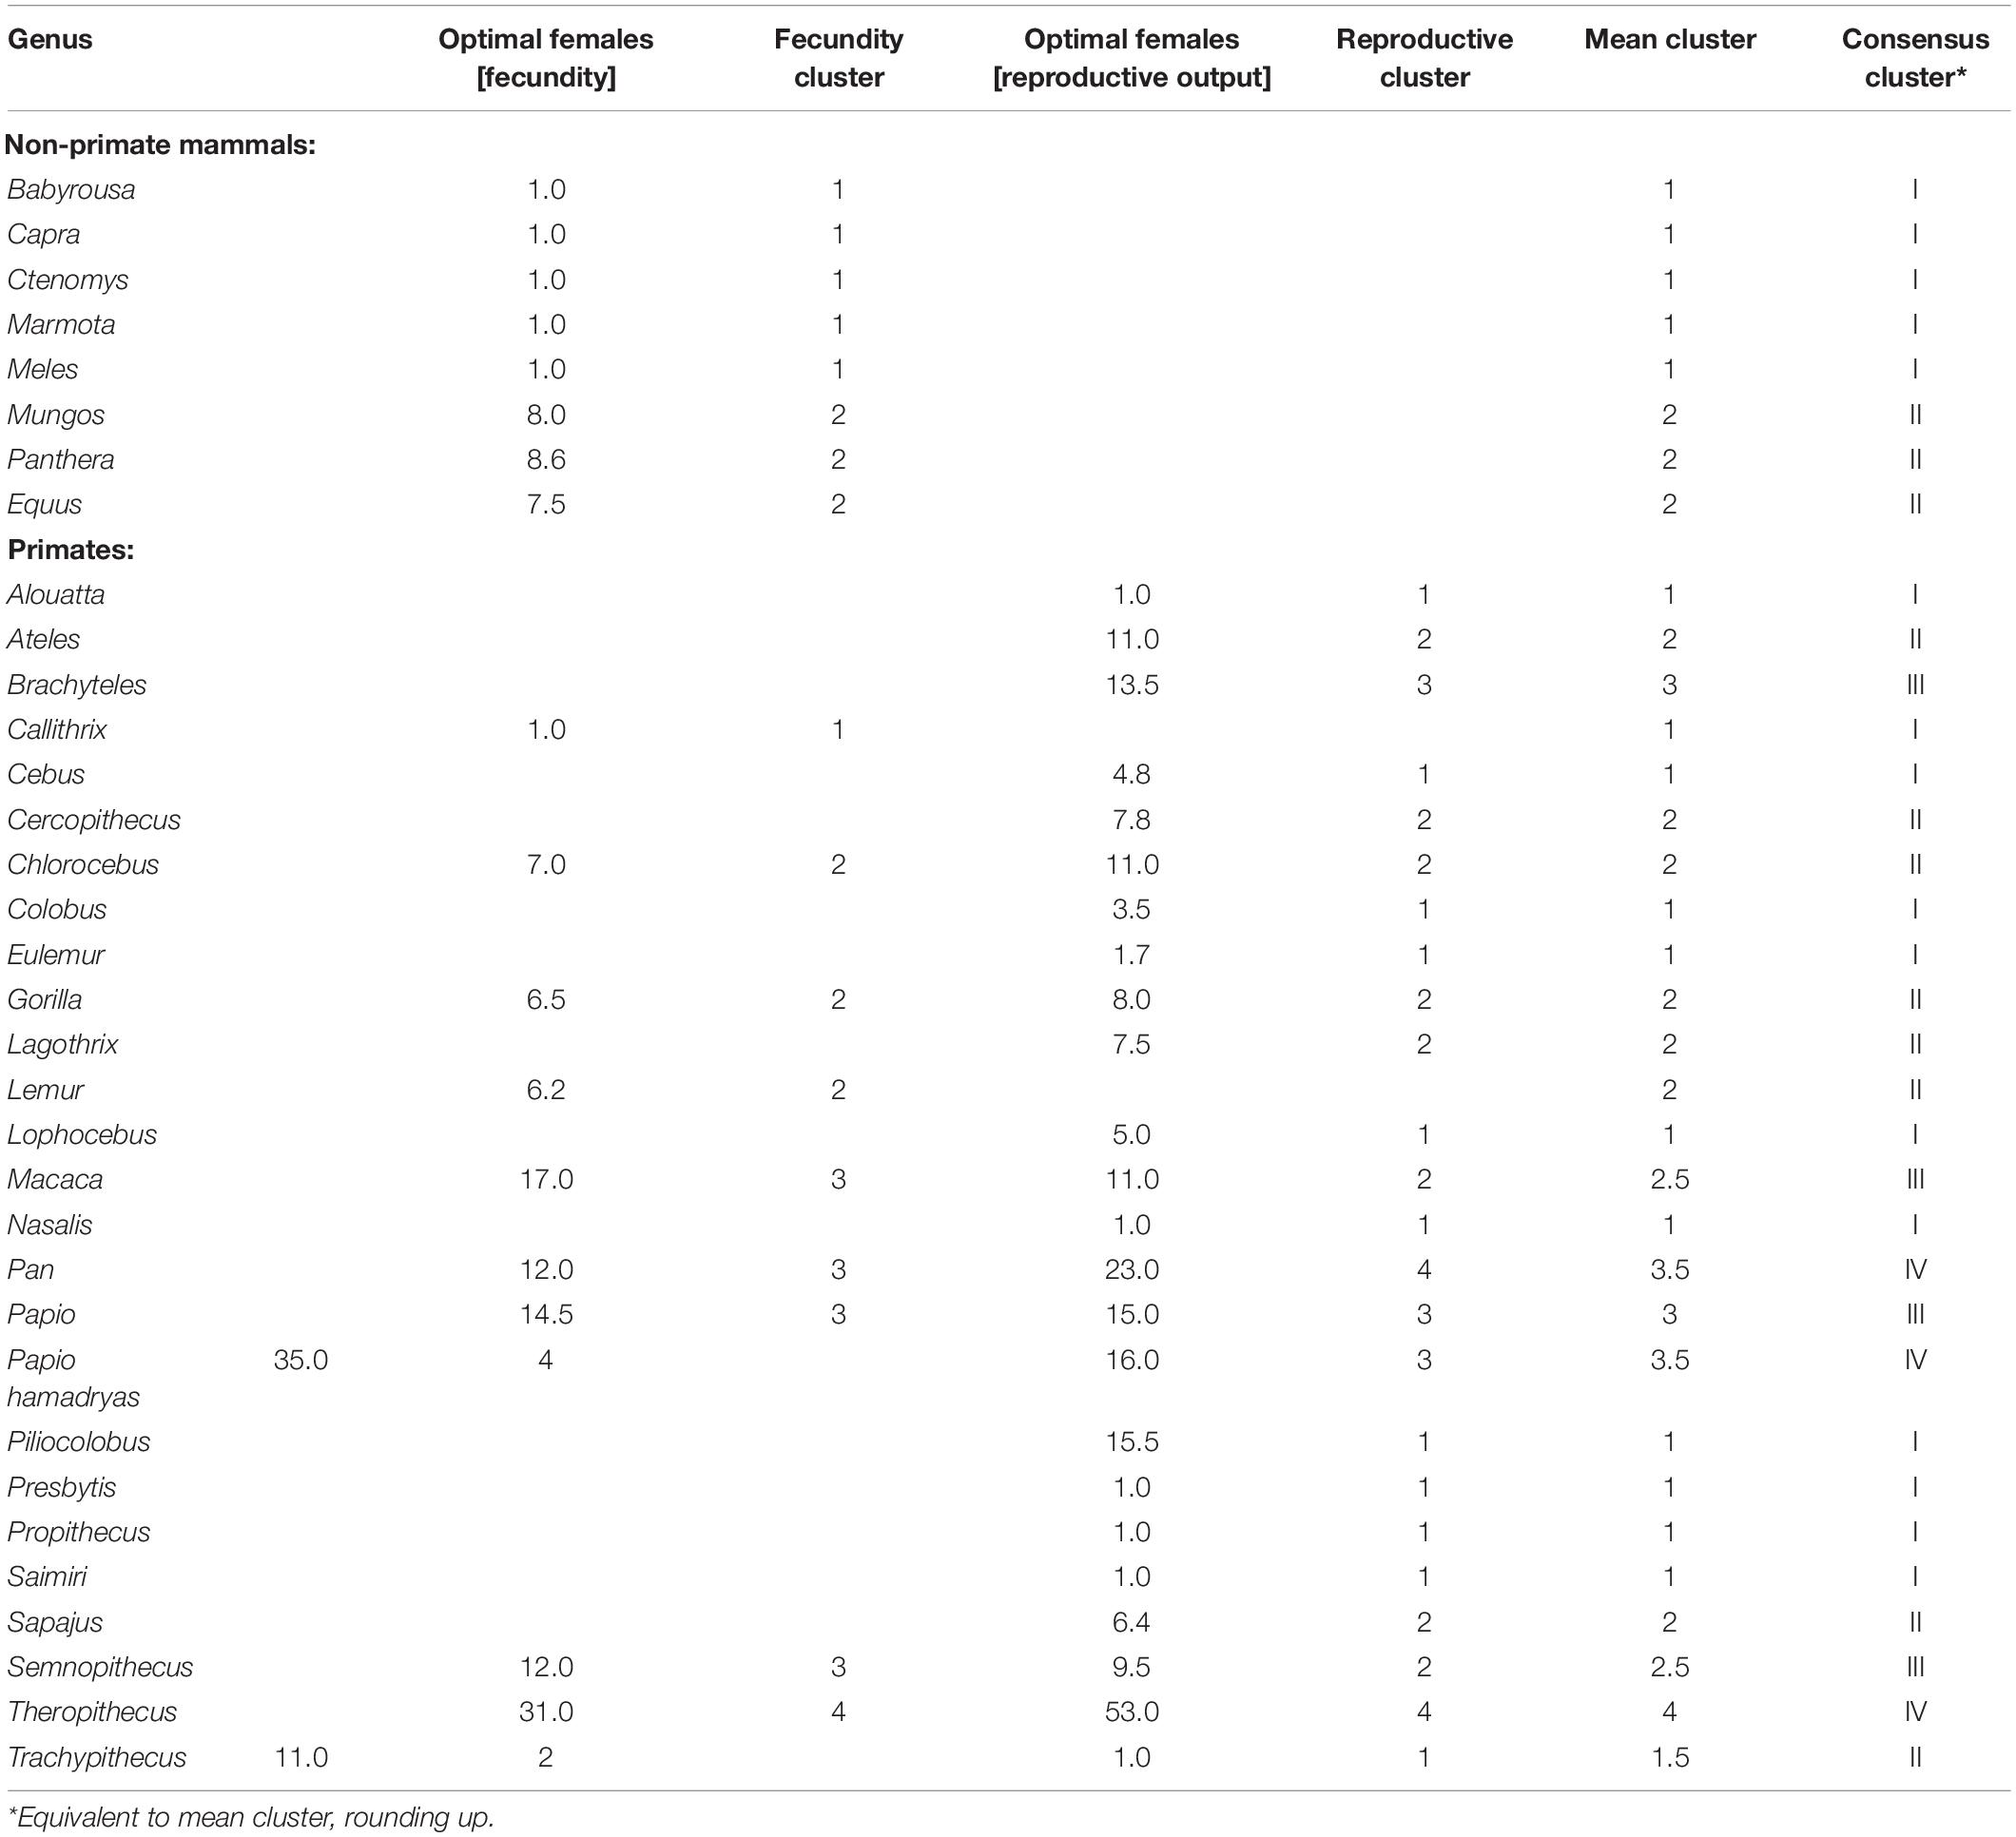
Table 1. Cluster allocations by k-means cluster analysis.
Figure 6 plots the resulting optimal female cohort size against the observed mean number of females per group (from Dunbar et al., 2018b) for each genus. We plot the regressions line for the data in each case not to test a causal relationship, but simply to illustrate how close the data lie to the line of equality. We are here concerned simply with whether the observed and predicted values match in each individual case. Matched pairs t-tests indicate that the two indices do not differ significantly from each other (birth rate, t = −0.211, N = 10, p = 0.837; reproductive output: t = 0.287, N = 23, p = 0.777). In other words, species’ mean female cohort size is very close to that which optimises fertility (however, we measure this). Notice that even Papio hamadryas and Theropithecus gelada (who live in very large modular fission-fusion herds) sit quite close to the line of equality: these two species seem to have managed to increase group size well beyond the normal range for primates without sacrificing fertility; they seem to achieve this by exploiting the capacity to substructure their groups so completely that the subcomponents are semi-independent, thereby exploiting the advantages of fission-fusion herding without losing the benefits of bonded groups.
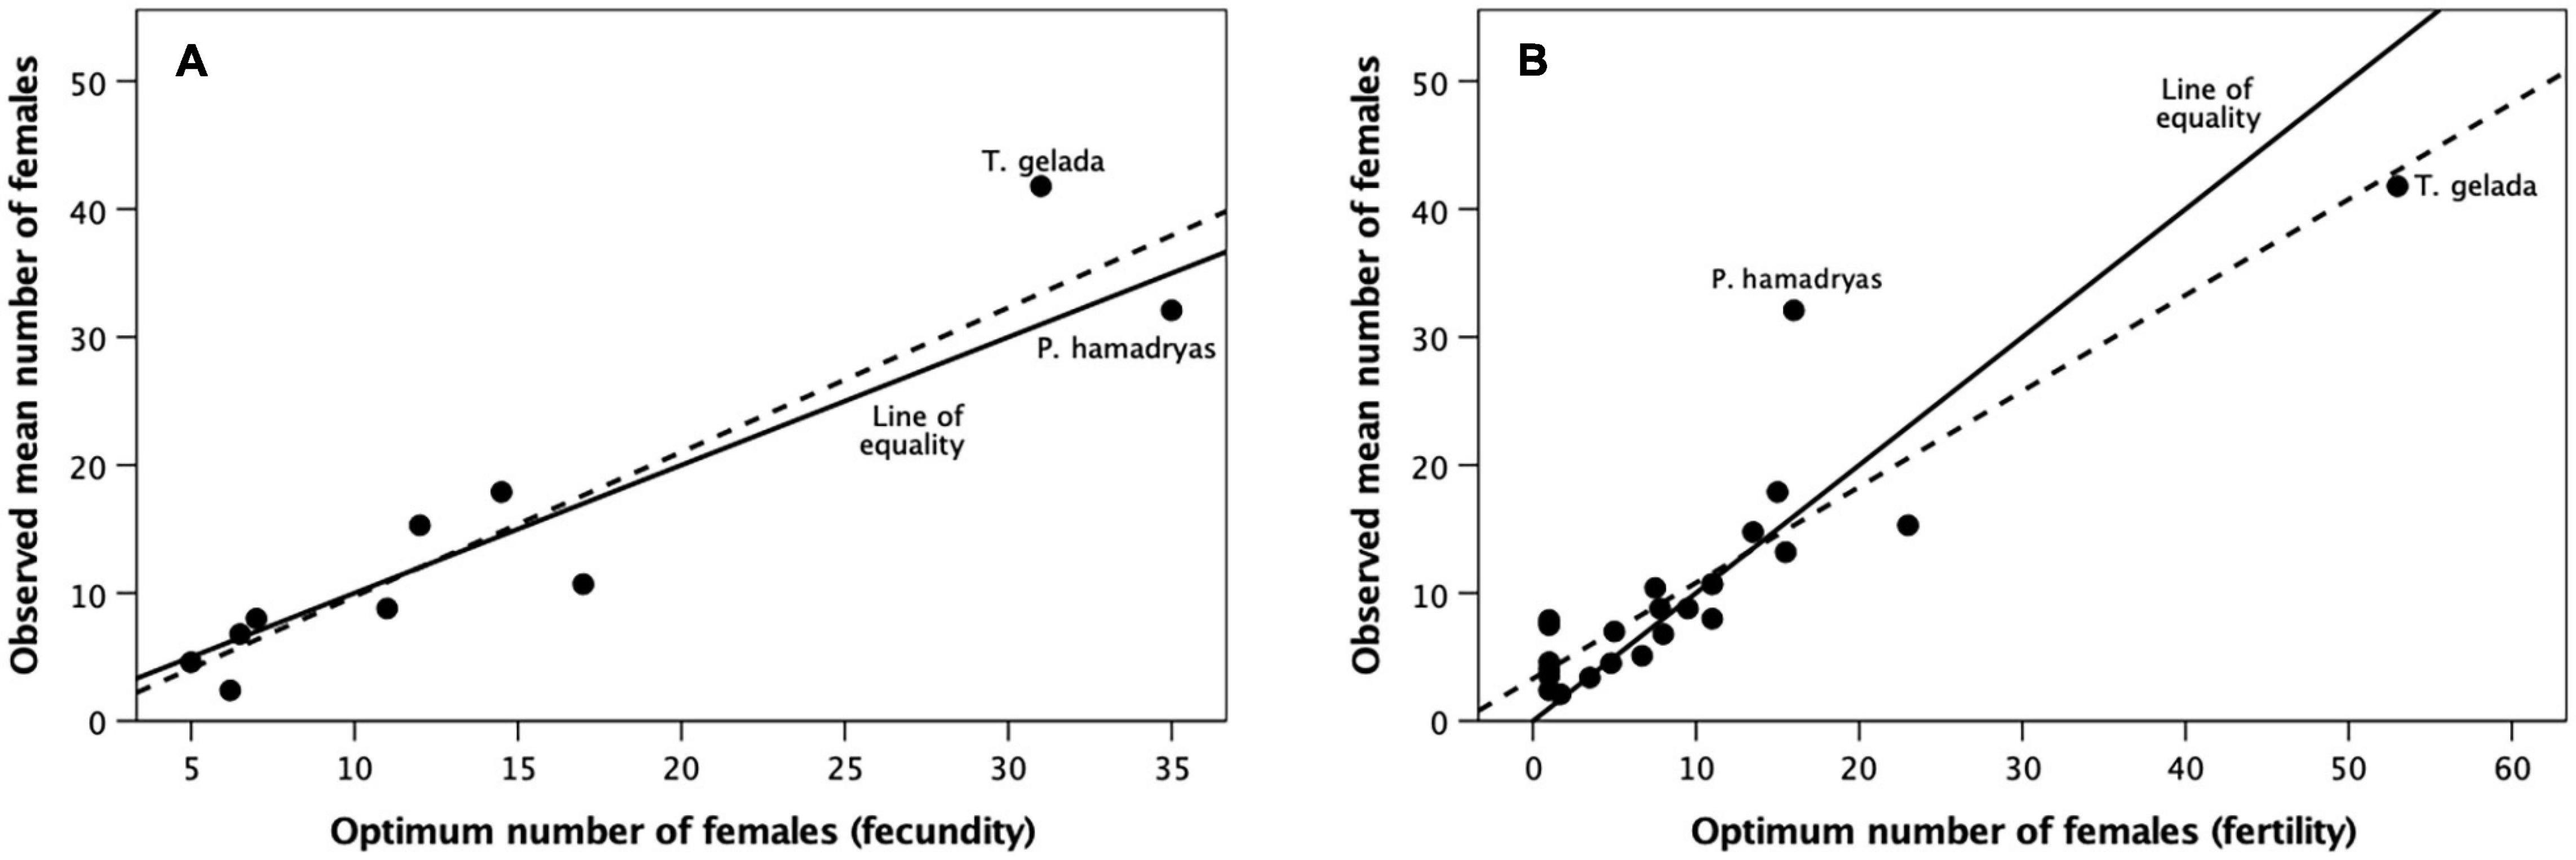
Figure 6. Mean observed number of adult females per group for individual primate genera plotted against the optimum number of females that maximises (A) birth rate (from Figure 4) and (B) reproductive output (from Figure 5) for individual genera. The solid line is the line of equality (observed mean group size equals predicted group size that maximises reproductive rate); the dashed line is the best fit regression equation. Papio hamadryas and Theropithecus gelada combine female-female/female-male bonded coalitions with a modular fission-fusion social system. Source: Supplementary Dataset 5.
Endogenous Determinants of Within-Taxon Variation in Fertility
A quadratic relationship usually implies a tradeoff between benefit and cost functions that correlate in opposite directions with the independent variable. To determine which variables give rise to the tradeoff, we ran separate multivariate regressions for each primate genus, with the three demographic variables (group size, number of adult males, number of adult females) as predictors. Figure 7A plots the distributions for the standardised slope coefficients for the 12 primate genera from Figures 4, 7B plots the same for the 23 genera from Figure 5. The multiple regression models and statistics for individual genera are given in Supplementary Table 6. The slopes differ significantly across factors in both cases (Figure 7A: F2,37 = 4.88, p = 0.013; Figure 7B: F2,51 = 15.84, p < 0.0001). In both cases, the slope for group size is consistently positive and that for number of females consistently negative, whereas the slope for number of males overlaps zero.
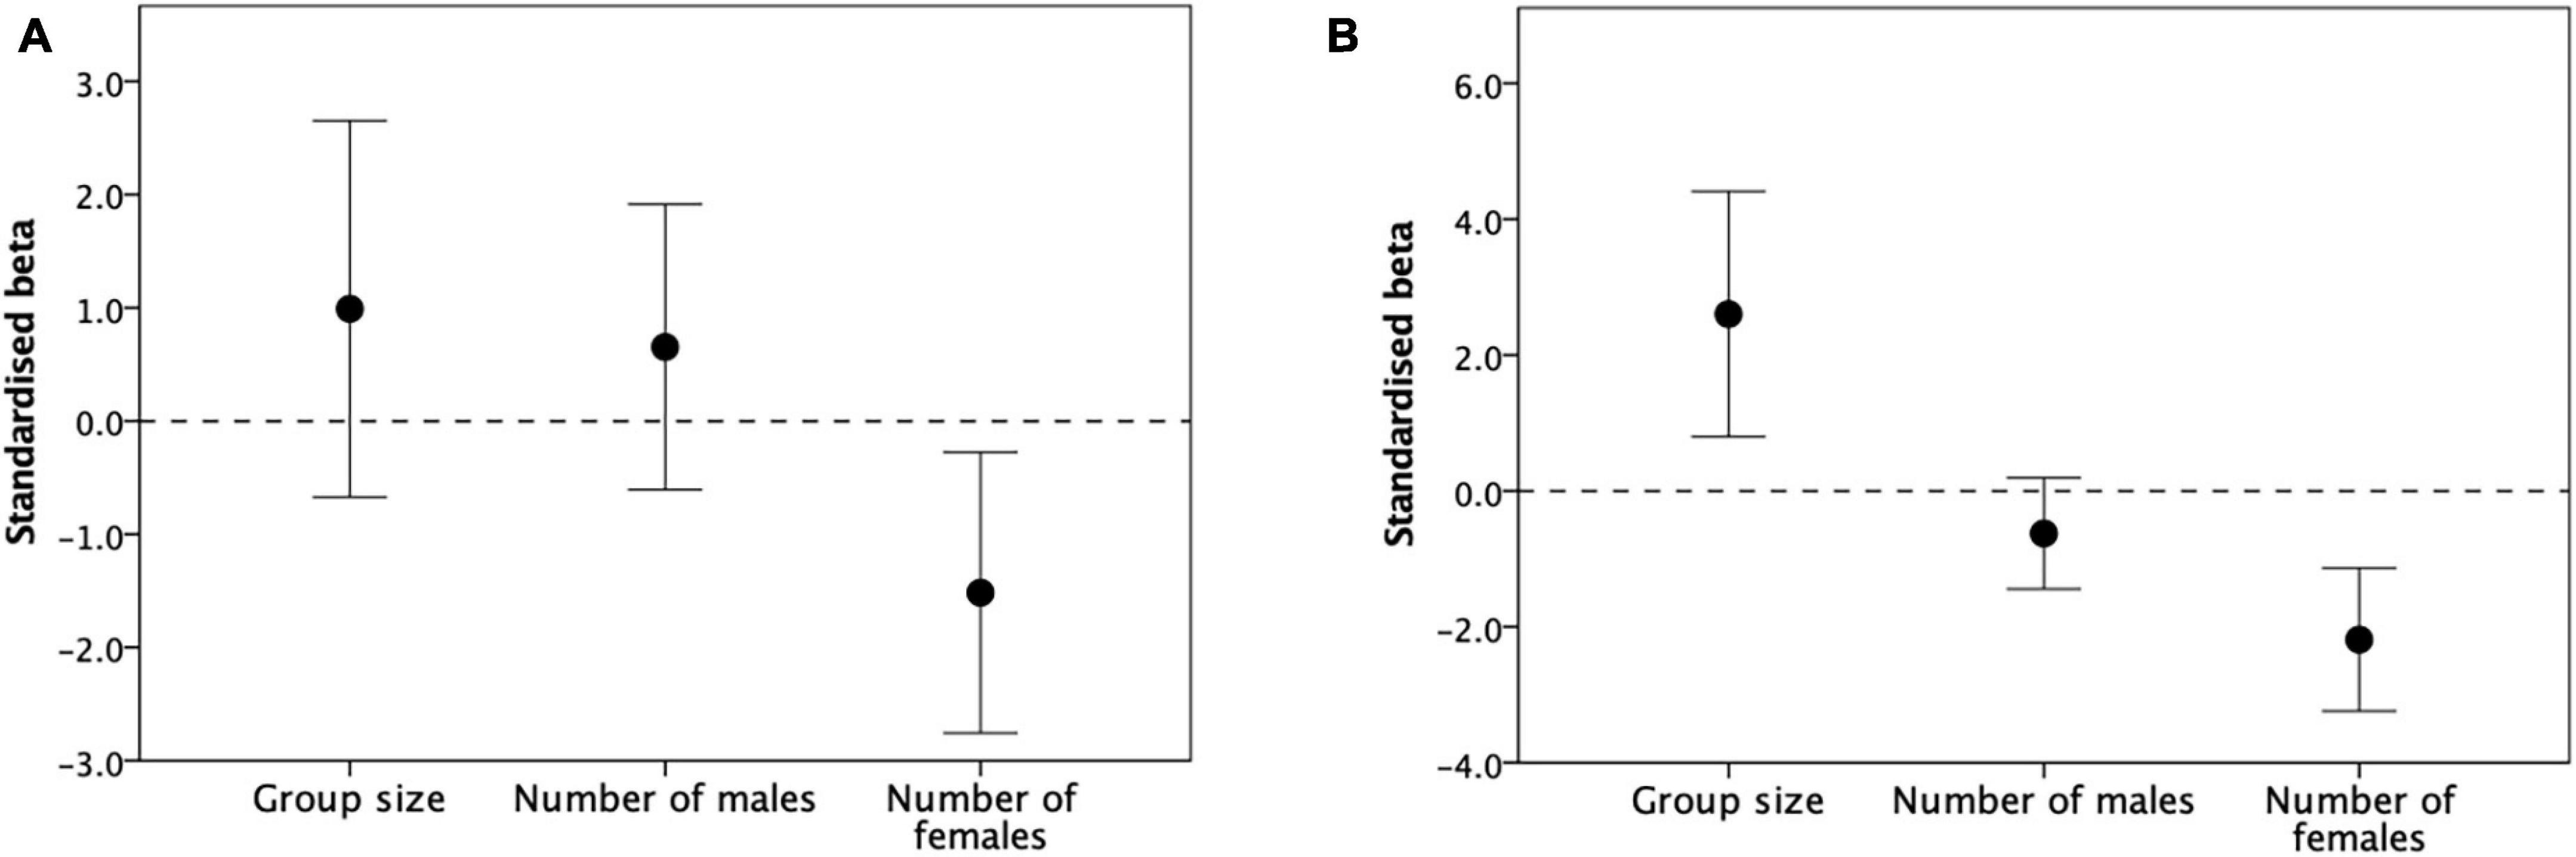
Figure 7. Mean (± 95% CI) standardised slope coefficients for total group size, number of males and number of post-puberty females as predictors of (A) birth rate (from Figure 4) and (B) reproductive output (surviving immatures per female: from Figure 5) for individual primate genera.
A multiple regression analysis for the mongoose data (Figure 3) with group size and number of females as predictor variables (male numbers were not given) also yields a significant regression that is positive in group size and negative in adult female cohort size:
Fecundity = 0.087 + 0.037∗Group – 0.066∗Females
(r2 = 0.475, F2,12 = 5.43, p = 0.021; group, p = 0.010, females p = 0.014, 1-tailed). The lion data (Figure 3) mirror these results, with a significant positive effect due to pride size and no effect due to male numbers (p > 0.05) (Mosser and Packer, 2009). Mosser and Packer (2009) note that increasing pride size correlated significantly with greater success in conflicts with neighbouring prides (p≈0.001), fewer injuries to females (p≈0.005) and lower female mortality rates (p≈0.015).
Both Figures 4 and 5 suggest that the primate data partition into separate clusters that occupy non-overlapping sections of the X-axis state space. To determine whether this is so, and if so which genera fit in which cluster, we ran a k-means cluster analysis across the range 2 ≤ k ≤ 6 on the data for all 20 primate and non-primate genera combined for the birth rate dataset and all 23 genera for the primate reproductive output dataset. We use the change in goodness-of-fit (indexed by the F-ratio) to identify the optimal number of clusters. The rate of change in F-ratio peaks at k = 4 for the birth rate data (Supplementary Figure 5A) and at k = 5 for the reproductive rate data (Supplementary Figure 5B). However, in the latter case, cluster 5 contains a single genus (Theropithecus); since clusters with a single member are considered undesirable, we combine clusters 4 and 5 in this case and consider k = 4 to be the optimal solution for both datasets. In other words, the data consist of four superimposed normal distributions whose peaks differ.
Figure 8A plots the cumulative distribution of the optimal number of females for the birth rate sample. The cluster divisions (numbered I–IV) are identified by the sideways step-changes in the rising cumulative curve. The mean number of females for the four clusters are 1.0, 6.9, 13.6, and 32.0, respectively. Cluster I contains only non-primate mammals from Figure 2; the remaining non-primate mammal genera (from Figure 3) group with some primates in cluster II, but only primates occur in the two largest clusters (III and IV). Figure 8B plots the cumulative distribution for the reproductive output sample (primates only). In this case, cluster means occur at 3.2, 9.1, 14.8, and (for the combined clusters IV and V) 29.0 females.
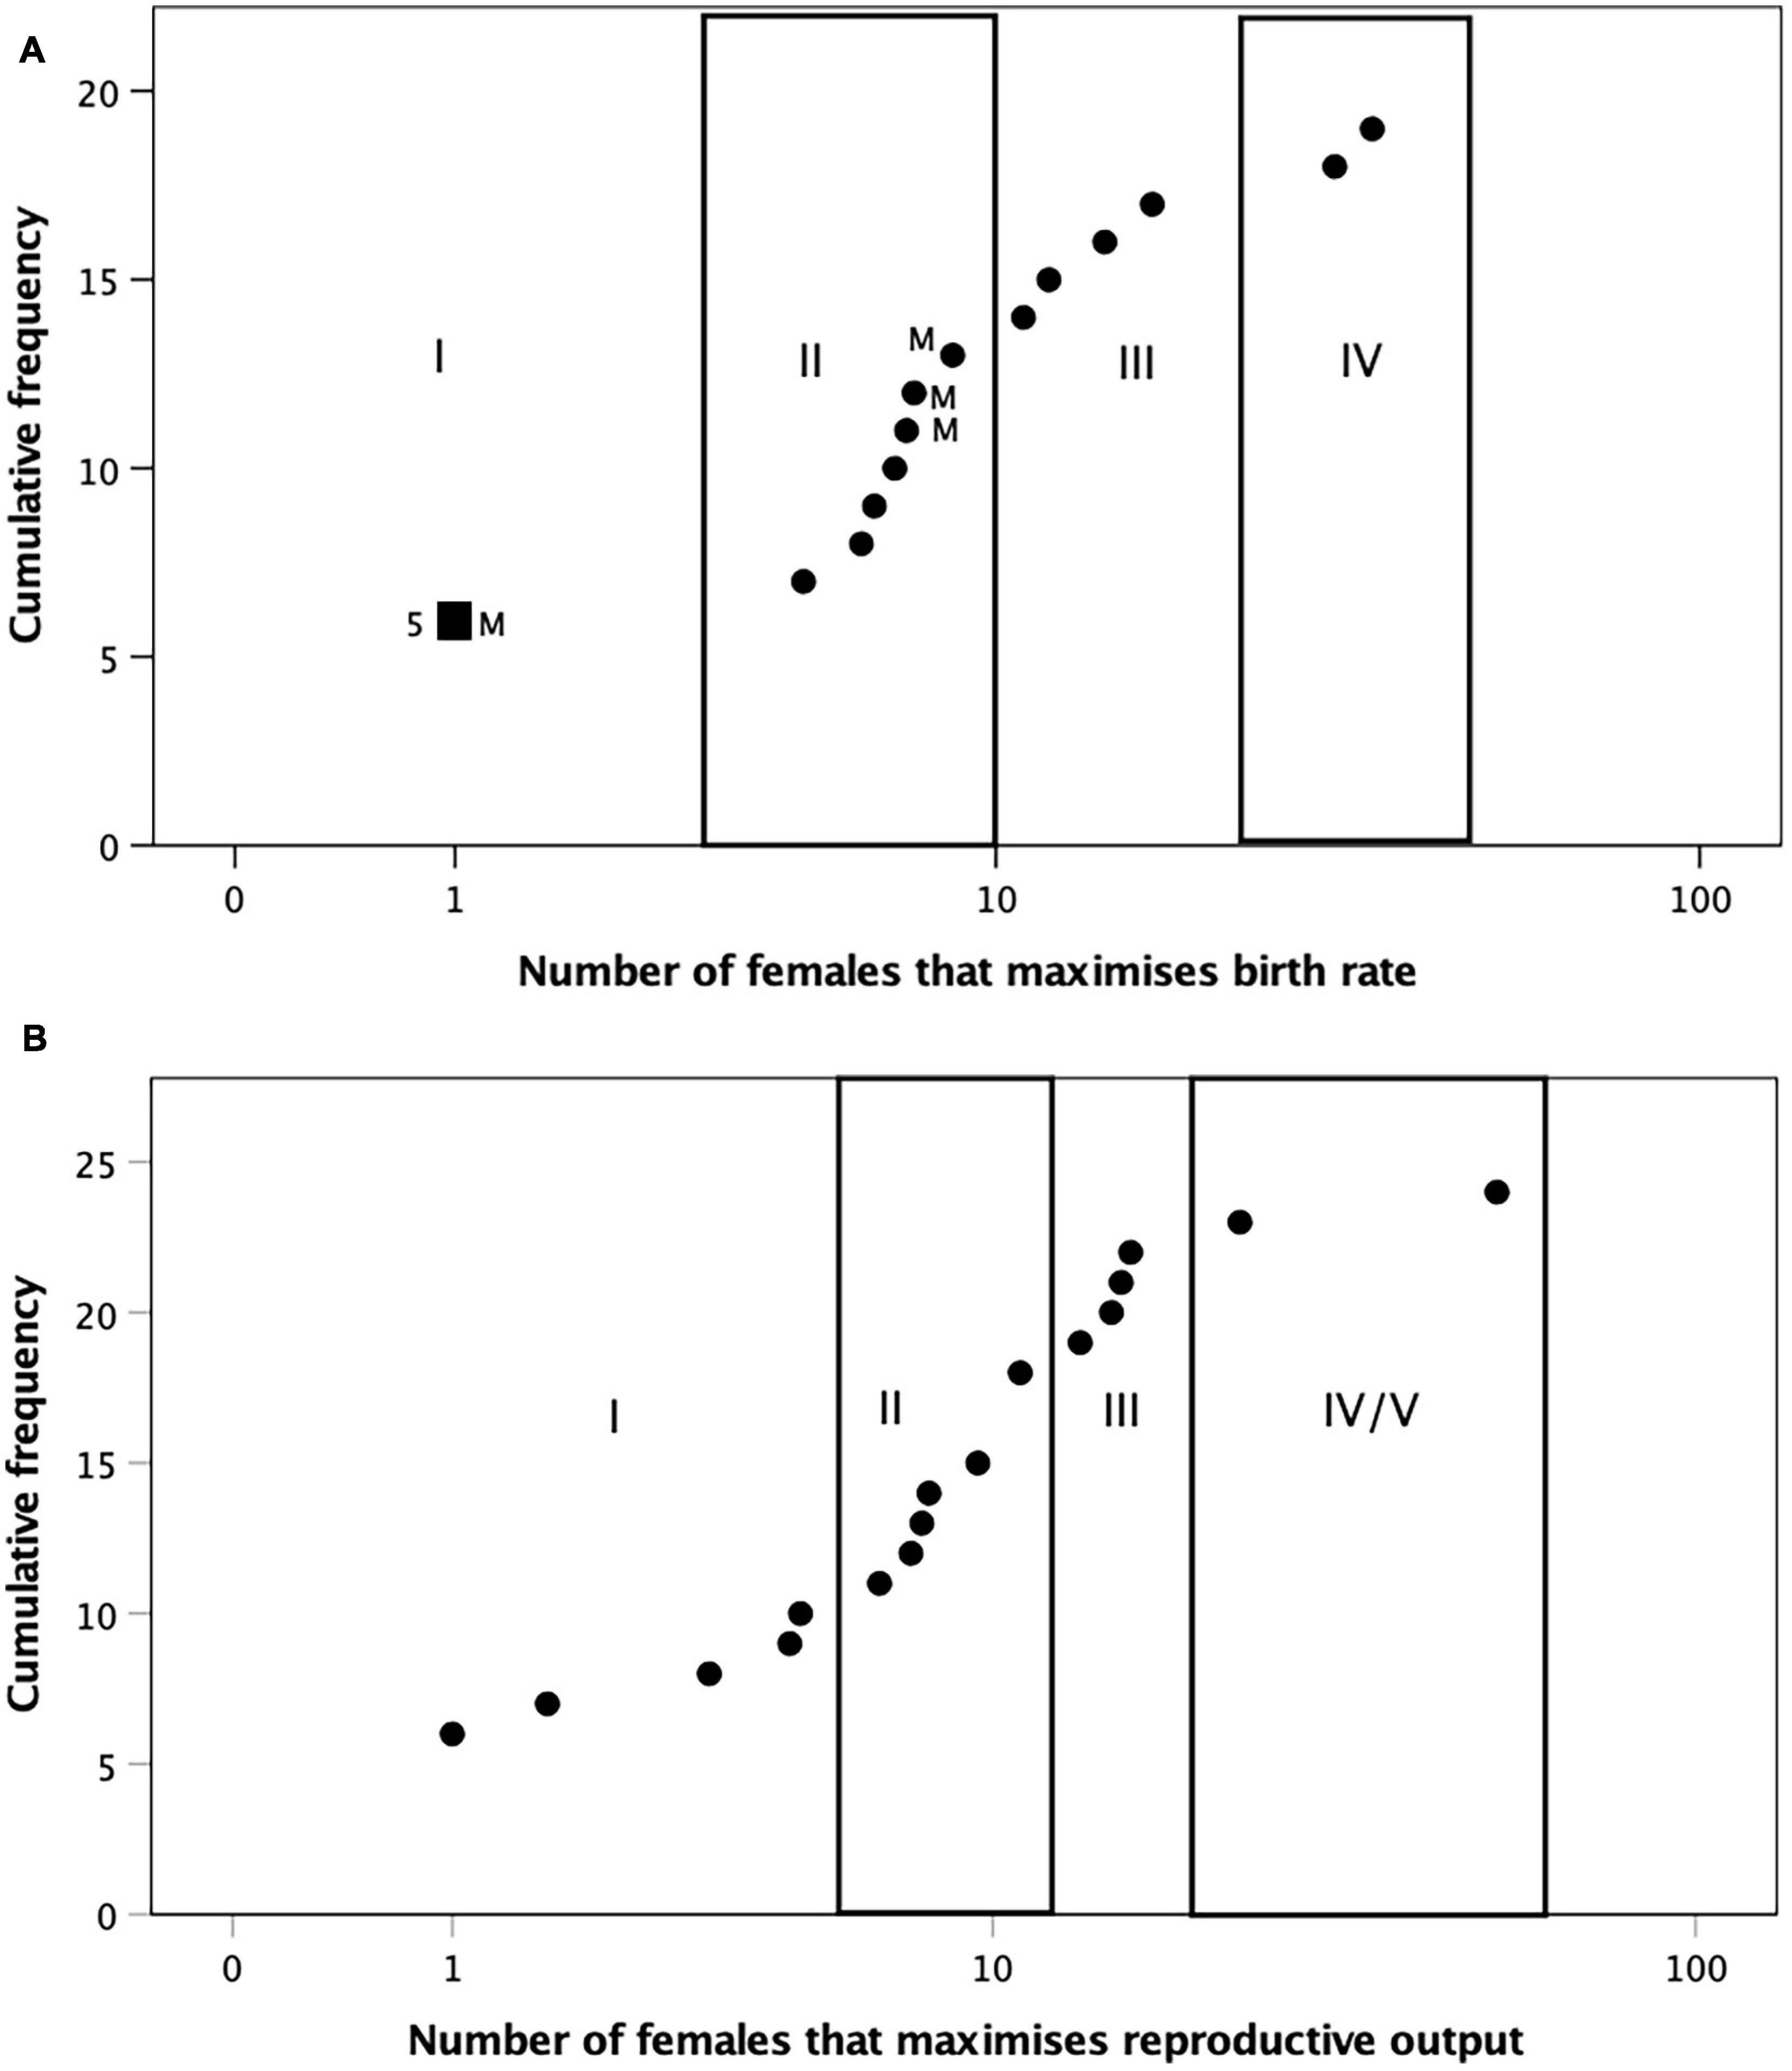
Figure 8. Cumulative distributions of the number of females that maximise (A) birth rate in mammal genera (from Figures 2– 4) and (B) reproductive output in primate genera (from Figure 5). The clusters identified by a k-means cluster analysis in each case are identified by the Roman numerals. In (A), M denotes non-primate mammals; the large square with the adjacent numeral 5 denotes five non-primate mammal genera at the same position.
Table 1 gives the cluster allocations for the individual genera generated by the two fertility indices. For genera in common in the two primate datasets, the allocation of genera to clusters is significantly correlated (Kendall’s τ = 0.732, N = 10, p = 0.005 1-tailed). To obtain a consensus classification, we averaged the cluster allocations of the two k-means analyses (rounding up, as appropriate), and these are given in Table 2.
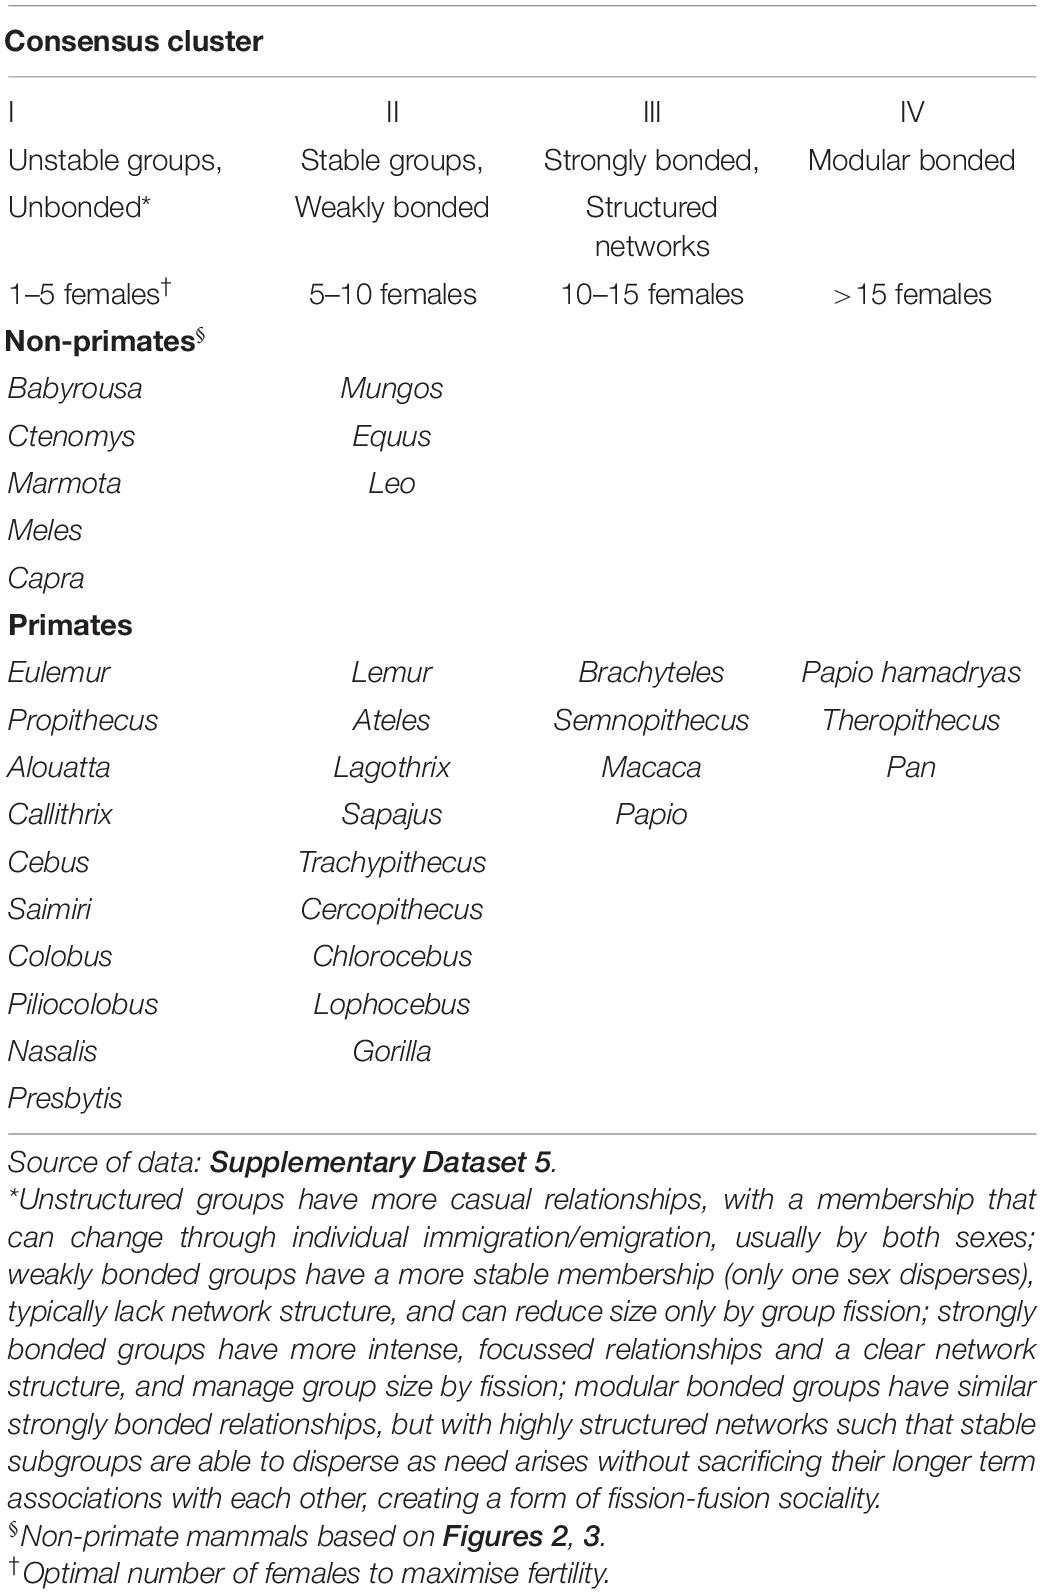
Table 2. Consensus cluster allocations of mammalian genera by k-means cluster analysis of optimal number of females to maximise fecundity and fertility (see Supplementary Table 5) for species with stable social groups (congregations).
Extrinsic Determinants of Within-Taxon Variation in Fertility
The fact that the slope parameters for the effect of group size on fertility are so consistently and strongly positive in the primate sample allows us to rule out within-group competition for resources as the cause of declining fertility: this pattern implies that living in groups provides a fertility benefit for females, with the benefit increasing monotonically with group size. This could either be because larger groups are better able to defend resources against neighbouring groups (Markham et al., 2015), or because group size is an effective buffer against predation risk (Dunbar, 1988; Shultz et al., 2004; Shultz and Finlayson, 2010), or because groups provide females with protection from infanticidal males (van Schaik and Dunbar, 1990; Harcourt and Greenberg, 2001; Opie et al., 2017). In the case of lion, hunting success correlates with pride size, suggesting a direct foraging benefit, but this is unlikely to apply in the case of any other taxa in this sample. Infanticide can probably be discounted because the burden of the evidence clearly points to living in groups as an increased, rather than decreased, risk factor for infanticide (Opie et al., 2017). In fact, the single most important driver for increasing group size in mammals, birds and fish is probably predation risk (van Schaik, 1983; Cowlishaw, 1994; Molvar and Bowyer, 1994; Shultz et al., 2004; Creel et al., 2007; Adamczak and Dunbar, 2008; Shultz and Finlayson, 2010; Kelley et al., 2011). Most animals minimise predation risk by passive defence (bunching or grouping), and very rarely, if ever, by the much riskier strategy of active defence (engaging with a predator).
We test between the first two options using two indices of predation risk and one index of intergroup competition, with consensus cluster (as defined in Table 2) as the independent variable. As indices of predation, we use observed rates of predation from field studies (for a limited sample of primates, provided by Cheney and Wrangham, 1987) and an estimate of exposure to predation risk based on the habitats a genus occupies and the kinds of predators common in those habitats. To test whether group size is driven by the risk of encountering and competing with neighbours (Grueter, 2015; Ashton et al., 2020), we use overlap in the ranges of neighbouring groups (from Grueter, 2015).
Habitat predation risk reflects background risk in the habitat, and would predict a positive correlation with fertility cluster (and hence group size). Predation rate, in contrast, reflects the residual predation risk that a species has not been able to control by its anti-predator strategies (i.e., by increasing group size) (Hill and Dunbar, 1998). In this case, a positive correlation would imply that the animals’ anti-predator strategies were not working; a negative correlation would imply that shifting cluster so as to increase group size enables species to reduce predation risk. If range overlap reflects background risk of encountering neighbours, then we would predict a positive correlation between range overlap and fertility cluster (females need to live in bigger groups when there is greater risk of encountering neighbours). A negative correlation might imply that, when animals live in large groups, they reduce range overlap in order to minimise encounter rates (and the mortality risks these entail). The latter implies that animals reduce range overlap because they live in large groups (for some other reason), whereas the former implies that they live in large groups because range overlap is high (for some other reason). For these analyses, we use Kendall’s correlation test, since this was specifically recommended by Kendall for use with categorical data (Maxwell, 1961). Note that the fertility clusters in Table 2 contain a complete mix of taxonomic groupings, and thus cannot have a significant phylogenetic signal.
Figure 9A suggests that, at least in primates, predation rate is uncorrelated with cluster (and hence group size) (Kendall’s τ = 0.088, N = 12, p = 0.714, all tests 2-tailed). However, habitat riskiness correlates significantly and positively with fertility cluster (Figure 9B: τ = 0.702, N = 25, p < 0.001), suggesting that being able to live in larger groups while maintaining fertility does allow species to occupy habitats that are more predator-risky. An analysis of partial correlations holding the alternative predation variable constant yields a slight increase in the correlation with habitat predation risk (Spearman rbivariate = 0.760 vs. rpartial = 0.833, p = 0.001), and a strong (albeit not significant) negative correlation with predation rate (rbivariate = 0.104 vs. rpartial = −0.384, p = 0.244), reinforcing the suggestion that the fertility clusters are related to the animals’ need to reduce exposure to predation.
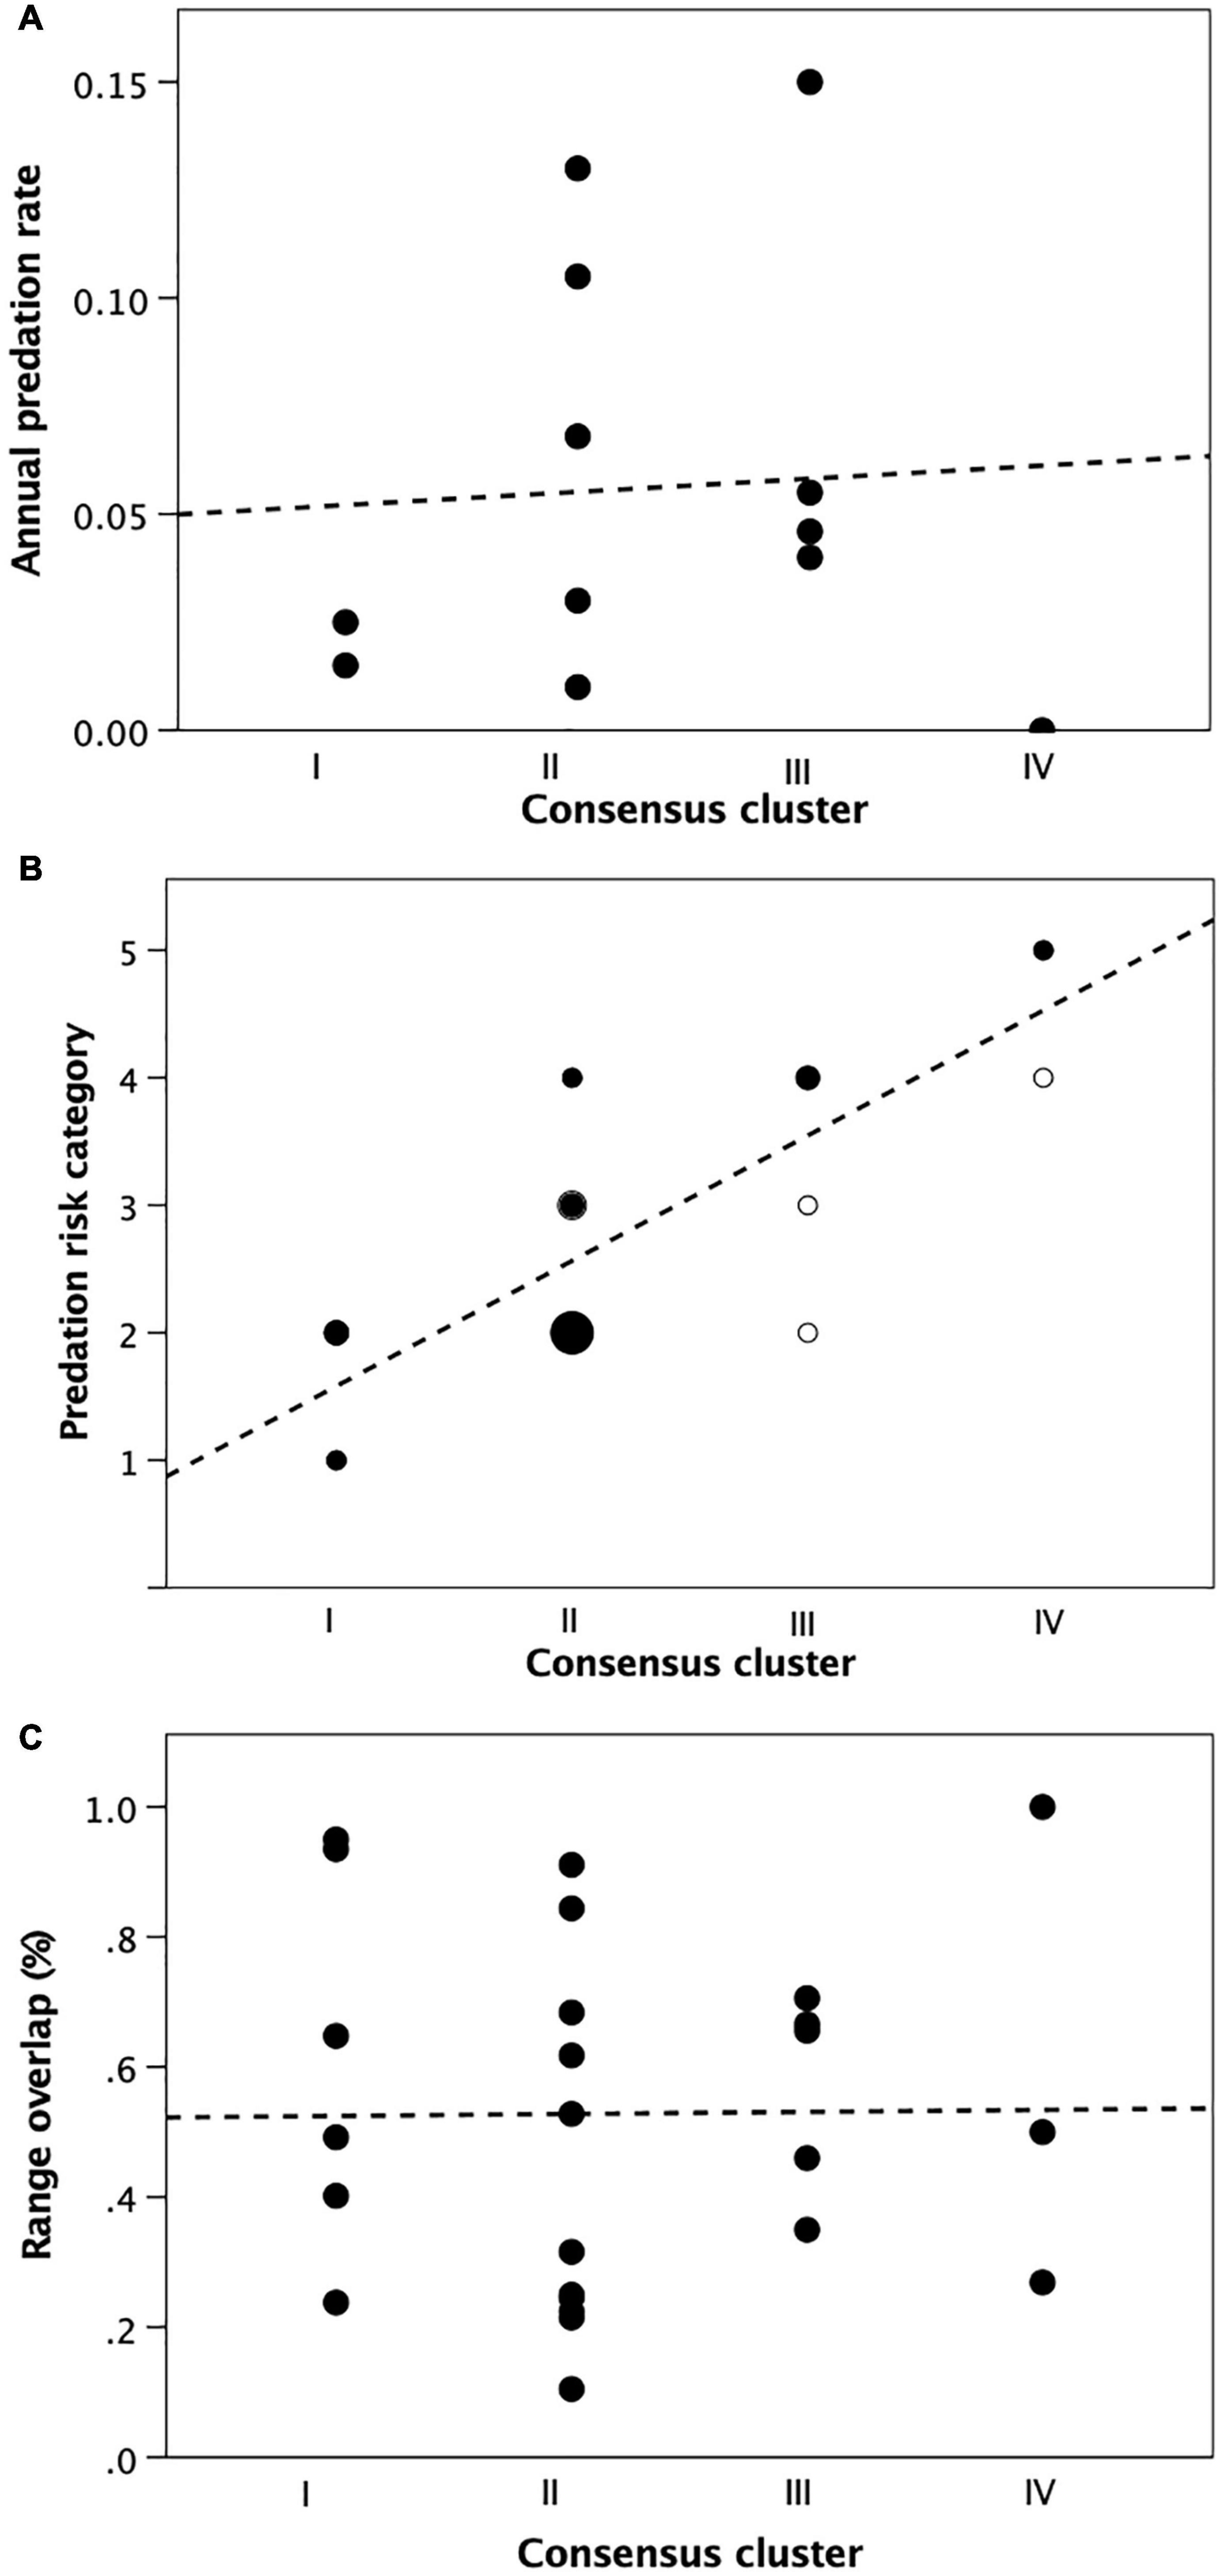
Figure 9. External threats experienced by primate genera as a function of cluster membership from Table 1: (A) Observed predation rate; (B) Predation risk of habitats typically occupied by genus: 1 (low risk) = small-bodied, arboreal forest; 2 = large-bodied, arboreal forest; 3 = terrestrial forest; 4 = terrestrial woodland; 5 (high risk) = open country; small unfilled symbol: 1 datapoint; small filled symbol: 2 datapoints; medium filled symbol: 3 datapoints; large symbol: 7 datapoints; (C) mean proportion of overlap with the ranges of neighbouring conspecific groups (as an index of risk of conflicts). Source: Supplementary Dataset 5.
The alternative suggestion (that species live in large groups to buffer themselves against attack by neighbours) is not supported (Figure 9C: τ = 0.027, N = 25, p = 0.862). This last result is, perhaps, not too surprising: competition is usually most intense in species with small groups and small defendable ranges, whereas species that have large groups and live in large undefendable ranges tend to have more relaxed relationships when they meet (Mitani and Rodman, 1979; Lowen and Dunbar, 1994), in part because they meet less often and in part because they have more alternative feeding places to go to if they do meet.
An exploratory multiple regression with cluster as the dependent variable and the three indices as predictors confirms these results. The overall model is significant (F3,7 = 6.96, p = 0.017), but only habitat riskiness has a significant independent effect (predation rate: t = −0.322, p = 0.756; habitat riskiness: t = 4.43, p = 0.003; range overlap: t = 0.485, p = 0.642).
Two key questions remain: what is responsible for this decline in fecundity and, given that it exists, how do the females in some taxonomic groups manage to overcome it in order to live in larger groups? We consider each questions of these in turn.
A Mechanism for Reproductive Suppression
We noted above that, for individual taxa, a negative impact of female numbers on fertility seems to occur widely across populations in both rich and poor quality habitats, as well as in captivity where food is unlikely to be an issue. Using long term lifetime data from the Gombe chimpanzee population, Pusey and Schroepfer-Walker (2013) report that high rank females live longer and have shorter interbirth intervals than low ranking females, despite there being no evidence that they have differential access to food resources. Similarly, Garcia et al. (2006) found that the low rank females in a captive population of baboons were less fertile than high rank ones despite unlimited access to food. Huchard and Cowlishaw (2011) concluded that declining fertility as a function of group size in a baboon population was unrelated to access to food resources and was most likely a consequence of reproductive conflict between females.
Similar findings have emerged from studies of domestic stock, where infertility at high stocking densities even when food is abundant has been a longstanding problem. Careful experimental testing eventually identified social stress due to crowding as the cause (Dobson and Smith, 2000; Pierce et al., 2008; Dobson et al., 2012). Williams et al. (2001) showed that, although mild social and energy stresses on their own did not disrupt the menstrual cycles of female monkeys, their occurrence in combination did, indicating that mild stress can disrupt menstrual endocrinology even without any weight loss providing the system as a whole is under stress. In a study of lemurs (Lemur catta) on Madagascar, cortisol titres driven by seasonal stresses in nutrient throughput were lower in groups of intermediate size (10–15 individuals) than in smaller (5–9) or larger (19–26) groups (Pride, 2005).
The fact that, in primates at least, fertility is strongly influenced by the number of females in the group across groups within the same population (where environmental effects, while not absent, are at least minimised; Figure 4) as well as across different populations (where environmental effects will be maximised; Figure 5) argues against an environmental driver. This suggests that the effect must, at least in part, be driven by something to do with group demography. Figure 7 points to the number of females in the group as the likely cause. Socially induced stress arising from direct or indirect interactions between females seems the most likely explanation.
In primates, stress levels are known to be influenced by purely social events that are unrelated to ecological conditions. Levels of the stress hormone glucocorticoid (GC) were elevated in wild female baboons during periods of social and demographic instability resulting from both predation events (Engh et al., 2006) and conflict among males (with its attendant risks of infanticide) (Wittig et al., 2008). Similarly, intergroup encounters (and the risks they entail of injury and even death) result in elevated cortisol levels in wild chimpanzees (Wittig et al., 2016). Levels of salivary alpha-amylase (another marker of physiological stress) were also elevated in captive bonobos during stressful situations such as the transfer of individuals between groups (Behringer et al., 2012).
Taken together, these studies, combined with the data in Figure 7, point to stress induced by female-female interactions as the likely immediate cause of infertility, even if this sometimes arises as a consequence of competition over access to resources (Muller, 2002; Rubenstein, 2007; Creel et al., 2013) or conflict between males. There are two possible mechanisms that might produce this effect: (1) stress resulting in the suppression of ovulation or (2) stress obstructing implantation and/or early foetal development (leading to resorption or abortion of the embryo). There is evidence to support both routes.
The reproductive endocrinology of female mammals is extremely sensitive to stress: females subjected to even modest levels of social stress experience reduced levels of fertility across a wide range of taxa (rodents: Geraghty et al., 2015; ungulates: von Borell et al., 2007; Einarsson et al., 2008; primates: Rowell, 1970; Bowman et al., 1978; Abbott, 1984; humans: Zacur et al., 1976; Ferin, 1984; Seifer and Collins, 1990; Laatikainen, 1991; Schenker et al., 1992; Sanders and Bruce, 1997; Sheiner et al., 2003; An et al., 2013; Schliep et al., 2015; Pettay et al., 2016). In some cases, this can even result in complete reproductive suppression, including even the suppression of puberty (callitrichid primates: Abbott et al., 1981; most canids: Moehlman and Hofer, 1997; suricates: Young et al., 2006; mole rats: Faulkes et al., 1990; Bennett, 1994). In most species, harassment and aggression typically accumulate down the female hierarchy (Dunbar, 1980; Creel et al., 2013), resulting in low-ranking females being under increasing levels of stress. Directed aggression, however, is not necessarily the only cause; more generalised levels of stress (frequent predator alarms, spatial compression, conflict with neighbouring groups) will impact on all group members more or less equally.
Whether reduced fertility affects all females in the group equally, or only younger or lower ranked females, is an open question. We cannot differentiate between these two options with the present data. There is, however, experimental (primates: Bowman et al., 1978; Abbott, 1984) and observational (meerkats: Young et al., 2006; primates: Dunbar, 1980; Abbott et al., 1984) evidence that the fertility of subordinate females is differentially suppressed as a result of harassment by dominant females in at least some species. Where females do not form strong dominance hierarchies, however, it may be more likely for all females to be affected equally. Average group fertility would, however, decline either way, and some females would be motivated to leave in order to be in a smaller group – which, for present purposes, is all we are interested in.
There is some evidence to suggest that, independently of any glucocorticoid involvement, endorphin up-regulation in response to any social or physical stress inhibits the GnRH, thereby blocking the LH surge needed to precipitate ovulation (Howlett and Rees, 1986; Ziegler et al., 1990; Gordon et al., 1992; McNeilly et al., 1994; Kalra and Kalra, 1996; McNeilly, 2001; Son et al., 2012; Iwasa et al., 2017). In rats, even the stress induced by being physically constrained for short periods can be sufficient to block the cyclic release of gonadotrophins necessary for ovulation (Euker and Riegle, 1973).
The mediating mechanism appears to be endorphins and the KNDy neuron complex (Ferin, 1984; Schedlowski et al., 1995; Kalra and Kalra, 1996; Li et al., 2010; Dobson et al., 2012). This is confirmed by the fact that both naloxone (an endorphin antagonist) and disengaging the hypothalamus (a key source of endorphins) reinstate the hormone cascade from the pituitary, thereby re-engaging the ovulatory mechanism (Li et al., 2010; Geraghty et al., 2015). Endorphins seem to form a key component of the organism’s global defensive response to stress, acting to buffer the system against short-term physiological and behavioural consequences. However, as with many adaptive physiological processes, chronic overactivation has deleterious consequences (Amir et al., 1980).
What role glucocorticoids play in this remains unclear. Although it is possible that they play a mediating role (Geraghty et al., 2015; Ralph et al., 2016), the consensus is either that they are an indirect by-product of stress (mainly because the primary function of cortisol is energy homeostasis) (Wagenmaker et al., 2009) or that they themselves trigger the endorphin system, thereby indirectly instigating infertility (Ayrout et al., 2019). Maeda and Tsukamura (2006) and Wagenmaker et al. (2009) provide experimental evidence that glucosteroids protect the LH surge independently of cortisol titres when stress has suppressed the GNRH surge. In humans, endorphins are known to suppress the release of cortisol through a noradrenergic pathway (Howlett and Rees, 1986). Stress has the same effect in males (Kirby et al., 2009), though this is less likely to be reflected in conception rates, and hence population dynamics and the risk of group extinction, since only one male is needed to fertilise many females.
Starvation can trigger the endorphin system (in response either to the pain caused by hunger pangs or to the physiological stresses that hunger causes), thereby precipitating infertility in mammals (sheep: Dobson et al., 2012; pigs: Clarke, 2014). However, it appears to be the hypothalamic-pituitary-adrenal (HPA) pathway that regulates this, rather than nutrition per se (Kalra and Kalra, 1996; Schwartz and Seeley, 1997). In other words, the same endorphin→HPA pathway is involved in both social and ecological routes, perhaps explaining why the effects of one are easily mistaken for the other.
The second possible route is via the effects of stress on implantation or early foetal development. There is experimental and clinical evidence to suggest that stress can affect post-conception processes (Arck, 2001). In sheep, stress is known to cause pregnant females to abort (Howarth and Hawk, 1968) and, in rats, even the stress of being handled can result in reduced litters sizes through foetal resorption (Geraghty et al., 2015). It has been estimated that 34% of all cases of functional infertility in humans (i.e., where there is no congenital or anatomical cause) is due to the effects of stress (Berga and Loucks, 2005). In placental mammals generally, successful implantation is only possible if inflammation due to the conceptus implanting can be suppressed. Failure to do so results in resorption or abortion of the conceptus or, in the limit, a marsupial-like form of gestation. Glucocorticoids play an important role in suppressing this natural rejection response by the immune system (Arck, 2001).
It is natural to assume that this ought to be an easy problem to solve through selection. However, most biological processes are not simple cause-effect mechanisms that can be adjusted in isolation. They invariably form part of a complex system with feedback loops: altering one inevitably has consequences elsewhere in the system. One important function of the endorphin-HPA-ovulation inhibitory mechanism is to impose lactational amenorrhoea so as to prevent the female becoming pregnant again while bearing the burden of lactating for the previous infant (a particular problem for primates with their long reproductive cycles and heavy investment in lactation). Since the costs of lactation are very high (both maternal and infant mortality are demonstrably higher if successive infants are born too close together: red deer: Albon et al., 1983; Clutton-Brock et al., 1983; humans: Blurton Jones, 1986; Borgerhoff Mulder, 1989; Nath et al., 1994; Lindstrom and Berhanu, 2000; Fotso et al., 2013; Houle et al., 2013; Kozuki and Walker, 2013), this is probably one of those constraints that cannot easily be solved by genetic tinkering with the mechanism itself without incurring even more serious downstream consequences. Instead, it may have been more effective to manage the problem behaviourally.
Managing Fertility Decline
The second issue to consider is the why some species exhibit a simple negative relationship between female number and fertility whereas others have a quadratic relationship created by a positive effect of group size on fertility such that the negative effect of female cohort size is deferred. Figures 2–5 suggest that, in the first case, fertility is maximised when females live singly (irrespective of the number of males with them) whereas, in the second case, fertility is maximised at some value of female cohort (and hence overall group) size that is significantly larger than can be achieved by the first group. The steepness of the relationship with fertility is typically such that, all else equal, group size is limited to 5–7 females. Since, at least in primates, adult females consistently make up 30% of total group size (Dunbar et al., 2018a,b), this effectively limits groups to 15–20 individuals. If females need to live in groups larger than this in order to gain an ecological benefit, then they must first find a way of deferring the fertility decline so that it occurs at larger group sizes.
Figure 1 and Table 2 suggest that there are two ways mammals solve this problem. One is to adopt a fission-fusion form of sociality; the other is to evolve bonded relationships. The first defuses the stresses by allowing females to forage in smaller groups while making it possible for large groups to form on the few occasions when these are needed. The second enables females to form coalitions that buffer them against the stresses created by living permanently with other females, thereby allowing the community to forage as a single, stable group.
Because it is not necessary to know who individual herd members are, the first strategy (the formation of casual herds, or aggregations) is the easier to achieve since it does not require any specialised social or cognitive skills. At worst, simple association learning of whom to avoid is all that is required, and, since herd membership is inconsistent over time, this is probably best learned anew each time a herd forms. In such cases, herds naturally form when predation risk is momentarily high, but drift apart once the crisis has passed. Similarly, in cases where herds form on a rich resource patch, they will disperse as soon as food intake falls below some threshold just as optimal foraging theory predicts (Krause and Ruxton, 2002). In those species that forage in herds, groups readily fragment when differences in individuals’ activity scheduling cause their activity cycles to become desynchronised (Ruckstuhl and Kokko, 2002; Ruckstuhl and Neuhaus, 2002; Dunbar and Shi, 2008; King and Cowlishaw, 2009). The disadvantage of this solution is that an individual runs a significant risk of being on its own (or in too small a group) on the one critical occasion when an external threat (a predator or a rival group) manifests itself.
In contrast, bonded groups (stable congregations) have the advantage that the individual’s sources of support against external threats are always present and so can be guaranteed to be there on the unpredictable occasions when it really matters. There is considerable evidence that bonded relationships (“friendships”: Silk, 2002; Dunbar and Shultz, 2010; Massen et al., 2010) also offer significant additional fitness benefits. Female baboons that have more grooming partners (i.e., allies) experience less harassment (Dunbar, 2018a), and have lower cortisol titres (Crockford et al., 2008; Wittig et al., 2008), higher wound healing (Archie et al., 2014) and lower infection rates (Balasubramaniam et al., 2016) and live longer (Silk et al., 2003, 2009, 2010; Cheney et al., 2016), and in addition produce more offspring that in turn have higher survival rates. Similar results have been reported for chimpanzees (Wittig et al., 2016), macaques (Young et al., 2014; McCowan et al., 2016; Brent et al., 2017), feral horses (Cameron et al., 2009; Nuñez et al., 2015) and dolphins (Frère et al., 2010), as well as humans (for whom there is a substantial epidemiological literature demonstrating very significant effects of the number of close friends on both psychological and physical health and wellbeing, as well as longevity: Holt-Lunstad et al., 2010; Dunbar, 2018b; Santini et al., 2020).
The potential role of protective alliances based on bonded relationships raises the question as to whether the negative effects of female numbers on fertility is due solely to agonistic interactions involving only a female’s immediate neighbours (the members of her social or grooming subgroup) or to more general disturbance effects due to the total number of females in the group (in effect, a crowding effect, reflecting the fact that fights or squabbles elsewhere in the group stress everyone). The first implies that group size (or, in this case, female group size) itself is irrelevant (with some other factor setting the limit on group size). Supplementary Figure 6 suggests that a localised effect is unlikely to be the answer: the slope coefficient for the female parameter in the multiple regression rises to an asymptotic value close to zero as female cohort size increases across genera. More importantly, the genera on the right hand side of Supplementary Figure 6 are precisely those with bonded social groups that provide females with alliances that buffer them against the costs of living in a large group.
Bonded groups come at a considerable cost: individuals (especially females) cannot easily move from one group to another because entry by strangers is often aggressively resisted once bonded relationships have evolved (Dunbar, 1984; Payne et al., 2003; Kahlenberg et al., 2008; Teichroeb et al., 2009; Pusey and Schroepfer-Walker, 2013). While species that live in fission-fusion social systems (e.g., most herding bovids and cervids) can dissipate the stresses of group-living relatively easily by facultatively adjusting group (or herd) size on a day-to-day basis, bonded groups cannot shed individuals as soon as the group exceeds optimum size. They can only do so by fission, and then only providing the smaller subgroup created by fission exceeds the minimum size set by local habitat predation risk (Dunbar et al., 2009, 2018a; Dunbar and MacCarron, 2019). Smaller groupings will likely suffer from higher stress levels due to elevated predation risk as well as increased likelihood of being displaced by larger conspecific groups. As a result, group size oscillates within a range around the target value, forcing the females, in particular, to live for some periods of time in groups that are less than optimal for them before the group manages to achieve a size at which it can safely fission (Dunbar et al., 2009, 2018a; Dunbar and MacCarron, 2019).
Figure 10 illustrates the point with the primate data. The differences in group size across the four categories in Figure 10 are significant (F2,19 = 6.69, p = 0.006), with significant independent and equal effects of both bondedness (F1,19 = 5.07, p = 0.036, η2 = 0.211) and fission-fusion sociality (F1,19 = 6.82, p = 0.017, η2 = 0.264). It seems that when the ancestral state is small unbonded groups, there are two equally good options for increasing group size: adopting a form of fission-fusion sociality that allows the fertility costs to be dissipated by spatial segregation or forming bonded groups that allow the costs to be deferred through protective coalitions. Once bonded groups have evolved, however, it is possible to increase group size still further by exploiting a fission-fusion structure based around bonded subgroups.
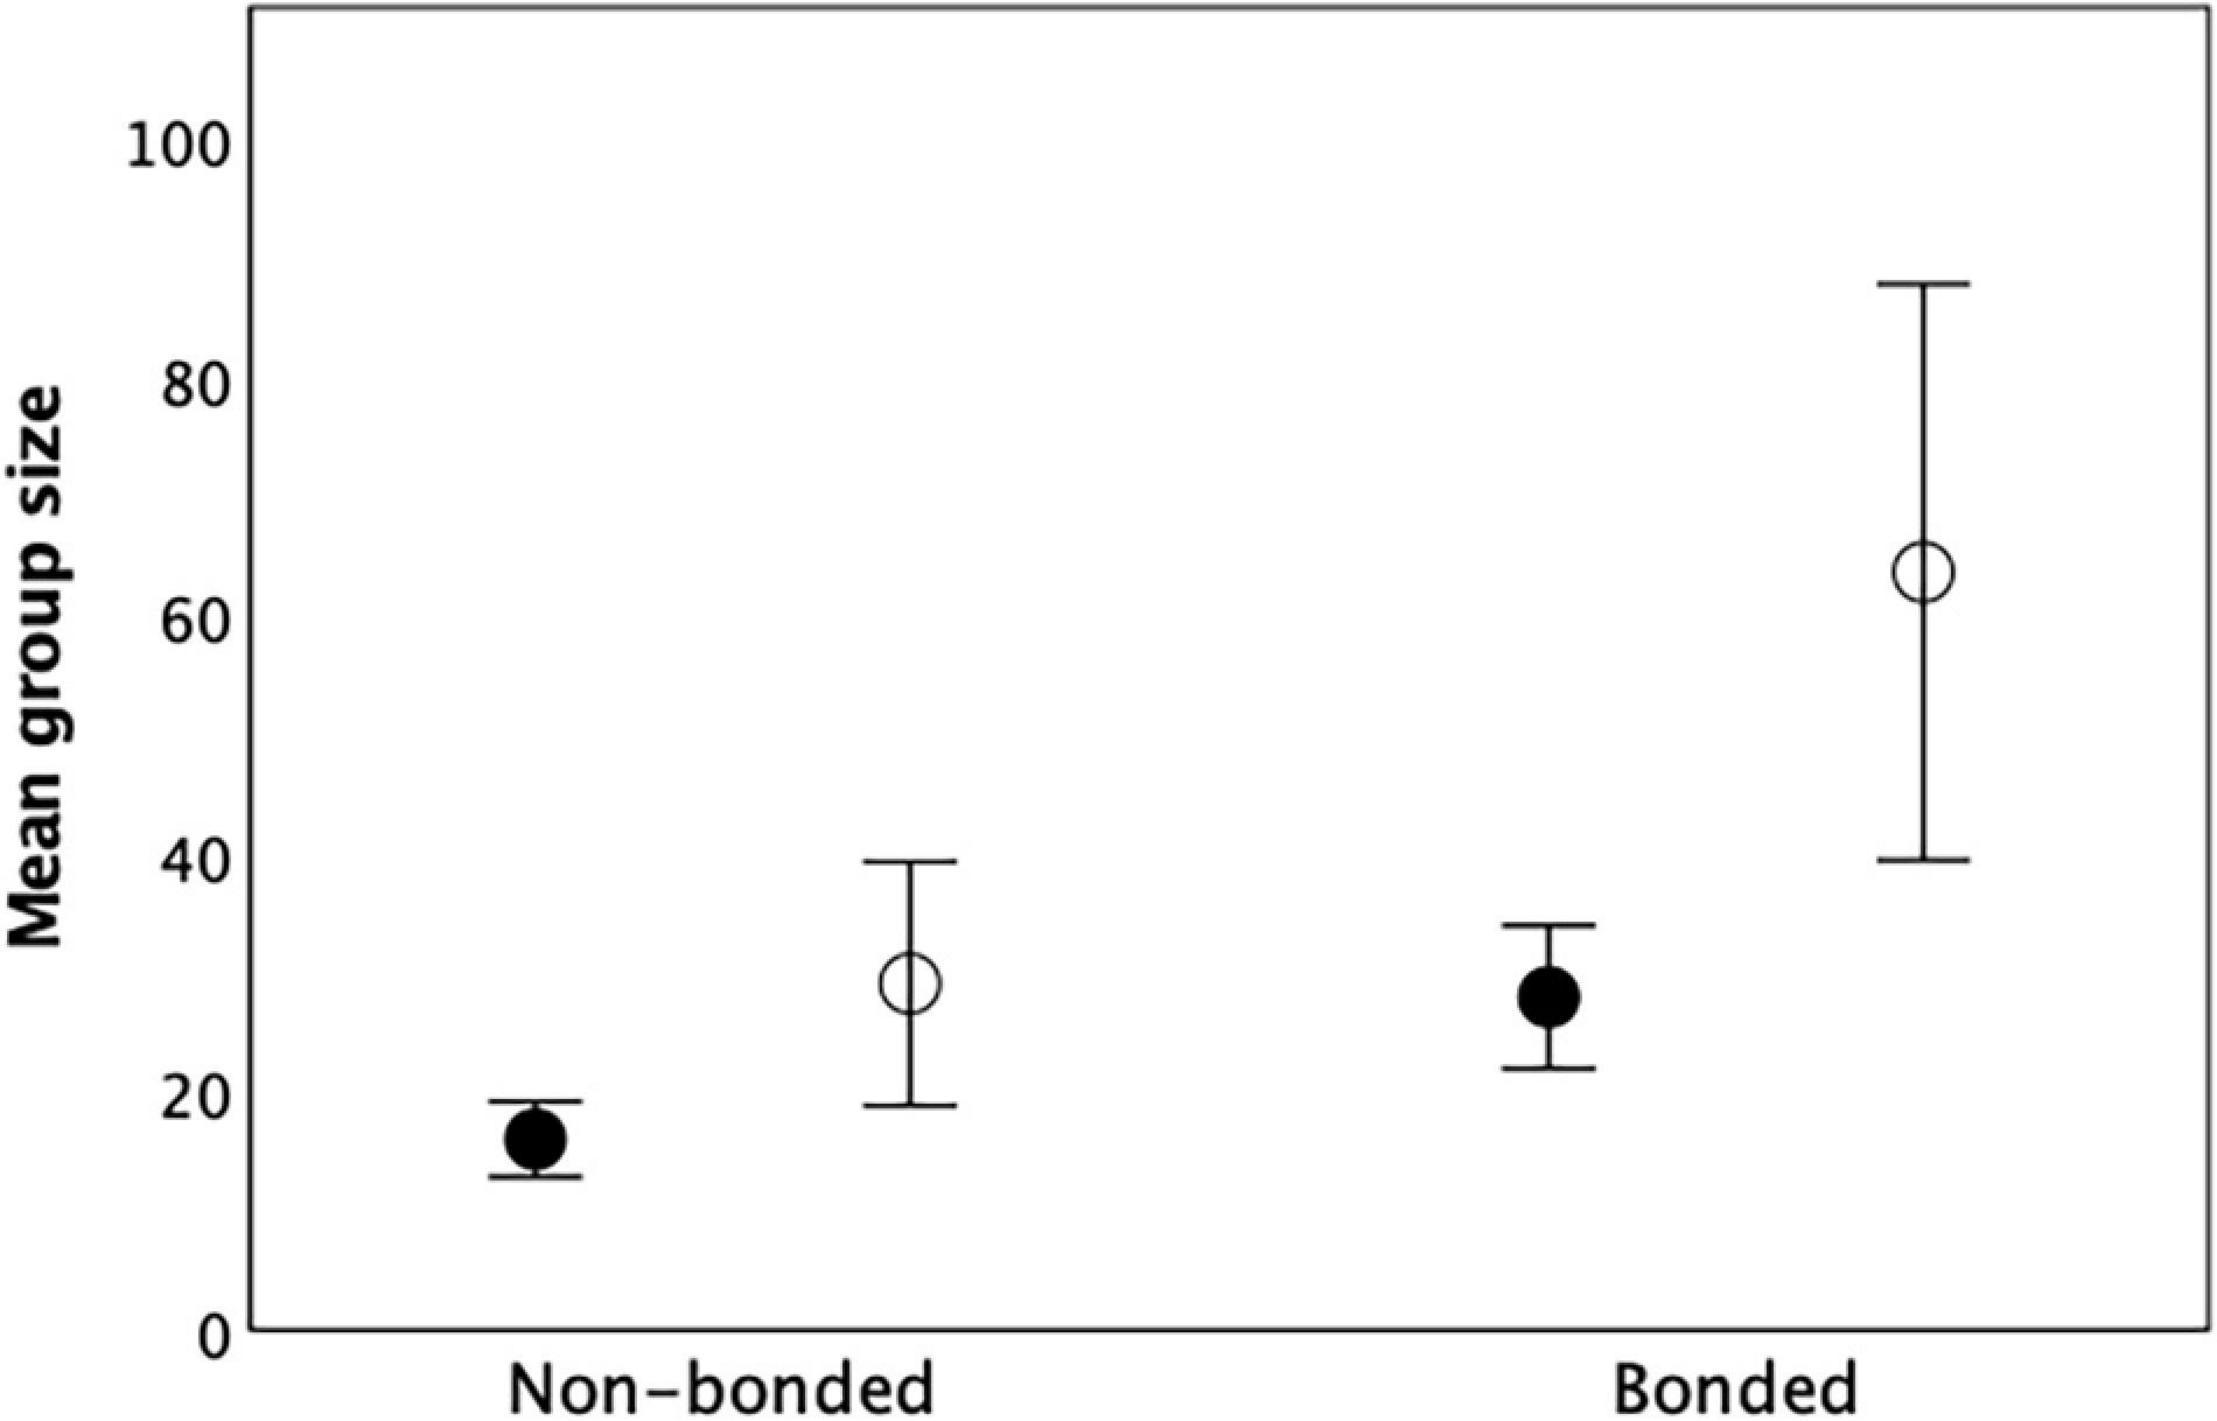
Figure 10. Mean (± 1se) group size for 26 primate genera as a function of whether the genus has bonded or unbonded social groups and whether (unfilled symbols) or not (filled symbols) these groups have fission-fusion capability. Source: Supplementary Dataset 5.
The behavioural mechanisms needed to create bonded groups so as to defer the infertility trap usually involve some form of social grooming or close physical contact. Bonded relationships of this kind are time consuming to maintain, accounting for up to 20% of an individual’s daily time budget in the most social species of primates (Dunbar, 1998; Lehmann et al., 2007b; Sutcliffe et al., 2012). In addition, managing many social relationships simultaneously is cognitively demanding (Dunbar and Shultz, 2017, 2020, 2021). Not only is memory for individual group members required, but, far more importantly, animals need to be able to titrate relative status along two or more dimensions simultaneously (e.g., rank versus kinship: Cheney and Seyfarth, 1999; Bergman et al., 2003; Schino et al., 2006), as well as factor in the consequences of their actions for third party relationships (whether threatening B might elicit a response from B’s ally C: Datta, 1983; Silk, 1999; Borgeaud et al., 2013). These depend on sophisticated metacognitive abilities, such as mentalising skills that allow animals to understand others’ intentions (Devaine et al., 2017).
These social cognitive abilities are significantly more costly in neural processing terms than conventional causal reasoning and memory processes (Powell et al., 2010; Lewis et al., 2017). They also require a large dedicated neural network (the combined mentalising/default mode neural network, comprising units in the frontal, parietal and temporal lobes, plus the limbic system: Sallet et al., 2013; Mars et al., 2016; Spreng et al., 2020) as well as specific brain regions such as the frontal pole (Brodmann Area 10) that are only found in anthropoid primates (Passingham and Wise, 2012). Neuroimaging studies of both humans (Bickart et al., 2011, 2012; Lewis et al., 2011; Kanai et al., 2012; Powell et al., 2012; von der Heide et al., 2014; Hampton et al., 2016; Sliwa and Freiwald, 2017; Krol et al., 2018; Kwak et al., 2018; Noonan et al., 2018; Spagna et al., 2018; Kiesow et al., 2020) and anthropoid primates (Sallet et al., 2011; Meguerditchian et al., 2020) indicate that the size of an individuals’ personal social network (or living group) correlates with the volume of its mentalising and default mode networks and their associated white matter tracts.
In addition, species need mechanisms that will ensure that groups stay together during the day. This is not a trivial problem, as is indicated by the ease with which ungulate herds disperse during the course of foraging. Maintaining the integrity of groups depends on the capacity to inhibit prepotent responses so that individuals are willing to rest rather than feed when others want to rest, and feed rather than rest when others want to feed. The ability to inhibit prepotent responses (MacLean et al., 2014; Dunbar and Shultz, 2020, 2021) is crucial if synchronised time budgets are to be maintained (King and Cowlishaw, 2009). In some Old World monkeys, coordination during daily foraging is maintained by behaviours that allow subgroups to agree on a direction of travel or a geographical point at which the group will converge later in case subgroups become completely detached during foraging (e.g., Papio hamadryas: Sigg and Stolba, 1981). In such cases, individuals often make explicit bids, or suggestions, about the direction of group travel (usually signalled by specific behaviours), with others then ‘voting’ on their preferences in order to arrive at a consensus (Sigg and Stolba, 1981; Sueur and Petit, 2010; Sueur et al., 2011). These kinds of signals depend on animals being able to infer the intentions of the signaller and interpret the meaning or significance (“go to waterhole X not waterhole Y”) of a behavioural signal (i.e., mentalising capacities).
Both kinds of cognitive ability increase across primate taxa as a function of group (and brain) size (Dunbar and Shultz, 2021).
Discussion
We have shown that, in mammals generally, fertility declines as the number of reproductive females in the group increases, but that in some taxa a trade off between the benefits of living in groups and these costs gives rise to a ∩-shaped relationship.
We argue that the negative relationship between fertility and number of females is most likely due to social stress created by female-female interactions and has little to do with access to food per se. All else equal, the steepness of the negative fertility effect sets a low limit on the size of group for mammals; this limits the size of groups to 5–7 reproductive females, which in turn sets an upper limit to total group size of a ∼15 individuals. In such cases, females would always do best to live alone (with or without offspring and adult males). This seems to have been the ancestral condition for primates, and perhaps mammals in general (Müller and Thalmann, 2000; Shultz et al., 2011). However, this necessarily restricts females to living in low predation-risk habitats. Indeed, when primates switch from living in large groups to pairbonded monogamy (Shultz et al., 2011), it invariably seems to be associated with occupying low predation-risk niches (e.g., gibbons occupying a terminal branch niche).
If it is advantageous for a species to invade a high-risk habitat because of the foraging benefits these have to offer (Cowlishaw, 1997), then the only way this can be done is by finding ways to avoid the infertility trap. The options seem to be to adopt a form of fission-fusion sociality (a neurologically cheap behavioural solution) or to form bonded social groups (a neurologically expensive cognitive strategy that incurs additional costs due to increased foraging costs). Both strategies allow animals to live in larger groups (Figure 10), but they come with very different costs and benefits.
By combining bonded subgroups with a form of modular (or molecular) fission-fusion (Aureli et al., 2008), Theropithecus and Papio hamadryas seem to have been able to increase the sizes of their groupings significantly beyond those possible for species that have bonded groups (Figures 1, 10). To be able to do this, the two species have had to evolve an unusually radical form of sub-structuring in which groups of females attach themselves to a male who, in effect, acts as a “hired gun” (Mesnick, 1997; Wilson and Mesnick, 1997). The social dynamics that underpin the formation and stability of these subgroups is very different in the two species (Dunbar and MacCarron, 2019), but the functional consequences are the same. In both cases, it allows the females to form small, stable, semi-independent groups that can operate a fission-fusion herd-like system that is very flexible in its response to environmental conditions. Although no satisfactory explanation has ever been given for these two species’ unique social systems, it is conspicuous that both live in habitats that are unusually predator-risky because they lack the usual refuges (tall trees) that primates rely on to escape from predators (Dunbar and MacCarron, 2019). Other examples of species that exploit bondedness with a fission-fusion social system so as to increase group size include chimpanzees, elephants and dolphins. All share the distinction of having brains that are both absolutely and relatively much larger than is typical even for a large-bodied mammal (Dunbar and Shultz, 2021).
The evolution of bonded sociality comes at a significant cost in terms of the time demands of social bonding (Dunbar et al., 2009), which no doubt explains why this form of sociality is so rare in mammals (Sutcliffe et al., 2016). One constraint in this respect is the time costs associated with some diets. Folivores, for example, are obliged to devote significant quantities of time to resting in order to allow gut fermentation to occur because any form of activity suppresses the microbial activity responsible for fermentation (van Soest, 1994). This significantly reduces the time available for social bonding and directly limits group size as a result (Korstjens and Dunbar, 2007). Much may, therefore, depend on whether a species can switch to a dietary category (e.g., fruits) that allows higher nutrient throughput so as to minimise food processing time. Precisely such a transition has been documented in the African colobines: the more frugivorous Procolobus live in larger groups than the closely related folivorous Colobus, and the two species’ social systems can be generated simply by switching the equations that govern foraging time (Korstjens and Dunbar, 2007).
In summary, we argue that the size and structure of mammalian social groups can best be understood as a tradeoff between the demands of external threats and demography-dependent infertility effects. We argue that, because of constraints imposed by mammalian reproductive endocrinology, the default condition is that fertility is a simple negative function of the number of cohabiting females; females would do best to live on their own, but if they need to form groups this will severely limit the size of their social groups. If environmental conditions require that they live in larger groups, they can only do so if they can find behavioural solutions that buffer them against these costs. Most mammals seem to do this either by a cognitively undemanding strategy (fission-fusion sociality) or by a cognitively expensive one (bonded sociality based on female-female coalitions). The only alternative is to avoid habitats that make such demands. Our focus has been on mammals, because the mechanism we highlight is a consequence of the particular way in which mammalian reproductive endocrinology is arranged so as to manage lactational amenorrhea (which we take to be a uniquely mammalian phenomenon). It is not impossible that something similar occurs in birds or fishes: we leave that for others to pursue. There is some evidence in marine fish for density-dependent effects on fertility that are independent of environmental conditions (e.g., Samhouri, 2009; Forrester et al., 2011), but what evidence there is for birds perhaps suggests that fertility is more directly dependent on environmental quality and direct density-dependent effects on foraging success rather than on any social parameters (e.g., seabirds: Tavecchia et al., 2007), perhaps reflecting the particular foraging costs incurred by avian species.
Data Availability Statement
The original contributions presented in the study are included in the article/Supplementary Material, further inquiries can be directed to the corresponding author/s.
Ethics Statement
Ethical review and approval was not required for the animal study because the data are all third-party archival data from the published literature.
Author Contributions
Both authors listed have made a substantial, direct and intellectual contribution to the work, and approved it for publication.
Funding
SS is supported by a Royal Society University Research Fellowship (UF160725).
Conflict of Interest
The authors declare that the research was conducted in the absence of any commercial or financial relationships that could be construed as a potential conflict of interest.
Publisher’s Note
All claims expressed in this article are solely those of the authors and do not necessarily represent those of their affiliated organizations, or those of the publisher, the editors and the reviewers. Any product that may be evaluated in this article, or claim that may be made by its manufacturer, is not guaranteed or endorsed by the publisher.
Supplementary Material
The Supplementary Material for this article can be found online at: https://www.frontiersin.org/articles/10.3389/fevo.2021.634664/full#supplementary-material
References
Abbott, D. H. (1984). Behavioral and physiological suppression of fertility in subordinate marmoset monkeys. Am. J. Primatol. 6, 169–186.
Abbott, D. H., Keverne, E. B., Moore, G. F., and Yodyingyuad, U. (1984). Social suppression of reproduction in subordinate talapoin monkeys, Miopithecus talapoin. Int. J. Primatol. 5, 318–318.
Abbott, D. H., McNeilly, A. S., Lunn, S. F., Hulme, M. J., and Burden, F. J. (1981). Inhibition of ovarian function in subordinate female marmoset monkeys (Callithrix jacchus jacchus). J. Reprod. Fert. 63, 335–345. doi: 10.1530/jrf.0.0630335
Adamczak, V., and Dunbar, R. I. M. (2008). Variation in the mating system of oribis and their ecological determinants. Afr. J. Ecol. 45, 197–206.
Albon, S. D., Mitchell, B., and Staines, B. W. (1983). Fertility and body weight in female red deer: a density-dependent relationship. J. Anim. Ecol. 52, 969–980.
Allainé, D. (2000). Sociality, mating system and reproductive skew in marmots: evidence and hypotheses. Behav. Process. 51, 21–34. doi: 10.1016/s0376-6357(00)00116-9
Altmann, J., and Alberts, S. C. (2003). Variability in reproductive success viewed from a life-history perspective in baboons. Am. J. Hum. Biol. 15, 401–409. doi: 10.1002/ajhb.10157
Amir, S., Brown, Z. W., and Amit, Z. (1980). The role of endorphins in stress: evidence and speculations. Neurosci. Biobehav. Rev. 4, 77–86.
An, Y., Sun, Z., Li, L., Zhang, Y., and Ji, H. (2013). Relationship between psychological stress and reproductive outcome in women undergoing in vitro fertilization treatment: psychological and neurohormonal assessment. J. Assist. Reprod. Genet. 30, 35–41.
Andersen, R., and Linnell, J. D. C. (1998). Ecological correlates of mortality of roe deer fawns in a predator-free environment. Can. J. Zool. 76, 1217–1225.
Archie, E. A., Tung, J., Clark, M., Altmann, J., and Alberts, S. C. (2014). Social affiliation matters: both same-sex and opposite-sex relationships predict survival in wild female baboons. Proc. R. Soc. Lond. 281B, 20141261. doi: 10.1098/rspb.2014.1261
Arck, P. C. (2001). Stress and pregnancy loss: role of immune mediators, hormones and neurotransmitters. Am. J. Reprod. Immunol. 46, 117–123. doi: 10.1111/j.8755-8920.2001.460201.x
Arends, J. C., Cheung, M. Y. C., Barrack, M. T., and Nattiv, A. (2012). Restoration of menses with nonpharmacologic therapy in college athletes with menstrual disturbances: a 5-year retrospective study. Int. J. Sport Nutr. Exercise Metab. 22, 98–108. doi: 10.1123/ijsnem.22.2.98
Ashton, B. J., Kennedy, P., and Radford, A. N. (2020). Interactions with conspecific outsiders as drivers of cognitive evolution. Nat. Commun. 11:4937.
Aureli, F., Schaffner, C., Boesch, C., Bearder, S., Call, J., Chapman, A., et al. (2008). Fission-fusion dynamics: new research frameworks. Curr. Anthropol. 49, 627–654. doi: 10.1038/s41598-020-72999-0
Ayrout, M., Le Billan, F., Grange-Messent, V., Mhaouty-Kodja, S., Lombès, M., and Chauvin, S. (2019). Glucocorticoids stimulate hypothalamic dynorphin expression accounting for stress-induced impairment of GnRH secretion during preovulatory period. Psychoneuroendocrinology 99, 47–56. doi: 10.1016/j.psyneuen.2018.08.034
Balasubramaniam, K., Beisner, B., Vandeleest, J., Atwill, E., and McCowan, B. (2016). Social buffering and contact transmission: network connections have beneficial and detrimental effects on Shigella infection risk among captive rhesus macaques. PeerJ 4:e2630. doi: 10.7717/peerj.2630
Bean, L. L., and Mineau, G. P. (1986). The polygyny-fertility hypothesis: a reevaluation. Popul. Stud. 40, 67–81. doi: 10.1080/0032472031000141846
Behringer, V., Deschner, T., Möstli, E., Selzer, D., and Hohmann, G. (2012). Stress effects salivary alpha-amylase activity in bonobos. Physiol. Behav. 105, 476–482.
Bennett, N. C. (1994). Reproductive suppression in social Cryptomys damarensis colonies e a lifetime of socially-induced sterility in males and females (Rodentia: Bathyergidae). J. Zool. 234, 25–39.
Berga, S. L., and Loucks, T. L. (2005). The diagnosis and treatment of stress-induced anovulation. Miner. Ginecol. 57, 45–54.
Bergman, T. J., Beehner, J. C., Cheney, D. L., and Seyfarth, R. M. (2003). Hierarchical classification by rank and kinship in baboons. Science 302, 1234–1236. doi: 10.1126/science.1087513
Bickart, K. C., Hollenbeck, M. C., Barrett, L. F., and Dickerson, B. C. (2012). Intrinsic amygdala–cortical functional connectivity predicts social network size in humans. J. Neurosci. 32, 14729–14741.
Bickart, K. C., Wright, C. I., Dautoff, R. J., Dickerson, B. C., and Feldman Barrett, L. (2011). Amygdala volume and social network size in humans. Nat. Neurosci. 14, 163–164.
Blurton Jones, N. (1986). Bushman birth spacing: a test for optimal interbirth intervals. Ethol. Sociobiol. 7, 91–105.
Borgeaud, C., van de Waal, E., and Bshary, R. (2013). Third-party ranks knowledge in wild vervet monkeys (Chlorocebus aethiops pygerythrus). PLoS One 8:e58562. doi: 10.1371/journal.pone.0058562
Borgerhoff Mulder, M. (1989). Marital status and reproductive performance in Kipsigis women: re-evaluating the polygyny-fertility hypothesis. Popul. Stud. 43, 285–304.
Borowik, T., and Jwdrzejewska, B. (2018). Europe-wide consistency in density-dependence of red deer (Cervus elaphus) fertility. Mamm. Biol. 89, 95–99.
Borries, C., Larney, L., Lu, A., Ossi, K., and Koenig, A. (2008). Costs of group size: lower developmental and reproductive rates in larger groups of leaf monkeys. Behav. Ecol. 19, 1186–1191.
Bowman, L. A., Dilley, S., and Keverne, E. B. (1978). Suppression of oestrogen-induced LH surges by social subordination in talapoin monkeys. Nature 275, 56–58. doi: 10.1038/275056a0
Brent, L. J., Ruiz-Lambides, A., and Platt, M. L. (2017). Family network size and survival across the lifespan of female macaques. Proc. R. Soc. Lond. 284B: 20170515. doi: 10.1098/rspb.2017.0515
Bullen, B. A., Skrinar, G. S., Beitins, I. Z., von Mering, G., Turnbull, B. A., and McArthur, J. W. (1985). Induction of menstrual disorders by strenuous exercise in untrained women. N. Engl. J. Med. 312, 1349–1353. doi: 10.1056/NEJM198505233122103
Calhim, S., Shi, J., and Dunbar, R. I. M. (2006). Sexual segregation among feral goats: testing between alternative hypotheses. An. Behav. 72, 31–41.
Cameron, E. Z., Setsaas, T. H., and Linklater, W. L. (2009). Social bonds between unrelated females increase reproductive success in feral horses. Proc. Natl. Acad. Sci. U.S.A. 106, 13850–13853. doi: 10.1073/pnas.0900639106
Chapman, C. A. (1990). Ecological constraints on group size in three species of neotropical primates. Folia Primatol. 55, 1–9. doi: 10.1159/000156492
Cheney, D. L., and Seyfarth, R. M. (1999). Recognition of other individuals’ social relationships by female baboons. Anim. Behav. 58, 67–75.
Cheney, D. L., and Wrangham, R. W. (1987). “Predation,” in Primate Societies, eds B. Smuts, D. Cheney, R. Seyfarth, R. W. Wrangham, and T. Struhsaker (Chicago, IL: Chicago University Press), 227–239.
Cheney, D. L., Silk, J. B., and Seyfarth, R. M. (2016). Network connections, dyadic bonds and fitness in wild female baboons. R. Soc. Open Sci. 3:160255. doi: 10.1098/rsos.160255
Clarke, I. J. (2014). Interface between metabolic balance and reproduction in ruminants: focus on the hypothalamus and pituitary. Horm. Behav. 66, 15–40. doi: 10.1016/j.yhbeh.2014.02.005
Clayton, L., and Macdonald, D. W. (1999). Social organization of the babirusa (Babyrousa babyrussa) and their use of salt licks in Sulawesi Indonesia. J. Mammal. 80, 1147–1157.
Clutton-Brock, T. H., Guinness, F. E., and Albon, S. D. (1983). The costs of reproduction to red deer hinds. J. Anim. Ecol. 52, 367–384. doi: 10.1095/biolreprod.102.004507
Cowlishaw, G. (1994). Vulnerability to predation in baboon populations. Behaviour 131, 293–304. doi: 10.1002/ajp.22997
Cowlishaw, G. (1997). Trade-offs between foraging and predation risk determine habitat use in a desert baboon population. Anim. Behav. 53, 667–686.
Creel, S., Christianson, D., Liley, S., and Winnie, J. A. (2007). Predation risk affects reproductive physiology and demography of elk. Science 315, 960–960.
Creel, S., Creel, N., Wildt, D. E., and Monfort, S. L. (1992). Behavioural and endocrine mechanisms of reproductive suppression in Serengeti dwarf mongooses. Anim. Behav. 43, 231–245.
Creel, S., Dantzer, B., Goymann, W., and Rubenstein, D. R. (2013). The ecology of stress: effects of the social environment. Funct. Ecol. 27, 66–80.
Crockford, C., Wittig, R. M., Whitten, P. L., Seyfarth, R. M., and Cheney, D. L. (2008). Social stressors and coping mechanisms in wild female baboons (Papio hamadryas ursinus). Horm. Behav. 53, 254–265. doi: 10.1016/j.yhbeh.2007.10.007
Datta, S. (1983). “Relative power and the acquisition of rank,” in Primate Social Relationships, ed. R. A. Hinde (Oxford: Blackwells), 103–112.
De Luca, D. W., and Ginsberg, J. R. (2001). Dominance, reproduction and survival in banded mongooses: towards an egalitarian social system? Anim. Behav. 61, 17–30. doi: 10.1006/anbe.2000.1559
Devaine, M., San-Galli, A., Trapanese, C., Bardino, G., Hano, C., Saint Jalme, M., et al. (2017). Reading wild minds: a computational assay of theory of mind sophistication across seven primate species. PLoS Comput. Biol. 13:e1005833. doi: 10.1371/journal.pcbi.1005833
Digby, L. J., Ferrari, S. F., and Saltzman, W. (2007). “The role of competition in cooperatively breeding species,” in Primates in Perspective, eds C. Campbell, A. Fuentes, K. Mackinnon, S. K. Bearder, and S. K. Stumpf (New York, NY: Oxford University Press), 85–106.
Dobson, H., and Smith, R. F. (2000). What is stress, and how does it affect reproduction? Anim. Reprod. Sci. 60, 743–752.
Dobson, H., Fergani, C., Routly, J. E., and Smith, R. F. (2012). Effects of stress on reproduction in ewes. Anim. Reprod. Sci. 130, 135–140.
Downhower, J. F., and Armitage, K. B. (1971). The yellow-bellied marmot and the evolution of polygyny. Am. Nat. 105, 355–370.
Dunbar, R. I. M. (1980). Determinants and evolutionary consequences of dominance among female gelada baboons. Behav. Ecol. Sociobiol. 7, 253–265.
Dunbar, R. I. M. (1984). Reproductive Decisions: An Economic Analysis of Gelada Baboon Social Strategies. Princeton NJ: Princeton University Press.
Dunbar, R. I. M. (1998). “Theory of mind and the evolution of language,” in Approaches to the Evolution of Language, eds J. Hurford, M. Studdart-Kennedy, and C. Knight (Cambridge: Cambridge University Press), 92–110.
Dunbar, R. I. M. (2018a). Social structure as a strategy to mitigate the costs of group-living: a comparison of gelada and guereza monkeys. Anim. Behav. 136, 53–64. doi: 10.1016/j.anbehav.2017.12.005
Dunbar, R. I. M. (2019). Fertility as a constraint on group size in African great apes. Biol. J. Linnaean Soc. 129, 1–13.
Dunbar, R. I. M., and MacCarron, P. (2019). Group size as a trade-off between fertility and predation risk: implications for social evolution. J. Zool. 308, 9–15.
Dunbar, R. I. M., and Sharman, M. (1983). Female competition for access to males affects birth rate in baboons. Behav. Ecolol. Sociobiol. 13, 157–159.
Dunbar, R. I. M., and Shi, J. (2008). Sex differences in feeding activity results in sexual segregation of feral goats. Ethology 114, 444–451.
Dunbar, R. I. M., and Shi, J. (2013). Time as a constraint on the distribution of feral goats at high latitudes. Oikos 122, 403–410.
Dunbar, R. I. M., and Shultz, S. (2017). Why are there so many explanations for primate brain evolution? Philos. Trans. R. Soc. Lond. 244B:201602244.
Dunbar, R. I. M., and Shultz, S. (2020). The evolution of self-control. bioRxiv [Preprint]. bioRxiv/2020/354852,Google Scholar
Dunbar, R. I. M., and Shultz, S. (2021). Social complexity and the fractal structure of social groups in primate social evolution. Biol. Rev. 96, 1889–1906. doi: 10.1111/brv.12730
Dunbar, R. I. M., Cheyne, S., Lan, D., Korstjens, A., Lehmann, J., and Cowlishaw, G. (2019). Environment and time as constraints on the biogeographical distribution of gibbons. Am. J. Primatol. 81:e22940. doi: 10.1002/ajp.22940
Dunbar, R. I. M., Korstjens, A. H., and Lehmann, J. (2009). Time as an ecological constraint. Biol. Rev. 84, 413–429.
Dunbar, R. I. M., MacCarron, P., and Robertson, C. (2018a). Tradeoff between fertility and predation risk drives a geometric sequence in the pattern of group sizes in baboons. Biol. Lett. 14:20170700. doi: 10.1098/rsbl.2017.0700
Dunbar, R. I. M., MacCarron, P., and Shultz, S. (2018b). Primate social group sizes exhibit a regular scaling pattern with natural attractors. Biol. Lett. 14:20170490. doi: 10.1098/rsbl.2017.0490
Einarsson, S., Brandt, Y., Lundeheim, N., and Madej, A. (2008). Stress and its influence on reproduction in pigs: a review. Acta Vet. Scand. 50:48.
Ellison, P. T. (1990). Human ovarian function and reproductive ecology: new hypotheses. Am. Anthropol. 92, 933–952.
Engh, A. L., Beehner, J. C., Bergman, T. J., Whitten, P. L., Hoffmeier, R. R., Seyfarth, R. M., et al. (2006). Behavioural and hormonal responses to predation in female chacma baboons (Papio hamadryas ursinus). Proc. R. Soc. Lond. 273B, 707–712. doi: 10.1098/rspb.2005.3378
Euker, J. S., and Riegle, G. D. (1973). Effects of stress on pregnancy in the rat. J. Reprod. Fert. 34, 343–346.
Faulkes, C. G., Abbott, D. H., and Jarvis, J. U. M. (1990). Social suppression of ovarian cyclicity in captive and wild colonies of naked mole-rats, Heterocephalus glaber. J. Reprod. Fert. 88, 559–568. doi: 10.1530/jrf.0.0880559
Forrester, G., Harmon, L., Helyer, J., Holden, W., and Karis, R. (2011). Experimental evidence for density-dependent reproductive output in a coral reef fish. Popul. Ecol. 53, 155–163.
Fotso, J. C., Cleland, J., Mberu, B., Mutua, M., and Elungata, P. (2013). Birth spacing and child mortality: an analysis of prospective data from the Nairobi urban health and demographic surveillance system. J. Biosoc. Sci. 45, 779–798. doi: 10.1017/S0021932012000570
Frère, C. H., Krützen, M., Mann, J., Connor, R. C., Bejder, L., and Sherwin, W. B. (2010). Social and genetic interactions drive fitness variation in a free-living dolphin population. Proc. Natl. Acad. Sci. U.S.A. 107, 19949–19954.
Frisch, R. E. (1987). Body fat, menarche, fitness and fertility. Hum. Reprod. 2, 521–533. doi: 10.1093/oxfordjournals.humrep.a136582
Garcia, C., Lee, P. C., and Rosetta, L. (2006). Dominance and reproductive rates in captive female olive baboons, Papio anubis. Am. J. Phys. Anthropol. 131, 64–72. doi: 10.1002/ajpa.20405
Geraghty, A. C., Muroy, S. E., Zhao, S., Bentley, G. E., Kriegsfeld, L. J., and Kaufer, D. (2015). Knockdown of hypothalamic RFRP3 prevents chronic stress-induced infertility and embryo resorption. ELife 4:e04316. doi: 10.7554/eLife.04316
Gesquiere, L. R., Altmann, J., Archie, E. A., and Alberts, S. C. (2018). Interbirth intervals in wild baboons: Environmental predictors and hormonal correlates. Am. J. Phys. Anthropol. 166, 107–126. doi: 10.1002/ajpa.23407
Gordon, K., Hodgen, G. D., and Richardson, D. W. (1992). Postpartum lactational anovulation in a nonhuman primate (Macaca fascicularis): endogenous opiate mediation of suckling-induced hyperprolactinemia. J. Clin. Endocrinol. Metab. 75, 59–67. doi: 10.1210/jcem.75.1.1619032
Grueter, C. C. (2015). Home range overlap as a driver of intelligence in primates. Am. J. Primatol. 77, 418–424. doi: 10.1002/ajp.22357
Hampton, W. H., Unger, A., Von Der Heide, R. J., and Olson, I. R. (2016). Neural connections foster social connections: a diffusion-weighted imaging study of social networks. Soc. Cogn. Affect. Neurosci. 11, 721–727. doi: 10.1093/scan/nsv153
Harcourt, A. H., and Greenberg, J. (2001). Do gorilla females join males to avoid infanticide? A quantitative model. Anim. Behav. 62, 905–915.
Hill, R. A., and Dunbar, R. I. M. (1998). An evaluation of the roles of predation rate and predation risk as selective pressures on primate grouping behaviour. Behaviour 135, 411–430.
Hill, R. A., Lycett, J. E., and Dunbar, R. I. M. (2000). Ecological determinants of birth intervals in baboons. Behav. Ecol. 11, 560–564.
Holekamp, K. E., Smale, L., and Szykman, M. (1996). Rank and reproduction in the female spotted hyaena. J. Reprod. Fert. 108, 229–237.
Holt-Lunstad, J., Smith, T., and Bradley Layton, J. (2010). Social relationships and mortality risk: a metaanalytic review. PLoS Med. 7:e1000316. doi: 10.1371/journal.pmed.1000316
Houle, B., Stein, A., Kahn, K., Madhavan, S., Collinson, M., Tollman, S. M., et al. (2013). Household context and child mortality in rural South Africa: the effects of birth spacing, shared mortality, household composition and socio-economic status. Int. J. Epidemiol. 42, 1444–1454. doi: 10.1093/ije/dyt149
Howarth, B., and Hawk, H. W. (1968). Effect of hydrocortisone on embryonic survival in sheep. J. Anim. Sci. 27, 117–121.
Howlett, T. A., and Rees, L. H. (1986). Endogenous opioid peptides and hypothalamo-pituitary function. Ann. Rev. Physiol. 48, 527–536.
Huchard, E., and Cowlishaw, G. (2011). Female–female aggression around mating: an extra cost of sociality in a multimale primate society. Behav. Ecol. 22, 1003–1011.
Huck, U. W., Lisk, R. D., and McKay, M. V. (1988). Social dominance and reproductive success in pregnant and lactating golden hamsters (Mesocricetus auratus) under seminatural conditions. Physiol. Behav. 44, 313–319. doi: 10.1016/0031-9384(88)90031-5
Iwaniuk, A. N., Nelson, J. E., and Pellis, S. M. (2001). Do big-brained animals play more? Comparative analyses of play and relative brain size in mammals. J. Comp. Psychol. 115, 29–41. doi: 10.1037/0735-7036.115.1.29
Iwasa, T., Matsuzaki, T., Yano, K., and Irahara, M. (2017). Gonadotropin-inhibitory hormone plays roles in stress-induced reproductive dysfunction. Front. Endocrinol. 8:62. doi: 10.3389/fendo.2017.00062
Jarman, P. (1974). The social organisation of antelope in relation to their ecology. Behaviour 48, 215–267.
Ji, T., Wu, J.-J., He, Q.-Q., Xu, J.-J., Mace, R., and Tao, Y. (2013). Reproductive competition between females in the matrilineal Mosuo of southwestern China. Philos. Trans. R. Soc. Lond. 368B:20130081.
Kahlenberg, S. M., Thompson, M. E., Muller, M. N., and Wrangham, R. W. (2008). Immigration costs for female chimpanzees and male protection as an immigrant counterstrategy to intrasexual aggression. Anim. Behav. 76, 1497–1509.
Kalra, S. P., and Kalra, P. S. (1996). Nutritional infertility: the role of the interconnected hypothalamic neuropeptide Y–galanin–opioid network. Front. Neuroendocrinol. 17:371–401. doi: 10.1006/frne.1996.0010
Kanai, R., Bahrami, B., Roylance, R., and Rees, G. (2012). Online social network size is reflected in human brain structure. Proc. R. Soc. Lond. 279B, 1327–1334.
Kelley, J. L., Morrell, L. J., Inskip, C., Krause, J., and Croft, D. P. (2011). Predation risk shapes social networks in fission-fusion populations. PLoS One 6:e24280. doi: 10.1371/journal.pone.0024280
Kiesow, H., Dunbar, R. I. M., Kable, J. W., Kalenscher, T., Vogeley, K., Schilbach, L., et al. (2020). 10,000 social brains: sex differentiation in human brain anatomy. Sci. Adv. 6:eeaz1170. doi: 10.1126/sciadv.aaz1170
Kinahan, A. A., and Pillay, N. (2008). Dominance status influences female reproductive strategy in a territorial African rodent Rhabdomys pumilio. Behav. Ecol. Sociobiol. 62, 579–587.
King, A. J., and Cowlishaw, G. (2009). All together now: behavioural synchrony in baboons. Anim. Behav. 78, 1381–1387.
Kirby, E. D., Geraghty, A. C., Ubuka, T., Bentley, G. E., and Kaufer, D. (2009). Stress increases putative gonadotropin inhibitory hormone and decreases luteinizing hormone in male rats. Proc. Natl. Acad. Sci. U.S.A. 106, 11324–11329. doi: 10.1073/pnas.0901176106
Korstjens, A. H., and Dunbar, R. I. M. (2007). Time constraints limit group sizes and distribution in red and black-and-white colobus monkeys. Int. J. Primatol. 28, 551–575.
Korstjens, A. H., Lehmann, J., and Dunbar, R. I. M. (2018). Time constraints do not limit group size in arboreal guenons but do explain community size and distribution patterns. Int. J. Primatol. 39, 511–531.
Kozuki, N., and Walker, N. (2013). Exploring the association between short/long preceding birth intervals and child mortality: using reference birth interval children of the same mother as comparison. BMC Public Health 13:S6. doi: 10.1186/1471-2458-13-S3-S6
Krol, S. A., Meyer, M. L., Lieberman, M. D., and Bartz, J. A. (2018). Social working memory predicts social network size in humans. Adapt. Hum. Behav. Physiol. 4, 387–399.
Kwak, S., Joo, W.-T., Youm, Y., and Chey, J. (2018). Social brain volume is associated with in-degree social network size among older adults. Proc. R. Soc. Lond. 285B, 20172708. doi: 10.1098/rspb.2017.2708
Laatikainen, T. J. (1991). Corticotropin-releasing hormone and opioid peptides in reproduction and stress. Ann. Med. 23, 489–496.
Lacey, E. A. (2004). Sociality reduces individual direct fitness in a communally breeding rodent, the colonial tuco-tuco (Ctenomys sociabilis). Behav. Ecol. Sociobiol. 56, 449–457.
Lehmann, J., Korstjens, A. H., and Dunbar, R. I. M. (2007a). Fission-fusion social systems as a strategy for coping with ecological constraints: a primate case. Evol. Ecol. 21, 613–634.
Lehmann, J., Korstjens, A. H., and Dunbar, R. I. M. (2007b). Group size, grooming and social cohesion in primates. Anim. Behav. 74, 1617–1629.
Lewis, K. P. (2000). A comparative study of primate play behaviour: implications for the study of cognition. Folia Primatol. 71, 417–421. doi: 10.1159/000052740
Lewis, P. A., Birch, A., Hall, A., and Dunbar, R. I. M. (2017). Higher order intentionality tasks are cognitively more demanding. Soc. Cogn. Affect. Neurosci. 12, 1063–1071. doi: 10.1093/scan/nsx034
Lewis, P. A., Rezaie, R., Browne, R., Roberts, N., and Dunbar, R. I. M. (2011). Ventromedial prefrontal volume predicts understanding of others and social network size. NeuroImage 57, 1624–1629. doi: 10.1016/j.neuroimage.2011.05.030
Li, X. F., Knox, A. M. I., and O’Byrne, K. T. (2010). Corticotrophin-releasing factor and stress-induced inhibition of the gonadotrophin-releasing hormone pulse generator in the female. Brain Res. 1364, 153–163.
Lindstrom, D. P., and Berhanu, B. (2000). The effects of breastfeeding and birth spacing on infant and early childhood mortality in Ethiopia. Soc. Biol. 47, 1–17.
Lowen, C. B., and Dunbar, R. I. M. (1994). Territory size and defendability in primates. Behav. Ecol. Sociobiol. 35, 347–354.
Lutz, W., Testa, M. R., and Penn, D. J. (2006). Population density is a key factor in declining human fertility. Popul. Environ. 28, 69–81.
MacLean, E. L., Hare, B., Nunn, C. L., Addessi, E., Amici, F., Anderson, R. C., et al. (2014). The evolution of self-control. Proc. Natl. Acad. Sci. U.S.A. 111, E2140–E2148.
Maeda, K. I., and Tsukamura, H. (2006). The impact of stress on reproduction: are glucocorticoids inhibitory or protective to gonadotropin secretion? Endocrinology 147, 1085–1086.
Markham, A. C., Guesquiere, L. R., Alberts, S. C., and Altmann, J. (2015). Optimal group size in a highly social mammal. Proc. Natl. Acad. Sci. U.S.A. 112, 14882–14887.
Mars, R. B., Foxley, S., Verhagen, L., Jbabdi, S., Sallet, J., Noonan, M. P., et al. (2016). The extreme capsule fiber complex in humans and macaque monkeys: a comparative diffusion MRI tractography study. Brain Struct. Funct. 221, 4059–4071. doi: 10.1007/s00429-015-1146-0
Massen, J. J. M., Sterck, E. H. M., and de Vos, H. (2010). Close social associations in animals and humans: functions and mechanisms of friendship. Behaviour 147, 1379–1412.
McCowan, B., Beisner, B., Bliss-Moreau, E., Vandeleest, J., Jin, J., Hannibal, D., et al. (2016). Connections matter: social networks and lifespan health in primate translational models. Front. Psychol. 7:433. doi: 10.3389/fpsyg.2016.00433
McNeilly, A. S., Forsyth, I. A., and McNeilly, J. R. (1994). “Regulation of post-partum fertility in lactating mammals,” in Marshall’s Physiology of Reproduction, ed. G. E. Lamming (Berlin: Springer), 1037–1101.
Medill, S. A. (2018). Sociality of Sable Island horses: Population, Group, and Individual Interactions. Ph D. thesis. Saskatoon, SK: University of Saskatchewan.
Meguerditchian, A., Marie, D., Margiotoudi, K., Roth, M., Nazarian, B., Anton, J.-L., et al. (2020). Baboons (Papio anubis) living in larger social groups have bigger brains. Evol. Hum. Behav. 42, 30–34.
Mesnick, S. L. (1997). “Sexual alliances: evidence and evolutionary implications,” in Feminism and Evolutionary Biology, ed. P. A. Gowaty (London: Chapman & Hall), 207–260. doi: 10.1007/s12110-003-1015-z
Mitani, J. C., and Rodman, P. (1979). Territoriality: the relation of ranging pattern and home range size to defendability, with an analysis of territoriality among primate species. Behav. Ecol. Sociobiol. 5, 241–251.
Moehlman, P. D., and Hofer, H. (1997). “Cooperative breeding, reproductive suppression, and body mass in canids,” in Cooperative Breeding in Mammals, eds N. G. Solomon and J. A. French (Cambridge: Cambridge University Press), 76–128.
Molvar, E. M., and Bowyer, R. T. (1994). Costs and benefits of group living in a recently social ungulate: the Alaskan moose. J. Mammal. 75, 621–630.
Morris, W. F., Wiser, S. D., and Klepetka, B. (1992). Causes and consequences of spatial aggregation in the phytophagous beetle Altica tombacina. J. Anim. Ecol. 61, 49–58.
Mosser, A., and Packer, C. (2009). Group territoriality and the benefits of sociality in the African lion, Panthera leo. Anim. Behav. 78, 359–370.
Müller, A. E., and Thalmann, U. (2000). Origin and evolution of primate social organisation: a reconstruction. Biol. Rev. 75, 405–435.
Muller, M. N. (2002). “Agonistic relations among Kanyawara chimpanzees,” in Behavioural Diversity in Chimpanzees and Bonobos, eds C. Boesch, G. Hohmann, and L. Marchant (Cambridge: Cambridge University Press), 112–124.
Nath, D. C., Land, K. C., and Singh, K. K. (1994). Birth spacing, breastfeeding, and early child mortality in a traditional Indian society: a hazards model analysis. Soc. Biol. 41, 168–180. doi: 10.1080/19485565.1994.9988871
Nilsen, E. B., Linnell, J. D., and Andersen, R. (2004). Individual access to preferred habitat affects fitness components in female roe deer Capreolus capreolus. J. Anim. Ecol. 73, 44–50.
Noonan, M., Mars, R., Sallet, J., Dunbar, R. I. M., and Fellows, L. (2018). The structural and functional brain networks that support human social networks. Behav. Brain Res. 355, 12–23.
Nuñez, C. M., Adelman, J. S., and Rubenstein, D. I. (2015). Sociality increases juvenile survival after a catastrophic event in the feral horse (Equus caballus). Behav. Ecol. 26, 138–147.
Opie, K., Atkinson, Q., Dunbar, R. I. M., and Shultz, S. (2017). Infanticide still drives primate monogamy. Proc. Natl. Acad. Sci. U.S.A. 111, E1675. doi: 10.1073/pnas.1403165111
Parrish, J. K., Hamner, W. M., and Prewitt, C. T. (1997). “From individuals to aggregations: unifying properties, global framework, and the holy grails of congregation,” in Animal Groups in Three Dimensions, eds J. K. Parrish and W. M. Hamner (Cambridge: Cambridge University Press), 1–14.
Passingham, R. E., and Wise, S. P. (2012). The Neurobiology of the Prefrontal Cortex: Anatomy, Evolution and the Origin of Insight. Oxford: Oxford University Press.
Payne, H. F., Lawes, M. J., and Henzi, S. P. (2003). Fatal attack on an adult female Cercopithecus mitis erythrarchus: implications for female dispersal in female-bonded societies. Int. J. Primatol. 24, 1245–1250.
Pérez-Barbería, J., Shultz, S., and Dunbar, R. I. M. (2007). Evidence for intense coevolution of sociality and brain size in three orders of mammals. Evolution 61, 2811–2821. doi: 10.1111/j.1558-5646.2007.00229.x
Pettay, J. E., Lahdenper€a, M., Rotkirch, A., and Lummaa, V. (2016). Costly reproductive competition between co-resident females in humans. Behav. Ecol. 27, 1601–1608.
Pettorelli, N., Gaillard, J.-M., Van Laere, G., Duncan, P., Kjellander, P., Liberg, O., et al. (2002). Variation in adult body mass in roe deer: the effects of population density at birth and of habitat quality. Proc. R. Soc. Lond. 296B, 747–753. doi: 10.1098/rspb.2001.1791
Pierce, B. N., Hemsworth, P. H., Rivalland, E. T. A., Wagenmaker, E. R., Morrissey, A. D., Papargiris, M. M., et al. (2008). Psychosocial stress suppresses attractivity, proceptivity and pulsatile LH in the ewe. Horm. Behav. 54, 424–434. doi: 10.1016/j.yhbeh.2008.04.005
Powell, J., Lewis, P. A., Dunbar, R. I. M., García-Fiñana, M., and Roberts, N. (2010). Orbital prefrontal cortex volume correlates with social cognitive competence. Neuropsychologia 48, 3554–3562.
Powell, J., Lewis, P. A., Roberts, N., García-Fiñana, M., and Dunbar, R. I. M. (2012). Orbital prefrontal cortex volume predicts social network size: an imaging study of individual differences in humans. Proc. R. Soc. Lond. 279B, 2157–2162. doi: 10.1098/rspb.2011.2574
Pride, R. E. (2005). Optimal group size and seasonal stress in ring-tailed lemurs (Lemur catta). Behav. Ecol. 16, 550–560.
Pusey, A. E., and Schroepfer-Walker, K. (2013). Female competition in chimpanzees. Philos. Trans. R. Soc. Lond. 368B:20130077.
Ralph, C. R., Lehman, M. N., Goodman, R. L., and Tilbrook, A. J. (2016). Impact of psychosocial stress on gonadotrophins and sexual behaviour in females: role for cortisol? Reproduction 152, R1–R14. doi: 10.1530/REP-15-0604
Rowell, T. E. (1970). Baboon menstrual cycles affected by social environment. J. Reprod. Fert. 21, 133–141.
Rubenstein, D. I. (1986). “Ecology and sociality in horses and zebras,” in Ecological Aspects of Social Evolution, eds R. W. Wrangham and D. I. Rubenstein (Princeton, NJ: Princeton University Press), 282–302.
Rubenstein, D. R. (2007). Stress hormones and sociality: integrating social and environmental stressors. Proc. R. Soc. Lond. 274B, 967–975.
Rubenstein, D. R., Botero, C. A., and Lacey, E. A. (2016). Discrete but variable structure of animal societies leads to the false perception of a social continuum. R. Soc. Open Sci. 3:160147. doi: 10.1098/rsos.160147
Ruckstuhl, K. E., and Kokko, H. (2002). Modelling sexual segregation in ungulates: effects of group size, activity budgets and synchrony. Anim. Behav. 64, 909–914.
Ruckstuhl, K. E., and Neuhaus, P. (2002). Sexual segregation in ungulates: a comparative test of three hypotheses. Biol. Rev. 77, 77–96. doi: 10.1017/s1464793101005814
Sallet, J., Mars, R. B., Noonan, M. A., Neubert, F. X., Jbabdi, S., O’Reilly, J. X., et al. (2013). The organization of dorsal prefrontal cortex in humans and macaques. J. Neurosci. 33, 12255–12274.
Sallet, J., Mars, R. B., Noonan, M. P., Andersson, J. L., O’Reilly, J. X., Jbabdi, S., et al. (2011). Social network size affects neural circuits in macaques. Science 334, 697–700. doi: 10.1126/science.1210027
Samhouri, J. F. (2009). Food supply influences offspring provisioning but not density-dependent fecundity in a marine fish. Ecology 90, 3478–3488.
Sanders, K. A., and Bruce, N. W. (1997). A prospective study of psychosocial stress and fertility in women. Hum. Reprod. 12, 2324–2329.
Santini, Z., Jose, P., Koyanagi, A., Meilstrup, C., Nielsen, L., Madsen, K., et al. (2020). The moderating role of social network size in the temporal association between formal social participation and mental health: a longitudinal analysis using two consecutive waves of the Survey of Health, Ageing and Retirement in Europe (SHARE). Soc. Psychiatry Psych. Epidemol. 56, 417–428. doi: 10.1007/s00127-020-01961-2
Schedlowski, M., Flüge, T., Richter, S., Tewes, U., Schmidt, R. E., and Wagner, T. O. (1995). β-Endorphin, but not substance-P, is increased by acute stress in humans. Psychoneuroendocrinology 20, 103–110.
Schenker, J. G., Meirow, D., and Schenker, E. (1992). Stress and human reproduction. Eur. J. Obstetr. Gynecol. Reproduct. Biol. 45, 1–8.
Schino, G., Tiddi, B., and Polizzi di Sorrentino, E. (2006). Simultaneous classification by rank and kinship in Japanese macaques. Anim. Behav. 71, 1069–1074.
Schliep, K. C., Mumford, S. L., Vladutiu, C. J., Ahrens, K. A., Perkins, N. J., Sjaarda, L. A., et al. (2015). Perceived stress, reproductive hormones, and ovulatory function: a prospective cohort study. Epidemiology 26, 177–184.
Schradin, C., and Pillay, N. (2005). Intraspecific variation in the spatial and social organization of the African striped mouse. J. Mammal. 86, 99–107.
Schülke, O. (2003). To breed or not to breed—food competition and other factors involved in female breeding decisions in the pair-living nocturnal fork-marked lemur (Phaner furcifer). Behav. Ecol. Sociobiol. 55, 11–21. doi: 10.1007/s00265-003-0676-2
Schwartz, M. W., and Seeley, R. J. (1997). Neuroendocrine responses to starvation and weight loss. N. Engl. J. Med. 336, 1802–1811.
Seifer, D. B., and Collins, R. L. (1990). Current concepts of b-endorphin physiology in female reproductive dysfunction. Fert. Ster. 54, 757–771. doi: 10.1016/s0015-0282(16)53928-4
Semeniuk, C. A., and Dill, L. M. (2005). Cost/benefit analysis of group and solitary resting in the cowtail stingray, Pastinachus sephen. Behav. Ecol. 16, 417–426.
Sheiner, E., Sheiner, E. K., Potashnik, G., Carel, R., and Shoham-Vardi, I. (2003). The relationship between occupational psychological stress and female fertility. Occup. Med. 53, 265–269.
Shi, J., and Dunbar, R. I. M. (2005). Feeding competition within a feral goat population on the Isle of Rum, NW Scotland. J. Ethol. 69, 185–199.
Shultz, S., and Dunbar, R. I. M. (2007). The evolution of the social brain: anthropoid primates contrast with other vertebrates. Proc. R. Soc. Lond. 274B, 2429–2436.
Shultz, S., and Dunbar, R. I. M. (2010). Encephalisation is not a universal macroevolutionary phenomenon in mammals but is associated with sociality. Proc. Natl. Acad. Sci. U.S.A. 107, 21582–21586.
Shultz, S., and Finlayson, L. V. (2010). Large body and small brain and group sizes are associated with predator preferences for mammalian prey. Behav. Ecol. 21, 1073–1079.
Shultz, S., Noe, R., McGraw, S., and Dunbar, R. I. M. (2004). A community-level evaluation of the impact of prey behavioural and ecological characteristics on predator diet composition. Proc. R. Soc. Lond. 271B, 725–732. doi: 10.1098/rspb.2003.2626
Shultz, S., Opie, C., and Atkinson, Q. D. (2011). Stepwise evolution of stable sociality in primates. Nature 479, 219–222.
Sigg, H., and Stolba, A. (1981). Home range and daily march in a hamadryas baboon troop. Folia Primatol. 36, 40–75. doi: 10.1159/000156008
Silk, J. (1999). Male bonnet macaques use information about third-party rank relationships to recruit allies. Anim. Behav. 58, 45–51. doi: 10.1006/anbe.1999.1129
Silk, J. B., Alberts, S. C., and Altmann, J. (2003). Social bonds of female baboons enhance infant survival. Science 302, 1232–1234.
Silk, J. B., Beehner, J. C., Bergman, T. J., Crockford, C., Engh, A. L., Moscovice, L. R., et al. (2009). The benefits of social capital: close social bonds among female baboons enhance offspring survival. Proc. R. Soc. Lond. 276B, 3099–3104. doi: 10.1098/rspb.2009.0681
Silk, J. B., Beehner, J. C., Bergman, T. J., Crockford, C., Engh, A. L., Moscovice, L. R., et al. (2010). Strong and consistent social bonds enhance the longevity of female baboons. Curr. Biol. 20, 1359–1361. doi: 10.1016/j.cub.2010.05.067
Sliwa, J., and Freiwald, W. A. (2017). A dedicated network for social interaction processing in the primate brain. Science 356, 745–749.
Smith, J. E., and Kunz, P. R. (1976). Polygyny and fertility in nineteenth century America. Popul. Stud. 30, 465–480.
Smuts, B. B., and Nicholson, N. (1989). Dominance rank and reproduction in female baboons. Am. J. Primatol. 19, 229–246.
Son, Y. L., Ubuka, T., Millar, R. P., and Kanasaki, H. (2012). Gonadotropin-inhibitory hormone inhibits GnRH-induced gonadotropin subunit gene transcriptions by inhibiting AC/cAMP/PKA-dependent ERK Pathway in L[beta]T2 cells. Endocrinology 153, 2332–2343.
Spagna, A., Dufford, A. J., Wu, Q., Wu, T., Zheng, W., Coons, E. E., et al. (2018). Gray matter volume of the anterior insular cortex and social networking. J. Comp. Neurol. 526, 1183–1194. doi: 10.1002/cne.24402
Spreng, R., Dimas, E., Mwilambwe-Tshilobo, L., Dagher, A., Koellinger, P., Nave, G., et al. (2020). The default network of the human brain underlies perceived social isolation. Nat. Commun. 11:6393. doi: 10.1093/nc/niab016
Srivastava, A., and Dunbar, R. I. M. (1996). The mating system of hanuman langurs: A problem in optimal foraging. Behav. Ecol. Sociobiol. 39, 219–226.
Stein, Z., and Susser, M. (1975). Fertility, fecundity, famine: food rations in the Dutch famine 1944/5 have a causal relation to fertility, and probably to fecundity. Hum. Biol. 47, 131–154.
Stokes, E. J., Parnell, R. J., and Olejniczak, C. (2003). Female dispersal and reproductive success in wild western lowland gorillas (Gorilla gorilla gorilla). Behav. Ecol. Sociobiol. 54, 329–339.
Strier, K. B., Lee, P. C., and Ives, A. R. (2014). Behavioral flexibility and the evolution of primate social states. PLoS One 9:e114099. doi: 10.1371/journal.pone.0114099
Sueur, C., and Petit, O. (2010). Signals used by leaders in Macaca tonkeana and Macaca mulatta: group-mate recruitment and behaviour monitoring. Anim. Cogn. 13, 239–248. doi: 10.1007/s10071-009-0261-9
Sueur, C., Deneubourg, J. L., and Petit, O. (2011). From the first intention movement to the last joiner: macaques combine mimetic rules to optimize their collective decisions. Proc. R. Soc. Lond. 278B, 1697–1704. doi: 10.1098/rspb.2010.2084
Sutcliffe, A. J., Dunbar, R. I. M., and Wang, D. (2016). Modelling the evolution of social structure. PLoS One 11:e0158605. doi: 10.1371/journal.pone.0158605
Sutcliffe, A., Dunbar, R. I. M., Binder, J., and Arrow, H. (2012). Relationships and the social brain: integrating psychological and evolutionary perspectives. Br. J. Psychol. 103, 149–168.
Taborsky, M., and Wong, M. Y. (2017). “Sociality in fishes,” in Comparative Social Evolution, eds D. I. Rubenstein and P. Abbot (Cambridge: Cambridge University Press), 354–389.
Takahata, Y., Koyama, N., Ichino, S., Miyamoto, N., and Nakamichi, M. (2006). Influence of group size on reproductive success of female ring-tailed lemurs: distinguishing between IGFC and PFC hypotheses. Primates 47, 383–387. doi: 10.1007/s10329-006-0185-9
Tavecchia, G., Pradel, R., Genovart, M., and Oro, D. (2007). Density-dependent parameters and demographic equilibrium in open populations. Oikos 116, 1481–1492. doi: 10.1046/j.1365-2915.2003.00437.x
Teichroeb, J. A., Wikberg, E. C., and Sicotte, P. (2009). Female dispersal patterns in six groups of ursine colobus (Colobus vellerosus): infanticide avoidance is important. Behaviour 146, 551–582.
Thompson, M. E., Kahlenberg, S. M., Gilby, I. C., and Wrangham, R. W. (2007). Core area quality is associated with variance in reproductive success among female chimpanzees at Kibale National Park. Anim. Behav. 73, 501–512.
van Schaik, C., and Dunbar, R. I. M. (1990). The evolution of monogamy in large primates: a new hypothesis and some critical tests. Behaviour 115, 30–62.
von Borell, E., Dobson, H., and Prunier, A. (2007). Stress, behaviour and reproductive performance in female cattle and pigs. Horm. Behav. 52, 130–138.
von der Heide, R., Vyas, G., and Olson, I. R. (2014). The social network-network: size is predicted by brain structure and function in the amygdala and paralimbic regions. Soc. Cogn. Affect. Neurosci. 9, 1962–1972. doi: 10.1093/scan/nsu009
Wagenmaker, E. R., Breen, K. M., Oakley, A. E., Tilbrook, A. J., and Karsch, F. J. (2009). Psychosocial stress inhibits amplitude of gonadotropin-releasing hormone pulses independent of cortisol action on the type II glucocorticoid receptor. Endocrinology 150, 762–769. doi: 10.1210/en.2008-0757
Warren, M. P., and Perlroth, N. E. (2001). Hormones and sport – the effects of intense exercise on the female reproductive system. J. Endocrinol. 170, 3–12.
Wey, T. W., Burger, J. R., Ebensperger, L. A., and Heyes, L. D. (2013). Reproductive correlates of social network variation in plurally breeding degus (Octodon degus). Anim. Behav. 85, 1407–1414. doi: 10.1016/j.anbehav.2013.03.035
Williams, N. I., Berga, S. L., and Cameron, J. L. (2007). Synergism between psychosocial and metabolic stressors: impact on reproductive function in cynomolgus monkeys. Am. J. Physiol. Endocrinol. Metab. 293, E270–E276. doi: 10.1152/ajpendo.00108.2007
Williams, N. I., Caston-Balderrama, A. L., Helmreich, D. L., Parfitt, D. B., Nosbisch, C., and Cameron, J. L. (2001). Longitudinal changes in reproductive hormones and menstrual cyclicity in cynomolgus monkeys during strenuous exercise training: abrupt transition to exercise-induced amenorrhea. Endocrinology 142, 2381–2389. doi: 10.1210/endo.142.6.8113
Wilson, M., and Mesnick, S. L. (1997). “An empirical test of the bodyguard hypothesis,” in Feminism and Evolutionary Biology, ed. P. A. Gowaty (London: Chapman & Hall), 505–511.
Wittig, R. M., Crockford, C., Lehmann, J., Whitten, P. L., Seyfarth, R. M., and Cheney, D. L. (2008). Focused grooming networks and stress alleviation in wild female baboons. Horm. Behav. 54, 170–177. doi: 10.1016/j.yhbeh.2008.02.009
Wittig, R. M., Crockford, C., Weltring, A., Langergraber, K. E., Deschner, T., and Zuberbühler, K. (2016). Social support reduces stress hormone levels in wild chimpanzees across stressful events and everyday affiliations. Nat. Commun. 7:13361. doi: 10.1038/ncomms13361
Woodroffe, R., and Macdonald, D. W. (1995). Female/female competition in European badgers Meles meles: effects on breeding success. J. Anim. Ecol. 64, 12–20.
Young, A. J., Carlson, A. A., Monfort, S. L., Russell, A. F., Bennett, N. C., and Clutton-Brock, T. H. (2006). Stress and the suppression of subordinate reproduction in cooperatively breeding meerkats. Proc. Natl. Acad. Sci. U.S.A. 103, 12005–12010.
Young, C., Majolo, B., Heistermann, M., Schülke, O., and Ostner, J. (2014). Responses to social and environmental stress are attenuated by strong male bonds in wild macaques. Proc. Natl. Acad. Sci. U.S.A. 111, 18195–18200. doi: 10.1073/pnas.1411450111
Zacur, H. A., Chapanis, H. P., Lake, C. R., Ziegler, M., and Tyson, J. E. (1976). Galactorrhea-amenhorrea: psychological interaction with neuroendocrine function. Am. J. Obstetr. Gynecol. 125, 859–862. doi: 10.1016/0002-9378(76)90863-2
Keywords: primates, reproductive endocrinology, predation, fertility, coalitions, cognition, fission-fusion sociality
Citation: Dunbar RIM and Shultz S (2021) The Infertility Trap: The Fertility Costs of Group-Living in Mammalian Social Evolution. Front. Ecol. Evol. 9:634664. doi: 10.3389/fevo.2021.634664
Received: 01 December 2020; Accepted: 22 September 2021;
Published: 18 October 2021.
Edited by:
Mark A. Elgar, The University of Melbourne, AustraliaReviewed by:
Elissa Cameron, University of Canterbury, New ZealandGeoffrey M. While, University of Tasmania, Australia
Copyright © 2021 Dunbar and Shultz. This is an open-access article distributed under the terms of the Creative Commons Attribution License (CC BY). The use, distribution or reproduction in other forums is permitted, provided the original author(s) and the copyright owner(s) are credited and that the original publication in this journal is cited, in accordance with accepted academic practice. No use, distribution or reproduction is permitted which does not comply with these terms.
*Correspondence: Robin I. M. Dunbar, cm9iaW4uZHVuYmFyQHBzeS5veC5hYy51aw==