 Fred H. Sklar
 Christine Carlson
 Carlos Coronado-Molina
 Ana Carolina Maran
- 1Everglades Systems Assessment Section, Applied Science Bureau, South Florida Water Management District, West Palm Beach, FL, United States
- 2Geospatial Analysis and Data Management Section, South Florida Water Management District, West Palm Beach, FL, United States
- 3Office of Environmental Resiliency, South Florida Water Management District, West Palm Beach, FL, United States
We used static, elevation and land cover data to estimate sea level rise impacts (SLR) to urban, developed lands and coastal wetland systems in Everglades National Park and the East and West coastal regions in South Florida. Maps and data tables estimating potential state change to open water were compiled through overlay analysis of elevation, land cover, and SLR masks with future land cover projected using a land cover transition threshold model. Analysis was based on a 2–5-km-wide longitudinal band along the SW and SE coasts of Florida where sea-level rise has no surface impediments to inundation and will likely cause coastline transgression and wetland migration. Analysis used three different projections; 0.27 m (0.9 ft), 0.76 m (2.5 ft) and 1.13 m (3.7 ft) greater than current sea level by 2070 estimated by NOAA and IPCC. Under a 0.27 m SLR projection 51% of the coastal land cover may be impacted. Under 0.76 and 1.13 m projected SLR, coastal land cover areas were impacted by 56.5 and 59.1%, respectively. Migration of coastal wetlands from their current location into more inland areas in response to increased water depths and as a function of empirically derived marsh and mangrove accretion rates were also evaluated. With a SLR of 0.76 m by 2070, without accretion, 1,160 sq km of wetland became open estuarine water. However, with accretion values of 0.211 m (4.1 mm yr–1) and 0.55 m (11 mm yr–1) by 2070, there was a transition of wetland cover to open estuarine water of only 349 and 41 sq km, respectively. Under a low SLR of 0.27 m by 2070 scenario with accretion, the coastal mangroves were able to migrate inland while maintaining the current coastline. It was only under the more extreme scenario of 1.13 m SLR by 2070 that accretion was not able to compensate for inundation and there was a loss of wetland coastline everywhere.
Introduction
Sea-level rise is expected to affect natural and urban areas by shifting habitats and inundating coastal developments. To plan for a sustainable South Florida ecosystem, it is important to identify ecological vulnerabilities to sea-level rise and ask how we might direct Everglades restoration and water management to minimize saltwater intrusion, peat collapse (Sklar et al., 2019) and land loss. Sea-level rise (SLR) projections for the next 50 years will threaten the structure and function of coastal wetlands in South Florida and there is agreement among coastal scientists that sea level is rising at rates that will inundate most lowlands distributed along the coasts (Ross et al., 2000; Sweet et al., 2017; Sklar et al., 2019).
The Southeast Florida Regional Climate Change Compact’s Sea Level Rise Ad Hoc Work Group (Compact) (2019) has established a set of climate indicators, including SLR, flooding, high tide events, groundwater elevation, saltwater intrusion, temperature, rainfall and severe storms. Analysis of observed and projected data from the four counties within the Compact (Palm Beach, Broward, Miami-Dade, and Monroe) include best available data and associated trends. One of the most important contributions of the Compact has been its regional unified SLR projections. When used in conjunction with vulnerability assessments, these projections inform the user of the potential magnitude and extent of SLR impact at a general timeframe in the future. Here we use the Compacts Median, Intermediate and the High projections at the 2070 timestep to analyze a qualitative, conceptual raster-based “bathtub” model of wetland response to SLR.
Sea level rise and inundation pose a substantial risk to many South Florida coastal communities, and the risk is likely to increase with continued development, changes in storm intensity and frequency (Wanless, 1989; Nungesser et al., 2014; Malone et al., 2015). The Southeast Florida Regional Climate Change Compact’s Sea Level Rise Ad Hoc Work Group (Compact) (2019), IPCC and NOAA SLR scenarios project 40 cm by 2040 and 100 cm by 2070 (IPCC, 2014). These SLR projections will likely lead to more sustained extreme storm surges, increased coastal erosion, inundation of coastal wetlands, saline intrusion of coastal aquifers, and upward migration of estuarine salt fronts into formerly freshwater areas (Meeder et al., 2017; Park et al., 2019). Thus, there is an increasing urgency for federal and state governments to (1) focus on SLR adaptation at the local and regional levels and (2) consistently provide the information, tools, and methods necessary for adaptation to climate change.
Mangrove forests within the Everglades ecosystem rely on external inorganic sediment input and autochthonous organic matter generated to maintain a vertical soil elevation that have allowed them to keep pace with a relatively stable SLR (Parkinson et al., 1994; McKee et al., 2007). Over the last century, SLR rates have been estimated to be approximately 2.1 mm yr–1 based on long-term tide gauge data from South Florida (Maul and Douglas, 1993; Iz et al., 2012). Over the last 50 years, there is evidence of SLR acceleration (2.9 mm yr–1, Obeysekera et al., 2011; 2–4 mm yr–1, Wanless et al., 1994). The global rates of SLR for the last 50 years was approximately 2.6 mm yr–1, adding up to about 21–24 cm since 1880, and about a third occurring in the past 25 years. Future rates are estimated to be somewhere between 3 mm yr–1 and 15 m yr–1 depending on the selected emissions pathway and up to the NOAA intermedia high projections (Lindsey, 2021). Based on the geologic record 5,500 years before present, SLR rates were ∼5 mm yr–1 and south Florida shorelines were still transgressive, moving marine waters inland, as evidenced by thin, narrow and ephemeral sedimentary deposits (Wanless et al., 1994; Meeder and Parkinson, 2018). The resilience of the coastal mangrove ecosystems to continue to keep pace with SLR, and especially a rapid 2070 scenario rise, will be discussed herein in terms of Everglades’ mangrove ability to balance this rise with soil accretion. Mangroves are currently distributed close to their lower thermal limits in Florida (Cavanaugh et al., 2019). However, with a projected 1.5°C temperature increase and with projected salt water intrusion, we assume that their ability to keep up with accelerated rates of SLR will improve with time (McKee et al., 2007; Doyle et al., 2010).
For coastal wetlands to persist in the face of SLR, the soil surface must accrete vertically at a rate equal to the rate of SLR (Cahoon et al., 1995). A number of studies have shown that coastal wetlands are indeed able to accrete at a rate equal to recent rates of SLR (1–2 mm yr–1, Church and White, 2006) and survive for thousands of years at these modest rates (McKee et al., 2007; Willard and Bernhardt, 2011). However, given current projections of SLR of 3–4 mm yr–1, the forest floor will have to build sediments at a rate 4.5–9 times that observed over the last century. Wetland accretion rates are a function of the combination of inorganic and organic material inputs to the soil. Inorganic material is mostly supplied in the form of sediments that come from either the sea or freshwater sources, particularly in riverine and tidal mangrove systems. Organic material is mostly derived from the growth of plant roots, which provide a biological source to which other soil material can adhere and contribute to soil formation directly upon decomposition. Mangrove forests are considered excellent land builders due to the soil-binding capacity of their roots (McKee et al., 2007; Friess and McKee, 2020) as well as organic soil formation by high rates of belowground production (Castaneda-Moya et al., 2011). In carbonate environments where there is little mineral sediment input from riverine systems, such as South Florida, belowground production of mangrove peat is considered the primarily soil-building mechanism (Parkinson et al., 1994; Chen and Twilley, 1999; McKee et al., 2007) subsidized by marl deposition in some location near the shoreline.
For coastal wetland in South Florida, where elevations gradients are minimal, this study will explore if small changes in soil elevation relative to projected sea-level rise scenarios can lead to large spatial changes in ecosystem structure. We ask; Can coastal wetland systems adapt to the mean water depth changes specified in the SLR predictions over the next 50 years? Here we present a coast-wide overview based on a functional paradigm for forecasting potential retreat and migration of tidal forests (mangroves) along the northeast and southwest Everglades (South Florida) based on known expanse of mangrove ecosystems at the regional level. Our objective is to evaluate, on a broad, holistic scale, coastal wetland migration as a function of topography, peat collapse, and SLR. We assume that wetland loss due to SLR is a net reduction in ecosystem services, such as nutrient and carbon sequestration and that despite the ecological value of an estuary, a transition to an open water estuarine habitat is a significant decline in biodiversity, resilience and coastal zone functionality.
Study Area
SLR Projections
The Southeast Florida Regional Climate Change Compact’s Sea Level Rise Ad Hoc Work Group (Compact) (2019) projections for 2070 SLR (Figure 1) represents the consensus from the technical working group and includes projections developed by the Intergovernmental Panel on Climate Change (IPCC) Fifth Assessment Report (IPCC, 2014) and the National Oceanic and Atmospheric Administration (NOAA) (Sweet et al., 2017). The included projections account for regional effects that produce regional differences in Southeast Florida’s rate of SLR compared to global projections. All projection curves assume a growing greenhouse gas emission concentration scenario. This study used the NAVD88 elevation associated with each 2070 projection to create sea level masks corresponding to the IPCC Median projection of 0.9 feet (0.27 m) NAVD, the NOAA Intermediate High projection of 2.5 feet (0.762 m) NAVD, and the NOAA High projection of 3.7 feet (1.12776 m) NAVD.
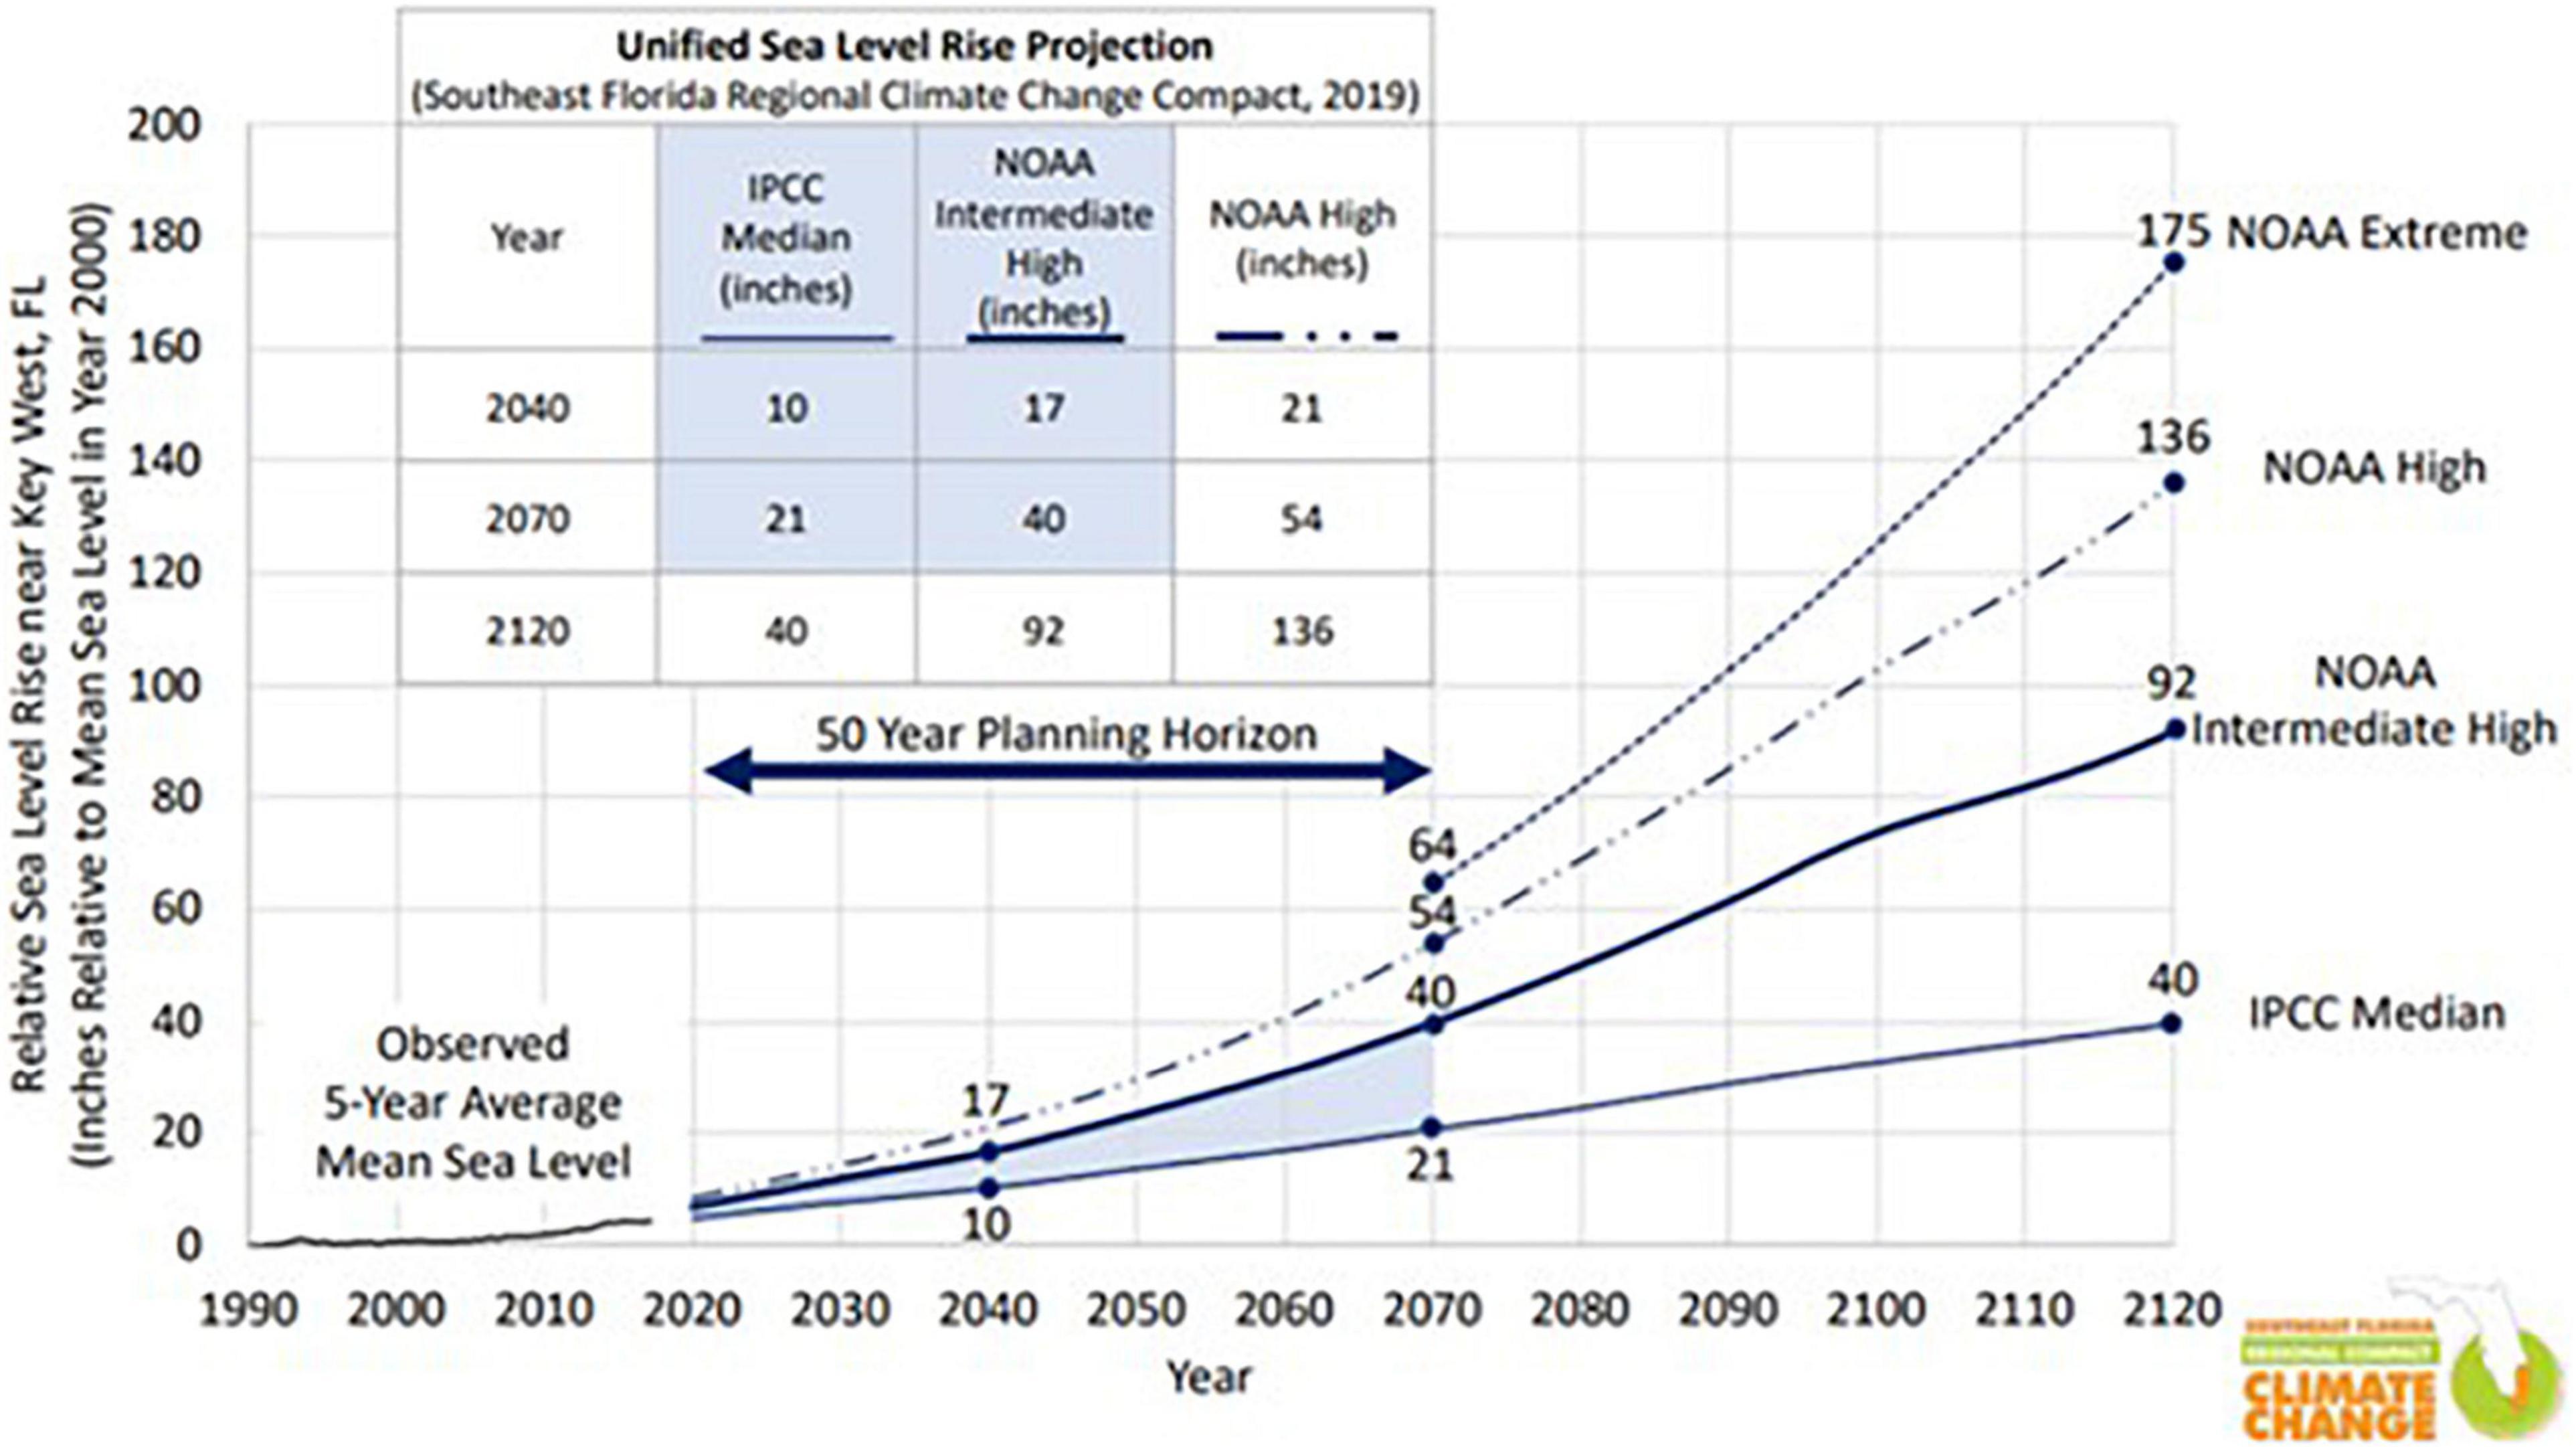
Figure 1. The 2019 unified sea level rise (SLR) projection from Southeast Florida Regional Climate Change Compact Sea Level Rise Work Group (Compact) (2019), used to estimate SLR inundation.
Current Conditions
The South Florida Water Management District is a regional governmental agency that operates and maintains the regional water management system for the southern half of Florida. That regional system is divided into water control catchments that include drainage areas, waterbodies, and control structures. It also includes a coastal catchment comprised of bays, lagoons, rivers and other tidally influenced coastal waterbodies. The upstream divides for the coastal catchment include coastal structures that mitigate the flow of tidal waters upstream into freshwater areas. Our study area includes the coastal catchment along with a few inland areas that are expected to experience impacts from SLR (Figure 2).
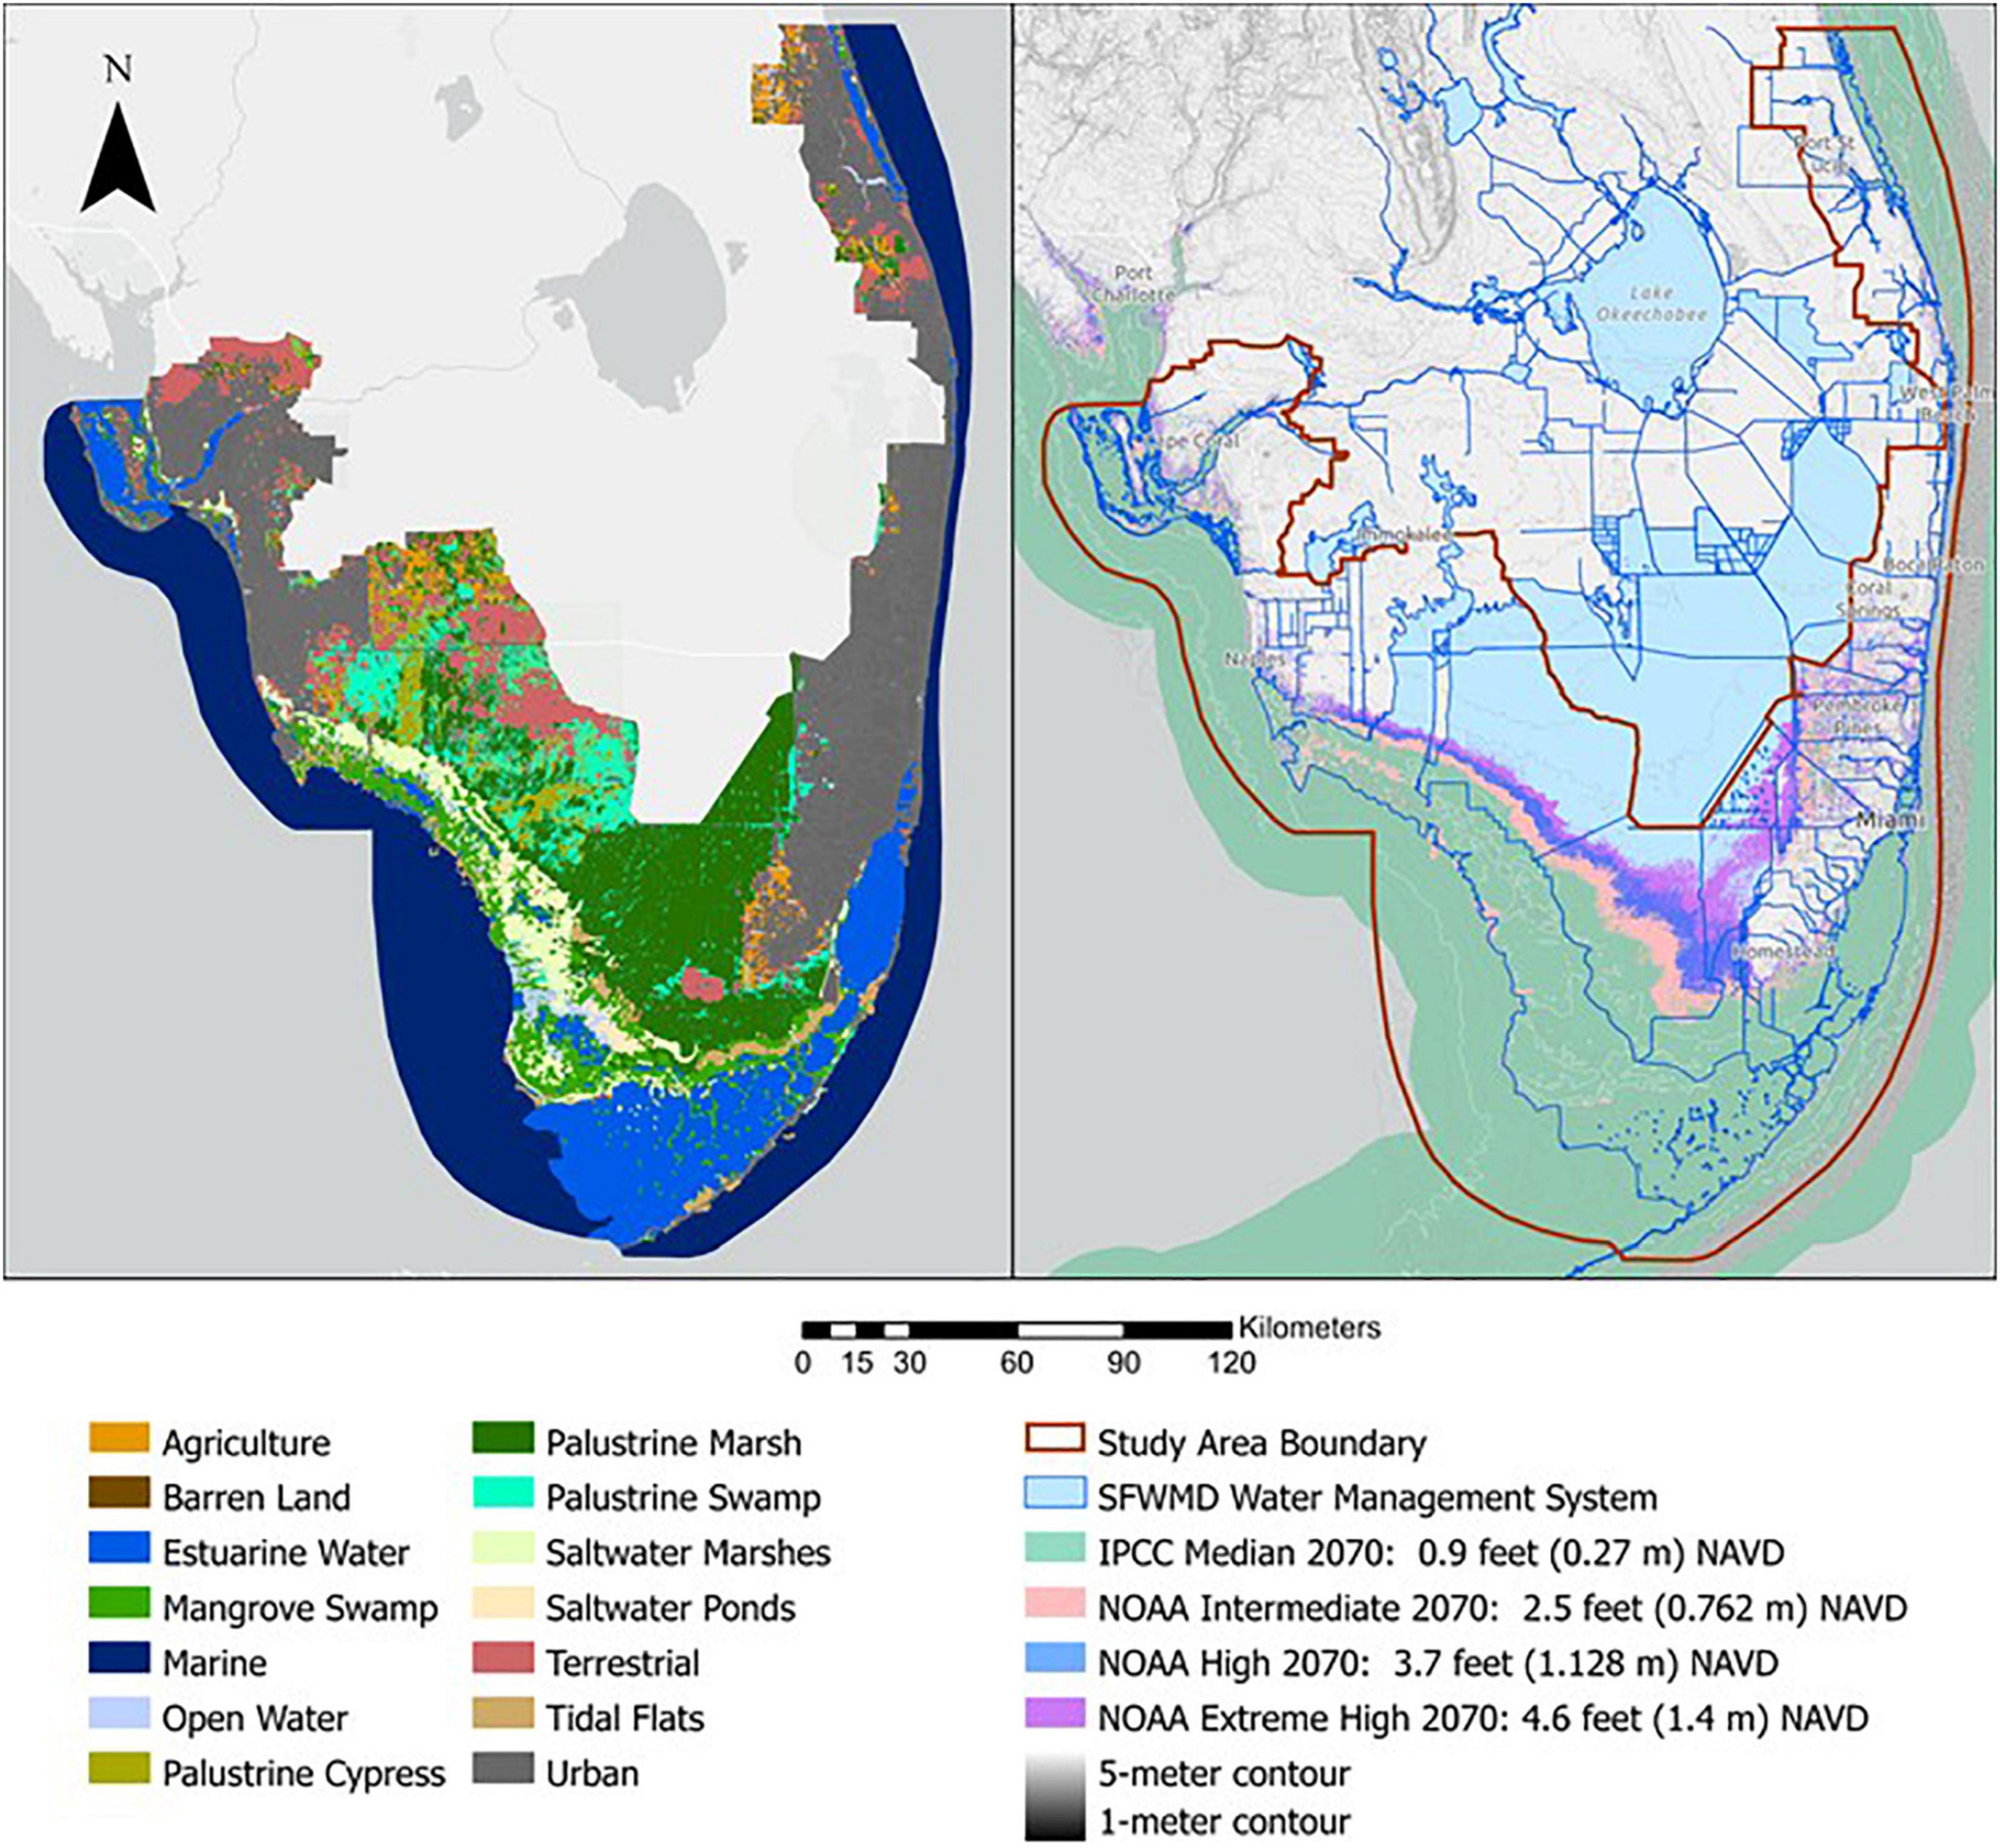
Figure 2. South Florida study area within the South Florida Water Management District, indicating the landcover types (left) and the extent of inundation and saltwater intrusion that could occur with no freshwater deliveries to the coasts of South Florida or during a severe drought within the boundary conditions that are currently protected by water control units, catchments, structures and levees.
Current condition land cover data (Figure 2) were derived from land cover mapped by the SFWMD from 2014, 2015, and 2016 aerial photography (South Florida Water Management District [SFWMD], 2014a). The SFWMD uses the Florida Land Use, Cover, and Forms Classification System (FLUCS) Handbook (Florida Department of Transportation [FDOT], 1999) as the basis for land use and land cover mapping (Table 1). They maintain classification updates and clarifications in Photointerpretation Keys (South Florida Water Management District [SFWMD], 2014b). Land Cover data were reclassified into 14 study categories shown in Figure 2.
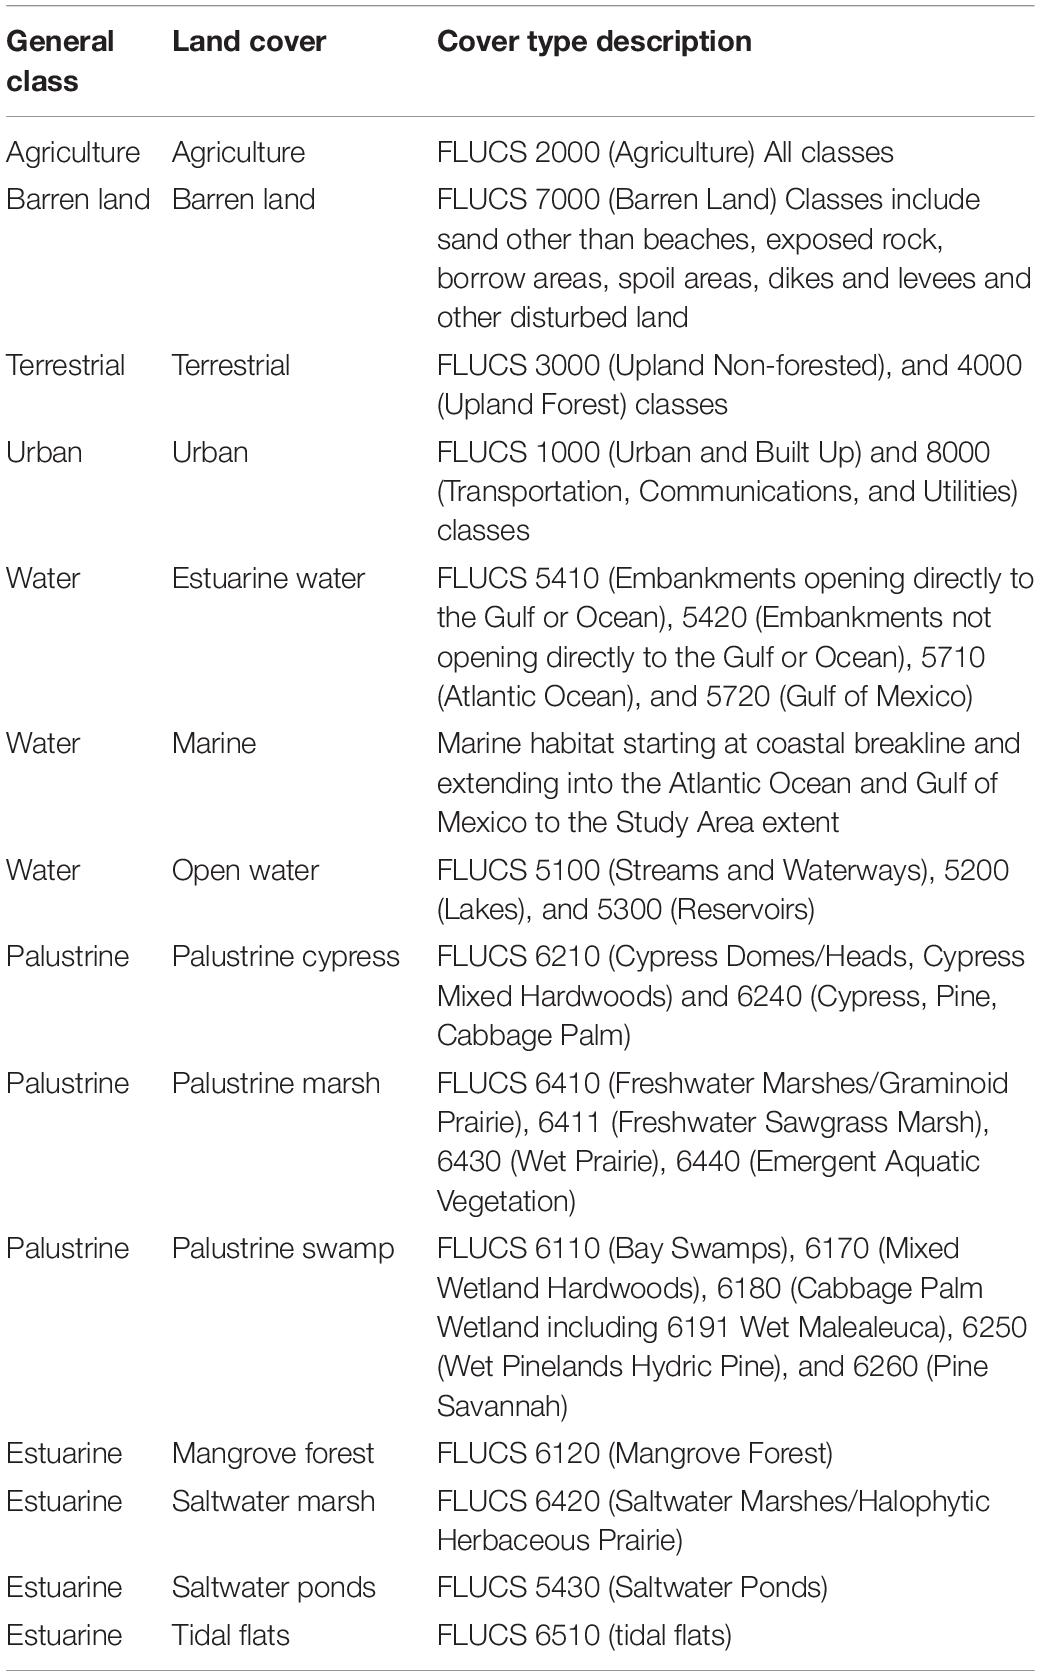
Table 1. Cover type descriptions and class, based on the Florida land use, cover, and forms classification system (FLUCS) Handbook (Florida Department of Transportation [FDOT], 1999) and used in this conceptualization of seas level rise impacts.
Elevations
The elevation collections described and listed in Table 2 and shown in Supplemental Material were the sources for elevation and depth data used in this analysis. These were used to derive a high resolution topo-bathymetric elevation mosaic (South Florida Water Management District [SFWMD], 2020; Supplementary Figure 2). This elevation mosaic used the Web Mercator spherical projection. Elevations values in the source mosaics were NAVD88 units of feet. The mosaic was used to derive sea level elevation masks and was resampled and recalculated to a 3-m Digital Elevation Model (DEM) with elevation values in NAVD88 units of meters for use in calculating depth. Elevation masks for the 2070 SLR predictions were derived from the South Florida elevation mosaic using conditional statements that resampled the elevation mosaic into pixels with elevation values equal to or less than the specified elevation and those not meeting those conditions. The resulting raster was converted to an SLR mask by eliminating pixels not meeting the specified conditions and calculating the remaining pixels to the SLR prediction elevation.
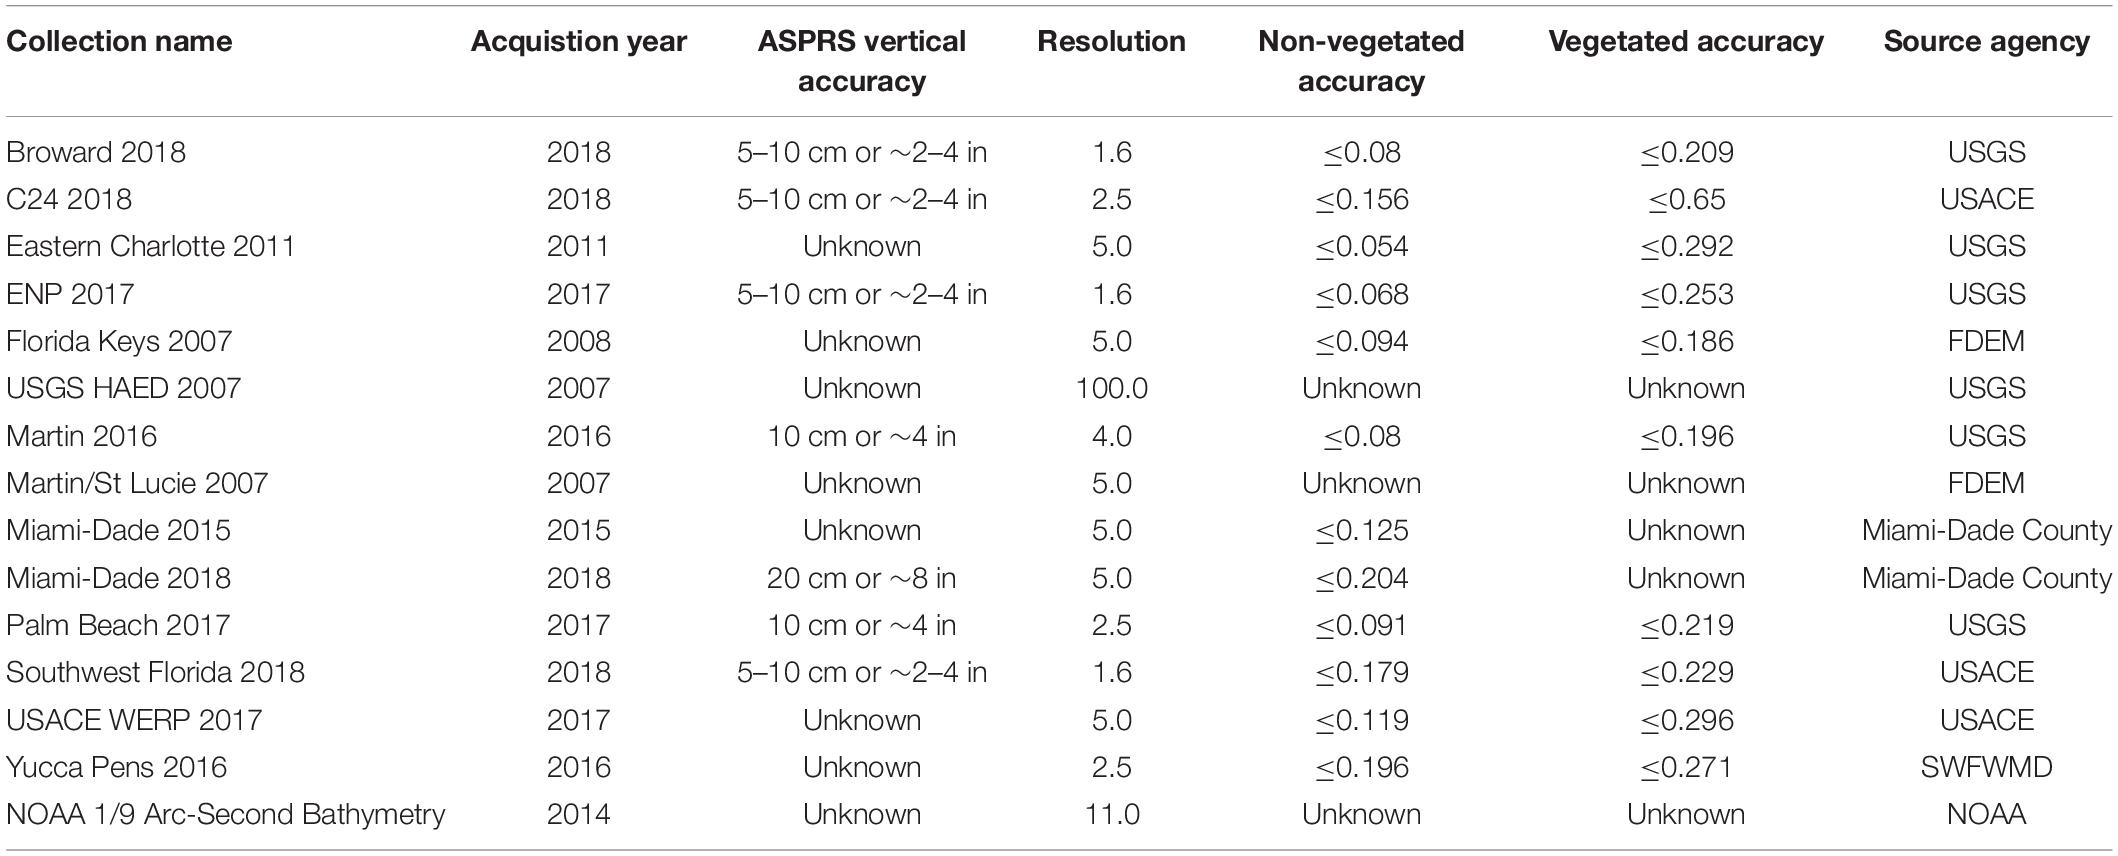
Table 2. Vertical accuracy, resolution and source agencies for the SFWMD elevation collections used to create the topo-bathymetric DEM for South Florida (South Florida Water Management District [SFWMD], 2020; https://sfwmd.maps.arcgis.com/home/item.html?id(=ca44a6a0714d4d3daa43eba592e8b11b).
Mean elevations for the land cover classes within the study area ranged from a high of 4.79 m (Sd Dev 2.29 m) for the Terrestrial habitats to a low of −9.87 m (Sd Dev 11.3 m) for the Marine classification (Table 3). The high standard deviation for the Marine cover was due to the high bathymetric variance found in the study area. Standard Deviations were calculated as a check on the quality of the land cover classification protocol and to identify and correct land cover elevation outliers. Depth was calculated by subtracting the Study Area DEM from the SLR Masks. The resolution and pixel alignment of the 3-m land surface DEM was specified to be maintained in the resulting depth raster.
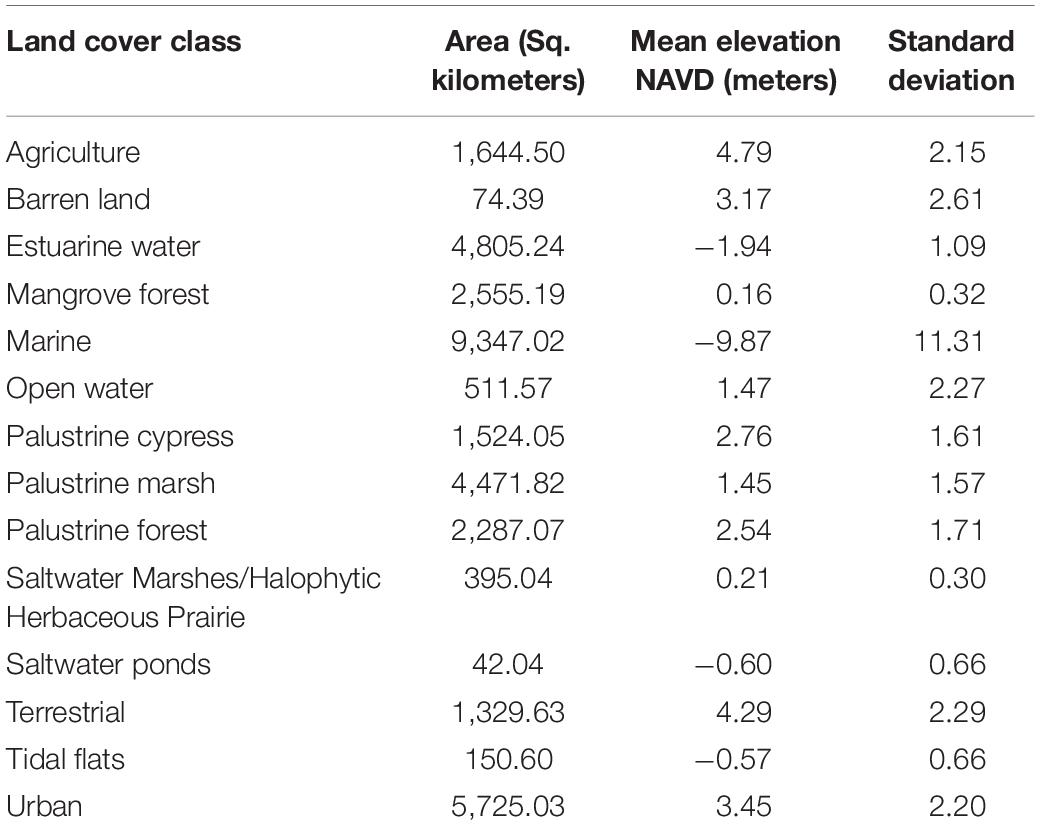
Table 3. Areal extent, mean elevations and standard deviations for land cover classes within the study area.
Methods
Sediment Elevation Table (SET)
Changes in the elevation of the soil surface over time was measured using the surface elevation table–marker horizon (SET–MH) methodology (Figure 3), which has been widely used and recommended for monitoring intertidal surface-elevation trajectories in coastal wetlands (Cahoon et al., 1999; Cahoon, 2015; McKee et al., 2020). Tide gauges record a relative sea level-rise (RSLR) associated benchmarks attached to the Earth’s crust. We estimated the mangrove elevation change relative to the closest tidal gauge by subtracting the mangrove soil elevation change measured with the SET from nearest-neighbor tide gauge SLR calculations. This calculation is possible because the SET and tide gauge independently measure vertical elevation change in different portions of the substrate (Cahoon, 2015). The SET is attached to a benchmark pipe driven into the soil surface 2–3 m and it is assumed to be a stable datum over the period of study. Nine pins are lowered to the soil surface to measure elevation with an accuracy of around each SET platform in the fringe and basin zones of each study site. Vertical accretion was measured, to the nearest millimeter, using pressurized liquid nitrogen coring technology (Cahoon, 2015) and measuring the depth of the marker horizon below the surface.
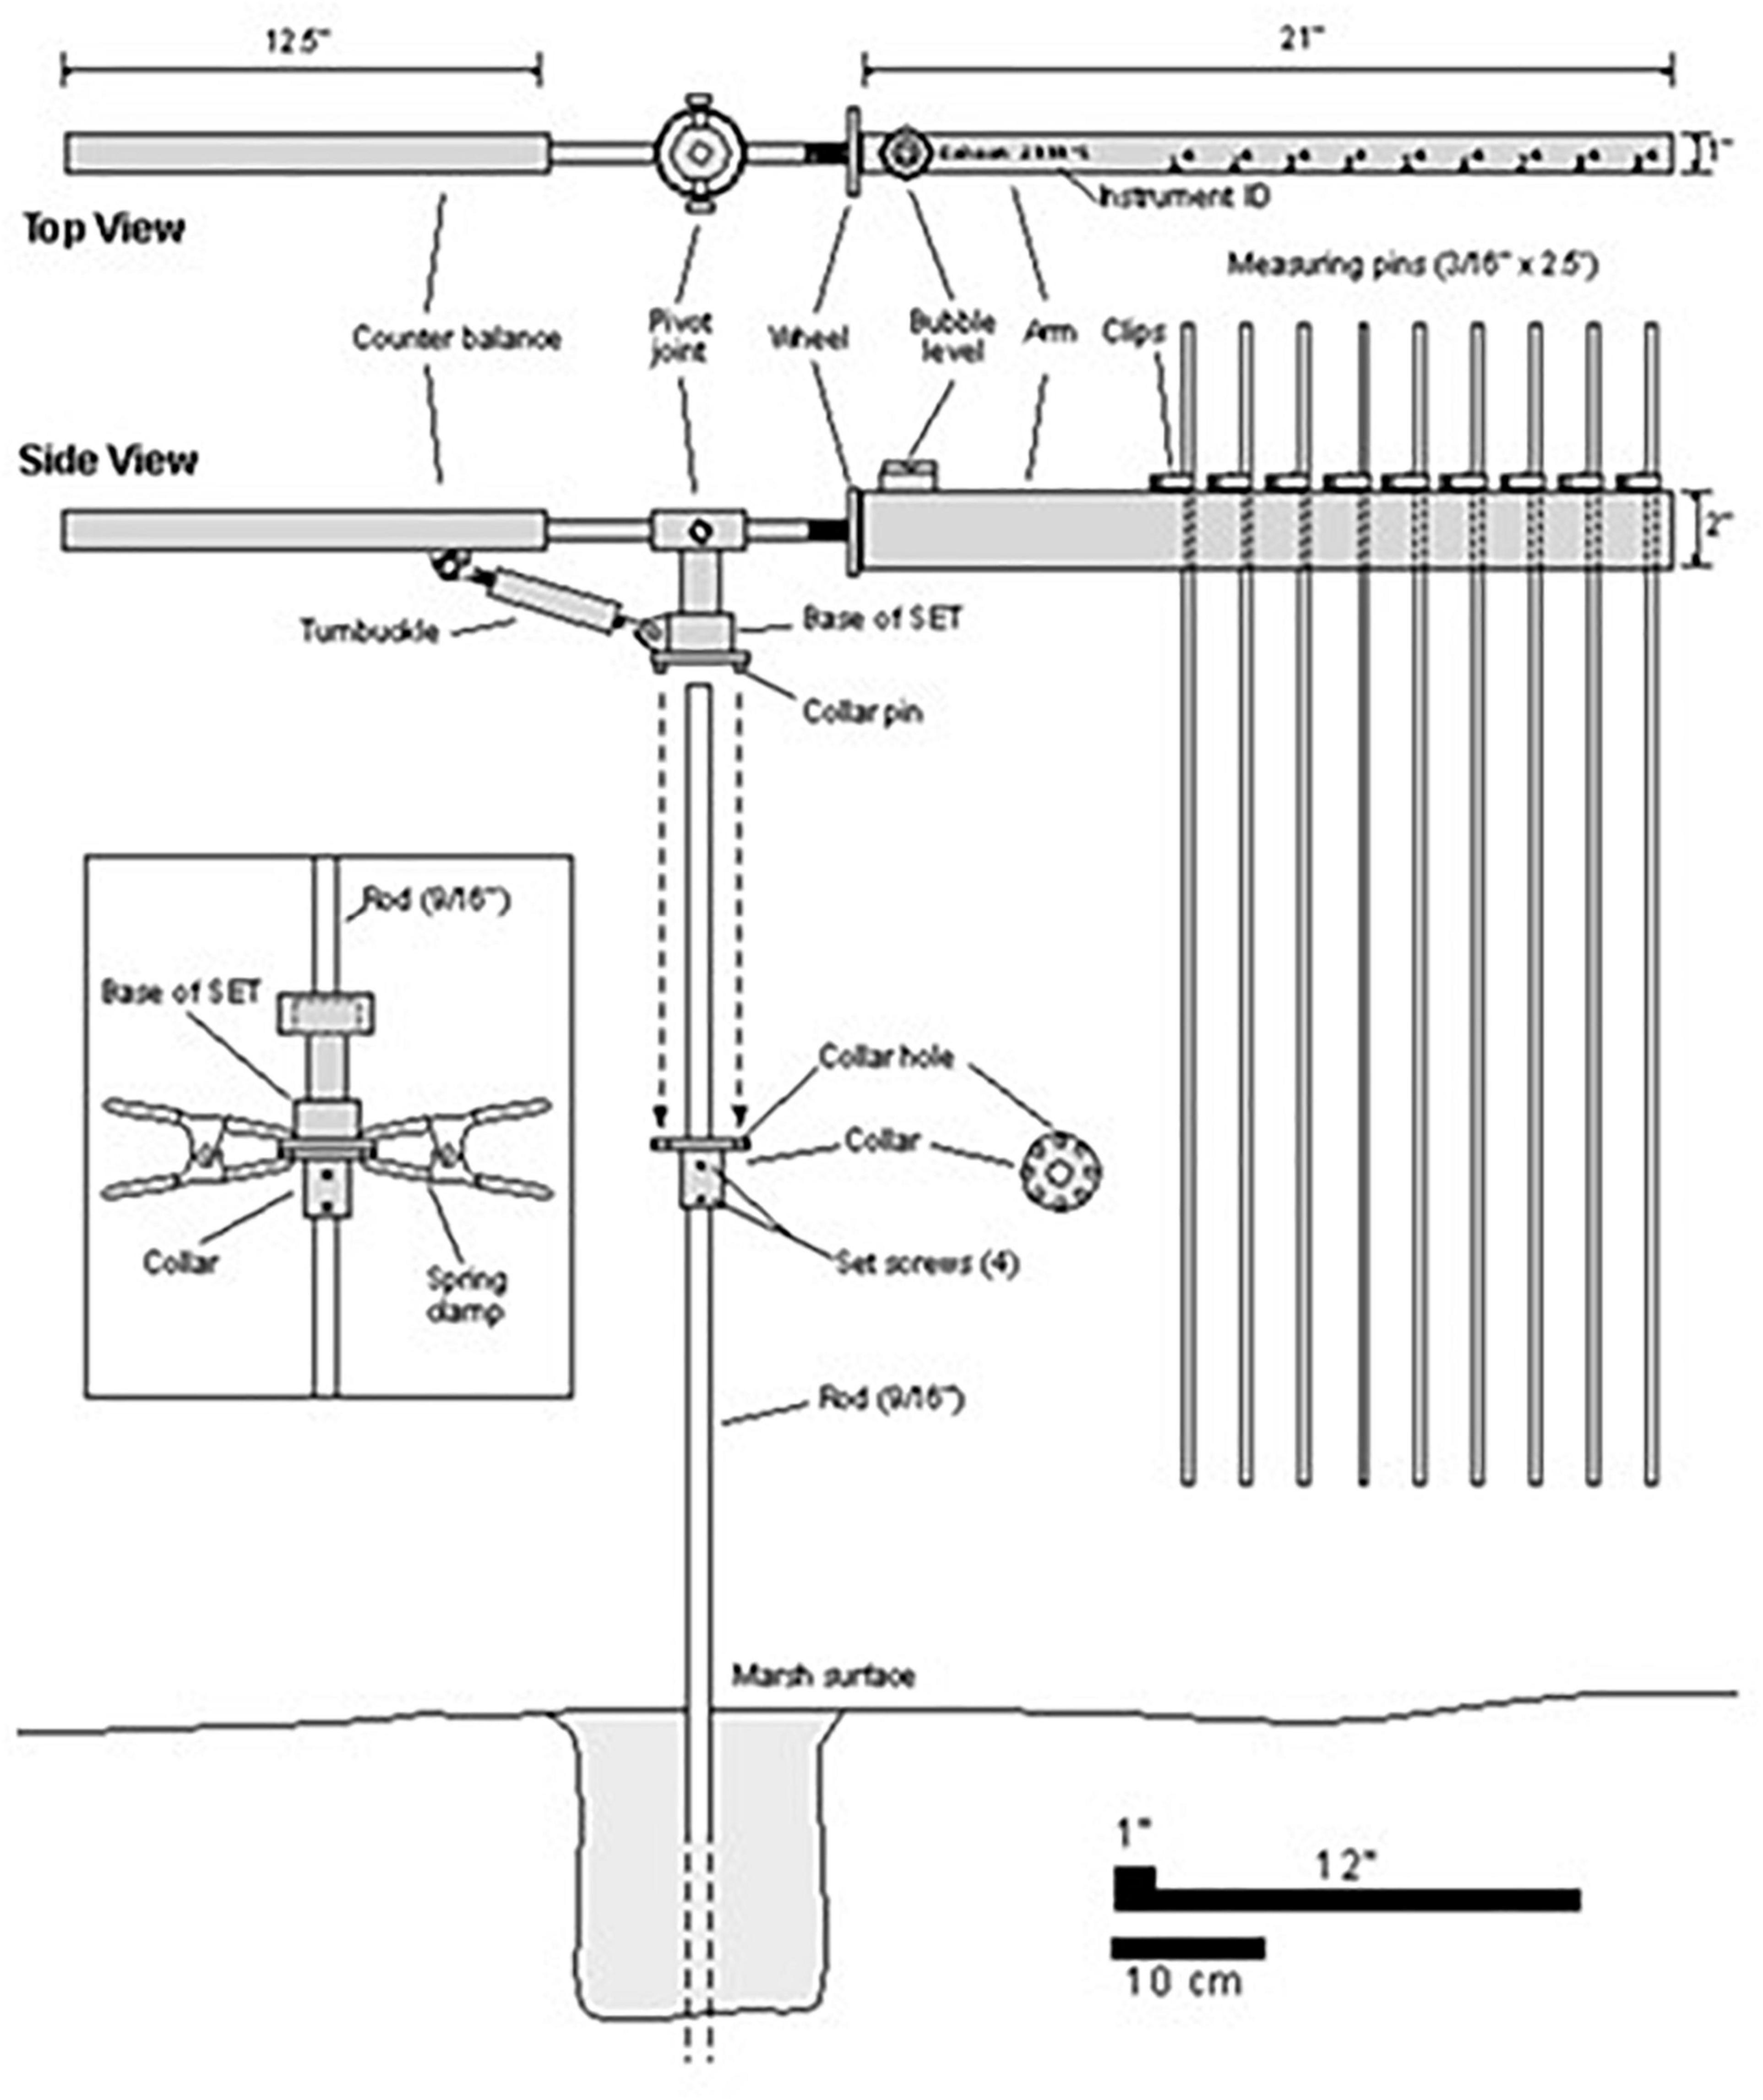
Figure 3. The blueprint for the Sediment Elevation Table (SET) used to monitor wetland soil expansion (from root production and aeration) and subsidence (from dewatering and decomposition) (modified from Cahoon et al., 2002).
Surface Elevation Table and marker horizons (SET-MH) sites were established along a East-West transect within the Mangrove Salinity Zone between the Buttonwood Ridge and the C111 canal. Elevation change, and vertical accretion have been measured every year since 1997. Transects were designed to evaluate not only the effect of hydrology input but also the vulnerability of scrub mangroves to current trends in sea level-rise. Here we used a network of 10 SET–MH sites distributed within the Northeastern Florida Bay landscape gradient (Figure 4) with records of 20 years in length to determine the potential for mangrove submergence due to increasing sea levels.
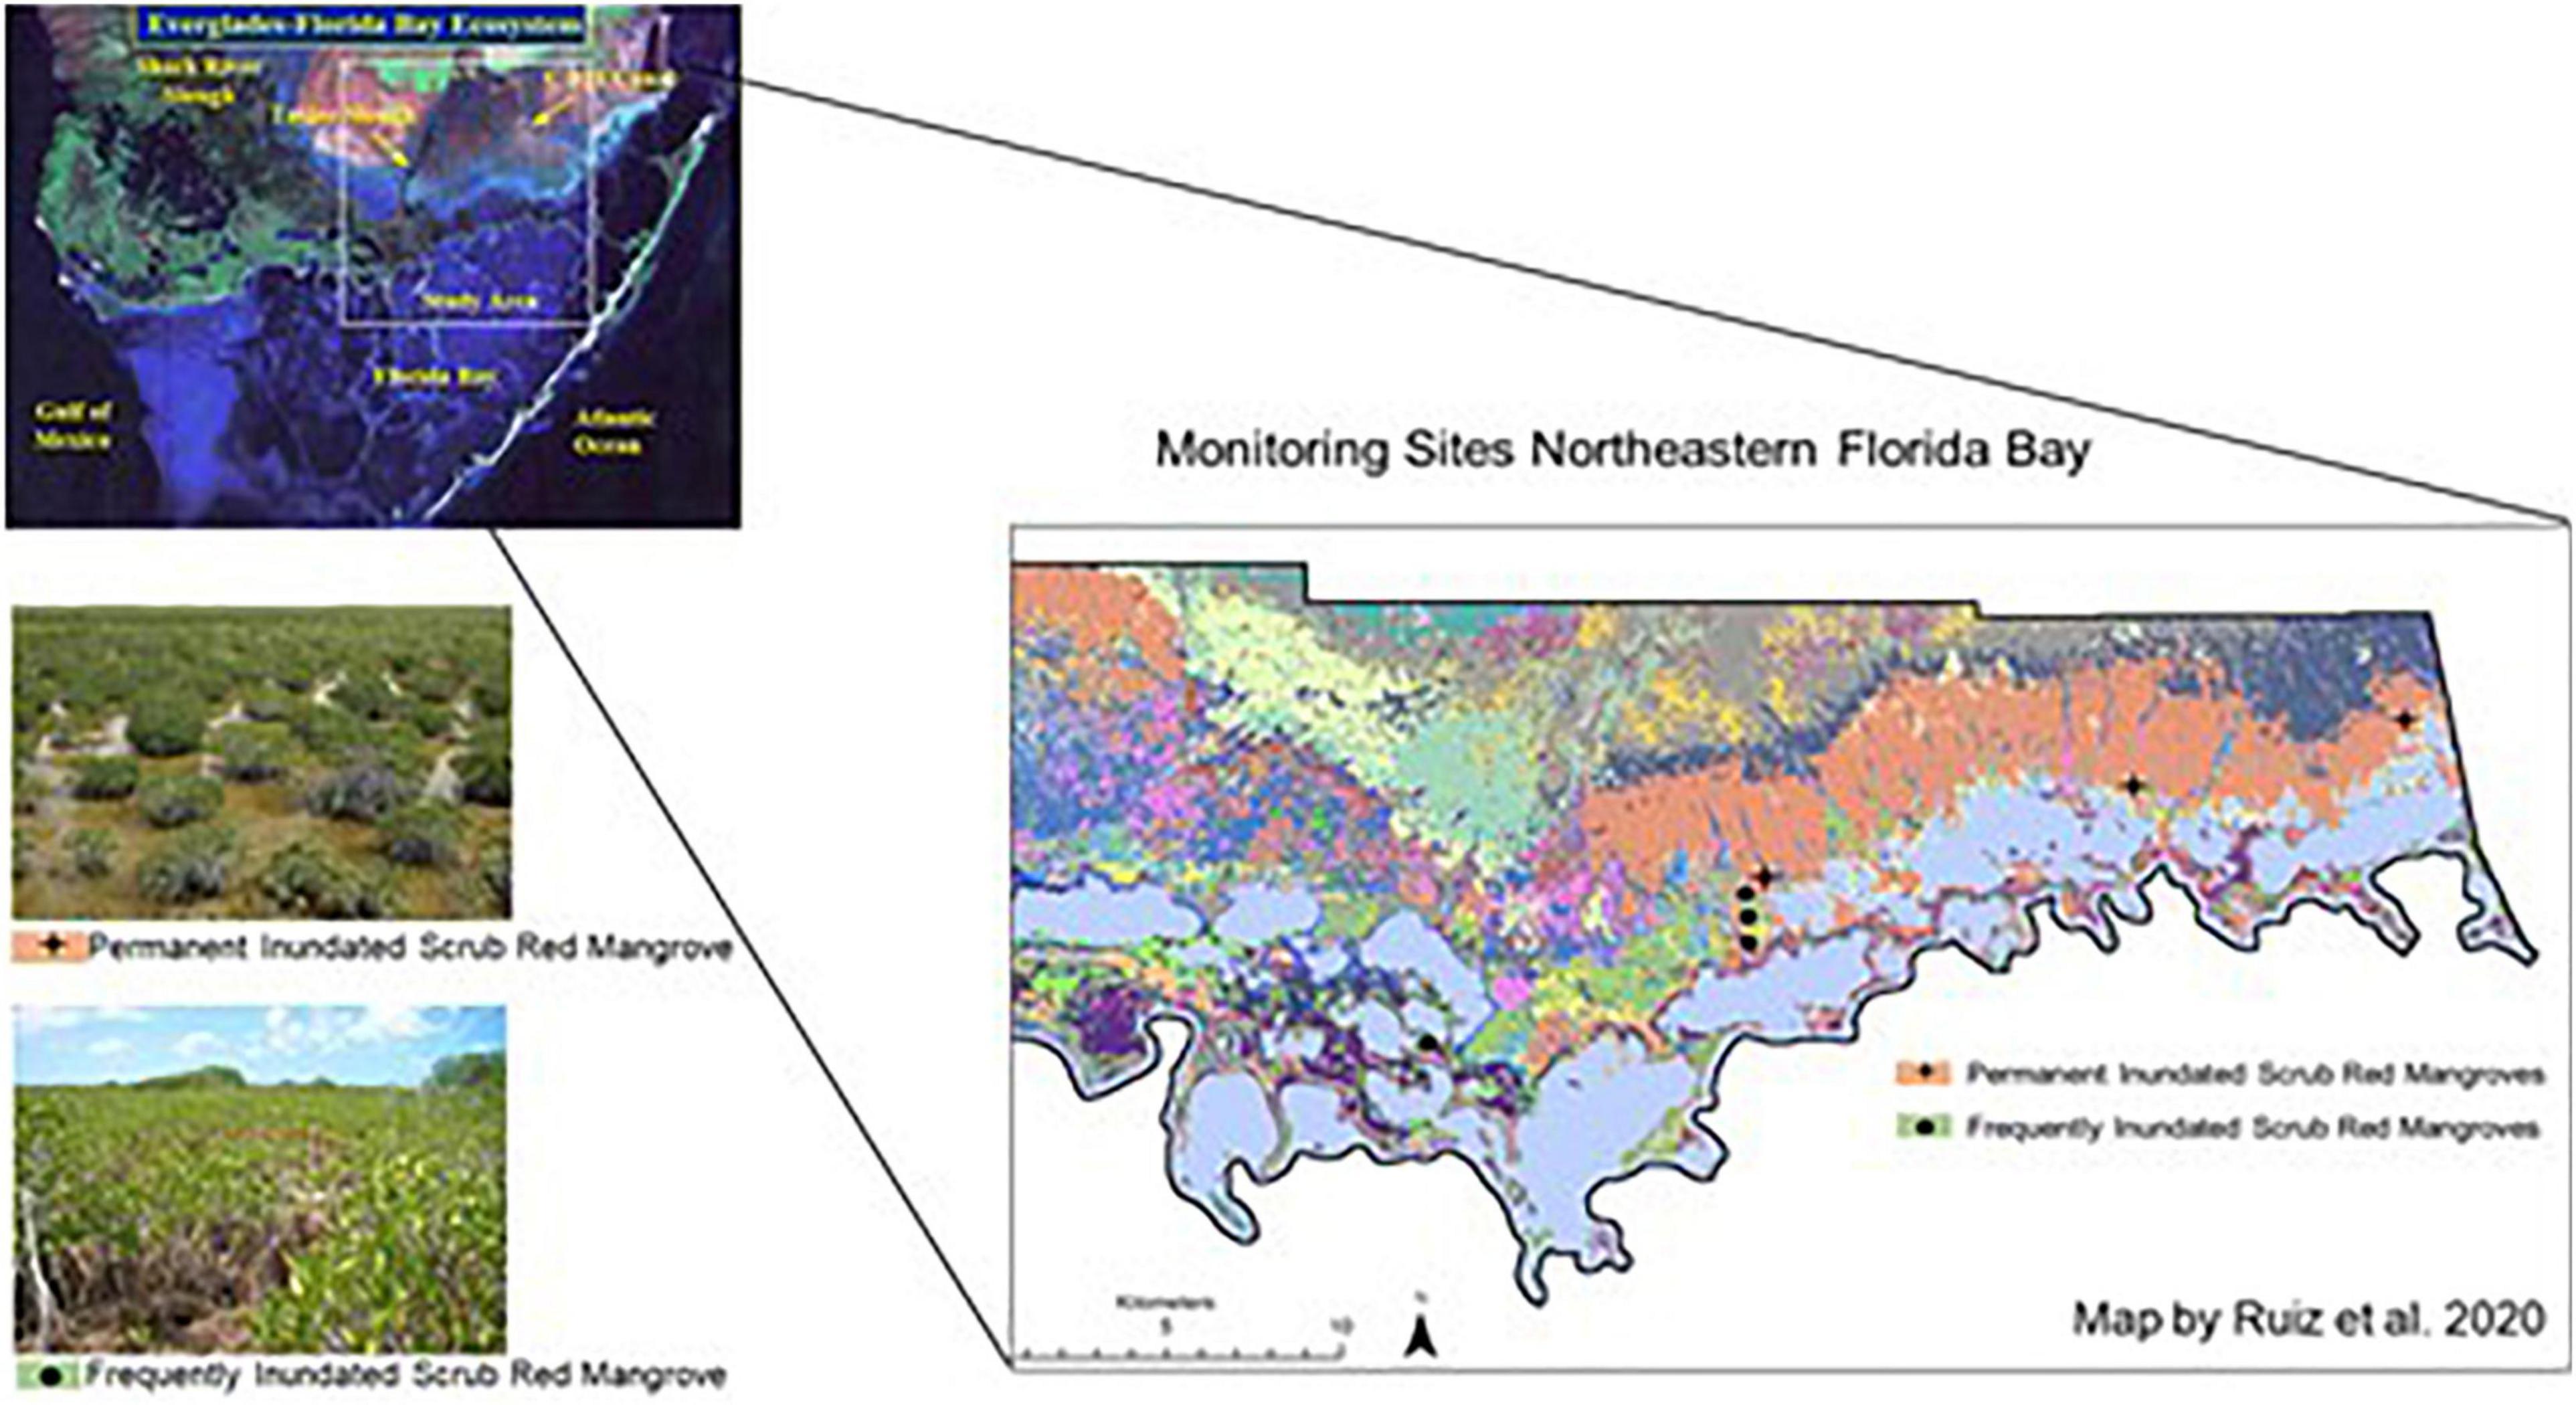
Figure 4. Location of the SET sites depicted within a much larger and spatially complex vegetation mosaic along the northern border of Florida Bay. To the left of this landscape map are two photos. The top photo is a typical low productivity dwarf red mangrove at sites with little freshwater inflows and permanently flooded by Fl Bay water. The bottom photo is a typical productive dwarf mangrove found at sites with seasonal freshwater inflows.
Wetland Habitat Transition Projections
A bathtub raster analysis method was used to evaluate how the potential for habitat transitions, mangrove mitigation and enhanced accretion rates might affect SLR (SLR) impacts. This approach is not intended to predict absolute extents and depths of inundation associated with the Southeast Compact’s sea level elevation projections but is instead intended to look at potential benefits accretion and habitat adaptations can have on preserving coastal ecosystems. Best available elevation data (see Supplementary Material) were used to calculate land surface elevation masks representing NAVD88 elevations for each of the 2070 SLR predictions to generate and calculate depth rasters. Water depth and salinity tolerance principles were applied to define transition thresholds within and between land cover categories. Depth rasters were classified into categories representing community transition thresholds (Table 4). For example, when water depths exceeded 1.0 ft for palustrine habitats, it was assumed that the environment would not be consumed by peat collapse, as a result of saltwater intrusion associated with SLR (Servais et al., 2019), and that it would instead transition to a mangrove forest (Krauss et al., 2011) and would remain a mangrove forest until water depths exceeded 2.5 ft, at which time a transition to estuarine open water was assumed. These transition thresholds were applied to the land cover data to predict community transition from their existing condition to a future 2070 condition under each SLR prediction, except for habitats not capable of transitioning due legacy effects (e.g., tidal flats) or social pressures (e.g., urban). Future conditions with accretion were developed by modifying depth rasters with sediment accretion rates as a surrogate for: (1) low TP (5–10 ppb) and moderate deliveries of freshwater (i.e., 4.1 mm yr–1) and (2) high TP (11–20 ppb) and high deliveries of freshwater (i.e., 11 mm yr–1) to the coastlines of South Florida. Accretion rates were based on SET measurements in the mangroves of Florida Bay (see “Results”) and on maximum accretion possible in an ecosystem not limited by nutrients or sediment inputs (i.e., 11 mm yr–1; Krauss et al., 2010).
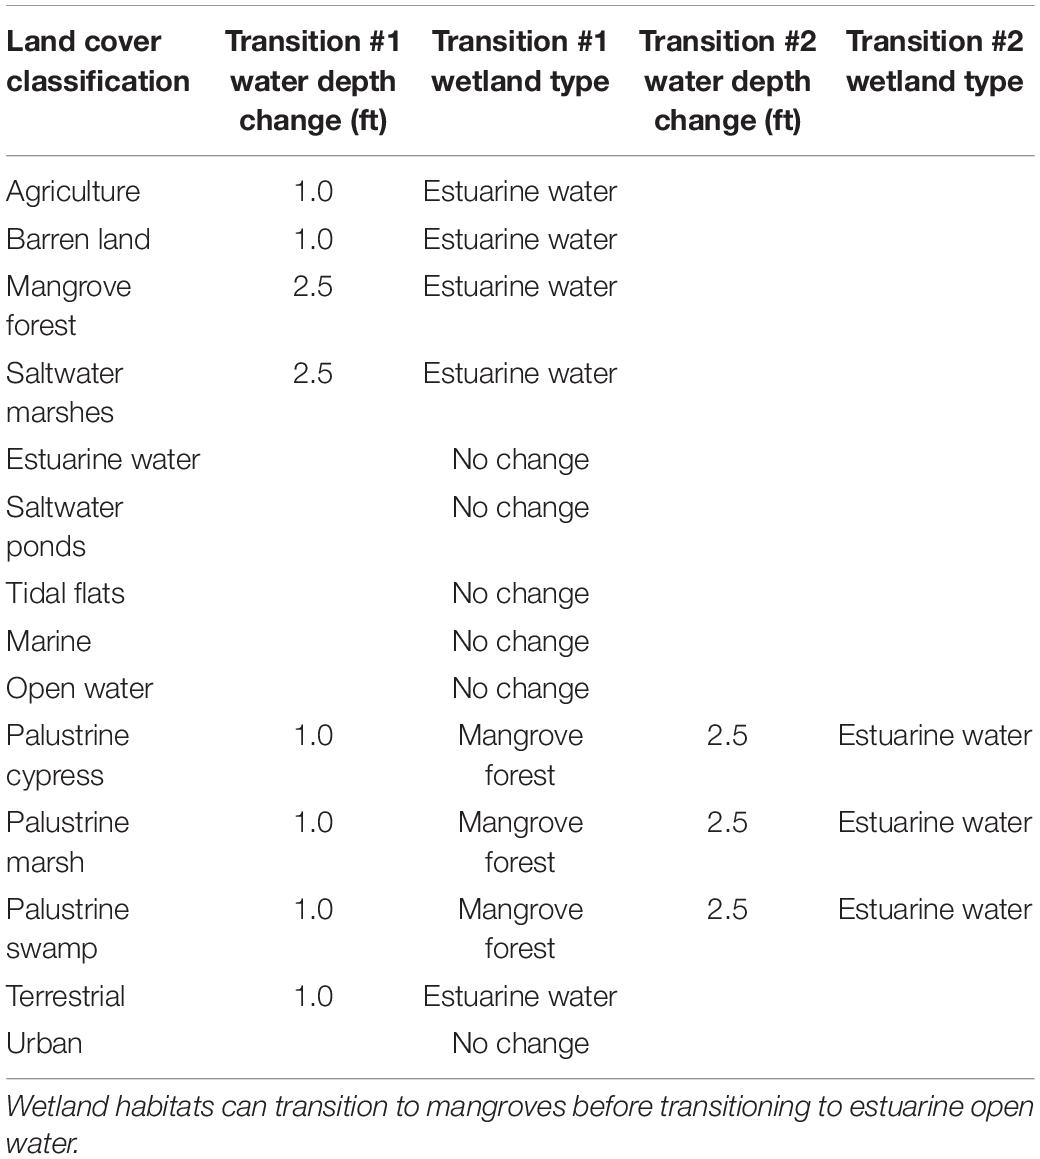
Table 4. Raster-based habitat transition depth thresholds assume that increasing depths are the result of saltwater intrusion and SLR.
The raster-based habitat transition steps were as follows:
1. An elevation mosaic of best available digital elevation models (DEM) was assembled from the data described in Table 2 to represent the bare earth elevation of the study area coastal bathymetry and terrestrial topography. This elevation mosaic was resampled to 3 m to create a study area bare earth DEM.
2. SLR masks were generated by querying the elevation mosaic with conditional statements that identified elevations within South Florida that were less than or equal to the NAVD88 elevation of the SLR prediction. These results were then converted to 32-bit floating point raster equal to the SLR prediction NAVD elevation. The resulting raster extent is the “bathtub” extent of inundation associated with that SLR prediction.
3. SLR prediction depth rasters were calculated by subtracting the study area bare earth DEM from the SLR masks.
4. Land cover data were reclassified into study land cover classes.
5. Zonal elevation statistics were calculated for each study land cover class from the 3-m study area bare earth DEM and used to check land cover classification delineations and identify and correct land cover elevation outliers.
6. Land cover polygons were assigned gridcodes and converted to 3-m rasters.
7. SLR prediction depth rasters (Step #3) were reclassified into three categories: depths greater than 2.5 feet, depths between 1 foot and 2.5 feet and depths less than 1 foot and assigned an integer gridcode.
8. Reclassified SLR prediction depth rasters were added to land cover rasters to calculate new gridcode values representing the combination of depth category and land cover class.
9. Transition rules were applied to gridcode values resulting from Step #8. Rasters were converted back to polygons and joined with a transition rule table derived from the thresholds defined in Table 4. Based on gridcode value, the resulting polygons were assigned an original land cover, land cover with transition, and a transition status (maintained, converted to Estuarine Estuarine Water or converted to mangrove forest).
10. Area statistics were calculated for original land cover and land cover with transition from the polygons resulting from Step #9. These statistics were used to quantify the areal differences between the original land cover state and the state after transition rules were applied.
11. To estimate land cover transition with accretion, two accretion rasters (0.211 and 0.55 m) were generated from the land cover data. This was accomplished by assigning two accretion attributes to each land cover class and then converting the land cover data from vector to polygon using the accretion attribute for raster generation. Areas classified as Palustrine Cypress, Palustrine Marsh, Palustrine Swamp, Mangrove Forest, Saltwater Marsh, and Saltwater Pond were assigned a value of 0.211 m NAVD for the first attribute and 0.55 m NAVD for the second attribute. All other classes were assigned a 0 value. The accretion rasters resulting from the vector to raster transition were subtracted from the SLR prediction depth rasters to produce new SLR prediction depth rasters corresponding to the 0.211 and 0.55 m accretion magnitudes.
12. Steps #7 through #10 were repeated using the SLR prediction accretion depth rasters.
Results
Inundation Extent
The distribution of SLR Inundation across space, highlighted in Figure 2, is the total inundation expected up to 2070. The actual areal extent of this inundation is summarized in Table 5, where the total area impacted was over 50% no matter the rate of SLR. As expected, due to the extreme flatness: of southern Florida, all the wetland habitats are inundated, At the coastline, 2,130 sq. km of mangrove forest were inundated (i.e., impacted) by a SLR of only 0.9 m by year 2070. This is 83% of the total mangrove landscape. With a SLR of 1.1 m, 99.8% of the current mangrove landscape was impacted. This same degree of inundation was found for the saltwater marsh habitats. The Palustrine habitats showed a higher degree of variability than the coastal habitats. The highest extent of palustrine inundation was found for marsh habitats, where 937 sq. km (21%), 1,578 sq. km (35%), and 1,978 sq. km (44%) of the current aerial extent of 4,472 sq. km was inundated by 0.27, 0.76, and 1.1 m of SLR by 2070, respectively. In general, the high elevations for most of the agriculture, barren land, terrestrial and urban categories prevented them from being inundated in the areas around the Caloosahatchee estuary along the west coast, along the urban lower east coast areas and the St. Lucie estuary along the east coast (see Supplementary Materials).
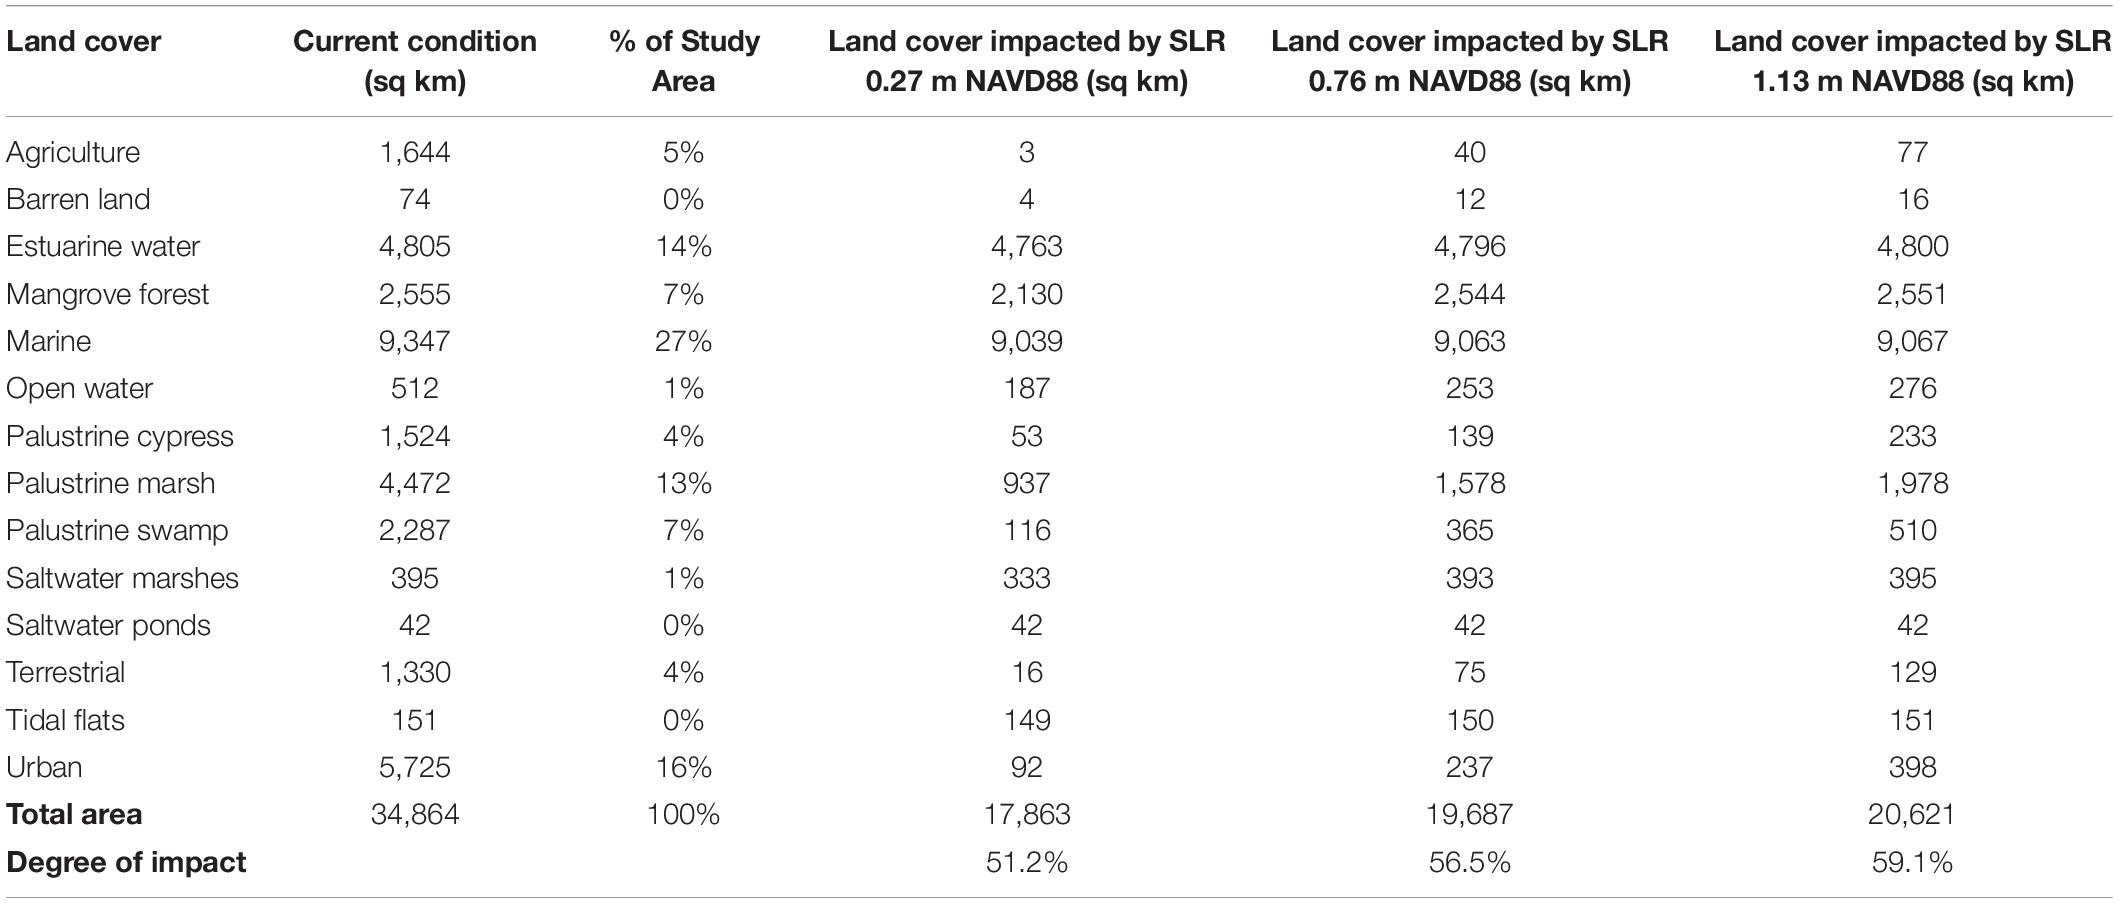
Table 5. Areal extent of inundation within the study area.
Sediment Elevation Trends
Organic matter accretion and shallow subsidence dominate the belowground processes of soil formation in the Florida Bay coastal mangrove forests. Soil subsidence or expansion is the result of elevation change minus accretion rate, incorporating both surface and subsurface processes. Figure 5 illustrates elevation changes and soil accretion rates in two hydrological mangrove environments in South Florida, showing a higher elevation change rate (3.9 mm yr–1) at frequently flooded sites compared to permanently flooded sites (1.7 mm yr–1). We used an accretion rate of 4.1 mm yr–1, calculated from a one of our permanently flooded SET sites in Taylor Slough, as a potential maximum elevation change rate for all marshes receiving some freshwater inputs, for calculating habitat transition trends (see below). Surface elevation table-marker horizon (SET-MH) data indicate mangrove sites with no or little freshwater inputs are not keeping pace with SLR rates, underlying the importance of microtopography and hydrology as environmental factors that needs to be more fully investigated to more precisely determine the vulnerability of mangrove forests in surviving future projections of SLR in south Florida.
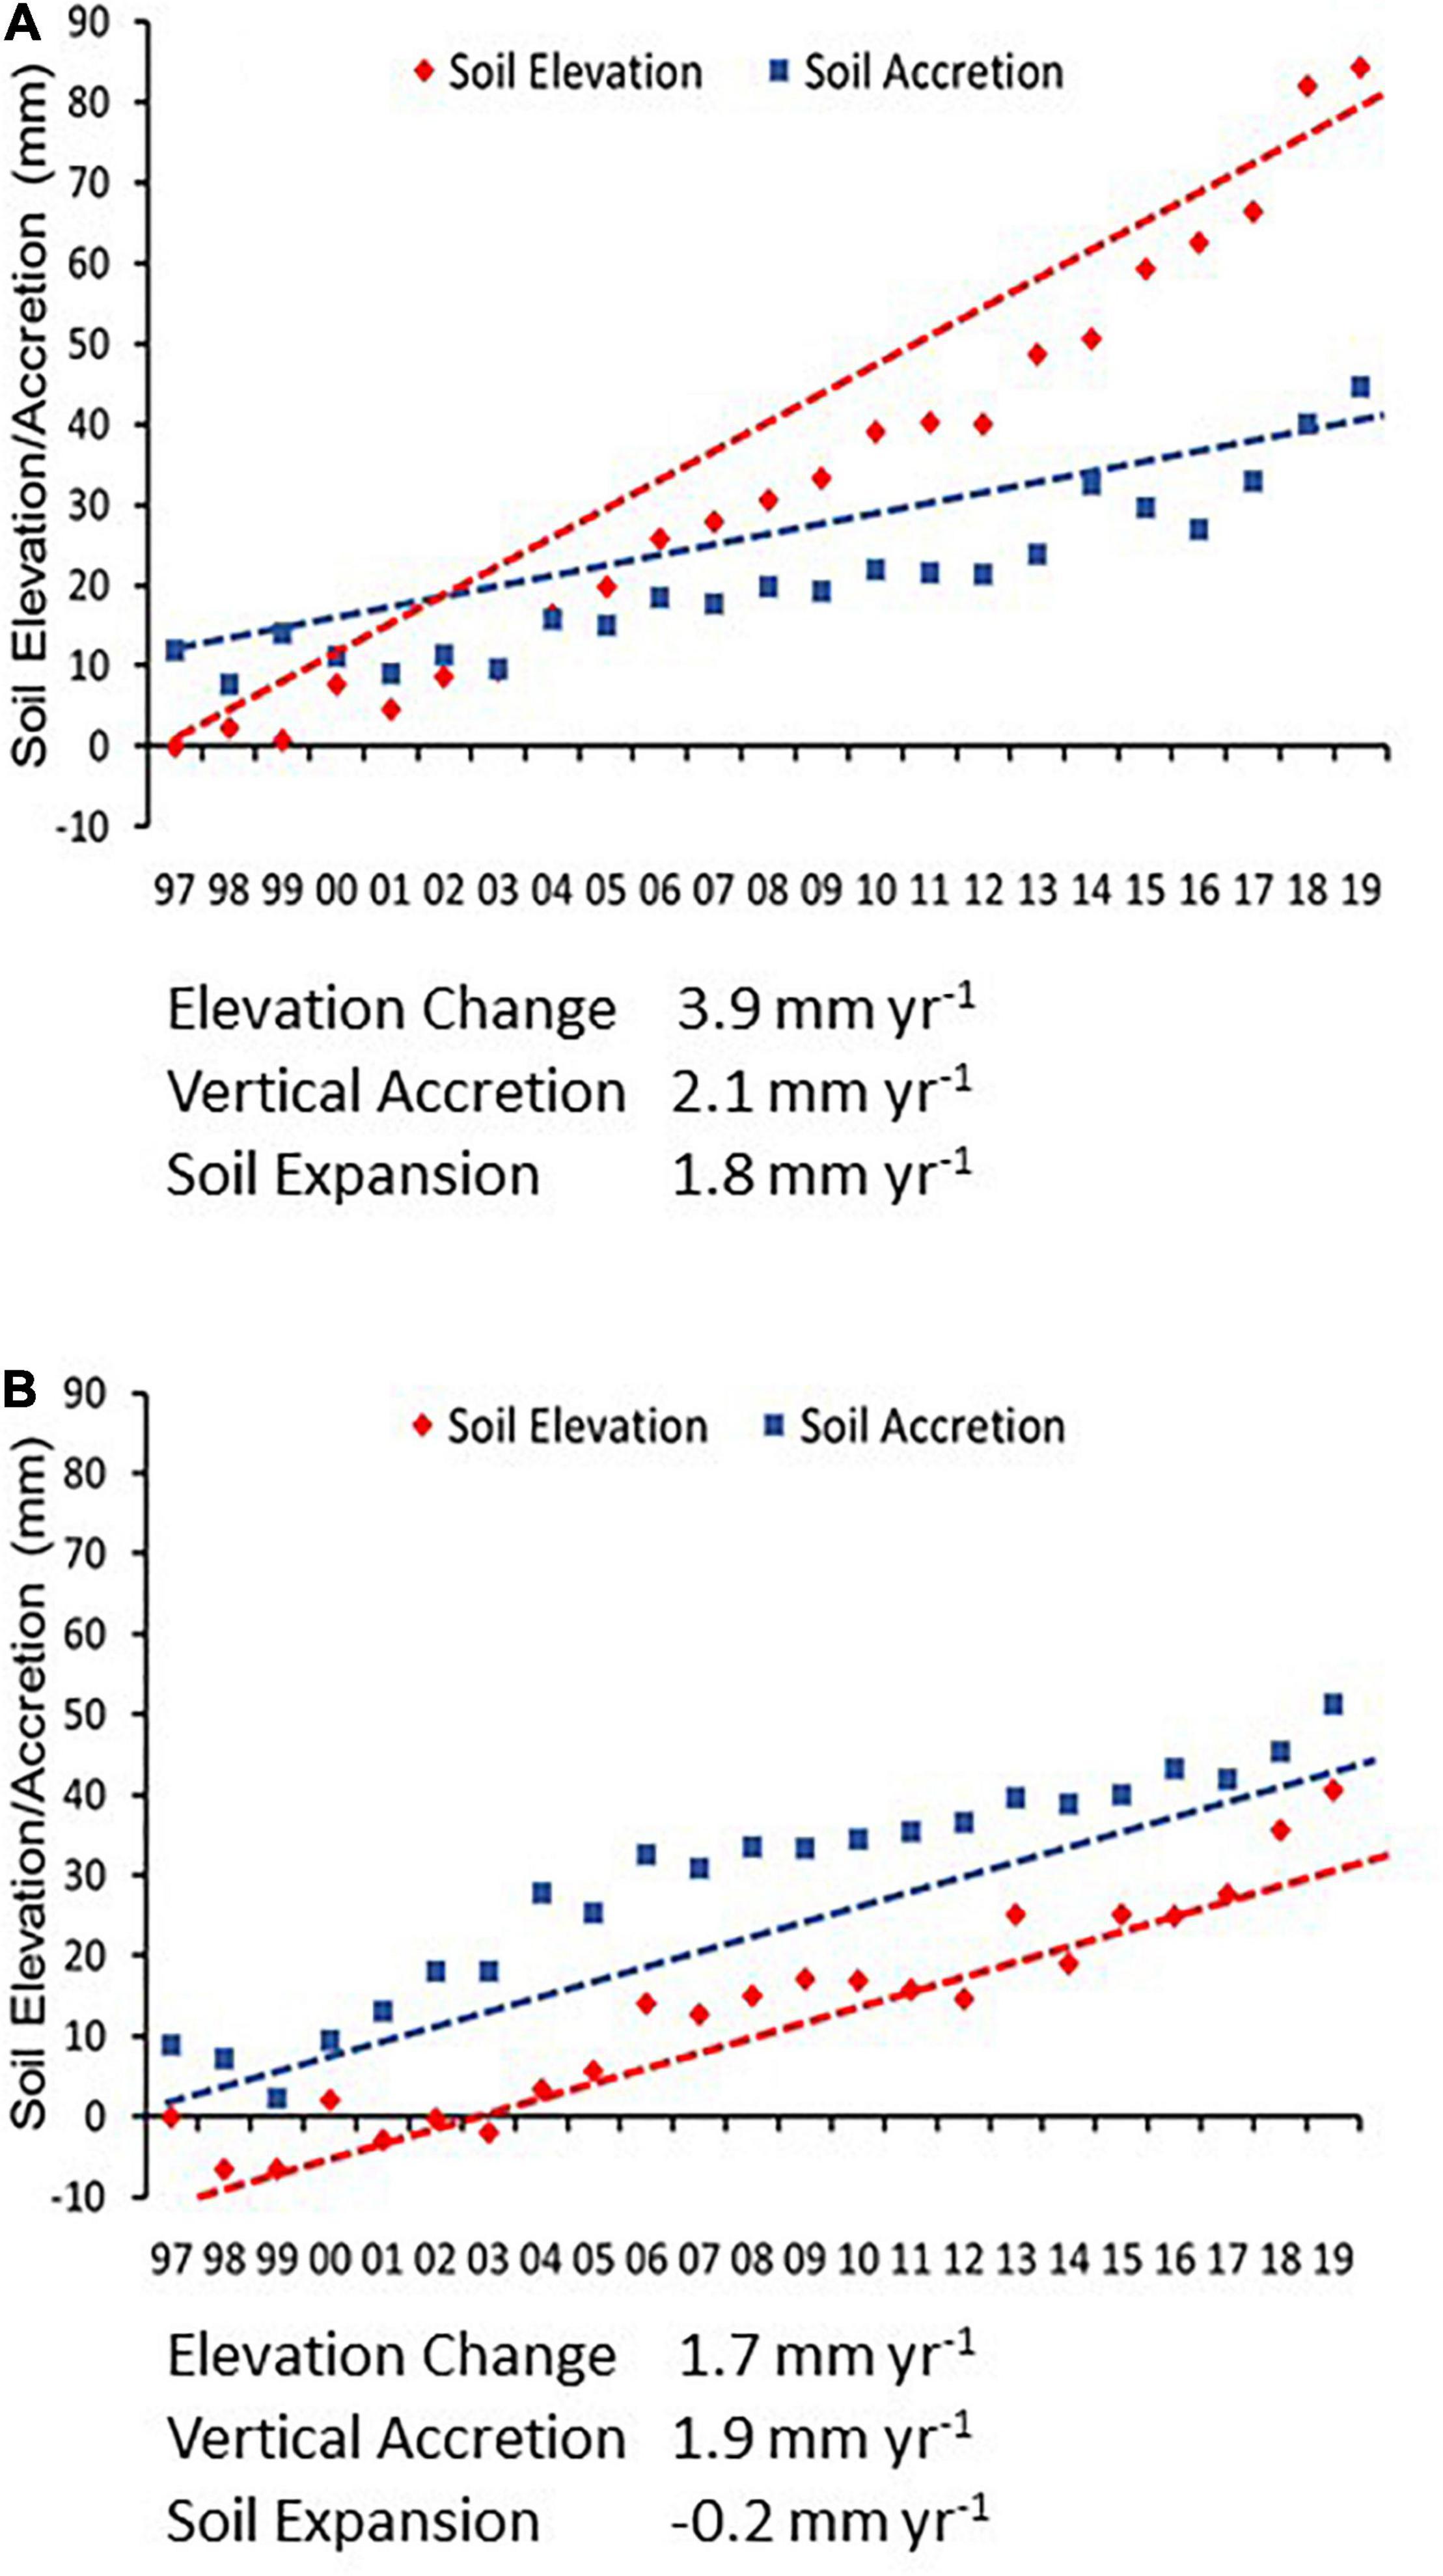
Figure 5. Soil Elevation and soil accretion in Scrub Mangrove Forests in Northeastern Florida Bay. Data are shown for two different hydrological regimes: (A) frequently flooded, where freshwater flows are similar to what is expected with CERP and (B) permanent flooded, where freshwater inflows are minimal. Period of record is from 1997 to 2019.
Habitat Transition Trends
With a Sea Lever Rise of 0.27 m by 2070 and without accretion there was a transition of total wetland cover to estuarine water of 46 sq km (Table 6). However, with an accretion value of 0.21 m by 2070, there was a transition of wetland cover to estuarine water of only 18 sq km and with an accretion of 0.55 m by 2070, there is transition to estuarine water of only 11 sq km. Analysis also showed that without accretion, mangrove forests gained at the expense of palustrine wetlands, which lost more than 200 sq km of habitat. With accretion at either 0.211 or 0.55 m by 2070, mangrove forests and all palustrine wetlands maintained, approximately, their original inundated land cover. These results emphasize the importance of managing for soil accretion if coastal wetlands are to keep up with a SLR projection of 0.27 m by 2070.
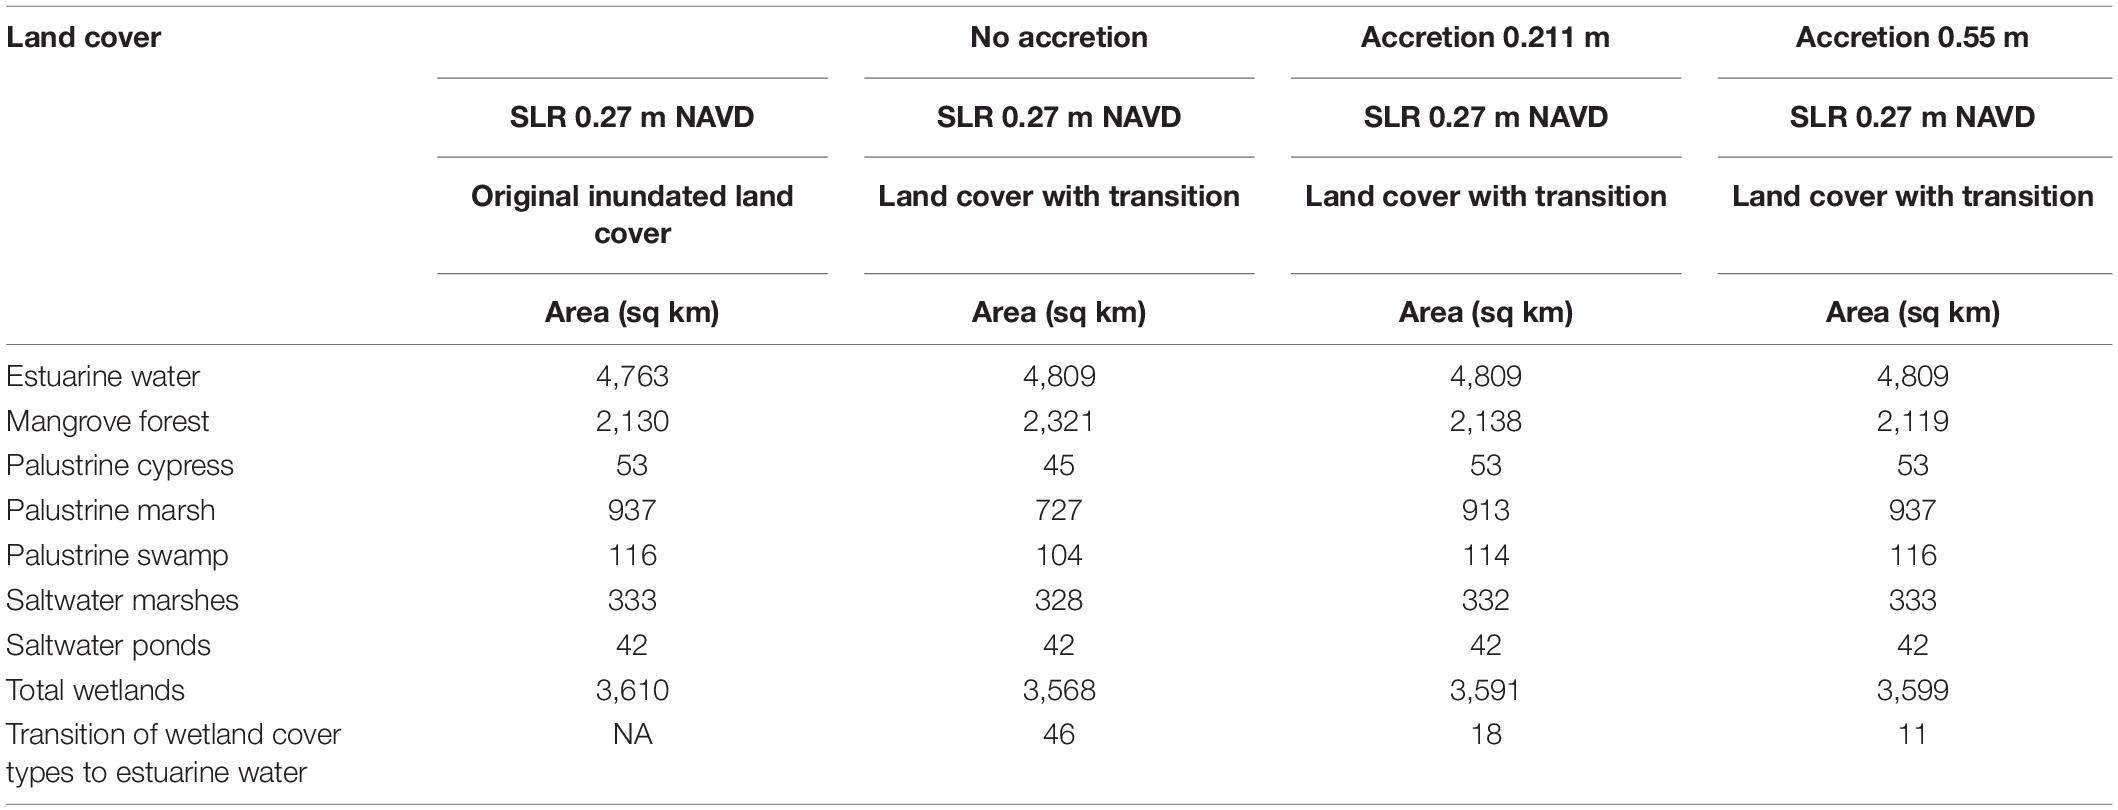
Table 6. Land cover changes in the coastal study area as a function of no accretion and total accretion elevations of 0.21 and 0.55 m, and a SLR of 0.27 m by the year 2070.
With a Sea Lever Rise of 0.76 m by 2070 and without accretion there was a transition of total wetland cover to estuarine water of 1,160 sq km (Table 7). However, with accretion values of 0.211 and 0.55 m by 2070, there was a transition of wetland cover to estuarine water of 349 and 41 sq km, respectively. Further analysis indicated that without accretion, mangrove forests gained land cover (3,052 sq km) at the expense of the three palustrine wetlands, with palustrine marsh losing about 1,200 sq km and palustrine swamp losing about 290 sq km of land cover. With an accretion of 0.211 or 0.55 m, the transition of wetland cover to open estuarine water decreased to 349 and 41 sq km, respectively. Also, with an accretion of 0.55, all three palustrine environments generally maintained their original inundated land cover.
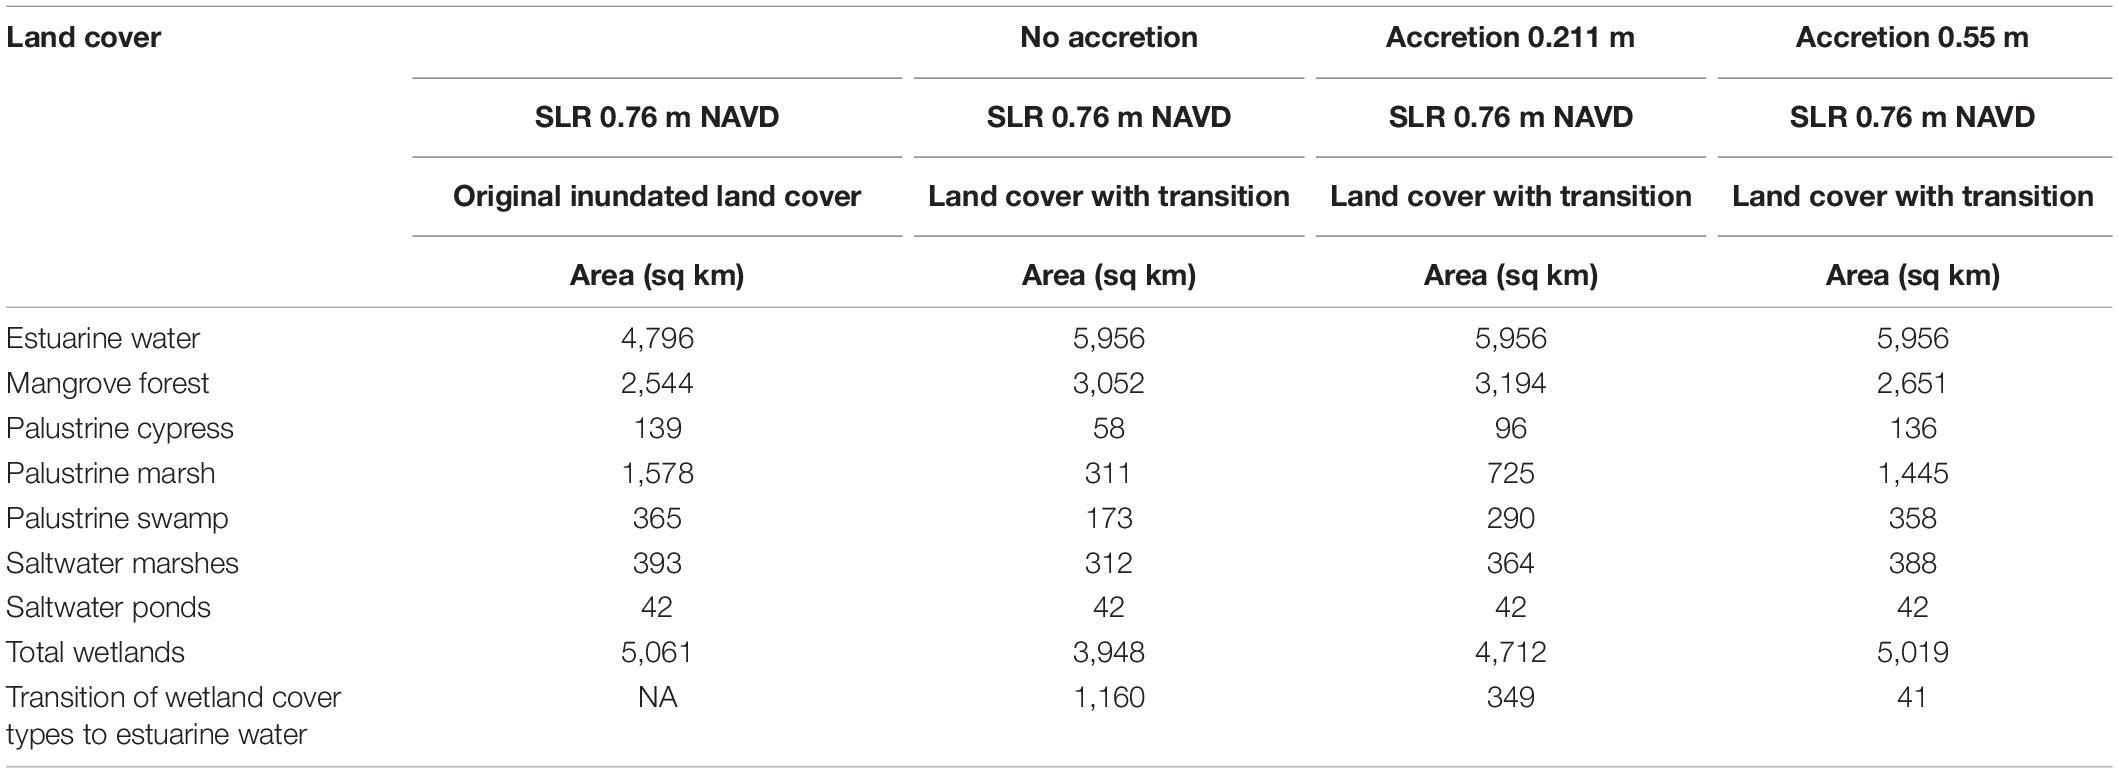
Table 7. Land cover changes in the coastal study area as a function of no accretion and total accretion elevations of 0.21 and 0.55 m, and a SLR of 0.76 m by the year 2070.
With a Sea Lever Rise of 1.13 m by 2070 and without accretion there was a transition of wetland cover to estuarine water of 3656 sq km (Table 8). However, with accretion values of 0.211 and 0.55 m by 2070, the transition of wetland cover to estuarine water was 2,060 and 422 sq km, respectively. Analysis also indicated that without accretion, all coastal communities, particularly mangrove forest and palustrine marsh, lost significant land cover to estuarine water, which in-turn increased to 8,455 sq km from the current condition of 4,800 sq km; a 176% increase. With an accretion of 0.211 m by 2070, most of the land cover transition was from palustrine marsh and palustrine swamp to mangrove forest, which in-turn increased its cover by 168% relative to mangrove forest cover without accretion (i.e., 2,492 vs. 1,478 sq km). With an accretion 0.55 m, there was an increase of land cover for most coastal communities, particularly for palustrine marsh. Higher accretion rates allowed coastal communities to transition from one coastal community to another instead of losing wetland to estuarine waters.
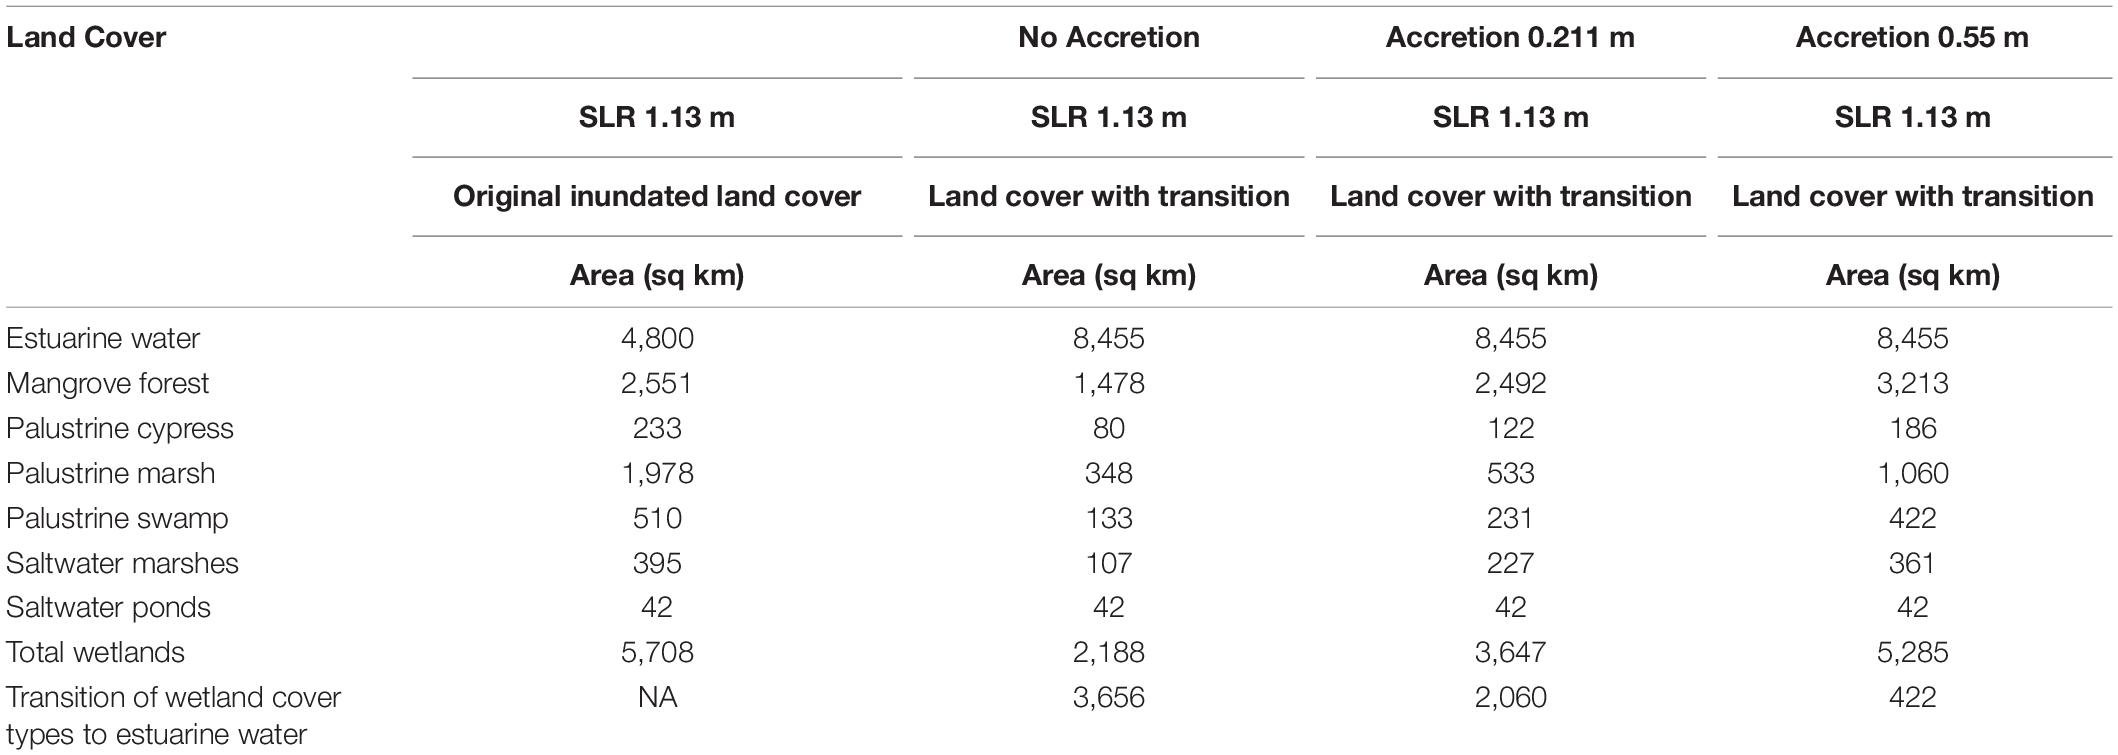
Table 8. Land cover changes in the coastal study area as a function of no accretion and total accretion elevations of 0.21 and 0.55 m by 2070, and a SLR of 1.13 m by the year 2070.
Spatially explicit representation of the data summarized in Tables 6–8, shown in Figures 6, 7, indicated that wetland transitions to open estuarine water is greatly diminished when palustrine marsh and mangrove forests can build peat. When accretion accumulated to 0.211 m by 2070 (this study) and SLR was only 0.27 m by 2070, the landscape of marshes and mangroves was more extensive and more broadly distributed than the current condition (compare Figures 6A,B). However, with sea levels of 0.76 m higher than current conditions by 2070 (Figure 6C) or 1.13 m higher than current conditions by 2070 (Figure 6D) there was a significant loss of mangrove forest and palustrine marshes all along Florida Bay and the southwestern region of Florida in an area known as the Ten Thousand Islands region.
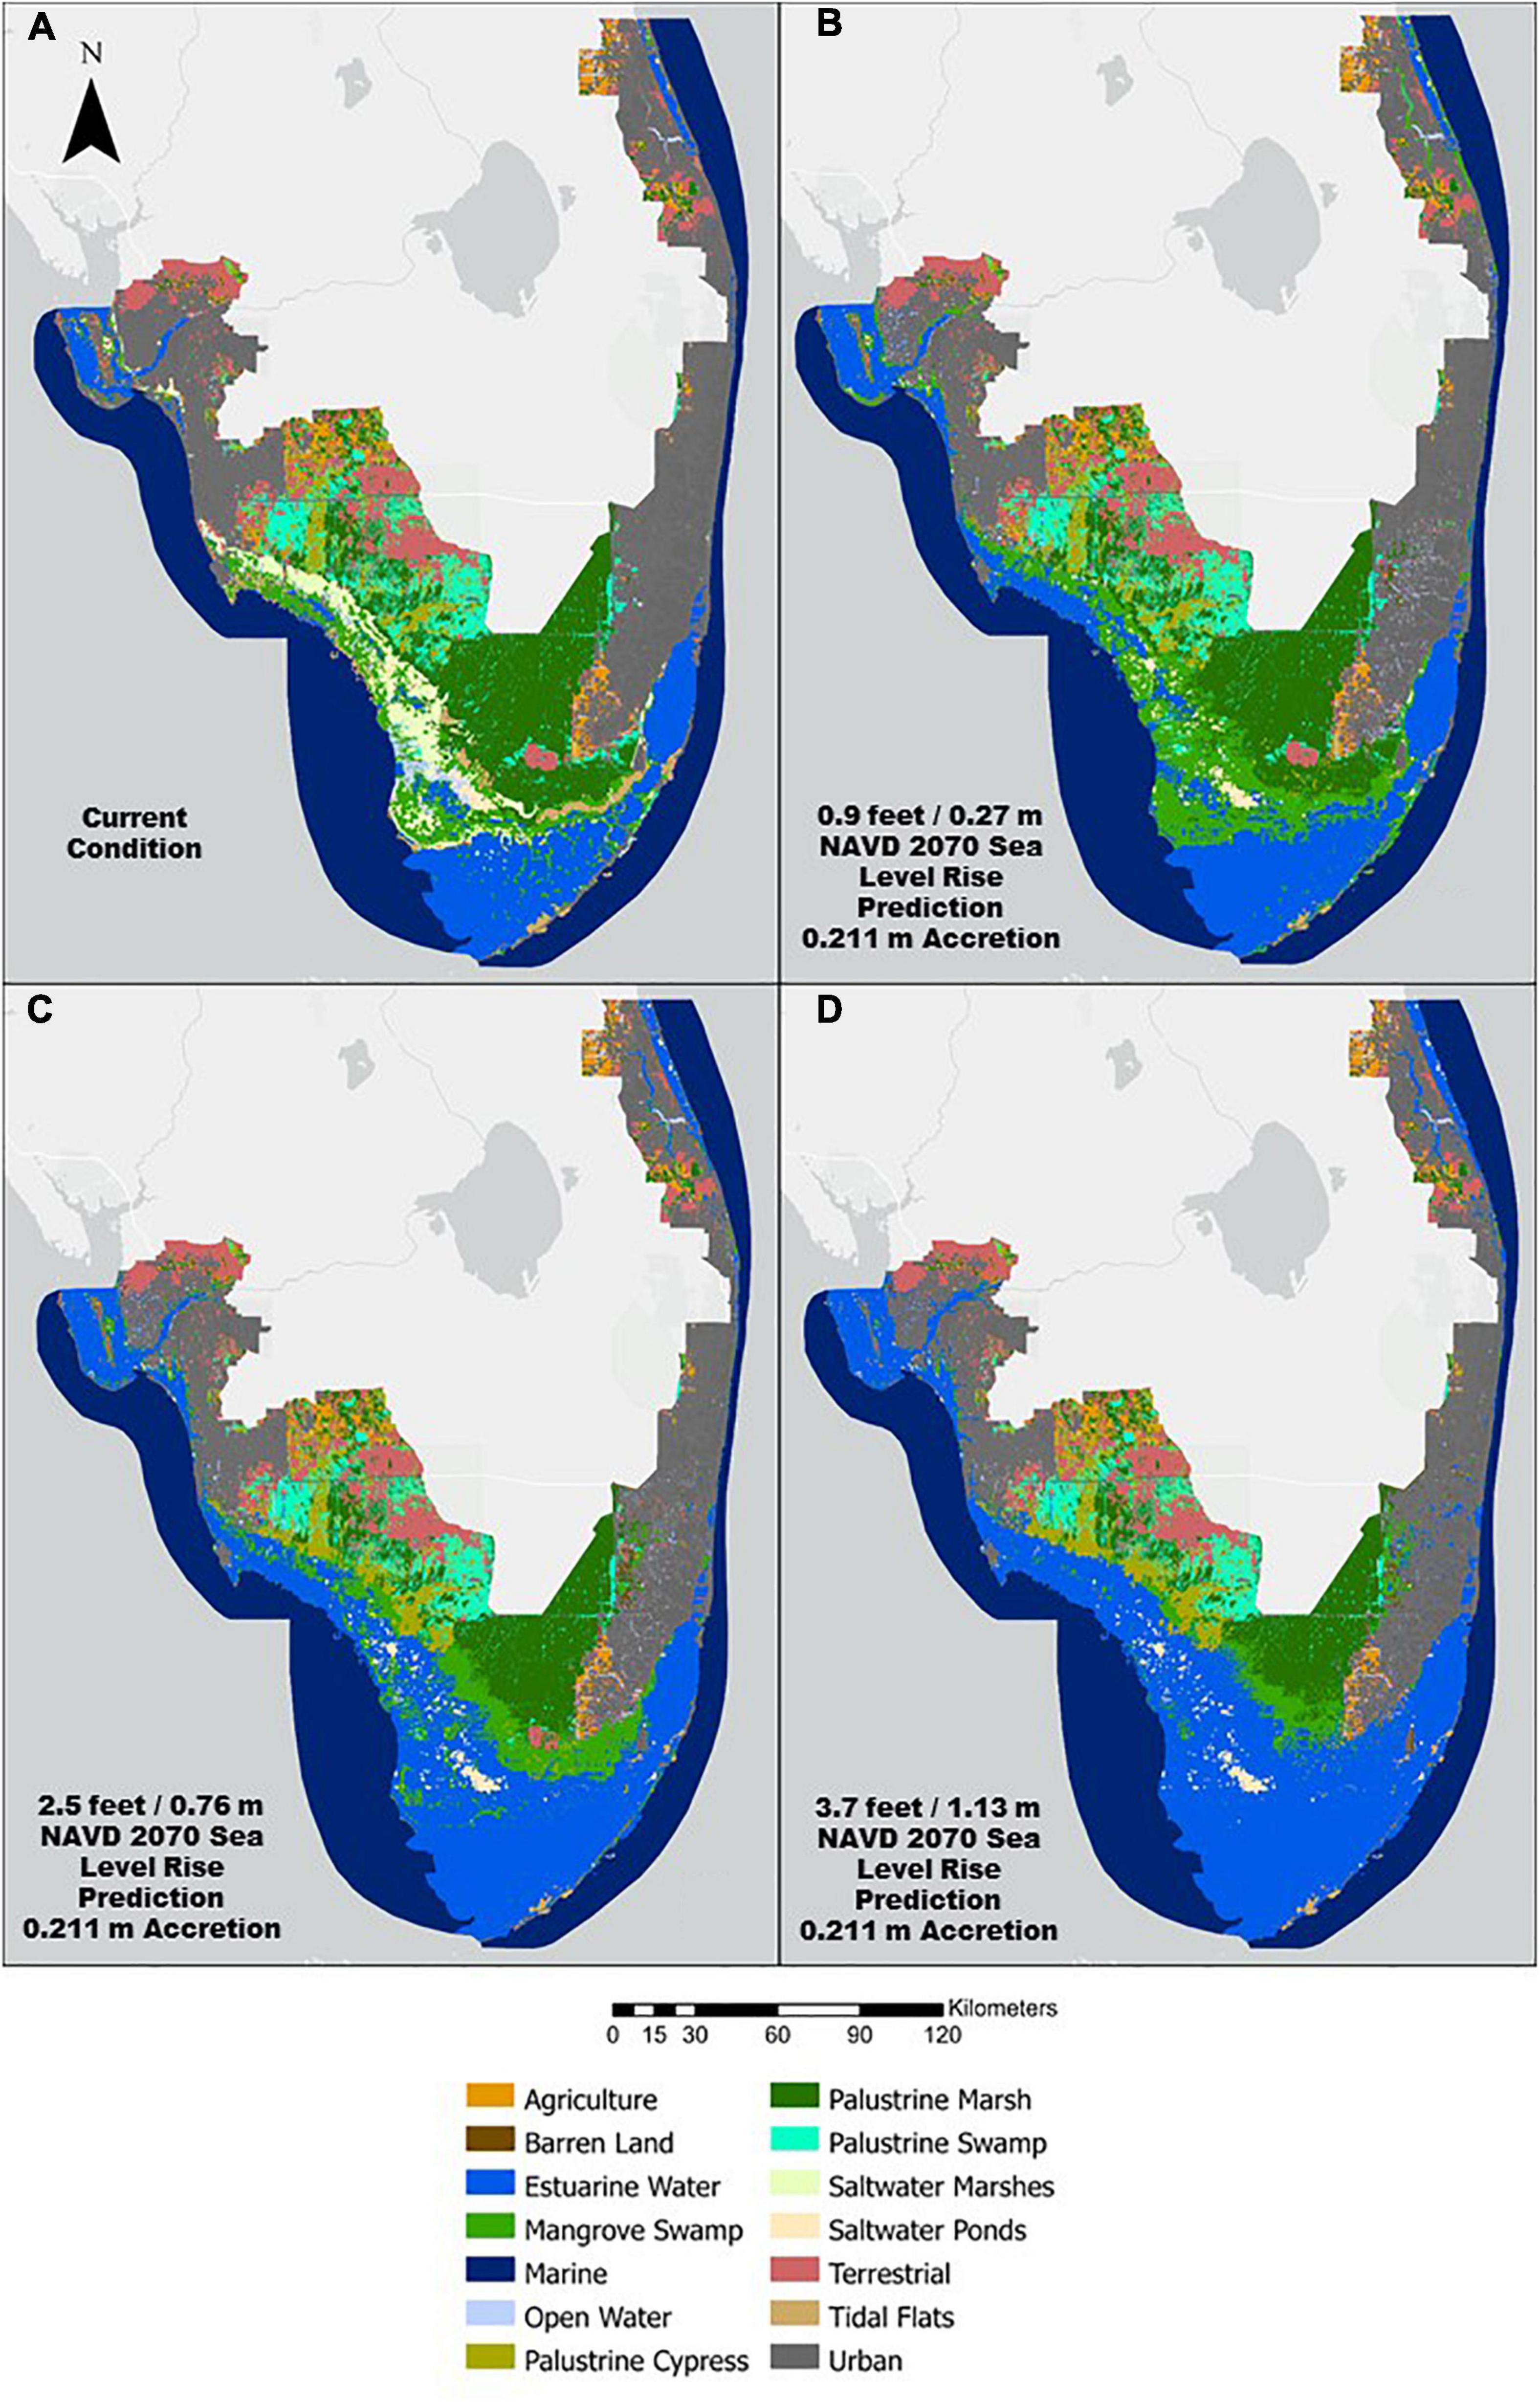
Figure 6. Results of the habitat transition model and a wetland annual accretion rate of 4.2 mm yr–1. (A) Current habitat distribution; (B) Projected habitat distribution by 2070 with a SLR of 0.27 m (0.9 ft); (C) Projected habitat distribution by 2070 with a SLR of 0.76 m (2.5 ft); (D) Projected habitat distribution by 2070 with a SLR of 1.1 m (3.7 ft).
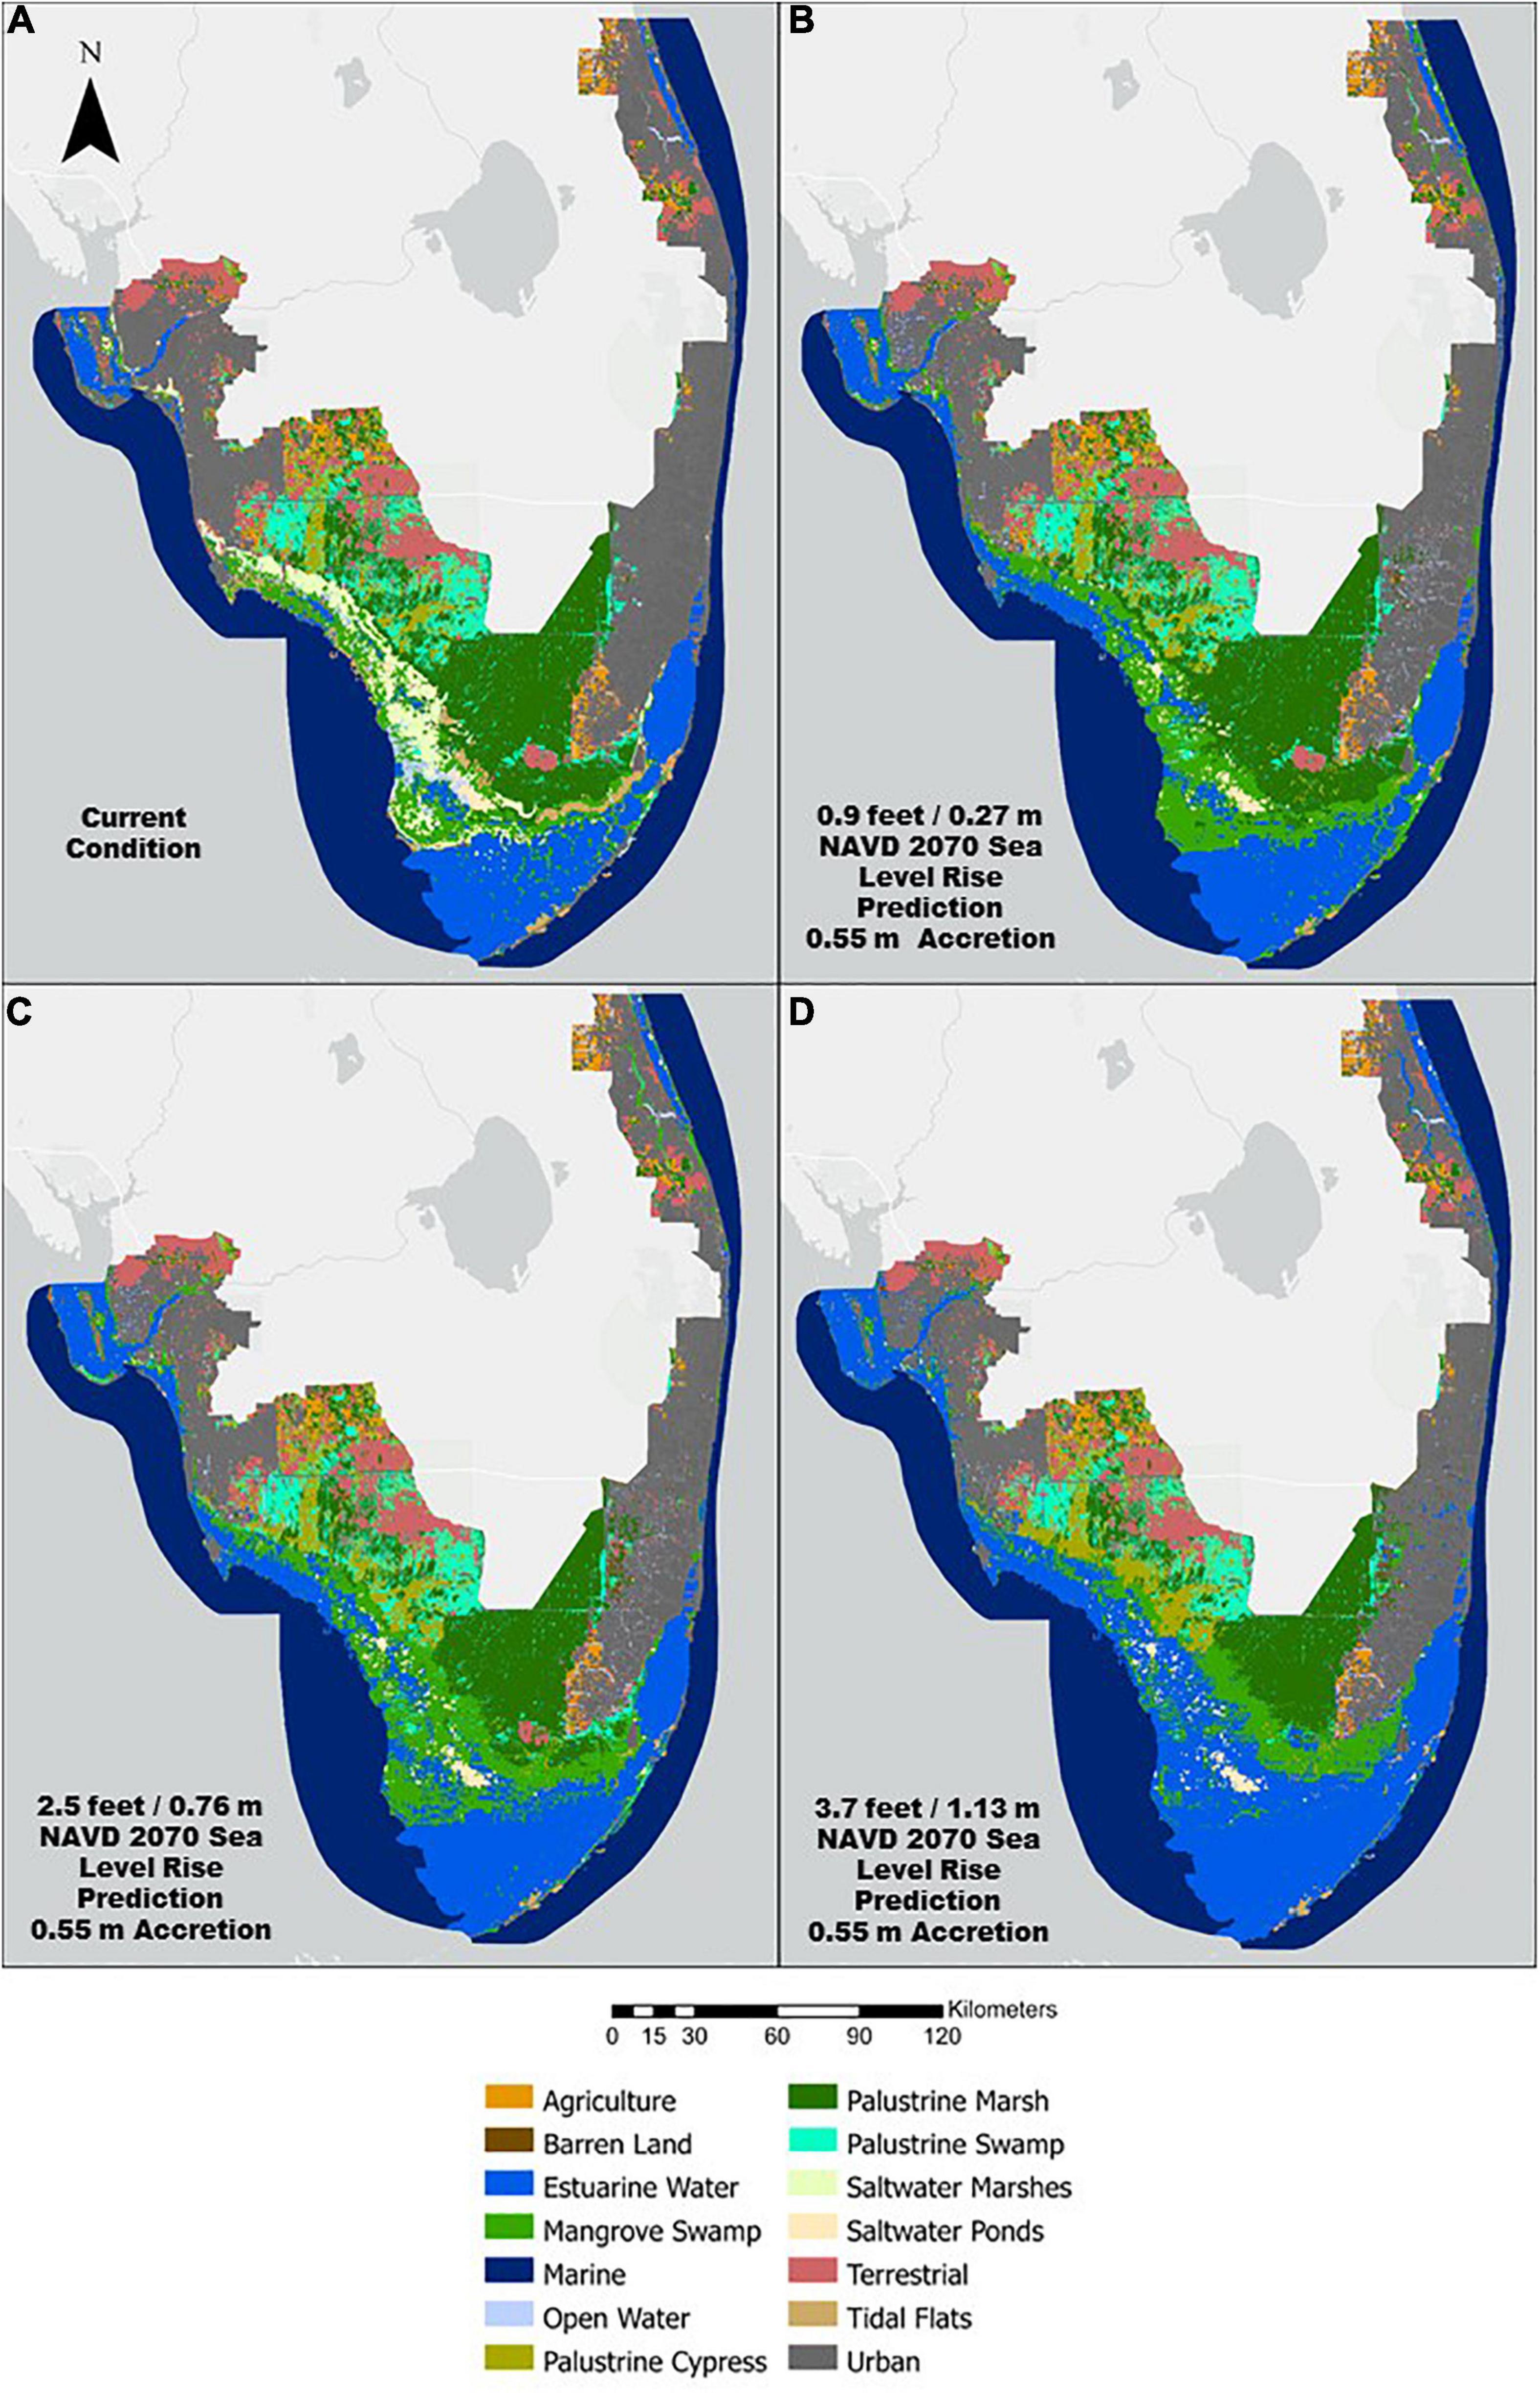
Figure 7. Results of the habitat transition model and a wetland annual accretion rate of 11 mm yr–1. (A) Current habitat distribution; (B) Projected habitat distribution by 2070 with a SLR of 0.27 m (0.9 ft); (C) Projected habitat distribution by 2070 with a SLR of 0.76 m (2.5 ft); (D) Projected habitat distribution by 2070 with a SLR of 1.1 m (3.7 ft).
When accretion across the palustrine and coastal communities totaled 0.55 m by 2070 (Krauss et al., 2010; Fu et al., 2018) and SLR was only 0.27 m by 2070, the landscape distribution of mangrove forest was much more extensive than the current condition (compare Figures 7A,B). Under this low SLR scenario the mangroves were able to migrate inland while maintaining the current coastline. Even under a more significant SLR of 0.76 m by 2070, the mangrove forest community had the potential to maintain most of the current coastline. It was only under the more extreme scenario of 1.13 m increase in sea level by 2070 that we saw the loss of the wetland coastline everywhere. Yet even here there was significant evidence of mangrove migration into the freshwater wetlands upstream. Figures 6D, 7D indicated a dramatic increase of open estuarine waters at the expense of the coastal plant communities, particularly when accretion was 4.1 mm yr–1 (0.211 m by 2070). With a SLR of 1.13 m by 2070, most of the coastal communities and palustrine habitats were not able to transition to anything other than open estuarine water.
Discussion
Peat Collapse
This evaluation of SLR with a raster-based habitat transition model has an implicit assumption that inundation with saline waters will eventually lead to the peat collapse of the coastal marshes if inundation is too high to be mitigated by above and belowground soil accretion. The term “peat collapse” has been used to describe a shift in soil C balance, leading to a net loss of organic C and soil elevation, culminating in a transition of vegetated freshwater marshes to open water (Chambers et al., 2019). Peat collapse is a unique physical and biological process of shallow subsidence in highly organic soils characterized by a loss of soil strength and structural integrity that leads to elevation loss below the threshold for emergent plant growth and natural recovery (Chambers et al., 2019). The process of peat loss has been documented in various coastal wetlands (e.g., De Laune et al., 1994; Cahoon et al., 2003; Day et al., 2011; Voss et al., 2013) and has been attributed to a number of factors including changes in microbial processes, increased sulfate reduction, inadequate plant production, root death, and vegetation damage (Stagg et al., 2017; Chambers et al., 2019). While recent research is beginning to develop a mechanistic understanding of peat collapse in the Everglades (e.g., Wilson et al., 2018; Servais et al., 2019; Wilson et al., 2019), uncertainties remain particularly in regards to how freshwater and oligohaline peat soils respond to salinization and the relevance of salinity-induced pore dilation for matrix deformation in peat soils.
A critical concern for the management of freshwater and coastal mangrove ecosystems is the potential for inland freshwater marshes, exposed to increasing sea-level rise, to collapse (National Academies of Sciences Engineering and Medicine, 2018) due to soil salinization and root death (Chambers et al., 2013; Kirwan and Megonigal, 2013; Stagg et al., 2017). If mangrove forests cannot maintain wetland functionality by expanding into regions unable to adapt to the salinity changes associated with increasing sea levels, then significant coastal wetland loss may occur, dramatically altering and increasing the vulnerability of the south Florida coastline.
Soil Elevation and Accretion
In South Florida long-term rates of elevation change and accretion have a strong reliance on belowground biomass and autochthonous processes to maintain elevation. Storm surges can deposit 10–80 mm in southwest mangrove forests and ∼5 mm in Florida Bay coastal forests (Koch et al., 2014; Feher et al., 2019). Storms can also destabilize sediments especially when they cause high forest mortality and peat collapse, usually taking 3-years to recover (Cahoon et al., 2003). To put these data in a regional perspective, mangroves in the wider Caribbean typically kept pace with SLR rates of 2–4 mm yr–1, but not at 5 mm yr–1 during the Holocene period (McKee et al., 2007). While McKee et al. (2007) found fringe forests in Belize could gain elevation at an average rate of 4.1 mm yr–1 (1.6 mm from accretion and 2.5 mm from subsurface expansion), Wanless et al. (1994) argue based on the past geologic record that any sustained SLR rates at or faster than 2.3 mm yr–1 will ultimately cause complete coastal erosion in South Florida. The coastal Everglades mangrove forests would move inland as the coastal zone they currently occupy converts to open water and mudbanks.
Another important point to consider when looking at habitat transitions is the increase in forest floor elevations with hurricanes. For example, the Wilma storm surge in 2005 deposited ∼5 to 10 mm of sediment at the Florida Bay sites highlighting the importance of hurricane tide surge for transporting sediment to microtidal mangrove forests (Castaneda-Moya et al., 2010). Elevation changes in the larger stature southwestern Florida peninsular coastal mangrove forests (Feher et al., 2019; Howard et al., 2020) showed that these forests had a high increase in soil elevation right after Hurricane Irma but the long-term elevation change rates of ∼1–3.9 mm yr–1 were similar to that of the smaller microtidal forests of Florida Bay (Table 9). These data from south Florida mangrove forests indicate that on average mangrove forests can keep pace with current SLR but would have difficulty at rates projected for 2070. Although our habitat transition projections cannot be used to direct restoration it does indicate that we should expect significant shoreline transgression and ecosystem degradation without restoration and that we can preserve a high degree of ecological function, shoreline protection and habitat quality with restoration.
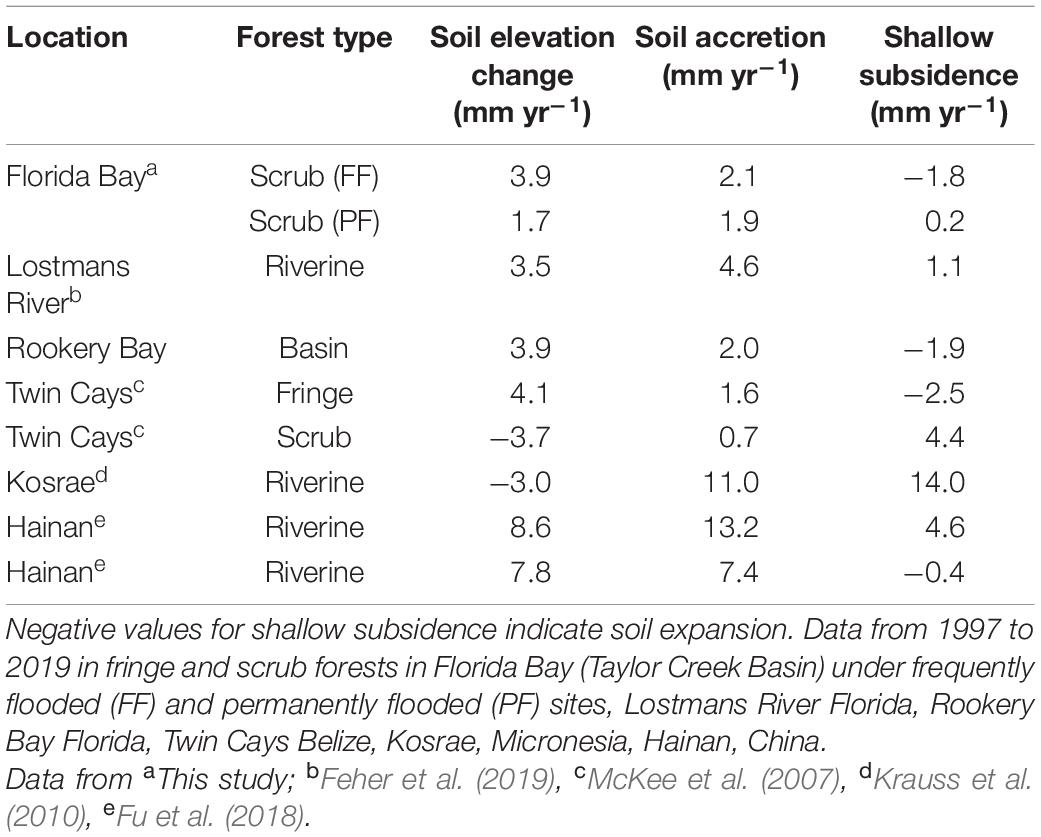
Table 9. Comparison mangrove forests elevation change in mm yr–1 from scrub, riverine, fringe and basin mangrove forests in South Florida.
Transition Thresholds and Mangrove Migration
There is empirical evidence of mangrove movement into upstream freshwater marsh in the Everglades. During the mid-1940s, the marshes in the southeastern saline Everglades were arranged in well-defined plant communities running parallel to the coast, with shrub mangroves dominating along the coast and graminoid-mangrove communities and Cladium dominating farther inland (Meeder et al., 2017; Ross et al., 2000). However, by 1994, the boundary of the mixed graminoid-mangrove and Cladium communities had shifted inland by 3.3 km (Ross et al., 2000). The interior boundary of this low-productivity zone moved inland by some 1.5 km. A smaller shift in this “white zone” was observed in an area receiving freshwater overflow through gaps in the southeastern Everglades C-111 canal. These large-scale vegetation dynamics appear to be the combined result of SLR (approximately 10 cm since 1940) and water management practices in the southeastern saline Everglades (Meeder and Parkinson, 2018; Sklar et al., 2019).
Paleoecology studies confirm (Ross et al., 2000) the transgressive encroachment of coastal mangroves into historically freshwater marshes. Cores from Upper Joe Bay, approximately 5 km north of the Florida Bay coastline, display a transgressive stratigraphic sequence of sawgrass peat-marl to marl to mangrove peat-marl and documenting saltwater encroachment in the southeastern saline Everglades. The date is based on 210Pb dating of these mangrove peat-marl cores indicate an average accretion rate of 3.2 mm per year (Willard and Bernhardt, 2011).
Management Implications
Although this was a very coarse representation of the dynamics of accretion, mangrove migration and palustrine marsh transition in the face of SLR, it served to demonstrate the principle of RAD resource management (Lynch, in press). Ecosystem transformations around the world are occurring at unprecedented rates and spatial extents due to pollution, invasive species, land cover changes, and now, climate change and SLR. Transformations are defined by Beever (2006) and Lynch (in press) as the emergence of a self-organizing ecological system, like an open waters estuary, that diverges significantly and irreversibly from prior historical ecosystem structure and function. Lynch (in press) argued that new thoughtful, holistic resource management and restoration requires iterative learning (e.g., adaptive management) and a strategy tailored to consider the need to Resist, Accept or Direct (RAD) ecosystem transformations. To Resist ecosystem transformations, actions focus on maintaining current or historical ecosystem composition and function. To Accept transformations, by not intervening, society yields to the emergence of the structure and function of the transformed ecosystem. To Direct a transformation, resource management accepts change is inevitable, but decides to intervene to steer the ecosystem toward a particular structure and function. According to this RAD approach there are three feasibility criteria to consider when deciding which RAD strategy is appropriate and practical: ecological, societal, and financial. Our mangrove transition analysis suggests that scenarios that increase freshwater flows to the coastal wetlands and thus enhance both above and belowground processes of accretion can Direct rising sea levels toward less peat collapse, less land loss and expanded mangroves forests via migration into palustrine habitats.
Building a Better Model
The model presented here is of limited utility for testing specific resource management options because it is based on a very broad conceptualization of habitat specific transition thresholds and accretion rates, and because a bathtub approach like ours does not capture the true hydrological dynamics and complexities of South Florida. Future empirical and experimental research is needed to reduce the uncertainties associated with: (1) saltwater intrusion impacts to soils, sediments and plants; (2) habitat-specific inundation and water quality transition thresholds; and (3) mechanisms of enhanced mangrove productivity and inland migration. Directed coastal zone management, focused upon minimizing land loss in the face of SLR, will need a dynamic ecosystem succession model that integrates the impacts of extreme water levels due to upstream events and storm surge, especially if the goal is to preserve coastal wetland ecosystem services such as, flood control, aquifer protection, fisheries productivity and landscape biodiversity. Future analytical and modeling research is needed to do a better job of reducing the uncertainties associated with: (1) SLR and climate change; (2) landscape evolution, transformation and change and (3) the integration of bio-geomorphic changes (i.e., subsidence and accretion) with hydrodynamics flow patterns, stage and extreme events.
Conclusion
To be clear, this spatial analysis does not suggest a “Pollyanna” solution to SLR in South Florida. Marine transgression with SLR will cause saltwater intrusion (surficial and groundwater) and significant environmental impacts. The results also indicate that on average mangrove forests can keep pace with current SLR but would have difficulty at higher SLR scenarios projected for 2070. We are aware that a deeper unpacking of storm surges and other forms of extreme climatic events is needed. Yet, there was significant evidence of mangrove migration into the freshwater wetlands upstream. The movement of the mangrove community into the freshwater marsh habitat, facilitated by increased freshwater inflows, tidal surge salt wedge incursion and propagule recruitment (Cahoon et al., 2006; Doyle et al., 2010; Smoak et al., 2013; Raabe and Stumpf, 2016) is a Directed adaptation that shows a great deal of promise. Increased freshwater flows could stave off projected saltwater intrusion and facilitate mangrove inland migration under less salty water conditions (Raabe et al., 2012). Thus, maintaining lower salinities could make the mangrove community more resilient. In the end, forest soil vertical elevation must keep pace with current and projected accelerated SLR to reserve the vital ecosystem services provided by this unique wetland.
The extent of inundation depicted in this analysis does not include upstream headwaters effects or specific habitat mechanisms that build peat. This bathtub modeling approach of ours, compared to more sophisticated hydrodynamic and ecological modeling approaches has been found to over-estimate inundation because it does not take friction and other hydrodynamic forces into consideration (Neumann and Ahrendt, 2013). However, our approach allowed us to conceptualize the issue and the impact. Next steps are to apply more complex models, build understanding of the role each cover type has in generating the friction that would reduce the inland migration of coastal waters and to design studies to look at community response and transitions due to SLR.
Data Availability Statement
The raw data supporting the conclusions of this article will be made available by the authors, without undue reservation.
Author Contributions
All authors listed have made a substantial, direct and intellectual contribution to the work, and approved it for publication.
Funding
All funds for this research came from the South Florida Water Management District.
Conflict of Interest
The authors declare that the research was conducted in the absence of any commercial or financial relationships that could be construed as a potential conflict of interest.
Acknowledgments
We are very grateful to the South Florida Water Management District in West Palm Beach for giving us the tools, the data, the support and the time needed to bring this analysis to fruition.
Supplementary Material
The Supplementary Material for this article can be found online at: https://www.frontiersin.org/articles/10.3389/fevo.2021.646083/full#supplementary-material
References
Beever, E. A. (2006). Monitoring biological diversity: strategies, tools, limitations and challenges. Northwest Nat. 87, 66–79. doi: 10.1898/1051-1733(2006)87[66:mbdstl]2.0.co;2
Cahoon, D. R. (2015). Estimating relative sea level rise and submergence potential at a coastal wetland. Estuar. Coasts 38, 1077–1084. doi: 10.1007/s12237-014-9872-8
Cahoon, D. R., Day, J. W. Jr., and Reed, D. J. (1999). The influence of surface and shallow subsurface soil processes on wetland elevation: a synthesis. Cur. Top. Wetland Biogeochem. 3, 72–88.
Cahoon, D. R., Hensel, P., Rybczyk, J., McKee, K. L., Proffitt, E., and Perez, B. C. (2003). Mass tree mortality leads to mangrove peat collapse at Bay Islands, Honduras after Hurricane Mitch. J. Ecol. 91, 1093–1105. doi: 10.1046/j.1365-2745.2003.00841.x
Cahoon, D. R., Hensel, P. F., Spencer, T., Reed, D. J., McKee, K. L., and Saintilan, N. (2006). “Coastal wetland vulnerability to relative sea-level rise: wetland elevation trends and process controls,” in Wetlands and Natural Resource Management. Ecological Studies, Vol. 190, eds J. Verhoeven, B. Beltman, R. Bobbink, and D. Whigham (Berlin: Springer-Verlag), 271–292. doi: 10.1007/978-3-540-33187-2_12
Cahoon, D. R., Lynch, J. C., Hensel, P.F., Boumans, R. M., Perez, B. C., Segura, B., et al. (2002). High precision measurements of wetland sediment elevation: I. recent improvements to the sedimentation-erosion table. J. Sediment. Res. 72, 730–733. doi: 10.1306/020702720730
Cahoon, D. R., Reed, D. J., and Day, J. W. Jr. (1995). Estimating shallow subsidence in microtidal salt marshes of the southeastern United States: kaye and Barghoorn revisited. Mar. Geol. 128, 1–9. doi: 10.1016/0025-3227(95)00087-f
Castaneda-Moya, E., Twilley, R. R., Rivera-Monroy, V. H., Marx, B. D., and Coronado-Molina, C. (2011). Patterns of root dynamics in mangrove forests along environmental gradients in the Florida coastal Everglades, USA. Ecosystems 14, 1178–1195. doi: 10.1007/s10021-011-9473-3
Castaneda-Moya, E., Twilley, R. R., Rivera-Monroy, V. H., Zhang, K., Davis, S. E. III, and Ross, M. (2010). Sediment and nutrient deposition associated with hurricane Wilma in mangroves of the florida coastal everglades. Estuar. Coasts 33, 45–58. doi: 10.1007/s12237-009-9242-0
Cavanaugh, K. C., Dangremond, E. M., Doughtya, C. L., Park Williams, A. P., Parkerd, J. D., Hayes, M. A., et al. (2019). Climate-driven regime shifts in a mangrove-salt marsh ecotone over the past 250 years. Proc. Natl. Acad. Sci. U.S.A. 43:1116.
Chambers, L. G., Osborne, T. Z., and Reddy, K. R. (2013). Effect of salinity-altering pulsing events on soil organic carbon loss along an intertidal wetland gradient: a laboratory experiment. Biogeochemistry 115, 363–383. doi: 10.1007/s10533-013-9841-5
Chambers, L. G., Steinmuller, H. E., and Breithaupt, J. L. (2019). Toward a mechanistic understanding of “peat collapse” and its potential contribution to coastal wetland loss. Ecology 199:e02720. doi: 10.1002/ecy.2720
Chen, R., and Twilley, R. R. (1999). Pattern of mangrove forest structure and soil nutrient dynamics along the Shark River Estuary, Florida. Estuaries 22, 955–970. doi: 10.2307/1353075
Church, J. A., and White, N. J. (2006). A 20th century acceleration in global sea-level rise. Geophys. Res. Lett. 33:L01602. doi: 10.1029/2005GL024826
Day, J. W., Kemp, G. P., Reed, D. J., Cahoon, D. R., Boumans, R. M., Suhayda, J. M., et al. (2011). Vegetation death and rapid loss of surface elevation in two contrasting Mississippi delta salt marshes: the role of sedimentation autocompaction and sea-level rise. Ecol. Eng. 37, 229–240. doi: 10.1016/j.ecoleng.2010.11.021
De Laune, R. D., Nyman, J. A., and Patrick, W. H. Jr. (1994). Peat collapse, ponding and wetland loss in a rapidly submerging coastal marsh. J. Coast. Res. 10, 1021–1030.
Doyle, T. W., Krauss, K. W., Conner, W. H., and From, A. S. (2010). Predicting the retreat and migration of tidal forests along the northern Gulf of Mexico under sea-level rise. For. Ecol. Manag. 259, 770–777. doi: 10.1071/MF12036
Feher, L. C., Osland, M. J., Anderson, G. H., Vervaeke, C., Krauss, K. W., Whelan, K. R., et al. (2019). The long-term effects of hurricanes Wilma and Irma on soil elevation change in Everglades mangrove forests. Ecosystems 23, 917–931. doi: 10.1007/s10021-019-00446-x
Florida Department of Transportation [FDOT] (1999). Florida Land Use, Cover, and Forms Classification System Handbook, 3rd Edn, Tallahassee, FL: FDOT.
Friess, D. A., and McKee, K. L. (2020). “The history of surface-elevation paradigms in mangrove biogeomorphology,” in Dynamic Sedimentary Environments of Mangrove Coasts, eds D. A. Friess and K. L. McKee (Amsterdam: Elsevier), 179–198. doi: 10.1016/B978-0-12-816437-2.00007
Fu, H. F., Wang, W. Q., Ma, W., and Wang, M. (2018). Differential in surface elevation change across mangrove forests in the intertidal zone. Estuar. Coast Shelf Sci. 207, 203–208. doi: 10.1016/j.ecss.2018.03.025
Howard, R. J., From, A. S., Krauss, K. W., Andres, K. D., Cormier, N., Allain, L., et al. (2020). Soil surface elevation dynamics in a mangrove-to-marsh ecotone characterized by vegetation shifts. Hydrobiologia 847, 1087–1106. doi: 10.1007/s10750-019-04170-4
IPCC (2014). “Climate change: impacts, adaptations, and vulnerability. Part A: global and sectoral aspects,” in Contribution of Working Group II to the Fifth Assessment Report of the Intergovernmental Panel on Climate Change, eds C. B. Field, V. R. Barros, D. J. Dokken, K. J. Mach, M. D. Mastrandrea, T. E. Bilir, et al. (Cambridge: Cambridge University Press), 1132.
Iz, H. B., Berry, L., and Koch, M. (2012). Modeling regional sea level rise using local tide gauge data. J. Geodet. Sci. 2:12. doi: 10.2478/v10156-011-0039-2
Kirwan, M. L., and Megonigal, J. P. (2013). Tidal wetland stability in the face of human impacts and sea-level rise. Nature 504, 53–60. doi: 10.1038/nature12856
Koch, M. S., Coronado, C. M., Miller, W., Rudnick, D. T., Stabenau, E., Halley, R. B., et al. (2014). Climate change projected effects on coastal foundation communities of the Greater Everglades using a 2060scenario: need for a new management paradigm. Environ. Manag. 55, 857–875. doi: 10.1007/s00267-014-0375-y
Krauss, K. W., Cahoon, D. R., Allen, J. A., Ewel, K. C., Lynch, J. C., and Cormier, N. (2010). Surface elevation change and susceptibility of different mangrove zones to sea-level rise on Pacific high islands of Micronesia. Ecosystems 13, 129–143. doi: 10.1007/s10021-009-9307-8
Krauss, K. W., From, A. S., Doyle, T. T. W., and Barry, M. J. (2011). Sea-level rise and landscape change influence mangrove encroachment onto marsh in the Ten Thousand Islands region of Florida, USA. J. Coast Conserv. 15, 629–638. doi: 10.1007/s11852-011-0153-4
Lindsey, R. (2021). Climate Change: Global Sea Level. NOAA Climate.gov. Available online at: https://www.climate.gov/news-features/understanding-climate/climate-change-global-sea-level (accessed April 1, 2020).
Lynch, A. J. (in press). Managing ecosystem change: applying the resist, accept or direct (RAD) framework. Front. Ecol. Environ.
Malone, S. L., Keough, C., Staudhammer, C. L., Ryan, M. G., Parton, W. J., Olivas, P., et al. (2015). Ecosystem resistance in the face of climate change: a case study from the freshwater marshes of the Florida Everglades. Ecosphere 6:57.
Maul, G. A., and Douglas, M. (1993). Sea level rise at Key West, Florida, 1846-1992: America’s longest instrument record. Geophys. Res. Lett. 20, 1955–1958. doi: 10.1029/93gl02371
McKee, K. L., Cahoon, D. R., and Feller, I. C. (2007). Caribbean mangroves adjust to rising sea level through biotic controls on change in soil elevation. Glob. Ecol. Biogeogr. 16, 545–556. doi: 10.1111/j.1466-8238.2007.00317.x
McKee, K. L., Krauss, K. W., and Cahoon, D. R. (2020). Does geomorphology determine vulnerability of mangrove coasts to sea-level rise? Dyn. Sediment. Environ. Mangr. Coasts 2020, 255–272. doi: 10.1016/b978-0-12-816437-2.00005-7
Meeder, J. F., and Parkinson, R. W. (2018). SE Saline everglades transgressive sedimentation in response to historic acceleration in sea-level rise: a viable marker for the base of the Anthropocene? J. Coast. Res. 34, 490–497. doi: 10.2112/jcoastres-d-17-00031.1
Meeder, J. F., Parkinson, R. W., Ruiz, P., and Ross, M. S. (2017). Saltwater encroachment and prediction of future ecosystem response to the anthropocene marine transgression, Southeast Saline Everglades, Florida. Hydrobiologia 803, 29–48. doi: 10.1007/s10750-3359-0
National Academies of Sciences Engineering and Medicine (2018). Progress Toward Restoring the Everglades: The Seventh Biennial Review - 2018. Washington, DC: The National Academies Press, doi: 10.17226/25198
Neumann, T, and Ahrendt, K. (2013). Comparing the “Bathtub Method” with Mike 21 HD Flow Model for Modelling Storm Surge Inundation. Bachelor Thesis. Kiel: Geographisches Institut Universität Kiel.
Nungesser, M., Saunders, C., Coronado-Molina, C., Obeysekera, J., Johnson, J., McVoy, C., et al. (2014). Potential effects of climate change on Florida’s everglades. Environ. Manag. 55, 824–835.
Obeysekera, J., Park, J., Irizarry-Ortiz, M., Trimble, P., Barnes, J., Van Arman, J., et al. (2011). Past and Projected Trends in Climate and Sea Level for South Florida. Hydrologic and Environmental Systems Modeling Technical Report. West Palm Beach, FL: Interdepartmental Climate Change Group, South Florida Water Management District.
Park, J., Redwine, J., Hill, T. D., and Kotun, K. (2019). Water Resource and ecotone transformation in coastal ecosystems. Ecol. Model. 405, 69–85. doi: 10.1016/j.ecolmodel.2019.04.015
Parkinson, R. W., De Laune, R. D., and White, G. R. (1994). Historical and geological mangrove peat accretion rates and their use in sea-level rise forecasting models. J. Res. 10, 1151–1162.
Raabe, E. A., Roy, L. C., and McIvor, C. C. (2012). Tampa Bay coastal wetlands: nineteenth to twentieth century tidal marsh-to-mangrove conversion. Estuar. Coasts 35, 1145–1162. doi: 10.1007/s12237-012-9503-1
Raabe, E. A., and Stumpf, R. P. (2016). Expansion of tidal marsh in response to sea level rise: gulf coast of Florida, USA. Estuar. Coasts 39, 145–157. doi: 10.1007/s12237-015-9974-y
Ross, M. S., Meeder, J. F., Sah, J. P., Ruiz, P. L., and Telesnicki, G. J. (2000). The Southeast Saline Everglades revisited: a half-century of coastal vegetation change. J. Veget. Sci. 11, 101–112. doi: 10.2307/3236781
Servais, S., Kominoski, J. S., Charles, S. P., Gaiser, E. E., Mazzei, V., Troxler, T. G., et al. (2019). Saltwater intrusion and soil carbon loss: testing effects of salinity and phosphorus loading on microbial functions in experimental freshwater wetlands. Geoderma 337, 1291–1300. doi: 10.1016/j.geoderma.2018.11.013
Sklar, F. H., Meeder, J. F., Troxler, T. G., Dreschel, T., Davis, S. E., and Ruiz, P. L. (2019). “The Everglades: at the forefront of transition,” in Coasts and Estuaries - The Future, eds E. Wolanski, J. W. Day, M. Elliot, and R. Ramachandran (Amsterdam: Elsevier), 277–291. doi: 10.1016/b978-0-12-814003-1.00016-2
Smoak, J. M., Breithaupt, J. L., Smith, T. J., and Sanders, C. J. (2013). Sediment accretion and organic carbon burial relative to sea-level rise and storm events in two mangrove forests in Everglades National Park. Catena 104, 58–66. doi: 10.1016/j.catena.2012.10.009
South Florida Water Management District [SFWMD] (2014a). SFWMD Land Cover Land Use 2014-2016. Available online at: https://geo-sfwmd.hub.arcgis.com/datasets/sfwmd-land-cover-land-use-2014-2016 (accessed January 4, 2020).
South Florida Water Management District [SFWMD] (2014b). SFWMD Photointerpretation Key, 708. Available online at: https://apps.sfwmd.gov/sfwmd/gsdocs/TPubs/2014_SFWMD_Photointerpretation_Key.pdf
South Florida Water Management District [SFWMD] (2020). NAVD88 Ground Surface Elevations (ft). Available online at: https://sfwmd.maps.arcgis.com/home/item.html?id=ca44a6a0714d4d3daa43eba592e8b11b (accessed January 4, 2020).
Stagg, C. L., Schoolmaster, D. R., Krauss, K. W., Cormier, N., and Conner, W. H. (2017). Causal mechanisms of soil organic matter decomposition: deconstructing salinity and flooding impacts in coastal wetlands. Ecology 98, 2003–2028. doi: 10.1002/ecy.1890
Sweet, W. V., Kopp, R. E., Weaver, C. P., Obeysekera, J., Horton, R. M., Thieler, E. R., et al. (2017). Global and Regional Sea Level Rise Scenarios for the United States. NOAA Technical Report NOS CO-OPS 083. Silver Spring, MD: NOAA, 75.
The Southeast Florida Regional Climate Change Compact’s Sea Level Rise Ad Hoc Work Group (Compact) (2019). Unified Sea Level Rise Projection Southeast Florida, 36. Available online at: https://southeastfloridaclimatecompact.org/wp-content/uploads/2020/04/Sea-Level-Rise-Projection-Guidance-Report_FINAL_02212020.pdf
Southeast Florida Regional Climate Change Compact Sea Level Rise Work Group (Compact). (2019). Unified Sea Level Rise Projection for Southeast Florida. A document prepared for the Southeast Florida Regional Climate Change Compact Steering Committee, 35.
Voss, C. M., Christian, R. R., and Morris, J. T. (2013). Marsh macrophyte responses to inundation anticipate impacts of sea-level rise and indicate ongoing drowning of North Carolina marshes. Mar. Biol. 160, 181–194. doi: 10.1007/s00227-012-2076-5
Wanless, H. (1989). The inundation of our coastlines: past, present and future with a focus on South Florida. Sea Front. 35, 264–271.
Wanless, H., Parkinson, R. W., and Tedesco, L. P. (1994). “Sea level control on stability of Everglades wetlands,” in Everglades: The Ecosystem and its Restoration, eds S. M. Davis and J. C. Ogdon (Delray Beach, FL: St Lucie Press).
Willard, D. A., and Bernhardt, C. E. (2011). Impacts of past climate and sea level change on Everglades wetlands: placing a century of anthropogenic change into a late-Holocene context. Clim. Chang. 107, 59–80. doi: 10.1007/s10584-011-0078-9
Wilson, B. J., Servais, S., Charles, S. P., Davis, S. E., Gaiser, E. E., Kominoski, J. S., et al. (2018). Declines in plat productivity drive carbon loss from brackish coastal wetland mesocosms exposed to saltwater intrusion. Estuar. Coasts 41, 2147–2158. doi: 10.1007/s12237-018-0438-z
Keywords: Everglades, wetland, restoration, mangrove, sea level, inundation, vulnerability
Citation: Sklar FH, Carlson C, Coronado-Molina C and Maran AC (2021) Coastal Ecosystem Vulnerability and Sea Level Rise (SLR) in South Florida: A Mangrove Transition Projection. Front. Ecol. Evol. 9:646083. doi: 10.3389/fevo.2021.646083
Received: 25 December 2020; Accepted: 16 April 2021;
Published: 25 May 2021.
Edited by:
Wade H. Jeffrey, University of West Florida, United StatesReviewed by:
Andrew From, United States Geological Survey (USGS), United StatesAlbertus J. Smit, University of the Western Cape, South Africa
Copyright © 2021 Sklar, Carlson, Coronado-Molina and Maran. This is an open-access article distributed under the terms of the Creative Commons Attribution License (CC BY). The use, distribution or reproduction in other forums is permitted, provided the original author(s) and the copyright owner(s) are credited and that the original publication in this journal is cited, in accordance with accepted academic practice. No use, distribution or reproduction is permitted which does not comply with these terms.
*Correspondence: Fred H. Sklar, ZnNrbGFyQHNmd21kLmdvdg==
†These authors have contributed equally to this work