 Laura E. Timm
 Thomas L. Jackson3
 Joan A. Browder
 Heather D. Bracken-Grissom
- 1CRUSTOMICS Laboratory, Department of Biological Sciences, Institute of Environment, Florida International University, Miami, FL, United States
- 2Computational Biosciences Program, University of Colorado, Aurora, Aurora, CO, United States
- 3Southeast Fisheries Science Center, NOAA National Marine Fisheries Service, Miami, FL, United States
The Gulf of Mexico pink shrimp, Farfantepenaeus duorarum, supports large fisheries in the United States and Mexico, with nearly 7,000 tons harvested from the region in 2016. Given the commercial importance of this species, management is critical: in 1997, the southern Gulf of Mexico pink shrimp fishery was declared collapsed and mitigation strategies went into effect, with recovery efforts lasting over a decade. Fisheries management can be informed and improved through a better understanding of how factors associated with early life history impact genetic diversity and population structure in the recruited population. Farfantepenaeus duorarum are short-lived, but highly fecund, and display high variability in recruitment patterns. To date, modeling the impacts of ecological, physical, and behavioral factors on juvenile settlement has focused on recruitment of larval individuals of F. duorarum to nursery grounds in Florida Bay. Here, we articulate testable hypotheses stemming from a recent model of larval transport and evaluate support for each with a population genomics approach, generating reduced representation library sequencing data for F. duorarum collected from seven regions around the Florida Peninsula. Our research represents the first and most molecular data-rich study of population structure in F. duorarum in the Gulf and reveals evidence of a differentiated population in the Dry Tortugas. Our approach largely validates a model of larval transport, allowing us to make management-informative inferences about the impacts of spawning location and recruitment patterns on intraspecific genetic diversity. Such inferences improve our understanding of the roles of non-genetic factors in generating and maintaining genetic diversity in a commercially important penaeid shrimp species.
Introduction
The Gulf pink shrimp, Farfantepenaeus duorarum (Burkenroad, 1939) supports multiple, international fisheries along its described geographic range, representing millions of dollars of economic activity (Sheridan, 1996; Ramírez-Rodríguez et al., 2003; Hart et al., 2012). Over 7,000 tons of pink shrimp were harvested across fisheries in the Gulf of Mexico in 2016, the last year for which such data are available (Hart, 2017). Given the economic and social influence of the large-scale fishing effort directed at Farfantepenaeid species in the Gulf, proper management is critical to the sustained stability of the species and protection of economic interests in the region: all of the species within the Farfantepenaeus group are targeted by fisheries to some extent (see Timm et al., 2019 for more information).
Management of fished species requires understanding the biology and ecology of the organism, including assessments of intraspecific biodiversity and the evolutionary processes that drive it (Bernatchez, 1995). Management of F. duorarum by Mexico and the United States of America makes such insight particularly crucial: shrimp fisheries have supported regional Mexican economies for decades, and pink shrimp have contributed substantially to these fisheries, with 90% of fished shrimp in the 1990s being F. duorarum (Arreguín-Sánchez et al., 2008). In the late 1990s, however, the F. duorarum fishery in the southern Gulf of Mexico was declared collapsed (Arreguín-Sánchez et al., 1997). Investigation of possible underlying causes of the collapse found evidence for decreased stock-recruitment (Arreguín-Sánchez et al., 1997, 1999), and efforts were undertaken to promote recovery (Arreguín-Sánchez et al., 2008). Such events have occurred in United States fisheries as well, resulting in the closure of the northern brown shrimp (F. aztecus) fishery along the Texas coast in the 1980s (Klima et al., 1987). The co-occurrence of several, economically important species of Farfantepenaeus along the coasts of the Gulf of Mexico further complicate management. Specifically, juvenile individuals of F. brasiliensis and F. duorarum look very similar, and the ability to confidently identify juvenile individuals taxonomically by reproductive structure morphology (Pérez-Farfante, 1988) is nearly impossible (Ditty and Alvarado Bremer, 2011; Teodoro et al., 2016). A recent study found cryptic diversity within F. brasiliensis, identifying two distinct populations (one occupying United States coasts and the other present along the coasts of South America). The study called for additional efforts to better understand population structure and evolutionary history within managed species (Timm et al., 2019). A break in species composition exists between the Gulf of Mexico and the greater Atlantic; divided by prevailing environmental features (Avise, 1992; Young et al., 2002). Studies focused on genetic diversity and population connectivity in species that span this break (such as F. duorarum) might prove particularly informative.
Life history can be significant in determining the composition and structure of adult assemblages, especially in species with complicated development cycles. Adults of F. duorarum spawn year-round in aggregations offshore of the Dry Tortugas and the Marquesas on the southwest Florida shelf (Cummings, 1961; Roberts, 1986). There is a distinct spawning aggregation on the Sanibel grounds as well, and, despite geographic overlap between Sanibel and Dry Tortugas nursery grounds, a division between shrimp originating from these two spawning grounds has been noted near Indian Key (i.e., between Sanibel and Dry Tortugas; Costello and Allen, 1966; Robblee et al., 1999): shrimp emanating from Sanibel nursery grounds only rarely migrate into the Dry Tortugas trawling grounds south of Indian Key and vice versa. After hatching, larvae rapidly progress through 11 developmental stages [nauplii (5), protozoea (3), and mysis (3)] in approximately 15 days (Dobkin, 1961). During this time, larval individuals exhibit a vertical migration pattern, alternating between deeper waters and surface waters (Rothlisberg, 1982; Rothlisberg et al., 1995, 1996; Condie et al., 1999). For the first 15 days of development, vertical migration is triggered by light [diel vertical migration (DVM)]. During the subsequent 15 days, as individuals pass through several postlarval stages (3–6 stages; Ewald, 1965), vertical migration is timed to tidal movement [selective tidal-stream transport (STST)], allowing postlarvae to take advantage of tidal movement toward nursery grounds and avoid tidal movement in the opposite direction (Forward and Tankersley, 2001; Queiroga and Blanton, 2005). A modeling study by Criales et al. (2015) suggests that these two behaviors, DVM and STST, facilitate movement from spawning grounds toward primary nursery grounds in Florida Bay and mangrove estuaries along the southwest coast (Tabb et al., 1962; Costello and Allen, 1966; Browder and Robblee, 2009), where they grow through the juvenile stage, returning to spawning grounds as young adults. Environmental factors such as salinity and temperature on their nursery grounds affect their rate of growth and mortality (Browder et al., 1999, 2002; Ehrhardt and Legault, 1999), potentially influencing recruitment to the offshore fishery.
Two routes have been proposed for larval/postlarval migration (Figure 1): larvae may drift east and northeast along the Florida Current, to enter Florida Bay through the Florida Keys (Munro et al., 1968; Criales et al., 2003). The other route posits that larvae move more directly across the southwest Florida shelf, entering Florida Bay at its northwest side (Jones et al., 1970; Criales et al., 2006). Recently, Criales et al. (2015) found support for both suggested migration routes with a biophysical model utilizing Lagrangian modeling to display larval-to-postlarval behaviors, receiving output from a physical oceanographic model providing the drivers. The modeling system supported an investigation into the influence of spawning location, larval traits, and oceanographic features (tides, winds, and currents) on larval transport. Virtual larvae were released near the water column’s surface from the Dry Tortugas and the Marquesas areas, mimicking a combination of DVM and STST behavior, and allowed to be transported for 28–30 days according to current speeds and directions and larval position in the water column (i.e., bottom vs. middle to surface). Finally, a benthic habitat module reflected larval aggregations on the offshore spawning grounds and suitable settlement habitats near the coast. The biophysical and physical oceanographic model developed by Criales et al. (2015) indicated that recruitment success was largely determined by season and spawning ground: generally, larvae simulated from the Marquesas were several times more likely to reach nursery habitat than those simulated from the Dry Tortugas, and summer simulations consistently resulted in higher larval settlement compared to winter simulations. Simulated larvae were most likely to settle in nursery habitat when they were released from the Marquesas in the summer, migrating east-northeast across the southwest Florida shelf. When simulated larvae originated from the Dry Tortugas, they were likely to become entrained in the Florida Current, exiting the Gulf of Mexico entirely and entering the greater Atlantic. The few simulated larvae released from the Dry Tortugas that successfully reached Florida Bay did so through both hypothesized routes, while those simulated larvae successfully recruited to the Florida Bay recruitment area from the Marquesas never migrated through the Florida Keys. These results provide expectations of population dynamics that can be tested with molecular methods.
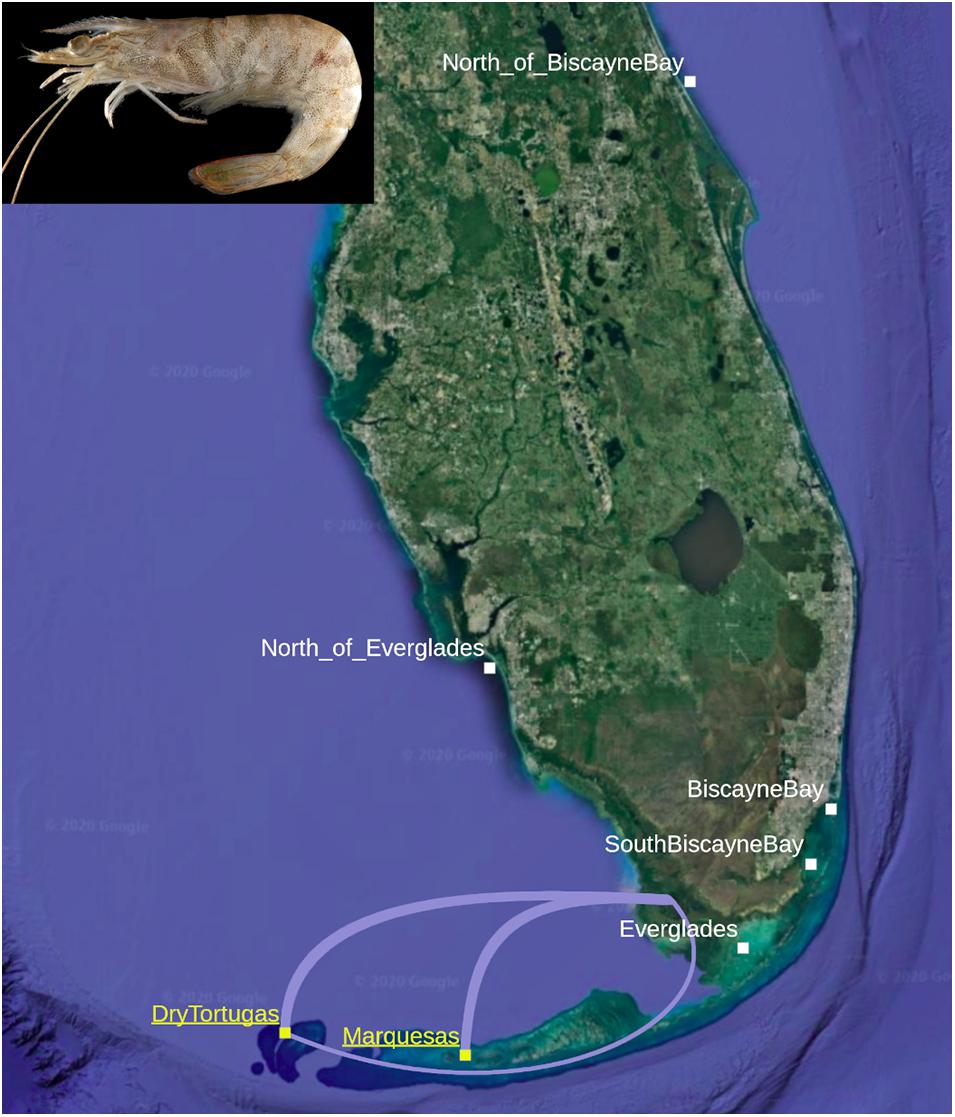
Figure 1. Individuals of Farfantepenaeus duorarum were collected from seven regions around the Florida Peninsula and Florida Keys, including two spawning aggregations, DryTortugas and Marquesas (yellow and underlined). The major (thick lines) and minor (thin line) migratory routes described by Criales et al. (2015) are depicted between the spawning aggregations and the major nursery grounds in Florida Bay (Photograph of F. duorarum from wikimedia commons. Base map from Google Earth).
The model of larval transport and migration developed by Criales et al. (2015) leads to testable, if relatively qualitative, hypotheses. Under the null hypothesis, all pink shrimp around the Florida Peninsula represent a single, genetically homogeneous population, originating from spawning aggregations offshore of the Dry Tortugas and the Marquesas, traveling either migratory route (Figure 1), and reaching adulthood on nursery grounds around the Florida Peninsula. From a fishery management perspective, this would be the simplest conclusion: lacking differentiated intraspecific diversity, all fisheries targeting the species can be managed as one. The alternative hypothesis, however, posits that the two spawning aggregations and different migratory routes to the nursery grounds support at least two genetically differentiated populations. If the alternative hypothesis holds, the Dry Tortugas and the Marquesas represent separate spawning aggregations to some extent, maintaining at least two distinct populations (these may be characterized by spawning aggregation, i.e., Dry Tortugas vs. Marquesas, or migratory route, i.e., the more-traveled east-northeast “major” route across the southwest Florida shelf vs. the less-traveled south-southeast “minor” route through the Florida Keys), and more complex management strategies would be needed to protect both populations during the stock-recruitment phase.
A better understanding of these two routes, major and minor, is of primary concern to researchers focused on sustainable fishing of pink shrimp (Browder et al., 1999, 2002; Ehrhardt and Legault, 1999; Criales et al., 2000, 2003, 2006, 2007, 2010, 2015; Ehrhardt et al., 2001; Ogburn et al., 2013). The major route, which traverses the southwest Florida shelf, crosses through a regional fishery operating year-round near the Dry Tortugas and Key West (Klima et al., 1987; Upton et al., 1992; Hart et al., 2012), catching both fully mature and young adult shrimp (Ehrhardt and Legault, 1999; Browder et al., 2002). The co-localization of these large, highly productive pink shrimp fisheries with spawning grounds and out-migrating larvae makes an understanding of population dynamics in the region especially important to long-term species sustainability. Here, we utilize a next-generation sequencing method, double digest Restriction-site Associated sequencing (ddRADseq) to investigate the fine-scale population structure of F. duorarum in the eastern Gulf of Mexico. Our overall objective is to characterize diversity and connectivity in terms of the larval migration and transport within the area for the purpose of informing and improving fishery management. To accomplish this, we: (1) validate the biophysical oceanographic modeling results of Criales et al. (2015) with an independent data type (ddRADseq data); (2) investigate any evidence of population differentiation within F. duorarum in the region, including whether postlarvae recruited to Biscayne Bay originate from the Dry Tortugas; and (3) contextualize the population genomics results in terms of fisheries management.
Materials and Methods
Because the migratory routes between pink shrimp spawning aggregations and nursery habitat span a relatively small geographic range, our sampling effort targeted proximal locations around the Florida Peninsula. Over 100 postlarval, juvenile, and adult specimens of Farfantepenaeus were collected from several sites representing seven regions around the Florida Peninsula between 2011 and 2015 (Figure 1): New Smyrna (“North_of_BiscayneBay” or “NBB”), Hobie Beach, Bear Cut, and South Virginia Key (“BiscayneBay” or “BB”), NOAA sampling stations 2.1–2.3 and 7.1–7.3 (“SouthBiscayneBay” or “SBB”), Bradley Key (“Everglades” or “EVG”), Pumpkin Bay, Estero Bay, Fakahatchee Bay, and Pine Island Sound (“North_of_Everglades” or “NEVG”), Fort Jefferson to Key West, which sampled across the Marquesas spawning ground (“Marquesas” or “MQ”), and the Dry Tortugas (“DryTortugas” or “DT”). The majority of samples collected from nursery habitats around the Florida Peninsula were acquired by Jackson as part of a collaboration between the Ecosystems Investigations Unit of the Southeast Fisheries Science Center (SEFSC) in Miami. South Biscayne Bay samples were collected as part of a nearshore southwestern Biscayne Bay monitoring project. Because some of the samples, primarily those representing spawning aggregations, were obtained from shrimping vessels, exact collection coordinates were not obtained. Sampled specimens were frozen after collection and shipped to the Ecosystems Investigations Lab at SEFSC for taxonomic identification, specifically focused on the diagnostic characters associated with reproductive morphology (gonopore, thelyca, and petasmata; see Pérez-Farfante, 1969, 1970, 1988; Pérez-Farfante and Kensley, 1997). After identification to species, 105 frozen individuals identified as F. duorarum or likely to be F. duorarum (labeled F. sp.) were transferred to the CRUSTOMICS Lab in North Miami, Florida, where each was given a unique voucher ID in the Florida International University Crustacean Collection (FICC). The ID and all metadata associated with collection were entered into the FICC database. Samples were thawed and muscle tissue was plucked from each specimen by lifting the integument of the second abdominal segment and removing a few milligrams of tissue, using care to avoid puncturing the digestive tract. Tissue was stored at –20°C in 70% EtOH. The intact whole-specimens were preserved in 70% EtOH and stored in the FICC. All specimens included in the study presented here, including all relevant metadata, are presented in Supplementary Table 1.
DNA Extraction and Next-Generation Sequencing Library Preparation
Juveniles and adults were targeted for DNA extraction; postlarvae were excluded to ensure individuals collected had survived their initial migratory journey. Juveniles were expected in nursery areas and adults on spawning grounds. Only adults would be present on the spawning grounds as they return to spawn. DNA was extracted from the plucked abdominal muscle tissue with the DNeasy Blood and Tissue kit (Qiagen), following the manufacturer’s instructions. To ensure a sufficient amount of DNA had been obtained from an extraction for downstream ddRADseq library prep, DNA was quantified with the Qubit dsDNA High Sensitivity Analysis kit (ThermoFisher). Gel electrophoresis was used to confirm the presence of intact, high molecular weight DNA: DNA extractions were run through a 2% agarose gel for 90 min at 100 V, visualized with GelRed (Biotium). Only samples with more than 500 ng of unfragmented DNA were considered for ddRADseq library prep.
Of the 105 F. duorarum specimens that underwent DNA extraction, a subset were found to meet the criteria described above. Of these, 68 were chosen for next-generation sequencing library prep (∼10 samples per sampled region). Reduced representation libraries were prepared following the double digest Restriction-site Associated DNA sequencing (ddRADseq) method published by Peterson et al. (2012). Briefly, we began with a series of enzyme trials to determine the optimal enzyme combination and size selection range to provide adequate genomic coverage at adequate sequencing depth. At least 500 ng of extracted DNA was digested with SphI-HF and EcoRI-HF (New England Biolabs) for 3 h at 37°C. Enzymatic activity was stopped with a 30 min hold at 65°C. Custom barcode adapters (synthesized at Integrated DNA Technologies) were ligated to the double-digested fragments using T4 ligase (New England Biolabs). Following barcode adapter ligation, samples were pooled into nine samples of eight, uniquely barcoded libraries. Fragments between 270 and 330 bp, including adapter length, were size selected on a PippinPrep with a 1.5% Agarose Gel Cassette (Sage Science). To reduce the impact of PCR bias, each size-selected sample was subdivided into five parallel PCR amplification reactions and a negative control was used to ensure reagents were not contaminated. Using the Phusion Hi-Fidelity Polymerase (Thermo Scientific), the PCR reactions went for 10 cycles and incorporated i7 indices and Illumina adapters into every amplified fragment, allowing for pooling of all libraries into a single sample. This final sample was quality-checked on an Agilent BioAnalyzer 2100 (Agilent Technologies) immediately prior to sending it for sequencing with the Illumina HiSeq4000, SE150, at the University of Texas’ Genomic Sequencing and Analysis Facility.
Data Assembly and Quality Filtering
Initial quality checks of the raw data were conducted with fastQC (Andrews, 2010) before data assembly began in STACKS v1.45 (Catchen et al., 2013) on Florida International University’s High Performance Computing Cluster (FIU HPCC). Given the risk of data assembly decisions resulting in a biased data set, recent literature was consulted before beginning the complex task of generating datasets from ddRADseq data (Mastretta-Yanes et al., 2015; Paris et al., 2017; Rochette and Catchen, 2017; O’Leary et al., 2018). Data assembly followed the recommended core pipeline for de novo data: process_radtags to demultiplex the reads, ustacks to align reads within each individual, cstacks to catalog these reads, sstacks to query putative loci against this catalog, and rxstacks to utilize population data to correct individual genotype calls. As any individual dataset, assembled according to the authors’ best judgment, can reflect biases stemming from assembly decisions, nine datasets were generated, differing in the maximum Hamming distance allowed between stacks (ustacks’ –M), the minimum depth required to designate a stack (ustacks’ –m), and the maximum Hamming distance allowed between sample loci (cstacks’ –n). The data assembly parameters for each dataset are presented in Table 1. These datasets are referred to as “batches” and reflect the parameter settings that generated them: “batch161” is the dataset assembled with a maximum Hamming distance of 1 allowed between stacks, a minimum stack depth of 6, and a maximum Hamming distance of 1 allowed between sample loci (–M 1 –m 6 –n 1).
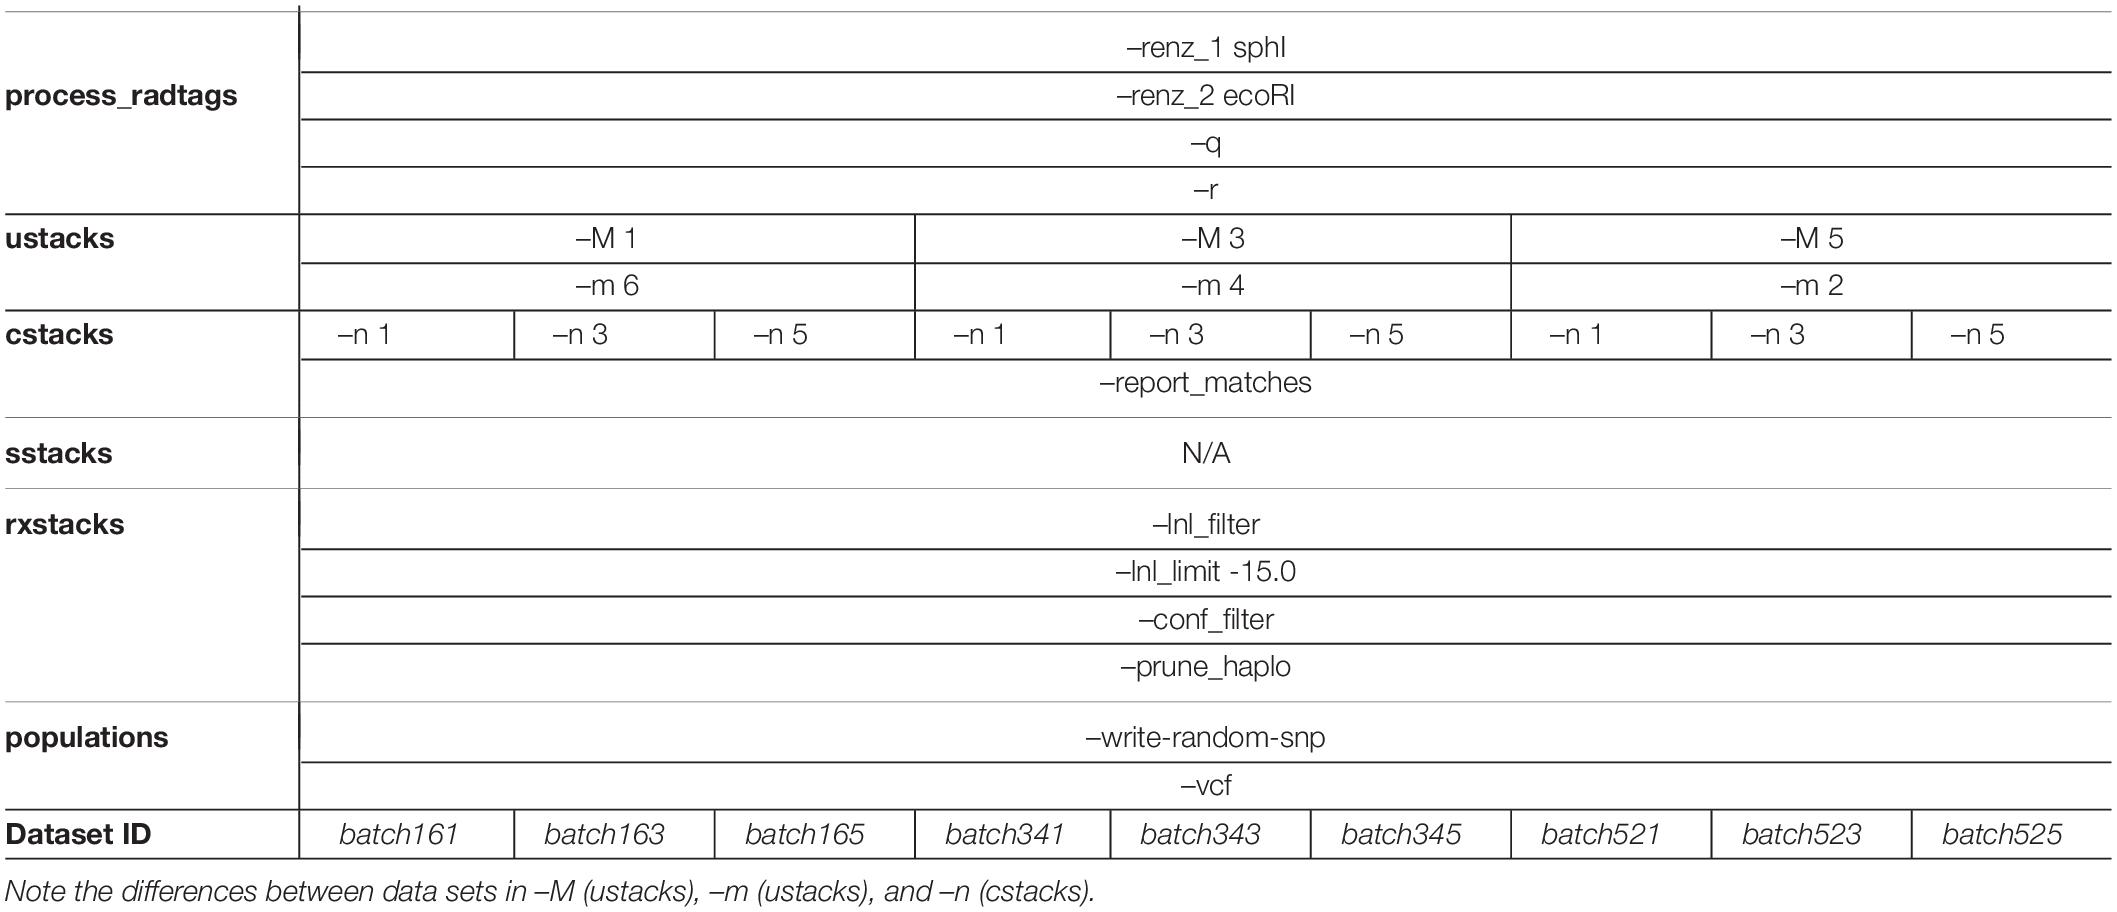
Table 1. Details of data assembly in STACKS v1.45 are provided below, including flags and settings used at every step of the pipeline.
Quality filtering of the VCFs output from STACKS was accomplished with VCFtools (Danecek et al., 2011) on the FIU HPCC. First, the minimum read depth was set to 10×. Next, sites with ≥50% missing data were removed, followed by individuals with ≥90% missing data. The resulting VCF files were reformatted in PGDSpider v2.0.5.2 (Lischer and Excoffier, 2012) for analysis in BayeScan v2.1 (Foll and Gaggiotti, 2008; Foll et al., 2010; Fischer et al., 2011), which identifies loci which may be under natural selection, as well as GenAlEx v6.501 (Peakall and Smouse, 2006, 2012).
Population Genomics Analyses
Pairwise measures between regions, including Nei’s unbiased genetic distances, which describe allelic differences assuming genetic drift and mutation are in equilibrium (Nei, 1972, 1987, and FST values, which quantifies the proportion of genetic variation explained by population structure (Wright, 1950), were calculated in the Excel data analysis suite, GenAlEx v6.501. GenAlEx was also used to identify private alleles within each region and conduct the Analyses of Molecular Variance (AMOVAs). The number of private alleles identified for every region were normalized by each region’s sample size (PAnorm). Pairwise FST values were calculated alongside the AMOVAs utilizing GenAlEx’s “AMOVA” option. Standard permutation was selected to calculate statistical significance of results over 999 permutations. Missing data were not imputed. Neighbor Joining (NJ) trees and Principal Component Analyses (PCAs) were constructed in the R package, adegenet (Jombart, 2008; Jombart and Ahmed, 2011). Three principal components (PCs) were calculated for each dataset, plotting the primary and secondary PCs with ggplot2 (Wickham, 2016). Ellipses, encompassing the 0.95 confidence levels, were added for each region. Finally, using the “dapc” command in adegenet, Discriminant Analyses of Principal Components (DAPCs) were built from the first three PCs for each dataset.
Population structure was tested in STRUCTURE v2.3.4 (Pritchard et al., 2000) with K taking values between 2 and 7, each tested 10× under the admixture model with allele frequencies correlated among populations. Initially, each analysis ran for 100,000 generations, and the first 25% were discarded as burn-in. Review of preliminary results found high agreement between replicates, indicating that this number of generations was sufficient to achieve convergence. After STRUCTURE analyses were complete, results were collated in STRUCTURE HARVESTER v0.6.94 (Earl and VonHoldt, 2012). Within STRUCTURE HARVESTER, the optimal K value was inferred using ad hoc posterior probability models (Pritchard et al., 2000) and the Evanno Method (Evanno et al., 2005). STRUCTURE plots were generated within the R package pophelper (Francis, 2017).
Validating the Existing Biophysical Oceanographic Model
While Criales et al. (2015) presented a suite of models, for simplicity, here we focus only on the model that incorporates the larval behaviors of DVM and STST and describes the major and minor routes, as this was the only model that resulted in successful recruitment. Testing the hypotheses indicated by the modeling work of Criales et al. (2015) may be accomplished through patterns of unique haplotypes (private alleles), measures of genetic distance (Nei’s unbiased distance), population differentiation (FST), and components of genetic variance (AMOVA). It is important to note that statistical tests are performed on values calculated from pseudoreplicated datasets (batches), not fully independent data.
Expectations under the null hypothesis: Most of the survivorship research on F. duorarum has focused on recruitment success (Browder et al., 1999, 2002; Ehrhardt and Legault, 1999; Criales et al., 2006, 2007, 2015), describing a density-dependent trend (Ehrhardt et al., 2001). By definition, the spawning aggregation represents the highest population density of sexually mature, spawning shrimp. Adults found on nearshore nursery grounds have matured on those grounds or in nearby estuaries and will soon return to spawning grounds for their turn at spawning. Spawning aggregations hold greater genetic diversity than found on any one nursery ground when spawners come from several nursery locations. Under the null hypothesis, we expect the highest number of private alleles-per-individual (PAnorm) to come from sites representing a spawning aggregation. A t-test, assuming unequal variance, was utilized to statistically compare PAnorm for spawning (DT and MQ) vs. nursery (NBB, BB, SBB, EVG, and NEVG) regions. Most estuaries from which samples were collected for this study represent nursery areas, although young shrimp may move out of an estuary to avoid disruptive changes in conditions such as storms or cold snaps (e.g., see Tabb et al., 1962, pp. 26–27).
Finally, under the null, we expect little-to-no statistically significant pairwise population differentiation between regions; the vast majority of genetic variance should come from differences between individuals (FIT). Pairwise FST values and AMOVA results will provide support in this regard.
Expectations under the alternative hypothesis: If the Dry Tortugas and the Marquesas support population-specific spawning aggregations, we expect statistically significant pairwise population differentiation between these sites, which was tested with an ANOVA comparing pairwise FST values by region type: spawning-spawning (DryTortugas-Marquesas), spawning-nursery (all region pairs containing DryTortugas or Marquesas), and nursery-nursery (all region pairs that do not contain DryTortugas or Marquesas). Moreover, while the majority of molecular variance may be attributable to variance among individuals (FIT), FST should be greater than zero and statistically significant.
In additional to the statistical tests described, PCAs, DAPCs, and STRUCTURE results were evaluated for evidence of population structure. Any results, quantitative or qualitative, contradictory to both hypotheses will be considered as contradictions to the validity of the model presented by Criales et al. (2015), and the relative strength of such contradictions will be assessed in the context of the full study presented here.
Results
The preparation of next-generation sequencing libraries occurred for 68 individuals collected from 19 sites representing seven regions. Over 117 million SR150 raw reads were returned from the Illumina HiSeq4000. Demultiplexed data were submitted to the NCBI SRA database under BioProject PRNJA554161 and are also publicly available through the Gulf of Mexico Research Initiative’s Information and Data Cooperative (doi: 10.7266/n7-hhnq-kh83; Timm, 2019). Nine parameterizations of STACKS yielded nine data assemblies (batches, see Table 1) with 11,971–20,820 single nucleotide polymorphisms (SNPs). Additional quality filtering was executed in vcftools: when minimum read depth was set to 10×, 4,025–13,267 SNPs remained; applying a missing data filter (<90% individual missingness and <50% missing SNP data allowed) resulted in 740–800 high-confidence SNPs. BayeScan identified no loci under selection. See Table 2 for a detailed report of this information.
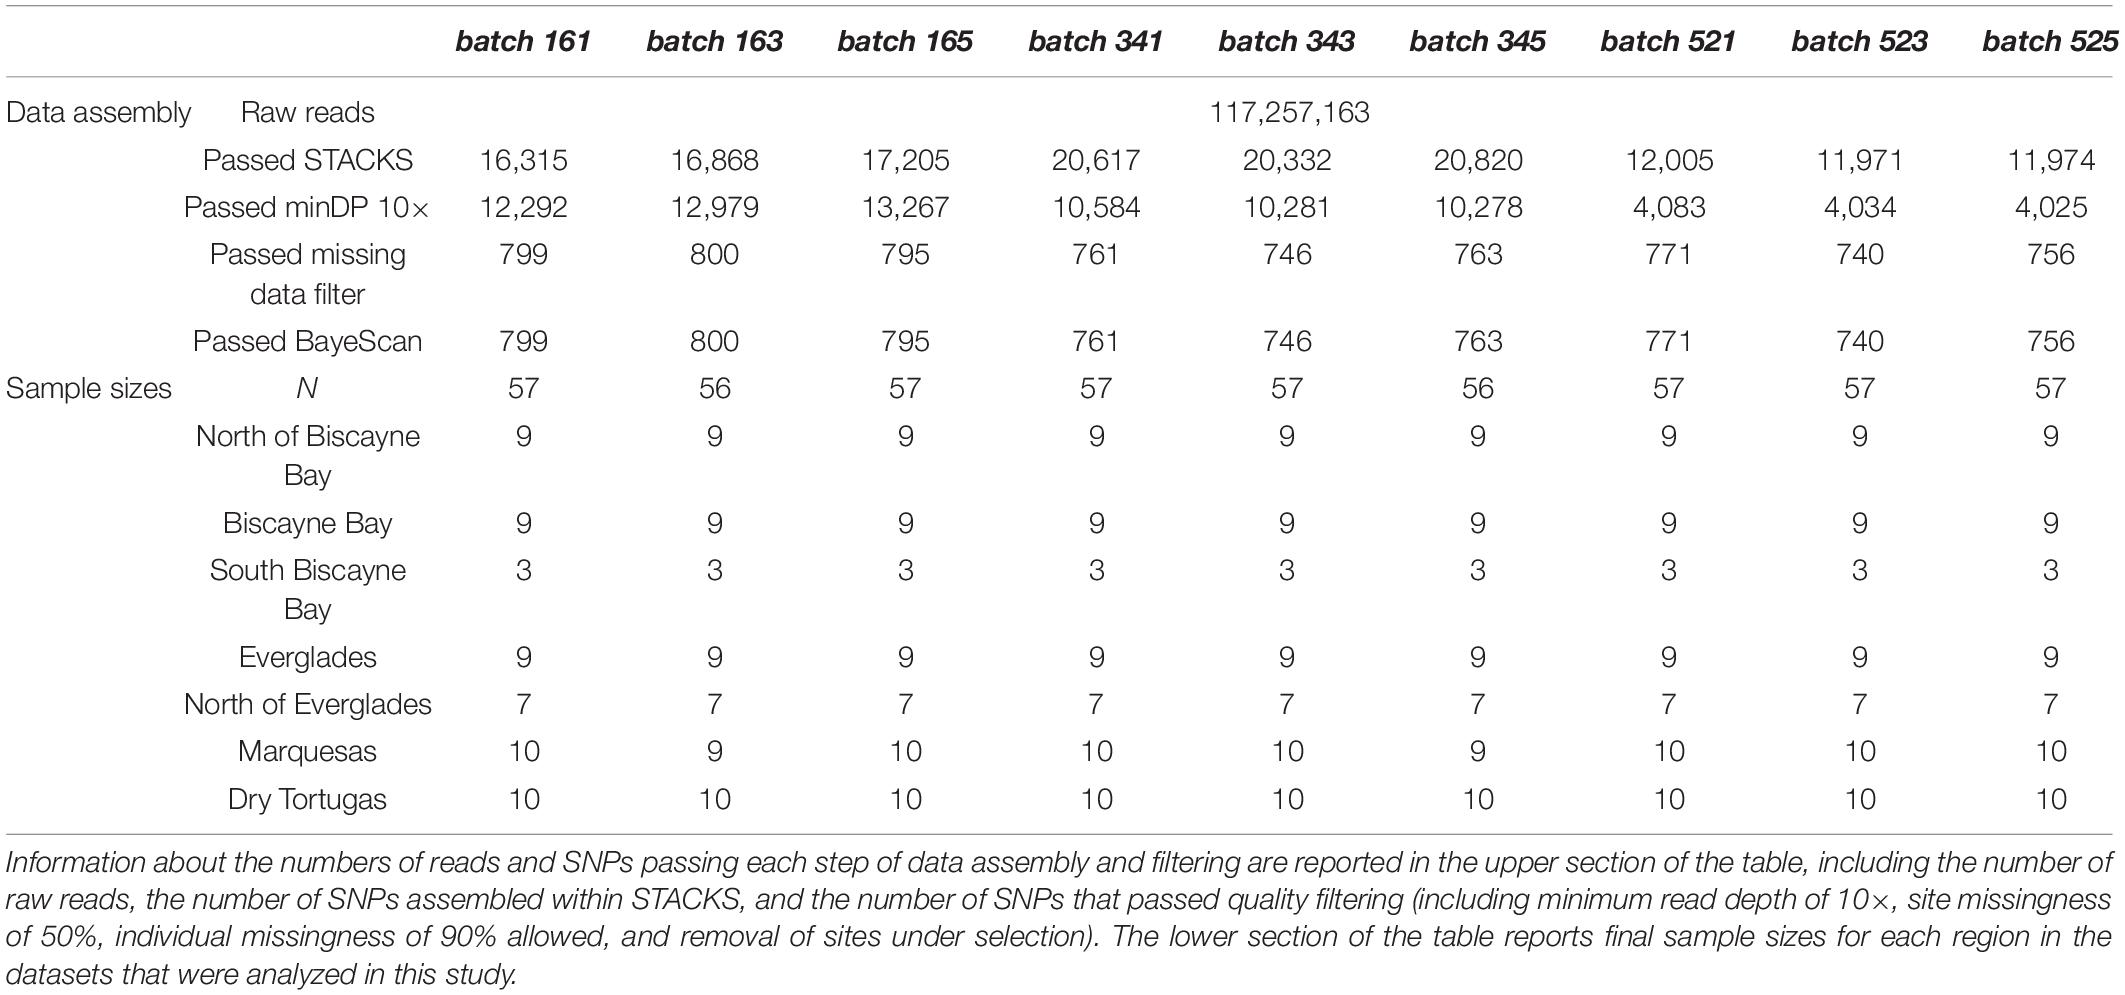
Table 2. Details of the assembled and quality-filtered ddRADseq datasets are presented.
The sample sizes across regions included in the research presented here could be considered low compared to traditional population genetics studies of microsatellites or multilocus datasets. However, reduced representation library (RRL) approaches, such as ddRADseq, generate vastly more data, sampled from across the genome of each individual, and this increase in genomic data for each individual empowers the detection of fine-scale population structure with substantially fewer samples (Willing et al., 2012; Jeffries et al., 2016; Nazareno et al., 2017).
Population Genomics Analyses
Nine datasets were analyzed to better understand the robustness of results to data assembly decisions, however, results across datasets were highly similar. While all results are reported in the Supplementary Materials, only results from batch161, the dataset with the highest number of samples and SNPs (N = 57, SNPs = 799) are presented in-text. Because very few samples representing the SouthBiscayneBay region were retained following quality filtering (n = 3), these samples were removed for calculation of Nei’s unbiased distance calculation, estimation of pairwise FST between populations, and AMOVAs. The SouthBiscayneBay samples were included in PAnorm, PCAs, NJ trees, and STRUCTURE analyses.
Estimates of Nei’s unbiased genetics distance between all region-pairs, excluding SouthBiscayneBay, ranged from 0.003 to 0.006, with the highest value attributable to the comparison between BiscayneBay and North_of_Everglades (Figure 2A and Supplementary Figure 1). The shortest genetic distance was calculated for multiple region-pairs: North_of_BiscayneBay compared to either spawning region (DryTortugas and Marquesas), Everglades compared to either spawning region, and North_of_BiscayneBay compared to Everglades. All other region-pair distances fell between 0.004 and 0.005 (Supplementary Table 2).
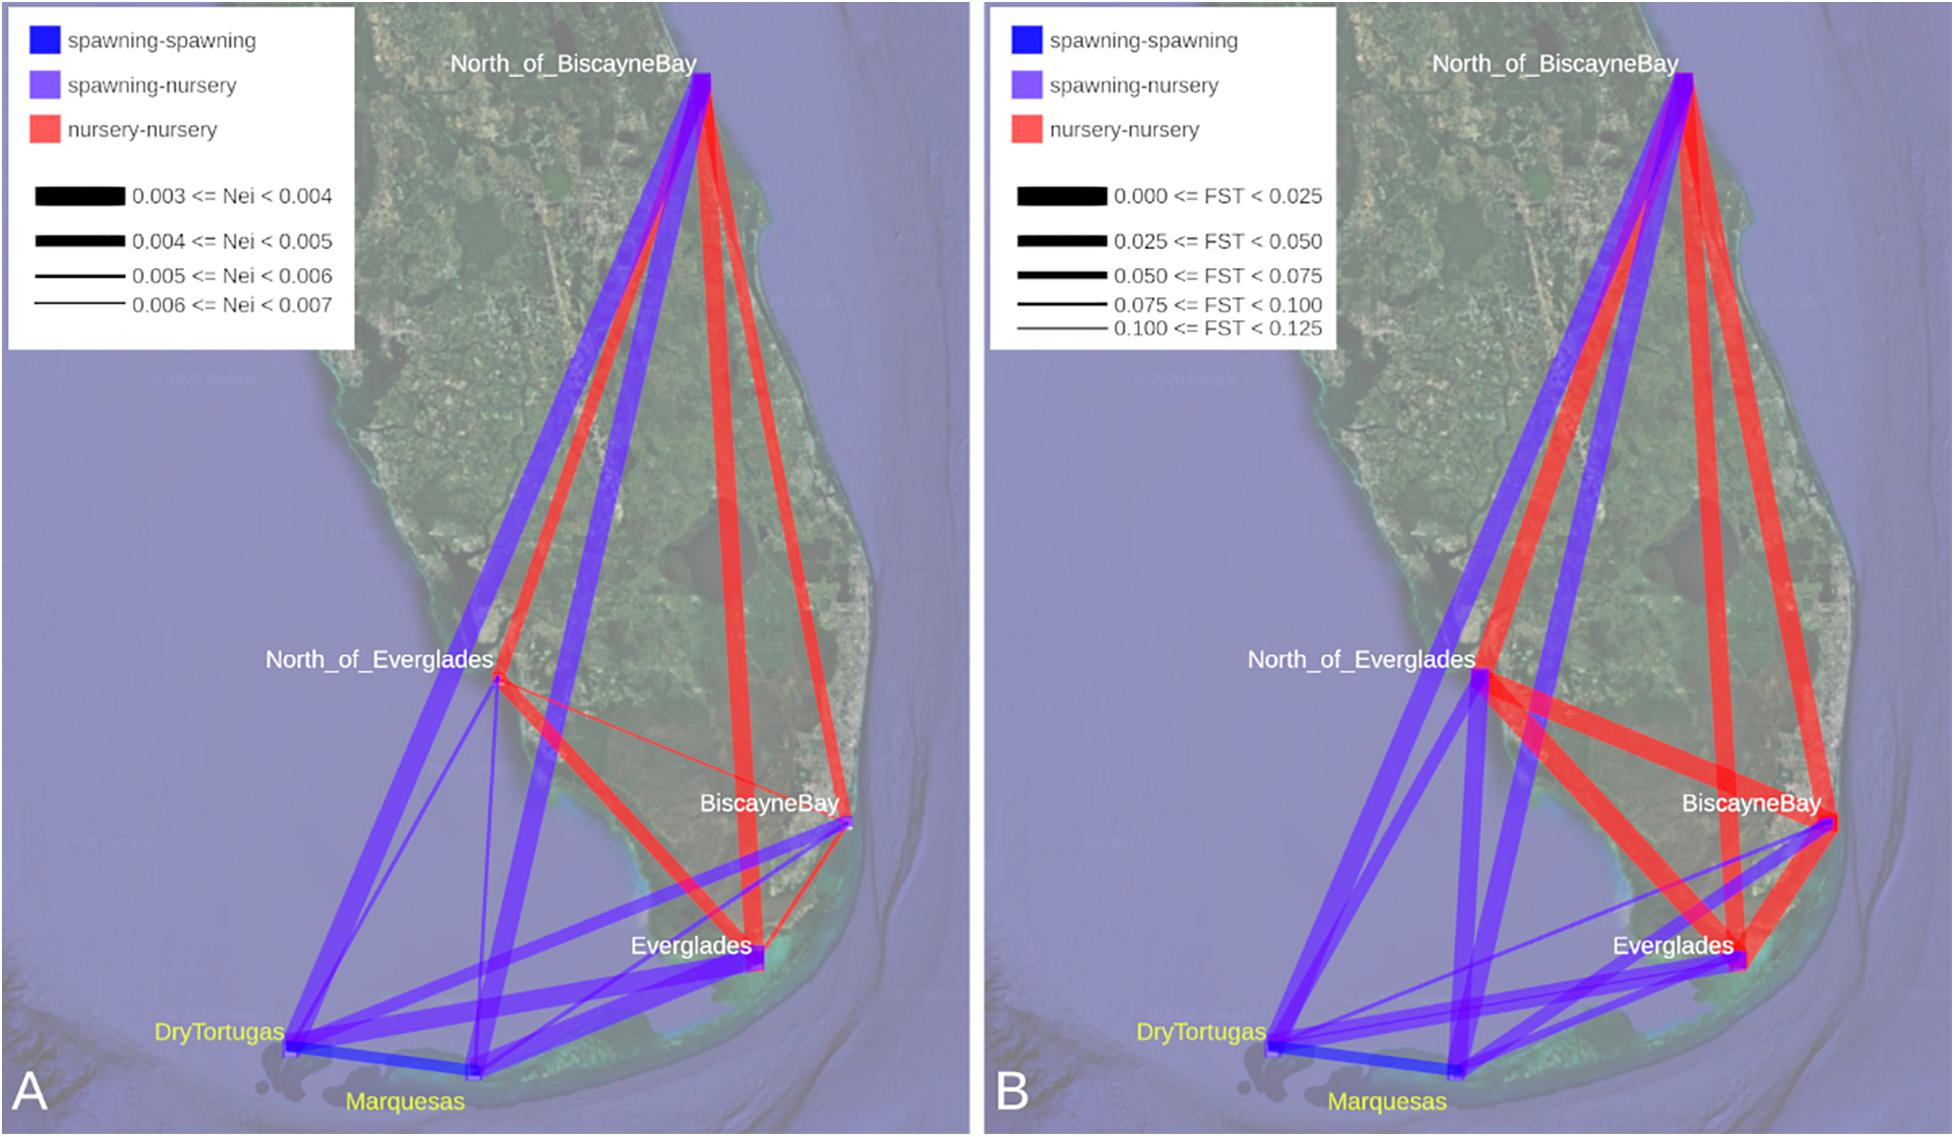
Figure 2. (A) Nei’s unbiased distance values and (B) pairwise FST values are depicted between all regions. Due to the small sample size of the SouthBiscayneBay region (n = 3), samples from this region have been excluded from these analyses. Detailed results for each dataset are presented in Supplementary Tables 2, 3 (Nei’s and FST, respectively) and distributions are plotted in Supplementary Figures 1, 2 (Nei’s and FST, respectively). Line color indicates the type of region pair: nursery region to nursery region (red), nursery region to spawning region (purple), or spawning region to spawning region (blue). Line width indicates genetic distance with greater genetic distance or higher FST illustrated with a narrower connecting line. Please note that these lines solely represent pairwise values, not movement of individual shrimp between regions. Spawning regions are labeled in yellow (Base map from Google Earth).
Pairwise comparisons between regions, excluding SouthBiscayneBay, were also examined through estimates of FST (Figure 2B and Supplementary Figure 2), which ranged from 0.000 to 0.102. Many region-pairs returned null FST values: all comparisons including BiscayneBay or North_of_Everglades and a region associated with the nursery range of F. duorarum (Everglades and North_of_BiscayneBay), as well as the Marquesas-DryTortugas region pair. With the exception of the North_of_BiscayneBay-Marquesas region pair, all non-zero FST were characteristic of region pairs that included a spawning region, with the highest FST values calculated between DryTortugas and Everglades (Supplementary Table 3), though recall that DryTortugas-Everglades had a very low genetic distance.
Analyses of Molecular Variance across all nine datasets, excluding SouthBiscayneBay, yielded an average among-population variance value of 1.69% (standard deviation 0.71%, Table 3). The vast majority of molecular variance was attributable to differences among individuals (88.49%, standard deviation 1.68%) and the remainder came from differences within individuals. Overall average FST (the proportion of total genetic variance found within a population), FIS (the proportion of genetic variance in a population which is found within an individual from that population), and FIT (the proportion of total genetic variance found within an individual) reflected these values as well (0.017 ± 0.007, 0.900 ± 0.014, and 0.902 ± 0.014, respectively). Across the nine AMOVAs, FST was statistically significant in two cases, while FIS and FIT were statistically significant in every case.
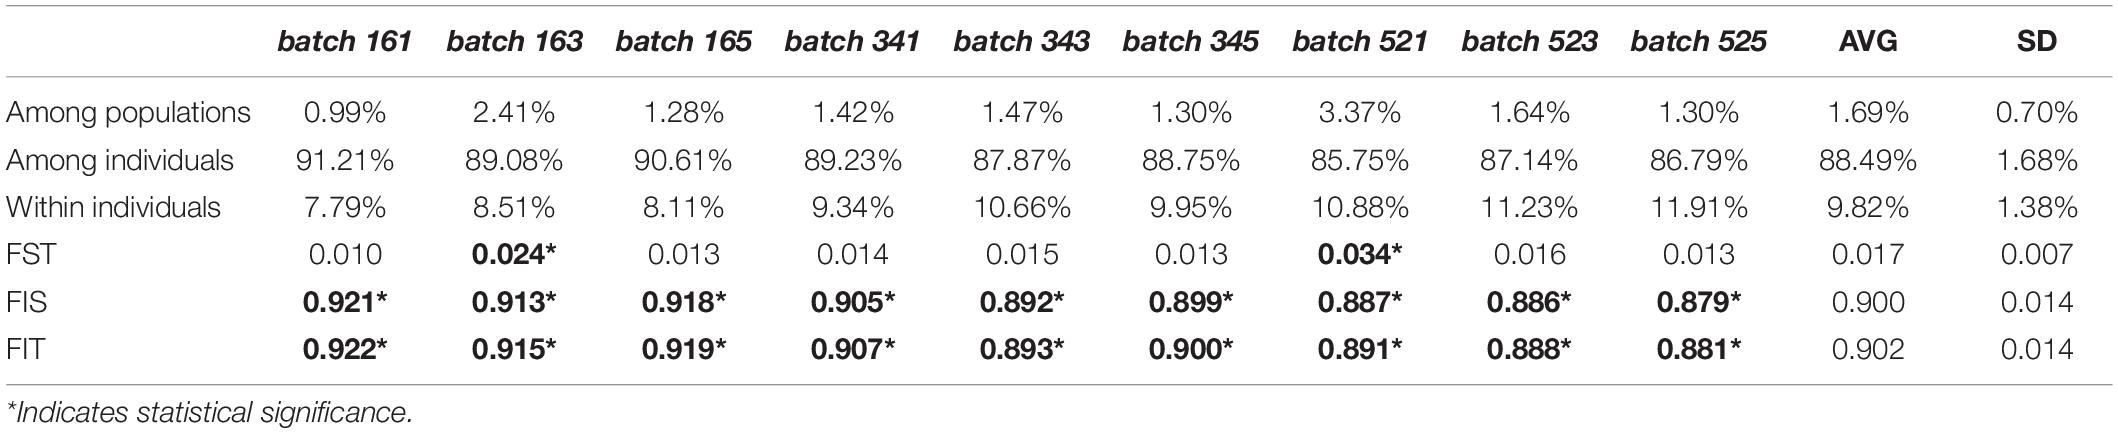
Table 3. Analyses of molecular variance (AMOVA) results and F statistics.
Results from Principal Component Analysis (batch161 presented in Figure 3A; all batches presented in Supplementary Figure 3) and DAPCs (batch161 presented in Figure 3B, all batches presented in Supplementary Figure 4) include all samples, revealing a large, central cluster. However, samples from the DryTortugas are slightly shifted from the center. The NJ results (batch161 presented in Figure 3C; all batches presented in Supplementary Figure 5), which included samples from SouthBiscayneBay, show little structure. Across NJ trees, only two BiscayneBay samples are differentiated from the otherwise unstructured tree, but the other BiscayneBay samples do not reflect a larger separation of the region from the rest of the samples. To ensure these individuals did not represent contamination, we confirmed the taxonomic identification of these two samples as F. duorarum.
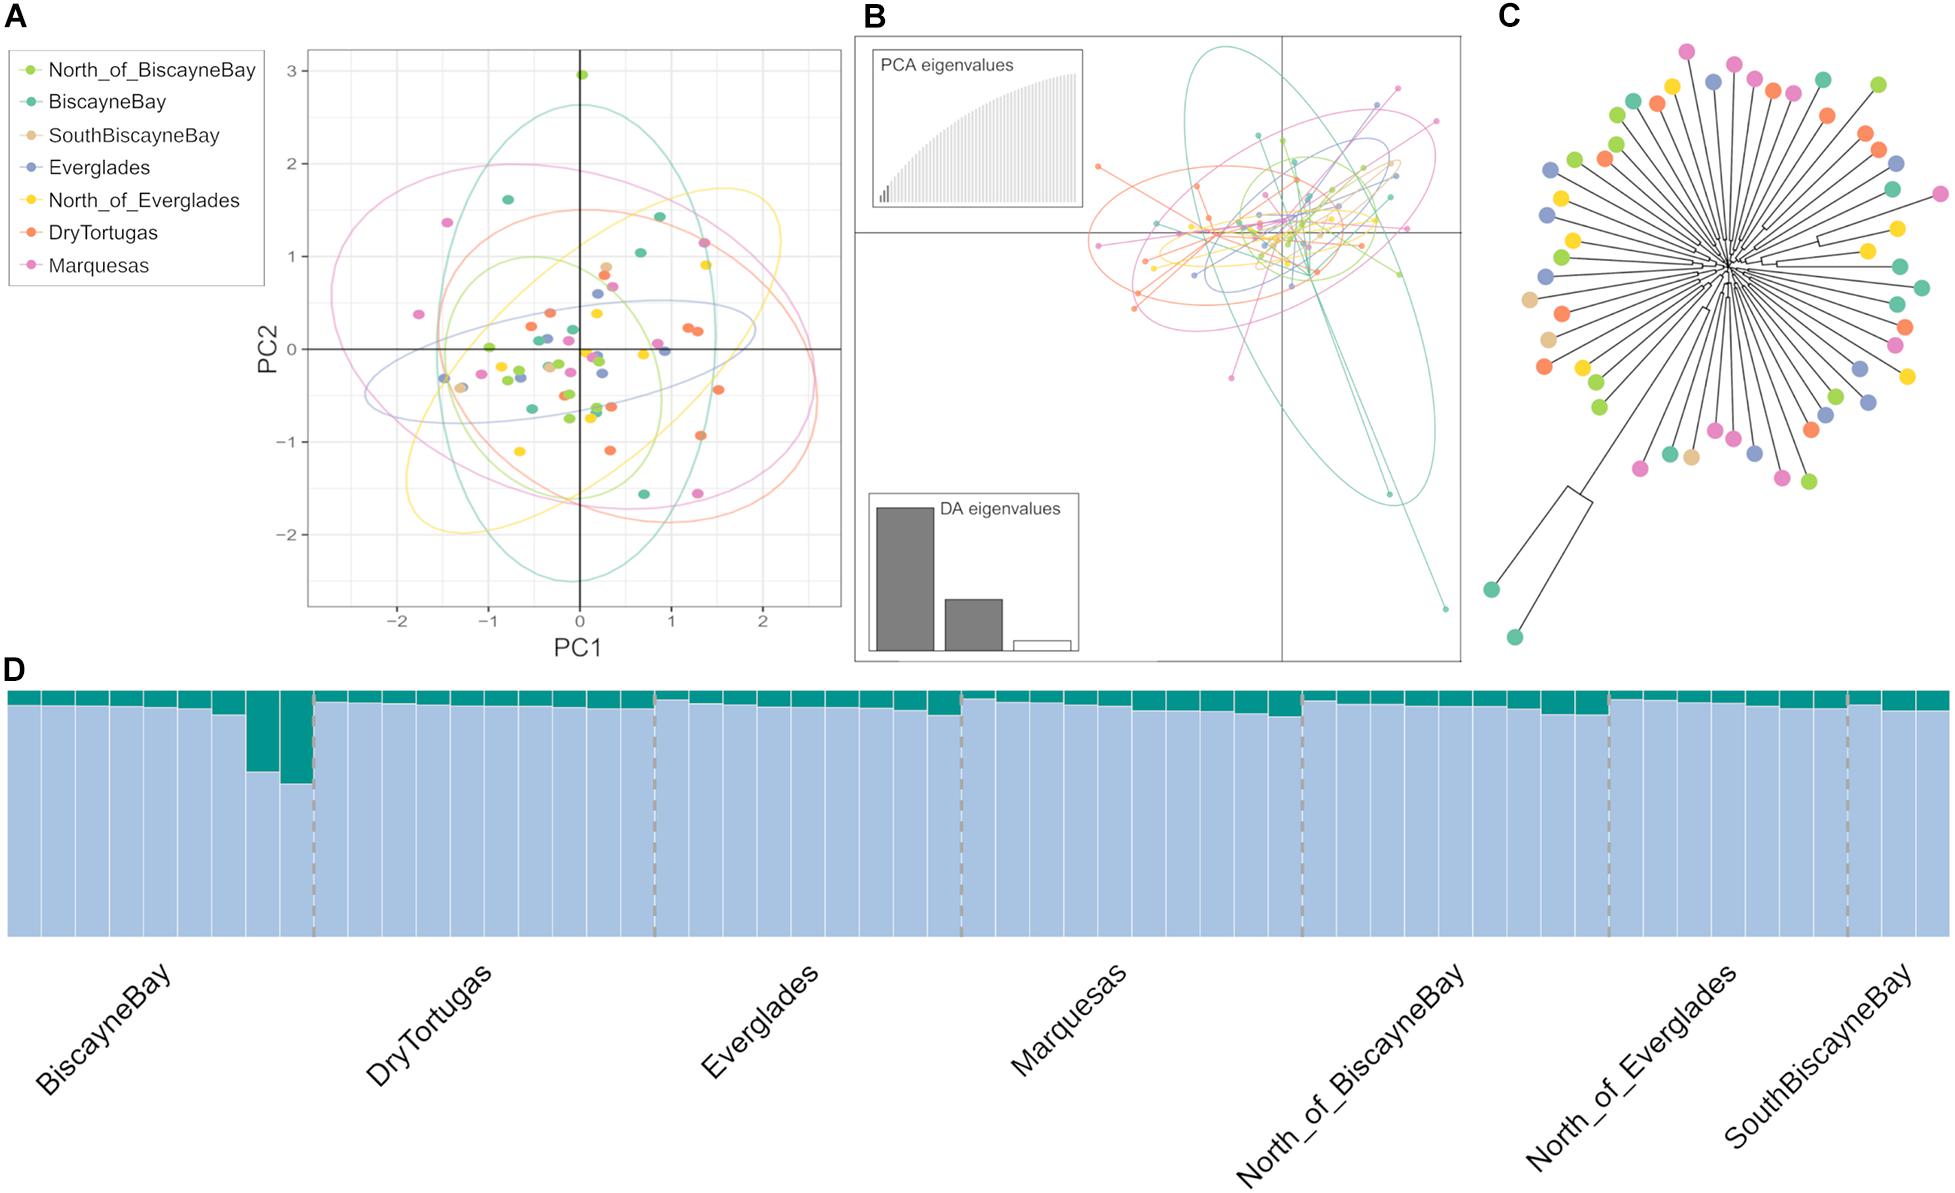
Figure 3. (A) Principal component analysis (PCA; PC1 and PC2 explain 4.1 and 4.0%, respectively). (B) Discriminant Analysis of Principal Components (DAPC), and (C) Neighbor Joining Tree (NJ) of the batch161 dataset. All seven regions are represented and points are color-coded by collection site. (D) STRUCTURE results are reported for all seven regions (reported beneath the plot) for batch161. K = 2 was deemed optimal using the Evanno method. Results across all nine datasets are presented in Supplementary Figures 3–6 (PCAs, DAPCs, Njs, and STRUCTURE plots, respectively).
Further examining relationships between samples with the K-means clustering method STRUCTURE, the Evanno method was applied to identify the optimal K in each analysis. Across datasets, the Evanno method identified K = 2 as the optimal number of clusters within the data (Supplementary Figure 6). The two BiscayneBay samples differentiated in the NJ trees are clearly seen in the STRUCTURE plots as representing higher proportions of the minor cluster, otherwise all individuals appear highly similar, regardless of collection region (Figure 3D).
Normalized counts of private alleles within each region (PAnorm), including SouthBiscayneBay, ranged from 7.3 (standard deviation 0.7, Everglades) to 10.4 (standard deviation 1.1, BiscayneBay) private alleles per sampled individuals (Figure 4 and Supplementary Table 4). With the exception of BiscayneBay, spawning regions had higher normalized private allele counts (Marquesas = 10.2 ± 1.2, DryTortugas = 10.1 ± 0.6) than regions from the nursery range.
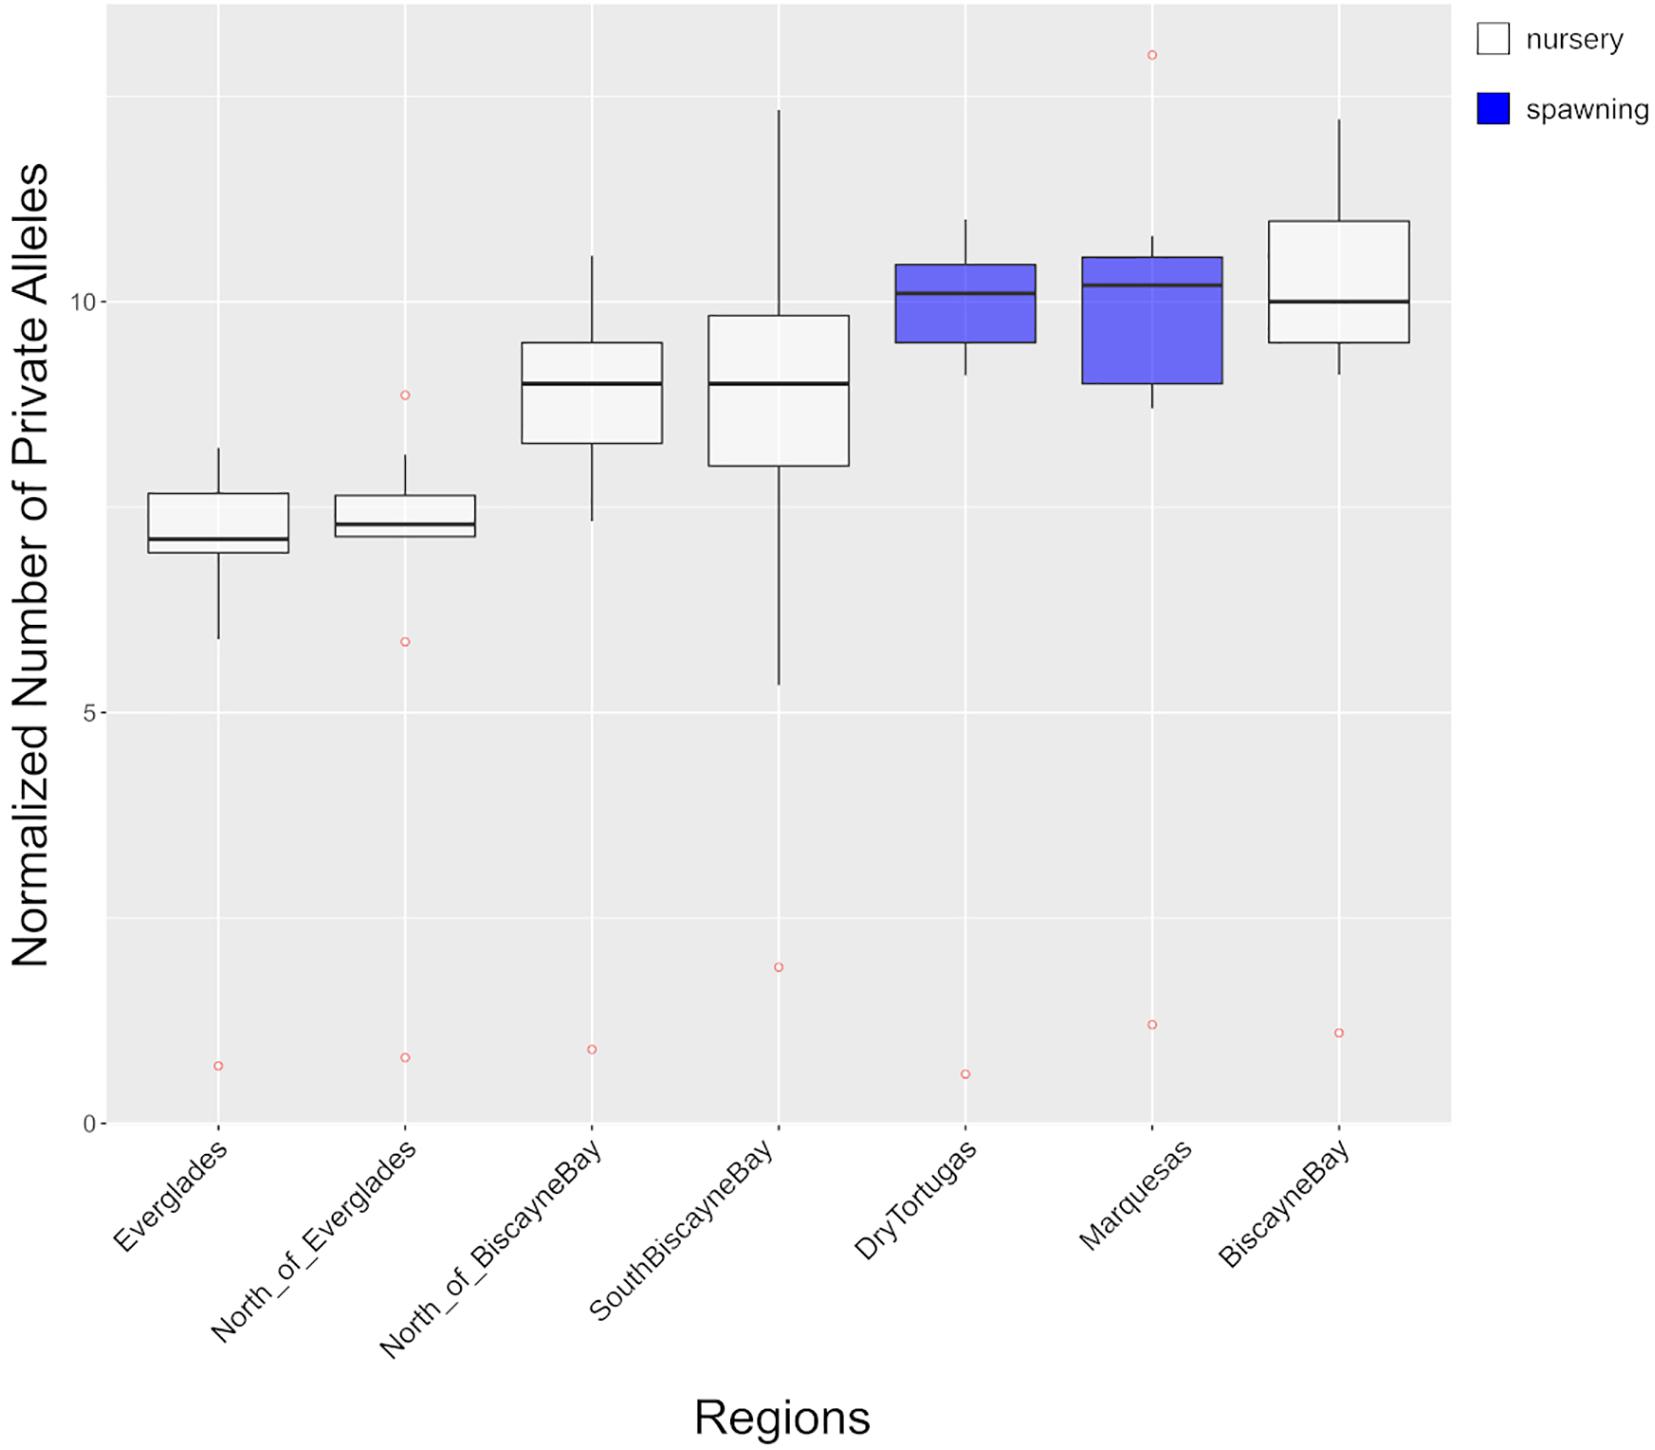
Figure 4. The number of private alleles, normalized by each region’s sample size (referred to as PAnorm in-text), are presented for each region. Detailed results for each dataset are presented in Supplementary Table 4. Box color indicates the type of region: nursery region (white) or spawning region (blue). Outliers are red.
Validating the Existing Biophysical Oceanographic Model
Expectations under the existing model were evaluated through several tests of significance (Table 4): to begin, we evaluated whether PAnorm differed significantly between spawning regions and nursery regions. A one-tailed, two-sample t-test assuming unequal variances between PAnorm of nursery regions (North_of_BiscayneBay, BiscayneBay, SouthBiscayneBay, Everglades, and North_of_Everglades) and spawning regions (DryTortugas and Marquesas) indicated significantly higher PAnorm in spawning regions (tstat = –4.46; p = 2.23 × 10⁻⁵). Next, we performed two single-factor ANOVAs to test whether Nei’s unbiased genetic distances or pairwise FST values differed significantly between types of region-pairs: spawning-spawning, spawning-nursery, and nursery-nursery (Table 4). The ANOVA analyzing Nei’s unbiased distances between region-pairs did not detect a statistically significant difference between region-pair types (Fstat = 1.95; p = 0.15). The ANOVA analyzing pairwise FST values, however, yielded a statistically significant result (Fstat = 42.83; p = 4.63 × 10⁻¹⁵). We followed the ANOVAs with three two-tailed, paired t-tests comparing PAnorm, Nei’s unbiased genetic distances, and pairwise FST between all nursery regions and DryTortugas to all nursery regions and Marquesas. The normalized number of private alleles and Nei’s distances did not differ significantly by spawning region (PAnorm tstat = 2.31, p = 0.91; Nei’s tstat = 0.48, p = 0.63), while pairwise FST values were significantly higher between region-pairs including DryTortugas compared to region-pairs including Marquesas (tstat = –8.22; p = 1.09 × 10⁻⁹).
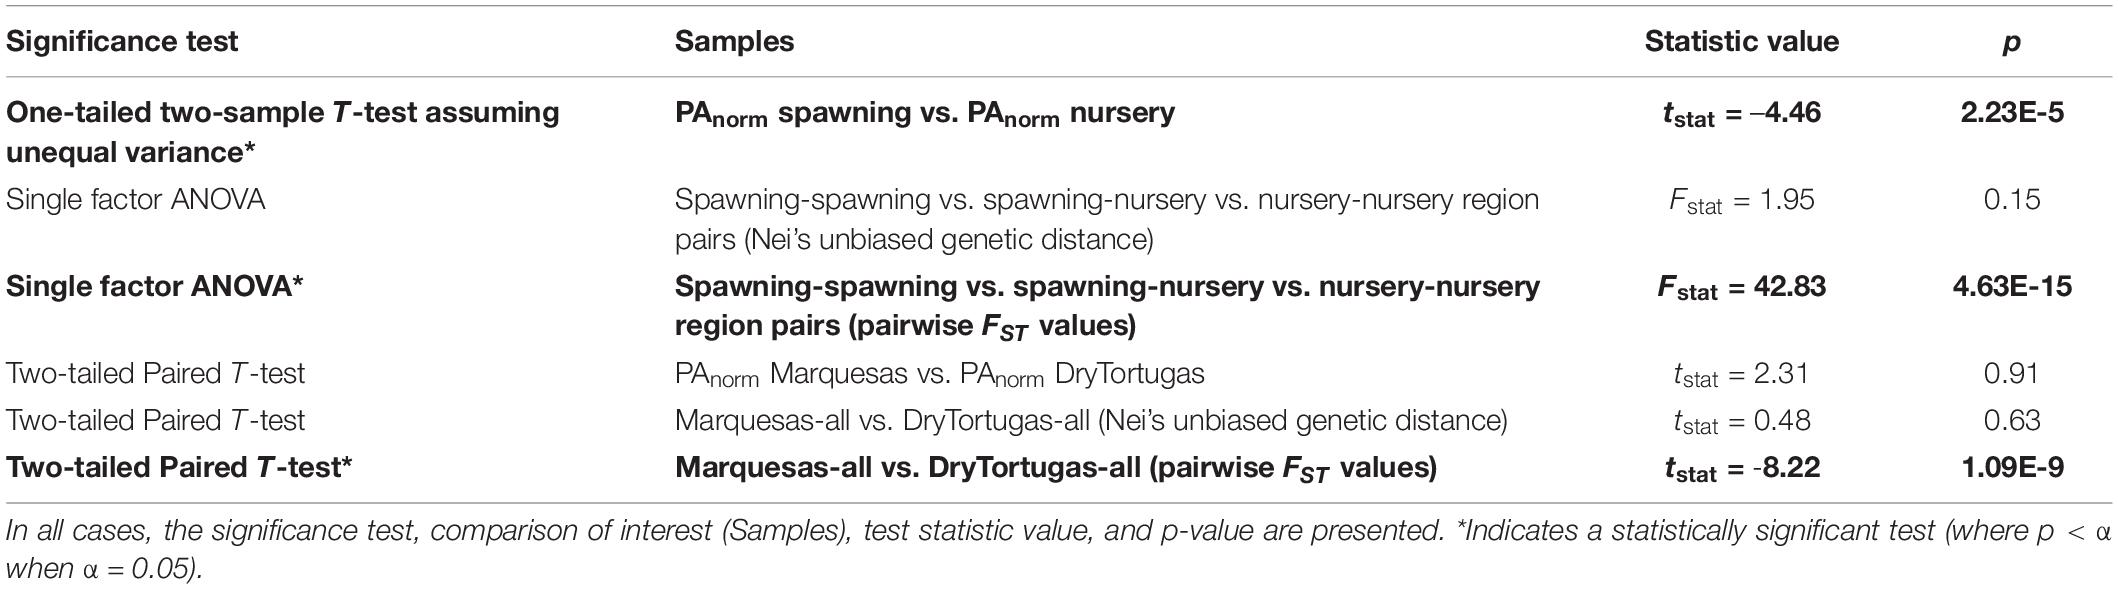
Table 4. Results of all significance tests comparing region types (spawning vs. nursery), region-pair types (spawning-spawning vs. spawning-nursery vs. nursery-nursery region pairs), and spawning regions (Marquesas vs. DryTortugas).
Discussion
The study presented here used next-generation sequencing data to inform management strategies by characterizing the population dynamics of F. duorarum around the Florida Peninsula, with specific focus on the role of migration from spawning aggregations to nursery grounds. Much of this work was motivated by the biophysical oceanographic model of larval transport from spawning aggregations offshore of the Dry Tortugas and Marquesas to nursery grounds in Florida Bay (Criales et al., 2015). The model supported two migration routes from spawning regions to nursery grounds: the major route crosses the southwest Florida shelf in a fairly direct east-northeast path (Munro et al., 1968; Criales et al., 2003); the minor route involves downstream transport along the Florida Current, bringing larvae east-northeast with the Current and then breaking with the Florida Current to move west-northwest toward Florida Bay through the passes in the Middle and Lower Florida Keys (Jones et al., 1970; Criales et al., 2006). These two routes have the potential to sustain population differentiation within the species, representing overlooked biodiversity. Independent analysis of next-generation sequencing data revealed some population differentiation associated with the Dry Tortugas. With some caveats, the work presented here provides strong support for the model of larval migration and recruitment developed by Criales et al. (2015).
Utilizing Population Genomics Data to Validate a Biophysical Oceanographic Model
There is no paucity of potentially confounding variables when modeling current- and tide-mediated transport of dispersing larvae: the oversimplification of active swimming behaviors and the disparity between potential and realized dispersal has been described previously, including the biological importance of single individuals occasionally dispersing long distances (Shanks, 2009). However, biophysical modeling can be used in concert with genetic evidence to improve our understanding of the dynamic relationships between marine organisms and their environment (Liggins et al., 2013; Timm et al., 2020). Such an integrative approach has been utilized in studies of marine invertebrate populations (Dawson et al., 2005), including a recent study investigating the causes of population structure in an economically important decapod, the spiny lobster Panulirus argus (Truelove et al., 2017).
The biophysical oceanographic model developed by Criales et al. (2015) describes two migratory routes, which differ in their origin (Dry Tortugas and Marquesas vs. Dry Tortugas only), usage (many vs. few individuals, represented as particles), and recruitment success (majority of particles are successfully recruited to Florida Bay vs. few particles are successfully recruited). These differences have the potential to maintain intraspecific diversity via population differentiation. It is important to note that no model perfectly reflects reality; while the model developed by Criales et al. (2015) accounts for direction and velocity across water depth, this information is not discussed in the work. However, the model provides three questions that can be addressed with population genomics: Is there independent support for the model? Do the modeled spawning aggregations sufficiently explain the genomic results? Do we see evidence that the minor route sustains a differentiated population?
Next-generation sequencing data provided strong support for the existing model of larval transport: across analyses, samples collected from the Marquesas and Dry Tortugas were clearly part of a larger population present across the Florida Peninsula (see Figure 3). The presence of significantly more private alleles in the spawning regions compared to the nursery sites (Table 4) further supports the model of larvae originating from the Dry Tortugas and the Marquesas. It is worth explicitly addressing the two Biscayne Bay outliers identified throughout clustering analyses in Figure 3, which suggest recruitment to Biscayne Bay from a spawning aggregation that was not sampled in this study. In this regard, the existing model, which simulates spawning aggregations in the Marquesas and the Dry Tortugas, may not be complete and an additional spawning site contributes recruits to the region.
Evidence of Population Structure in the Study Region
Under the null hypothesis, we expect one homogeneous population present throughout the study region. While cluster analyses (PCA, DAPC, and STRUCTURE) do not clearly delineate populations, we see some shifting of samples from the Dry Tortugas (Figure 3), and statistical tests of population differentiation (global and pairwise) indicate low levels of structure throughout (though these values are only rarely statistically significant). This structure provides evidence for the alternative hypothesis: the separate spawning aggregations and migratory routes (major and minor) support genetic structure in the pink shrimp population around the Florida Peninsula.
With few exceptions, significant pairwise population differentiation was highest and statistically significant when regions from the nursery range were compared to spawning regions (Figure 2, Supplementary Figure 2, and Supplementary Table 3). Examining pairwise population differentiation by region pair type (spawning-spawning vs. spawning-nursery vs. nursery-nursery) revealed significant differences (Table 4), with differentiation between the spawning-spawning pair < nursery-nursery pair < spawning-nursery pair. To a large extent, the Dry Tortugas seems to be driving this trend: analyses of population differentiation indicate the Marquesas region is better genetically connected to the nursery regions than the Dry Tortugas region is (Figure 2B and Supplementary Table 3). It should be noted that the highest significant pairwise population differentiation calculated in this study was relatively low, but low, statistically significant FST estimates are fairly common in the marine realm (Waples, 1998; Waples and Gaggiotti, 2006; Hauser and Carvalho, 2008; Therkildsen et al., 2013; Timm et al., 2020). This would also explain the lack of clear structuring in clustering analyses.
The presence of a differentiated population in the Dry Tortugas (hereafter referred to as the “Dry Tortugas subpopulation”) is unexpected. Recall that larvae are spawned offshore of the Dry Tortugas and the Marquesas. Larvae pass through a series of developmental stages as they migrate, taking the major or minor route (Figure 1), to estuarine nursery grounds around the Florida Peninsula where they complete their maturation into adults. Year-round, these adults migrate back to the spawning aggregations to reproduce, which should, theoretically, lead to sufficient mixing to result in a single, genetically homogeneous population. We suspect the maintenance of a Dry Tortugas subpopulation may be the result of geographic or temporal separation of spawning populations. By the geographic mechanism, the Dry Tortugas subpopulation spawns exclusively in the Dry Tortugas and solely utilizes the minor migratory route, while the larger population spawns in the Dry Tortugas and the Marquesas and utilizes the major migratory route. However, the lack of clearly defined genetic structure separating the Dry Tortugas subpopulation from the larger population suggests this geographic mechanism is not sufficient to explain the results presented here.
The population structure we identify may also be the result of a temporal mechanism: since the 1980s, Key West shrimpers have reported anecdotal evidence of two spawning surges annually for the past several decades (pers. comm.) and unpublished data of Robblee suggest two peaks in population abundance of juvenile pink shrimp in western Florida Bay (pers. comm.). Costello and Allen (1966) also remark on the seasonal nature of juvenile pink shrimp in the region. Without additional data, it is difficult to characterize this mechanism further; however, if adults of the Dry Tortugas subpopulation arrive at the Dry Tortugas spawning ground before or after the larger aggregation, they will only be able to reproduce with each other. Moreover, depending on the seasonal timing of this second spawning surge, larvae originating from the Dry Tortugas subpopulation may utilize the minor migratory route to Florida Bay, leading to higher mortality and lower recruitment success. Given the lack of a clearly distinguishable Dry Tortugas subpopulation in the clustering analyses, it may be that such a mechanism results in the differentiation of the Dry Tortugas subpopulation, with occasional gene flow between it and the larger population preventing strong genetic structuring.
Either mechanism, geographic or temporal, might be facilitated by local recruitment of the Dry Tortugas population to the Dry Tortugas or a region not represented by samples collected for this study. In line with the alternative hypothesis, we find evidence of an unsampled spawning aggregation contributing individuals to Biscayne Bay and the Everglades: both regions show low-but-significant differentiation from the Marquesas and the Dry Tortugas, but no differentiation between themselves. The Loop Current’s episodic influence may bring migrants into nearshore currents, bringing recruits to Biscayne Bay from the Caribbean (Saloman et al., 1968). Alternatively, migrants may be contributed from the Sanibel spawning aggregation. A previous mark-recapture study found that, while geographic ranges of stocks from the Dry Tortugas and Sanibel overlap in nursery grounds, there is only evidence of weak, one-way migration of Sanibel stocks to the Dry Tortugas (Costello and Allen, 1966). Such separation between spawning grounds could provide a basis for population differentiation. Interestingly, this mark-recapture study did not find any evidence of shrimp migration between Biscayne Bay and the Sanibel grounds, nor between Biscayne Bay and the Dry Tortugas; indeed, all individuals marked and released within Biscayne Bay were only ever recovered from Biscayne Bay. The results presented here contradict this study, finding gene flow between the Dry Tortugas and Biscayne Bay (though Biscayne Bay may also receive recruits from a spawning aggregation that was not sampled in the current study).
Spawning-recruitment relationships of pink shrimp in south Florida appear to be more complex than previously believed and additional research is needed to investigate the mechanisms we hypothesize here. Representative sampling of F. duorarum from Sanibel, Cuba, and the Bahamas would be needed to further investigate the relative support for these potential sources of postlarval migrants. Anecdotal evidence of spawning surges, and the role this may play in the population structure of pink shrimp around the Florida Peninsula, would require a longitudinal study to better understand this mechanism.
Relevance to Fisheries Management
The fisheries supported by F. duorarum contribute to economies internationally (Sheridan, 1996; Ramírez-Rodríguez et al., 2003; Hart et al., 2012), and the continued exploitation of this natural resource is critically dependent on the stability and sustainability of the species in the Gulf of Mexico and around the Florida Peninsula. One crucial factor contributing to species stability is successful larval recruitment: the movement of larval and postlarval individuals from spawning aggregations to nursery grounds.
Our results support the biophysical oceanographic model developed by Criales et al. (2015), which indicates a major route, traversed by larvae from the Dry Tortugas and the Marquesas, and a minor route, which only resulted in successful recruitment when larvae originated from the Dry Tortugas. Moreover, we find evidence that samples from the Dry Tortugas represent a differentiated population. Co-located with this region is a pink shrimp fishery (Klima et al., 1987; Hart et al., 2012), which harvests mature and young adult shrimp year-round on the lower southwest Florida shelf (Ehrhardt and Legault, 1999; Browder et al., 2002), perhaps with important implications for intraspecific genetic diversity: individuals harvested near the Dry Tortugas may represent the subpopulation indicated by our analyses. The removal of these individuals could undermine the subpopulation’s stability by reducing the density of juveniles and subsequently decreasing recruitment success (Ehrhardt et al., 2001).
Additional work is needed to further characterize the role of these two spawning grounds and migration routes, particularly by including individuals collected from the Sanibel grounds and the Caribbean. Such research will assist in determining whether the species should be managed as a single stock or if more complex management is required. Enhancing our understanding of larval recruitment success in F. duorarum will ultimately improve the long-term sustainability of these fisheries while protecting diversity within the species.
Data Availability Statement
The datasets presented in this study can be found in online repositories. The names of the repository/repositories and accession number(s) can be found below: https://www.ncbi.nlm.nih.gov/, PRJNA554161; https://data.gulfresearchinitiative.org, doi: 10.7266/n7-hhnq-kh83.
Author Contributions
TJ collected samples for inclusion in this study. JB and HB-G provided financial support for the research. LT performed the lab work and data analysis, generating an early version of this manuscript, including all tables, figures, and Supplementary Materials. All authors contributed to the study design and final manuscript.
Funding
This research was made possible by a grant from the Gulf of Mexico Research Initiative (GOMRI) and NOAA RESTORE project (to Bracken-Grissom), as well as the Colorado Biomedical Informatics Training Program (to Timm, NIH T15 LM009451).
Conflict of Interest
The authors declare that the research was conducted in the absence of any commercial or financial relationships that could be construed as a potential conflict of interest.
Acknowledgments
Logistic support for this study was provided by the Protected Resources and Biodiversity Division of the Southeast Fisheries Science Center, National Marine Fisheries Service, Miami, Florida. The authors also extend their gratitude to the shrimpers who donated samples for inclusion in this study, as well as to the port agents (Thomas Herbert, Ft. Myers Beach, and Edwin Pulido, Key West) who collected the samples from the shrimpers and shipped them to Miami. The authors further thank Ms. Michelle Harangody for her assistance in taxonomically identifying putative specimens of Farfantepenaeus duorarum, Ms. Shaina Simon for her early work on this project, as well as Emily Warschefsky for her support in the library preparation stage of the study. Special gratitude is due to Ed Little for providing the initial anecdotal evidence of temporally staggered spawning events in the region in 1995. Finally, the authors thank Maria Criales and the reviewers for their feedback on earlier versions of this manuscript. This is contribution #285 from the Coastlines and Oceans Division of the Institute of Environment at Florida International University. The scientific results and conclusions, as well as any views or opinions expressed herein, are those of the authors and do not necessarily reflect those of NOAA or the Department of Commerce.
Supplementary Material
The Supplementary Material for this article can be found online at: https://www.frontiersin.org/articles/10.3389/fevo.2021.659134/full#supplementary-material
References
Andrews, S. (2010). FastQC: A Quality Control Tool for High Throughput Sequence Data. Available online at: http://www.bioinformatics.babraham.ac.uk/projects/fastqc (accessed April 2020).
Arreguín-Sánchez, F., Sánchez, J. A., Flores-Hernández, D., Ramos-Miranda, J., Sánchez-Gil, P., and Yáñez-Arancibia, A. (1999). “Stock–recruitment relationships (SRRs): a scientific challenge to support fisheries management in the Campeche Bank, Mexico,” in The Gulf of Mexico Large Marine Ecosystem, eds H. Kumpf and K. Sherman (Malden, MA: Blackwell Science), 225–235.
Arreguín-Sánchez, F., Schultz-Ruiz, L. E., Sanchez, J. A., Gracia, A., and Alarcon, T. (1997). “Estado actual y perspectvas del recurso camaron en prensa,” in Analisis y Diagnostico de los Recursos Pesqueros Criticos del Gulfo de Mexico, 7th Edn, eds D. Flores-Hernandez, P. Sanchez-Gil, J. C. Seija, and F. Arreguin-Sanchez (Campeche: EPOMEX Serie Cientifica.), 185–203.
Arreguín-Sánchez, F., Zetina-Rejón, M., and Ramírez-Rodríguez, M. (2008). Exploring ecosystem-based harvesting strategies to recover the collapsed pink shrimp (Farfantepenaeus duorarum) fishery in the southern Gulf of Mexico. Ecol. Model. 214, 83–94. doi: 10.1016/j.ecolmodel.2007.11.021
Avise, J. C. (1992). Molecular population structure and the biogeographic history of a regional fauna: a case history with lessons for conservation biology. Oikos 63, 62–76. doi: 10.2307/3545516
Bernatchez, L. (1995). “A role for molecular systematics in defining evolutionarily significant units in fishes,” in Evolution and the Aquatic Ecosystem: Defining Unique Units in Population Conservation, ed. J. L. Nielsen (Bethesda, MA: American Fisheries Society), 114–132.
Browder, J. A., Restrepo, V. R., Rice, J. K., Robblee, M. B., and Zein-Eldin, Z. (1999). Environmental influences on potential recruitment of pink shrimp, Farfantepenaeus duorarum, from Florida Bay Nursery Grounds. Coast. Estuar. Res. Federat. 22, 484–499. doi: 10.2307/1353213
Browder, J. A., and Robblee, M. B. (2009). Pink shrimp as an indicator for restoration of everglades ecosystems. Ecol. Ind. 9(Suppl.), 17–28. doi: 10.1016/j.ecolind.2008.10.007
Browder, J. A., Zein-Eldin, Z., Criales, M. M., Robblee, M. B., Wong, S., Jackson, T. L., et al. (2002). Dynamics of pink shrimp (Farfantepenaeus duorarum) recruitment potential in relation to salinity and temperature in Florida Bay. Coast. Estuar. Res. Federat. 25, 1355–1371. doi: 10.1007/bf02692230
Burkenroad, M. D. (1939). Further observations on the Penaeidae of the northern Gulf of Mexico. Bull. Bingham Oceanogr. Collect. 6, 1–62.
Catchen, J., Hohenlohe, P. A., Bassham, S., Amores, A., and Cresko, W. A. (2013). Stacks: an analysis tool set for population genomics. Mol. Ecol. 22, 3124–3140. doi: 10.1111/mec.12354
Condie, S. A., Loneragan, N. R., and Die, D. J. (1999). Modelling the recruitment of tiger prawns Penaeus esculentus and P. semisulcatus to nursery grounds in the Gulf of Carpentaria, northern Australia: implications for assessing stock-recruitment relationships. Mar. Ecol. Prog. Ser. 178, 55–68. doi: 10.3354/meps178055
Costello, T. J., and Allen, D. M. (1966). Migrations and geographic distribution of pink shrimp, Penaeus duorarum, of the Tortugas and Sanibel grounds, Florida. Fish. Bull. 65, 449–459.
Criales, M. M., Bello, M. J., and Yeung, C. (2000). Diversity and recruitment of penaeoid shrimps (Crustacea: Decapoda) at Bear Cut, Biscayne Bay, Florida, USA. Bull. Mar. Sci. 67, 773–788.
Criales, M. M., Browder, J. A., Mooers, C. N. K., Robblee, M. B., Cardenas, H., and Jackson, T. L. (2007). Cross-shelf transport of pink shrimp larvae: interactions of tidal currents, larval vertical migrations and internal tides. Mar. Ecol. Prog. Ser. 345, 167–184. doi: 10.3354/meps06916
Criales, M. M., Cherubin, L. M., and Browder, J. A. (2015). Modeling larval transport and settlement of pink shrimp in South Florida: dynamics of behavior and tides. Mar. Coast. Fish. 7, 148–176. doi: 10.1080/19425120.2014.1001541
Criales, M. M., Robblee, M. B., Browder, J. A., Cárdenas, H., and Jackson, T. L. (2010). Nearshore concentration of pink shrimp (Farfantepenaeus duorarum) postlarvae in northern Florida bay in relation to nocturnal flood tide. Bull. Mar. Sci. 86, 53–74.
Criales, M. M., Wang, J. D., Browder, J. A., Robblee, M. B., Jackson, T. L., and Hittle, C. (2006). Variability in supply and cross-shelf transport of pink shrimp (Farfantepenaeus duorarum) postlarvae into western Florida Bay. Fish. Bull. 104, 60–74.
Criales, M. M., Yeung, C., Jones, D. L., Jackson, T. L., and Richards, W. J. (2003). Variation of oceanographic processes affecting the size of pink shrimp (Farfantepenaeus duorarum) postlarvae and their supply to Florida Bay. Estuar. Coast. Shelf Sci. 57, 457–468. doi: 10.1016/S0272-7714(02)00374-8
Cummings, W. C. (1961). Maturation and spawning of the pink shrimp, Penaeus duorarum Burkenroad. Trans. Am. FIsh. Soc. 90, 462–468. doi: 10.1577/1548-8659(1961)90[462:masotp]2.0.co;2
Danecek, P., Auton, A., Abecasis, G., Albers, C. A., Banks, E., DePristo, M. A., et al. (2011). The variant call format and VCFtools. Bioinformatics 27, 2156–2158. doi: 10.1093/bioinformatics/btr330
Dawson, M. N., Gupta, A. S., and England, M. H. (2005). Coupled biophysical global ocean model and molecular genetic analyses identify multiple introductions of cryptogenic species. Proc. Natl. Acad. Sci. U.S.A. 102, 11968–11973. doi: 10.1073/pnas.0503811102
Ditty, J. G., and Alvarado Bremer, J. R. (2011). Species discrimination of postlarvae and early juvenile brown shrimp (Farfantepenaeus aztecus) and pink shrimp (F. duorarum) (Decapoda: Penaeidae): coupling molecular genetics and comparative morphology to identify early life stages. J. Crust. Biol. 31, 126–137. doi: 10.1651/10-3304.1
Dobkin, S. (1961). Early developmental stages of the pink shrimp Penaeus duorarum from Florida waters. Fisheries 1, 321–348.
Earl, D. A., and VonHoldt, B. M. (2012). STRUCTURE HARVESTER: a website and program for visualizing STRUCTURE output and implementing the Evanno method. Conserv. Genet. Resour. 4, 359–361. doi: 10.1007/s12686-011-9548-7
Ehrhardt, N. M., and Legault, C. M. (1999). Pink shrimp, Farfantepenaeus duorarum, recruitment variability as an indicator of Florida Bay dynamics. Estuaries 22, 471–483. doi: 10.2307/1353212
Ehrhardt, N. M., Legault, C. M., and Restrepo, V. R. (2001). Density-dependent linkage between juveniles and recruitment for pink shrimp (Farfantepenaeus duorarum) in southern Florida. ICES J. Mar. Sci. 58, 1100–1105. doi: 10.1006/jmsc.2001.1101
Evanno, G., Regnaut, S., and Goudet, J. (2005). Detecting the number of clusters of individuals using the software STRUCTURE: a simulation study. Mol. Ecol. 14, 2611–2620. doi: 10.1111/j.1365-294X.2005.02553.x
Ewald, J. J. (1965). The laboratory rearing of pink shrimp. Penaeus duorarum Burkenroad. Bull. Mar. Sci. 15, 436–449.
Fischer, M. C., Foll, M., Excoffier, L., and Heckel, G. (2011). Enhanced AFLP genome scans detect local adaptation in high-altitude populations of a small rodent (Microtus arvalis). Mol. Ecol. 20, 1450–1462. doi: 10.1111/j.1365-294X.2011.05015.x
Foll, M., Fischer, M. C., Heckel, G., and Excoffier, L. (2010). Estimating population structure from AFLP amplification intensity. Mol. Ecol. 19, 4638–4647. doi: 10.1111/j.1365-294X.2010.04820.x
Foll, M., and Gaggiotti, O. (2008). A genome-scan method to identify selected loci appropriate for both dominant and codominant markers: a Bayesian perspective. Genetics 180, 977–993. doi: 10.1534/genetics.108.092221
Forward, R. B. J., and Tankersley, R. A. (2001). “Selective tidal-stream transport of marine animals,” in Oceanography and Marine Biology: An Annual Review, eds R. N. Gibson, M. Barnes, and R. J. A. Atkinson (Milton Park: Taylor & Francis Inc), 305–353.
Francis, R. M. (2017). pophelper: an R package and web app to analyse and visualize population structure. Mol. Ecol. Resour. 17, 27–32. doi: 10.1111/1755-0998.12509
Hart, R. A. (2017). Stock Assessment Update for Pink Shrimp (Farfantepenaeus duorarum) in the U.S. Gulf of Mexico for the 2016 Fishing Year (Issue December). Avaliable online at: http://www.galvestonlab.sefsc.noaa.gov/publications/pdf/936.pdf (accessed September 2020).
Hart, R. A., Nance, J. J. M., and Primrose, J. A. (2012). The US Gulf of Mexico Pink Shrimp, Farfantepenaeus duorarum, fishery: 50 years of commercial catch statistics. Mar. Fish. Rev. 74, 1–6.
Hauser, L., and Carvalho, G. R. (2008). Paradigm shifts in marine fisheries genetics: ugly hypotheses slain by beautiful facts. Fish Fish. 9, 333–362. doi: 10.1111/j.1467-2979.2008.00299.x
Jeffries, D. L., Copp, G. H., Handley, L. L., Håkan Olsén, K., Sayer, C. D., and Hänfling, B. (2016). Comparing RADseq and microsatellites to infer complex phylogeographic patterns, an empirical perspective in the Crucian carp, Carassius carassius, L. Mol. Ecol. 25, 2997–3018. doi: 10.1111/mec.13613
Jombart, T. (2008). adegenet: a R package for the multivariate analysis of genetic markers. Bioinformatics 24, 1403–1405. doi: 10.1093/bioinformatics/btn129
Jombart, T., and Ahmed, I. (2011). adegenet 1.3-1: new tools for the analysis of genome-wide SNP data. Bioinformatics 27, 3070–3071. doi: 10.1093/bioinformatics/btr521
Jones, A. C., Dimitriou, D. E., Ewald, J. J., and Tweedy, J. H. (1970). Distribution of early developmental stages of pink shrimp. Penaeus duorarum, in Florida waters. Bull. Mar. Sci. 20, 634–661.
Klima, E. F., Nance, J. M., Sheridan, P. F., Baxter, K. N., Patella, F. J., and Koi, D. B. (1987). Review of the 1986 Texas Closure for the Shrimp Fishery off Texas and Louisiana. Galveston, TX: NOAA Technical Memorandum. NMFS-SEFC-197.
Liggins, L., Treml, E. A., and Riginos, C. (2013). Taking the plunge: an introduction to undertaking seascape genetic studies and using biophysical models. Geogr. Compass 7, 173–196. doi: 10.1111/gec3.12031
Lischer, H. E. L., and Excoffier, L. (2012). PGDSpider: an automated data conversion tool for connecting population genetics and genomics programs. Bioinformatics 28, 298–299. doi: 10.1093/bioinformatics/btr642
Mastretta-Yanes, A., Arrigo, N., Alvarez, N., Jorgensen, T. H., Piñero, D., and Emerson, B. C. (2015). Restriction site-associated DNA sequencing, genotyping error estimation and de novo assembly optimization for population genetic inference. Mol. Ecol. Resour. 15, 28–41. doi: 10.1111/1755-0998.12291
Munro, J. L., Jones, A. C., and Dimitriou, D. (1968). Abundance and distribution of the larvae of the pink shrimp (Penaeus duorarum) on the Tortugas Shelf of Florida, August 1962-October 1964. Fish. Bull. 67, 165–181.
Nazareno, A. G., Bemmels, J. B., Dick, C. W., and Lohmann, L. G. (2017). Minimum sample sizes for population genomics: an empirical study from an Amazonian plant species. Mol. Ecol. Resour. 17, 1136–1147. doi: 10.1111/1755-0998.12654
Ogburn, M. B., Criales, M. M., Thompson, R. T., and Browder, J. A. (2013). Endogenous swimming activity rhythms of postlarvae and juveniles of the penaeid shrimp Farfantepenaeus aztecus, Farfantepenaeus duorarum, and Litopenaeus setiferus. J. Exp. Mar. Biol. Ecol. 440, 149–155. doi: 10.1016/j.jembe.2012.12.007
O’Leary, S. J., Puritz, J. B., Willis, S. C., Hollenbeck, C. M., and Portnoy, D. S. (2018). These aren’t the loci you’re looking for: principles of effective SNP filtering for molecular ecologists. Mol. Ecol. 27, 3193–3206. doi: 10.1111/mec.14792
Paris, J. R., Stevens, J. R., and Catchen, J. M. (2017). Lost in parameter space: a road map for STACKS. Methods Ecol. Evol. 8, 1360–1373. doi: 10.1111/2041-210X.12775
Peakall, R., and Smouse, P. E. (2006). GENALEX 6: genetic analysis in Excel. Population genetic software for teaching and research. Mol. Ecol. Notes 6, 288–295. doi: 10.1111/j.1471-8286.2005.01155.x
Peakall, R., and Smouse, P. E. (2012). GenAlEx 6.5: genetic analysis in Excel. Population genetic software for teaching and research-an update. Bioinformatics 28, 2537–2539. doi: 10.1093/bioinformatics/bts460
Pérez-Farfante, I. (1969). Western Atlantic Shrimps of the Genus Penaeus. Washington, DC: U.S. Fish and Wildife Service Fishery Bulletin, 461–591.
Pérez-Farfante, I. (1970). Claves Ilustradas Para la Identificación de los Camarones Comerciales de la América Latina. No. Folleto 1605. Mexico.
Pérez-Farfante, I. (1988). Illustrated key to the penaeoid shrimps of commerce in the Americas. NOAA Tech. Rep 64:32.
Pérez-Farfante, I., and Kensley, B. F. (1997). Penaeoid and Sergestoid shrimps and prawns of the world: keys and diagnoses for the families and genera. Memoires Du Museum National d’Histoire Naturelle 175, 1–233. doi: 10.3897/zookeys.418.7629
Peterson, B. K., Weber, J. N., Kay, E. H., Fisher, H. S., and Hoekstra, H. E. (2012). Double digest RADseq: an inexpensive method for de novo SNP discovery and genotyping in model and non-model species. PLoS One 7:e37135. doi: 10.1371/journal.pone.0037135
Pritchard, J. K., Stephens, M., and Donnelly, P. (2000). Inference of population structure using multilocus genotype data. Genetics 155, 945–959. doi: 10.1093/genetics/155.2.945
Queiroga, H., and Blanton, J. (2005). Interactions between behaviour and physical forcing in the control of horizontal transport of decapod crustacean larvae. Adv. Mar. Biol. 47, 107–214. doi: 10.1016/s0065-2881(04)47002-3
Ramírez-Rodríguez, M., Arreguín-Sánchez, F., and Lluch-Belda, D. (2003). Recruitment patterns of the pink shrimp Farfantepenaeus duorarum in the southern Gulf of Mexico. Fish. Res. 65, 81–88. doi: 10.1016/j.fishres.2003.09.008
Robblee, M., Fry, B., Fourqurean, J. W., and Mumford, P. L. (1999). “Relationships among inshore sources of the pink shrimp, Penaeus duorarum, and the offshore tortugas and sanibel fisheries,” in US Geological Survey Program on the South Florida Ecosystem - Proceedings of the Technical Symposium. Fort Lauderdale, FL, 94.
Roberts, T. W. (1986). Abundance and distribution of pink shrimp in and around the Tortugas Sanctuary, 1981-1983. N. Am. J. Fish. Manag. 6, 311–327. doi: 10.1577/1548-8659(1986)6<311:aadops>2.0.co;2
Rochette, N. C., and Catchen, J. M. (2017). Deriving genotypes from RAD-seq short-read data using Stacks. Nat. Protoc. 12, 2640–2659. doi: 10.1038/nprot.2017.123
Rothlisberg, P. C. (1982). Vertical migration and its effect on dispersal of penaeid shrimp larvae in the Gulf of Carpentaria. Fishe. Bull. 80, 541–554.
Rothlisberg, P. C., Church, J. A., and Fandry, C. B. (1995). A mechanism for near-shore concentration and estuarine recruitment of post-larval Penaeus plebejus Hess (Decapoda. Penaeidae). Estuar. Coast. Shelf Sci. 40, 115–138. doi: 10.1016/s0272-7714(05)80001-0
Rothlisberg, P. C., Craig, P. D., and Andrewartha, J. R. (1996). Modelling penaeid prawn larval advection in Albatross Bay, Australia: defining the effective spawning population. Mar. Freshw. Res. 47, 157–168. doi: 10.1071/mf9960157
Saloman, C. H., Allen, D. M., and Costello, T. J. (1968). Distribution of three species of shrimp (genus Penaeus) in waters contiguous to southern Florida. Bull. Mar. Sci. 18, 343–350.
Shanks, A. L. (2009). Pelagic larval duration and dispersal distance revisited. Biol. Bull. 216, 373–385. doi: 10.2307/25548167
Sheridan, P. (1996). Forecasting the fishery for pink shrimp, Penaeus duorarum, on the Tortugas grounds, Florida. Fish. Bull. 94, 745–755.
Tabb, D. C., Dubrow, D. L., and Jones, A. E. (1962). Studies on the biology of the pink shrimp, Penaeus duorarum Burkenroad, in Everglades National Park, Florida. Coral Gables, FL: University of Miami. State of Florida Board of Conservation Technical Series No. 37.
Teodoro, S. S. A., Terossi, M., Mantelatto, F. L., and Costa, R. C. (2016). Discordance in the identification of juvenile pink shrimp (Farfantepenaeus brasiliensis and F. paulensis: family Penaeidae): an integrative approach using morphology, morphometry and barcoding. Fish. Res. 183, 244–253. doi: 10.1016/j.fishres.2016.06.009
Therkildsen, N. O., Hemmer-Hansen, J., Hedeholm, R. B., Wisz, M. S., Pampoulie, C., Meldrup, D., et al. (2013). Spatiotemporal SNP analysis reveals pronounced biocomplexity at the northern range margin of Atlantic cod Gadus morhua. Evol. Appl. 6, 690–705. doi: 10.1111/eva.12055
Timm, L. E. (2019). Raw ddRADseq Data in Fastq Format for Population Genomic Analysis of the Gulf Pink Shrimp (Farfantepenaeus duorarum) From 2007-02-17 to 2015-07-15. Corpus Christi, TX: Texas A&M University – Corpus Christi, doi: 10.7266/n7-hhnq-kh83
Timm, L. E., Browder, J. A., Simon, S., Jackson, T. L., Zink, I. C., and Bracken-Grissom, H. D. (2019). A tree money grows on: the first inclusive molecular phylogeny of the economically important pink shrimp (Decapoda: Farfantepenaeus) reveals cryptic diversity. Invertebr. Syst. 33, 488–500. doi: 10.1071/IS18044
Timm, L. E., Isma, L. M., Johnston, M. W., and Bracken-Grissom, H. D. (2020). Comparative population genomics and biophysical modeling of shrimp migration in the Gulf of Mexico reveals current-mediated connectivity. Front. Mar. Sci. 7:19. doi: 10.3389/fmars.2020.00019
Truelove, N. K., Kough, A. S., Behringer, D. C., Paris, C. B., Box, S. J., Preziosi, R. F., et al. (2017). Biophysical connectivity explains population genetic structure in a highly dispersive marine species. Coral Reefs 36, 233–244. doi: 10.1007/s00338-016-1516-y
Upton, H. F., Hoar, P., and Upton, M. (1992). The Gulf of Mexico Shrimp Fishery: Profile of a Valuable National Resource. Washington, DC: Center for Marine Conservation.
Waples, R. S. (1998). Separating the wheat from the chaff: patterns of genetic differentiation in high gene flow species. J. Hered. 89, 438–450. doi: 10.1093/jhered/89.5.438
Waples, R. S., and Gaggiotti, O. (2006). What is a population? An empirical evaluation of some genetic methods for identifying the number of gene pools and their degree of connectivity. Mol. Ecol. 15, 1419–1439. doi: 10.1111/j.1365-294X.2006.02890.x
Wickham, H. (2016). ggplot2: Elegant Graphics for Data Analysis. New York, NY: Springer-Verlag. Availble online at: https://ggplot2.tidyverse.org
Willing, E. M., Dreyer, C., and van Oosterhout, C. (2012). Estimates of genetic differentiation measured by Fst do not necessarily require large sample sizes when using many SNP markers. PLoS One 7:e42649. doi: 10.1371/journal.pone.0042649
Keywords: pink shrimp, Penaeus duorarum, Farfantepenaeus duorarum, Gulf of Mexico, ddRADSeq, population genomics, fisheries management
Citation: Timm LE, Jackson TL, Browder JA and Bracken-Grissom HD (2021) Population Genomics of the Commercially Important Gulf of Mexico Pink Shrimp Farfantepenaeus duorarum (Burkenroad, 1939) Support Models of Juvenile Transport Around the Florida Peninsula. Front. Ecol. Evol. 9:659134. doi: 10.3389/fevo.2021.659134
Received: 27 January 2021; Accepted: 17 June 2021;
Published: 12 July 2021.
Edited by:
Melissa T. R. Hawkins, Smithsonian Institution, United StatesReviewed by:
Nick Wade, Commonwealth Scientific and Industrial Research Organisation (CSIRO), AustraliaGonzalo Gajardo, University of Los Lagos, Chile
Copyright © 2021 Timm, Jackson, Browder and Bracken-Grissom. This is an open-access article distributed under the terms of the Creative Commons Attribution License (CC BY). The use, distribution or reproduction in other forums is permitted, provided the original author(s) and the copyright owner(s) are credited and that the original publication in this journal is cited, in accordance with accepted academic practice. No use, distribution or reproduction is permitted which does not comply with these terms.
*Correspondence: Laura E. Timm, bHRpbW0wMDRAZml1LmVkdQ==