 Irene Tunno
 Susan R. H. Zimmerman
 Thomas A. Brown
 Christiane A. Hassel
- 1Center for Accelerator Mass Spectrometry, Lawrence Livermore National Laboratory, Livermore, CA, United States
- 2Flow Cytometry Core Facility, Indiana University Bloomington, Bloomington, IN, United States
High-resolution chronologies are crucial for paleoenvironmental reconstructions, and are particularly challenging for lacustrine records of terrestrial paleoclimate. Accelerator Mass Spectrometry (AMS) radiocarbon measurement of terrestrial macrofossils is the most common technique for building age models for lake sediment cores, but relies on the presence of terrestrial macrofossils in sediments. In the absence of sufficient macrofossils, pollen concentrates represent a valuable source of dates for building high-resolution chronologies. However, pollen isolation and dating may present several challenges, as has been reported by different authors in previous work over the last few decades. Here we present an improved method for extracting, purifying and radiocarbon-dating pollen concentrates using flow cytometry to improve the extraction efficiency and the purity of the pollen concentrates. Overall, the nature of the sediments and the abundance of the pollen represent major considerations in obtaining enough pollen grains and, consequently, enough carbon to be dated. Further, the complete separation of pollen from other forms of organic matter is required to ensure the accuracy of the dates. We apply the method to surface samples and sediment cores recovered from two contrasting lake basins on the eastern side of the Sierra Nevada (California), and describe the variations that may be used to optimize pollen preparation from a variety of sediments.
Introduction
Lakes are archives that can record natural and human-induced changes in the environment, preserved in biological, sedimentological, and geochemical components of the sediment. In order to interpret and compare paleorecords between sites, a reliable chronology is fundamental for each paleorecord, and a relatively large number of dates may be required to build a chronology of sufficient resolution for proxy interpretation (Blaauw et al., 2018; Zimmerman and Wahl, 2020). Among the techniques for building chronologies, AMS radiocarbon-based age-depth models are the most widely used for sediment cores recording the last ∼35,000 years. The selection of the organic material for dating is extremely important in order to obtain reliable radiocarbon dates and build an accurate age model. The optimal organic materials that can be measured for 14C are short-lived terrestrial plant macrofossils, such as leaves, needles, and twigs. Such macrofossils are often not abundant in lake-sediment cores, and this has been viewed as forcing reliance on bulk-sediment measurements, which can lead to age models of uncertain accuracy. AMS measurements on bulk sediments may include samples where different types of organic matter have been homogenized and dated together. Such material can often include carbon recycled by aquatic plants and algae from dissolved organic and inorganic carbon sources.
In cases when terrestrial macrofossils are rare or absent, pollen may be a valuable resource for building a high-resolution age model. In addition, in cases where precise dating of a significant shift in a proxy is desired, pollen dates can allow close bracketing of the event. Pollen is formed by terrestrial plants from atmospheric CO2, and is often abundant in sediment cores, and so radiocarbon chronologies based on pollen can help to reduce the uncertainties related to the presence of very few macrofossils in a core. Previous studies demonstrated that pollen concentrates can be dated through AMS measurements (Brown et al., 1989, 1992; Newnham et al., 2006; Fletcher et al., 2017), but two main challenges remain: separating sufficient pollen for a radiocarbon date and isolating the pollen from other carbon-bearing material. Through the last three decades, several studies have developed methods to separate and concentrate the pollen including heavy-liquid separation (Barss and Williams, 1973; Regnéll and Everitt, 1996), sieving (Brown et al., 1989), micromanipulator (Long et al., 1992), and mouth pipetting (Mensing and Southon, 1999). The purity of the pollen concentrates remains a key for obtaining reliable dates, as it has been reported that radiocarbon measurements on pollen resulted in dates too old in comparison with independent estimations of the sediment age (e.g., Kilian et al., 2002; Piotrowska et al., 2004).
Recently, flow cytometry sorting has been tested as a technique to isolate pollen from other possible sources of contamination (Byrne et al., 2003; Tennant et al., 2013; Zimmerman et al., 2018). These pilot studies identified the main challenge of pollen AMS dating as maximizing the amount of pollen in a sample to reduce analytical uncertainties, while at the same time minimizing the time (and thus expense) required for sorting by producing the cleanest possible pollen extract. Here we present an improved method for extracting, sorting and dating pollen from lake-sediment cores, which combines an optimized pollen extraction protocol (without using strong chemicals, e.g., hydrofluoric acid), sorting by flow cytometry, and standard graphitization and AMS radiocarbon measurement methods.
Study Areas
Mono Lake
Mono Lake (ML) is a hydrologically closed lake located on the eastern side of the central Sierra Nevada (38.00°N, 119.00°W), at ∼1945.5 m elevation (Figure 1). The average depth of the water is 17 m (maximum = ∼48 m) and the surface area is 183 km2. The main water source is provided by meltwater from the snowpack in the Sierra Nevada, which form the western side of the lake basin. The modern lake is an evaporative remnant of a much deeper glacial-age lake (Zimmerman et al., 2011), and consequently is highly saline (88 g/L) and alkaline (pH = 10). The watershed of the lake is ∼2070 km2, and spans an elevation range of >1800 m. The lake is surrounded by desert shrubs such as bitterbrush (Purshia tridentata), sagebrush (Artemisia tridentata), greasewood (Sarcobatus vermiculatus), and desert peach (Prunus andersonii). The mountains are dominated by pinyon-juniper woodland (Pinus monophylla, Juniperus osteosperma) on the western side of the basin and Jeffrey pine forest (Pinus jeffreyi) on the southern side of the basin. The north and the east sides are dominated by the alkali sink plant communities, mostly represented by the above-mentioned desert shrubs.
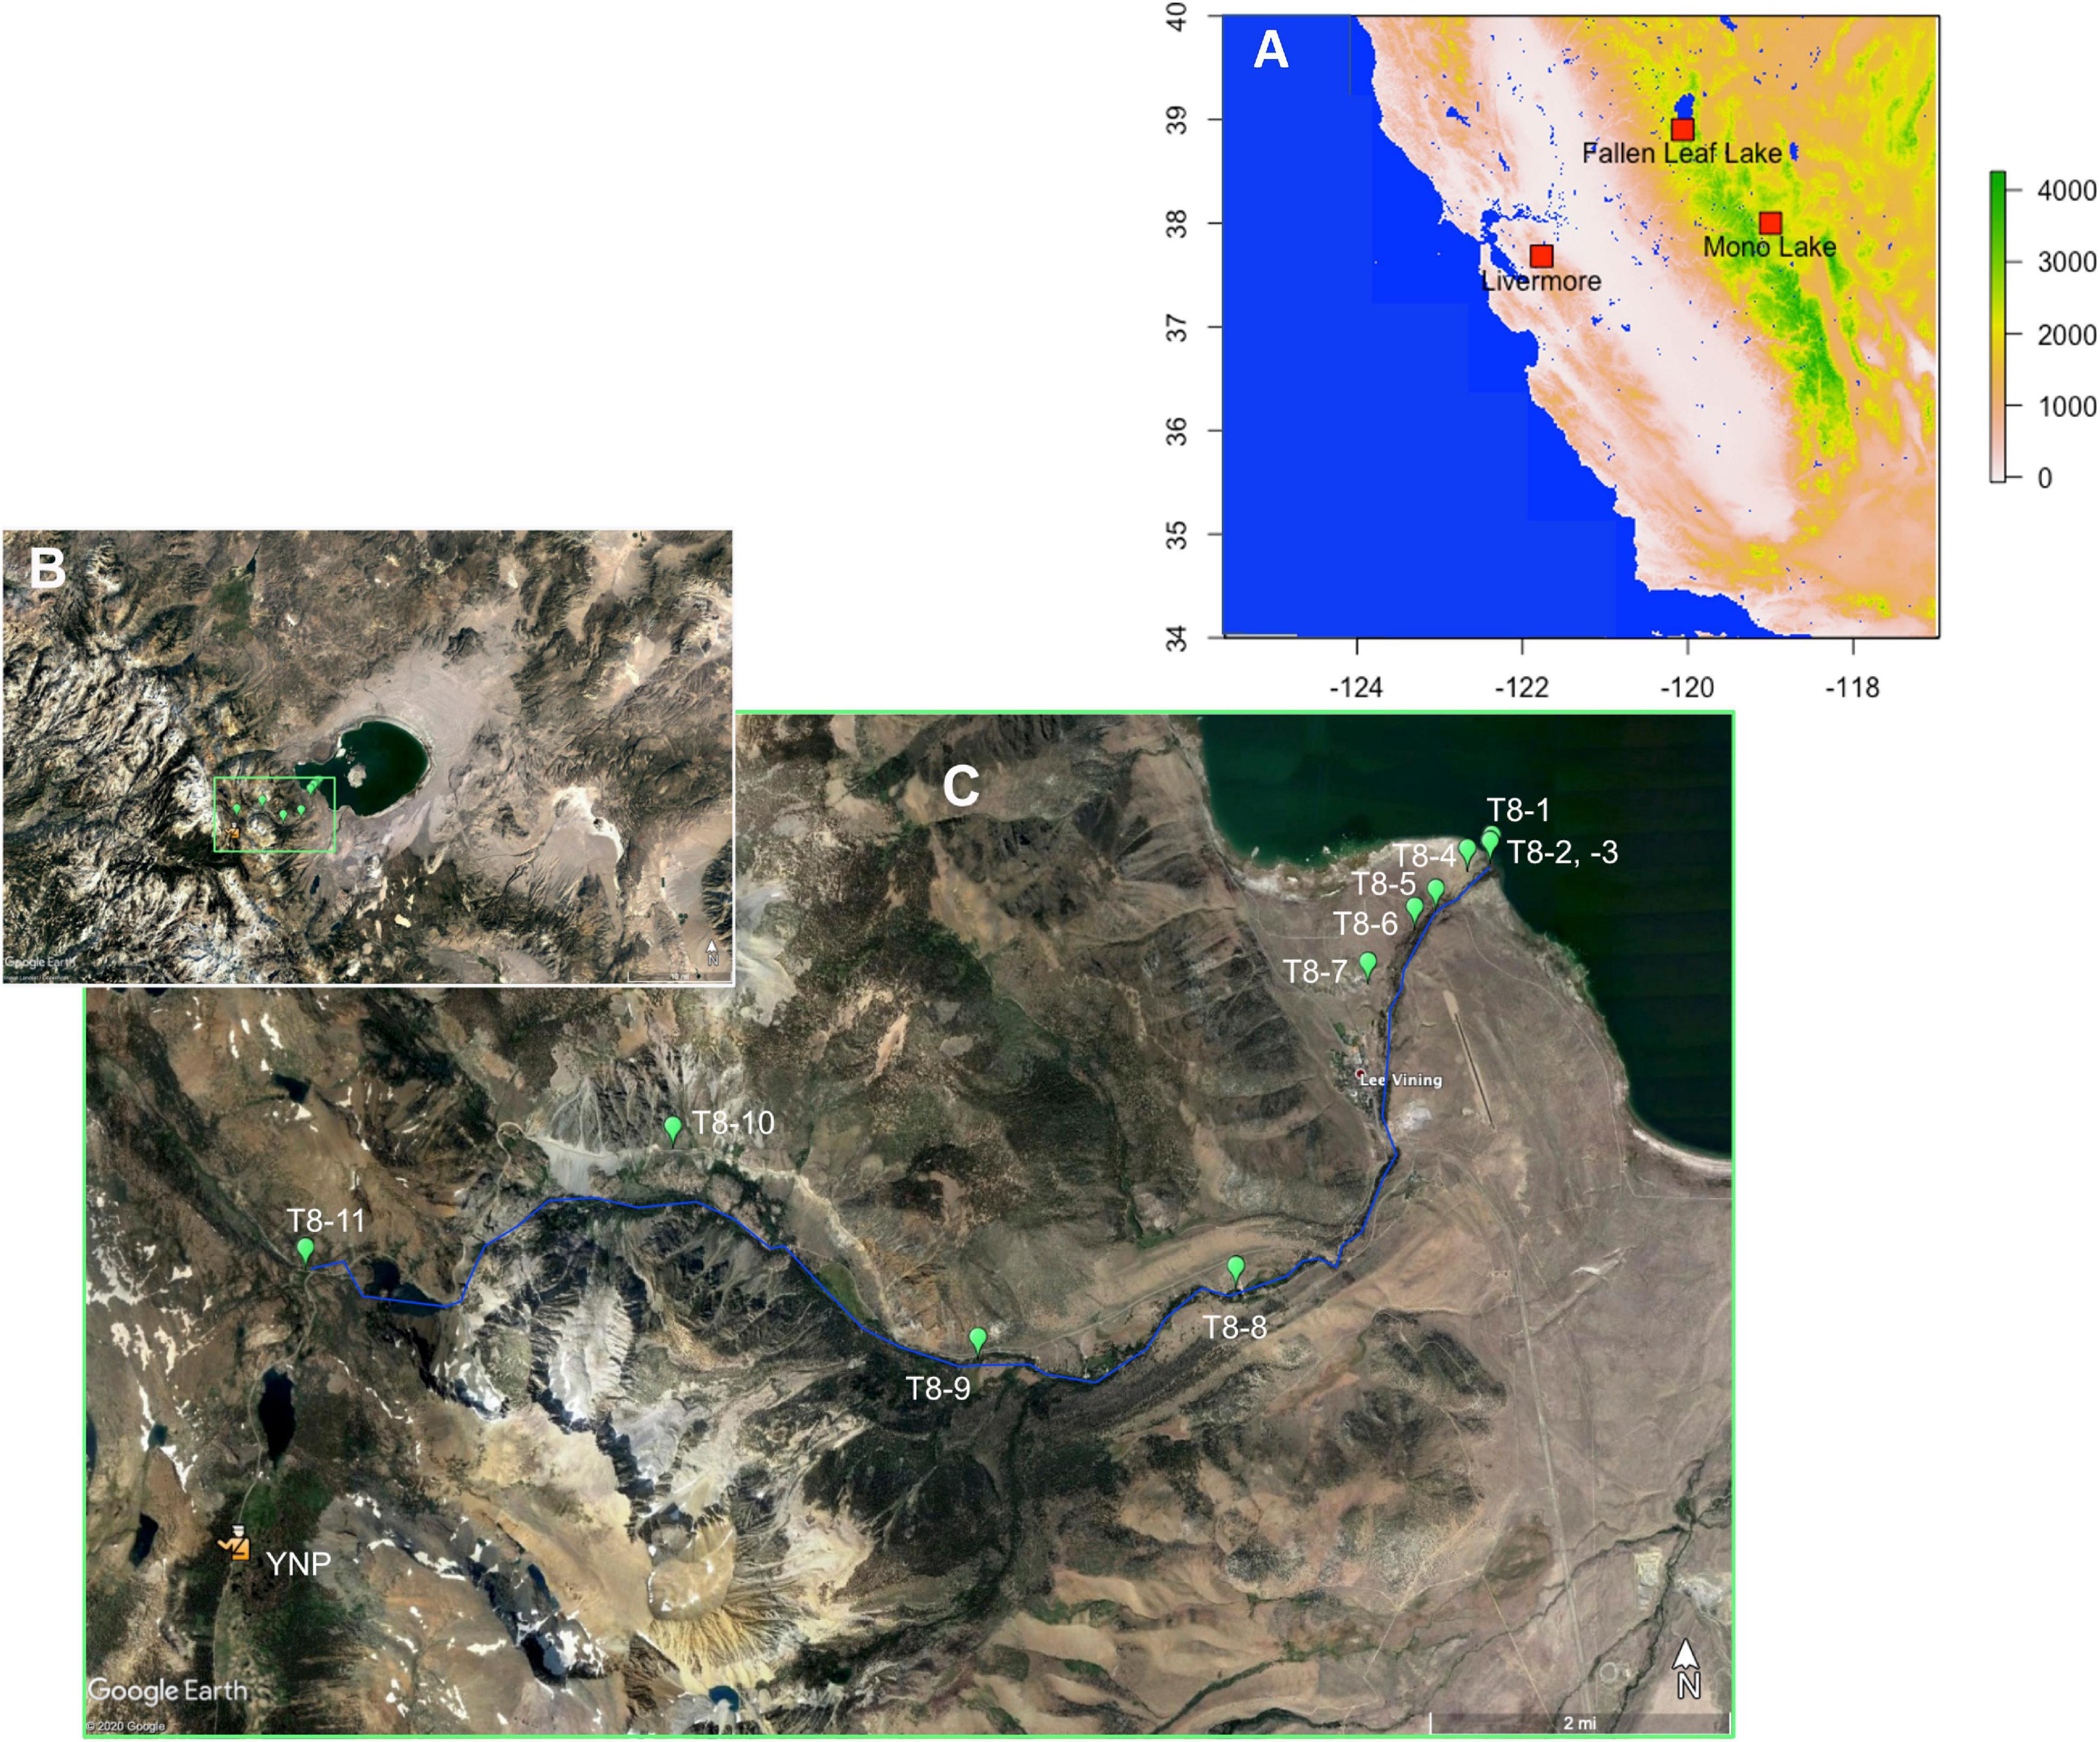
Figure 1. (A) Map of California, United States, showing the locations of the Mono Lake, Fallen Leaf Lake, and Livermore sites. (B) Google Earth image of Mono Lake, showing the exposed glacial-age lake bed surrounding the modern lake, and the stream canyons supplying mountain snowmelt from the Sierra Nevada to Mono Lake. (C) Detail of (B) showing transect #8 (T8), with green markers show the sampling points along the transect. Samples T8-2 and T8-3 were taken at the same coordinates, with T8-2 taken at the lake shore, and T8-3 slightly inland. The location of Lee Vining Creek is shown roughly by the blue line; all sampling locations were on the north side of the creek. The east entrance to Yosemite National Park is indicated for reference (YNP).
Fallen Leaf Lake
Fallen Leaf Lake (FLL) is a small (5.7 km2 surface area) and deep (>120 m maximum depth) subalpine lake in the northern Sierra (38.9024° N, 120.0615° W) located ∼2 km south of Lake Tahoe (Figure 1). The lake elevation is 1942 m, 45 m above Lake Tahoe; the watershed is 42 km2. The principal inflow is Alpine Creek from the south, while surface outflow in Taylor Creek and groundwater flow through recessional end moraines connect FLL to Lake Tahoe to the north (Kleppe et al., 2011; Maloney et al., 2013). FLL is a freshwater, meso-oligotrophic organic- and diatom-rich lake with circumneutral pH (Noble et al., 2013, 2016). The surrounding vegetation is dominated by pine (Pinus jeffreyi and Pinus ponderosa) and by quaking aspen (Populus tremuloides) along the creeks.
Fossil and Modern Pollen Materials
Pinus pollen type was the main target during the pollen extraction, because it is the most abundant pollen in both lakes. Pine is in fact an ideal pollen type for radiocarbon dating: it is produced in large quantities and efficiently transported by wind. For these reasons, pine is often very abundant in sediments, especially in the western U.S., where the vegetation is dominated by several pine species.
Sediment-Core Samples
Samples for pollen extraction were collected from the Holocene sections of three sediment cores. UWI-MONO15-1C and -1D (Hodelka et al., 2020) were collected in 2015 from the western embayment of Mono Lake, in ∼18 m water depth, and BINGO-MONO10-4A in 2010 from the western embayment in 2.8 m water depth (Zimmerman et al., 2020), from a location very close to that of the core analyzed by Davis (1999). The BOLLY-FLL10-1A and -2D cores were recovered from the center of the southern basin of Fallen Leaf Lake in 2015 (Noble et al., 2016). As a test of the potential fidelity of pollen-based radiocarbon ages, the depths of the Fallen Leaf Lake pollen samples were chosen to be paired with macrofossil dates used by Noble et al. (2016) to develop the age model for the Fallen Leaf Lake cores. In two cases the pollen sample was separated from the centimeter just above the level of the macrofossil. All the cores are archived at the National Lacustrine Core Repository at the University of Minnesota (LacCore) and were sampled there. The samples were stored in polyethylene containers and kept at 5°C until extraction at the Center for Accelerator Mass Spectrometry (CAMS) of Lawrence Livermore National Laboratory.
The main differences between the sediments from the two lakes are their heterogeneity and their pollen concentration, stemming from the contrasting watersheds and lake chemistries. Fallen Leaf Lake sediments are dominated by olive to dark-gray diatom-rich clay throughout the Holocene, with homogeneous, laminated, and mottled textures, and characterized by high content of organic matter and diatoms (Noble et al., 2016). Pollen concentration in the BOLLY-FLL10 cores varies between 170,000 and 1,420,000 grains/cm3 (Noble, pers. comm., 2017), consisting mostly of pine pollen. The sediments of the two Mono Lake cores are quite heterogeneous, composed of sand- and silt-sized sediment, laminated dark-brown and olive-colored mud, interbedded tephra layers and variable amounts and forms of authigenic carbonate. In the pollen analysis of Davis (1999), pine also dominated, but pollen concentration was reported to vary between 1,200 grains/cm3 and 180,000 grains/cm3 over the Holocene. Pollen analysis is underway for the UWI-MONO15 cores. The heterogeneity of the sediments between the two lakes and along the Mono Lake cores required processing modifications during the pollen extraction.
Pollen was initially extracted from samples of 1–2 cc. The volume of the sediment used was increased up to 4 cc when necessary to obtain enough carbon for the AMS measurements. The extraction was performed on 20 samples from BOLLY-FLL10, 26 samples from UWI-MONO15 and 18 from BINGO-MONO10. Of the 64 core samples extracted, 12 were not sorted because the pollen concentration was too low (all from BINGO-MONO10); consequently only 52 samples appear in Table 1. In general, the lower limit for reportable 14C measurements at CAMS is 0.020 mg C and samples smaller than that size did not produce a 14C result (Tables 1, 2).
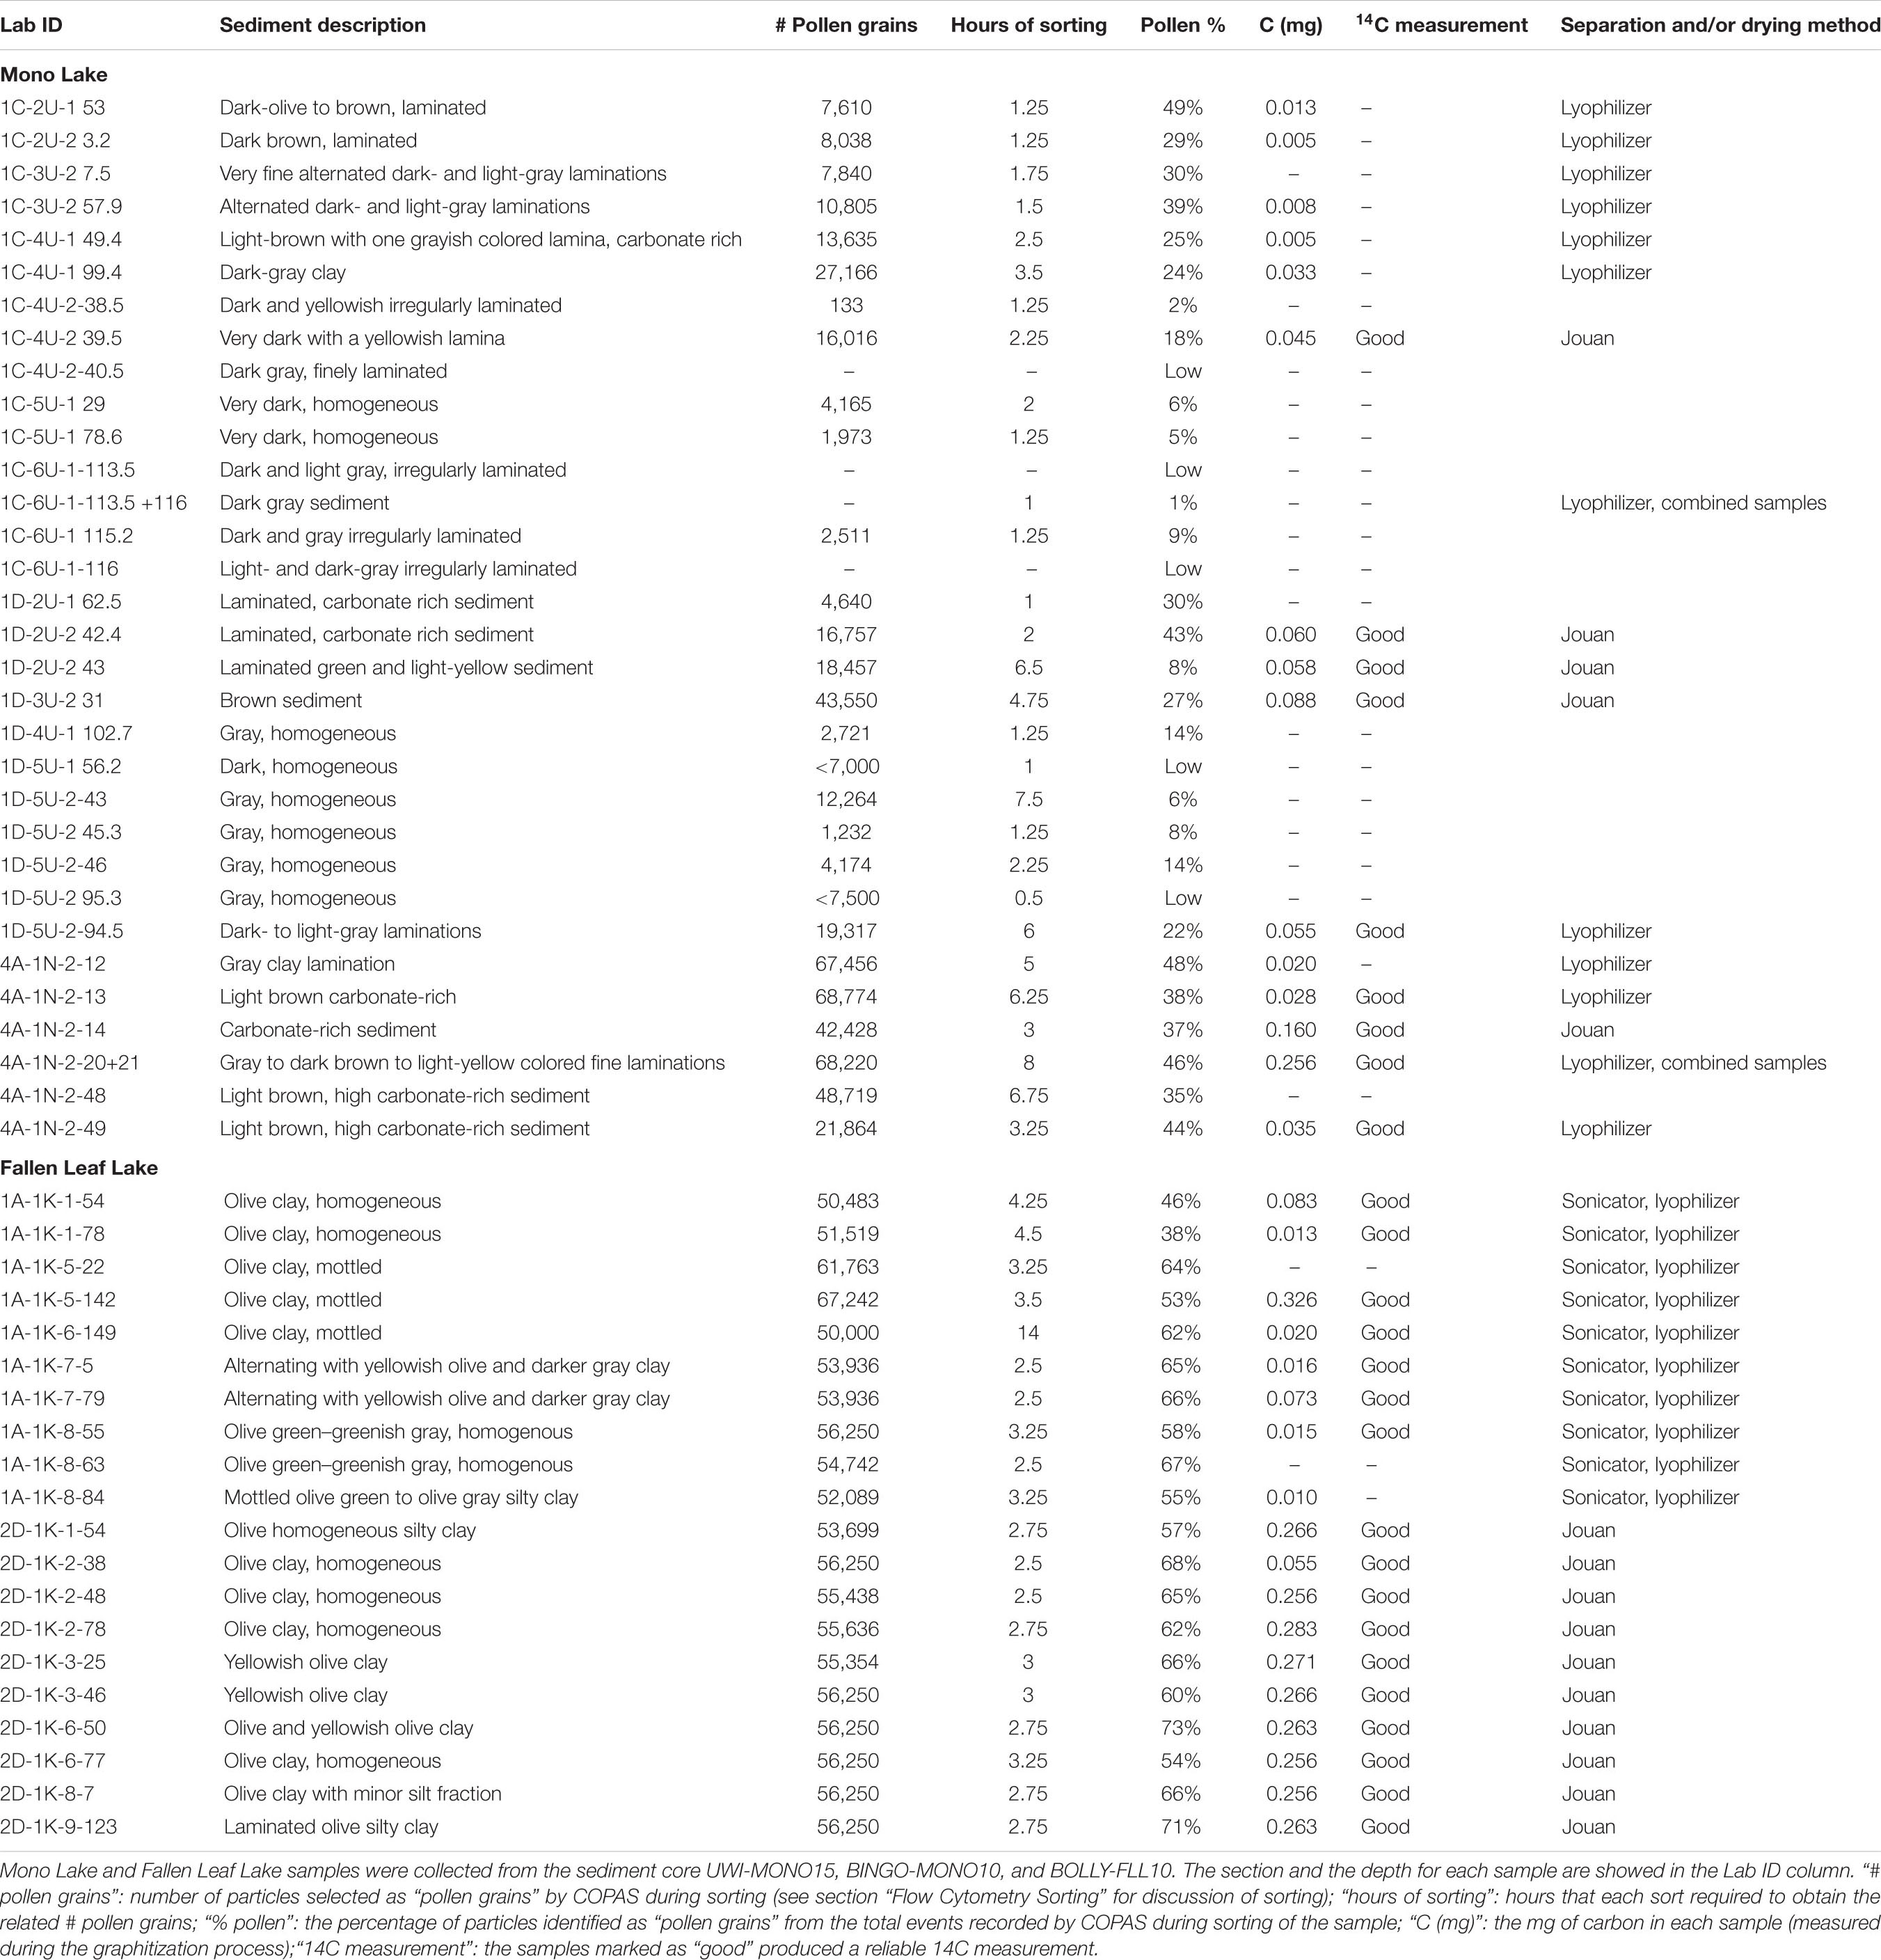
Table 1. Fossil samples from Mono Lake and Fallen Leaf Lake.
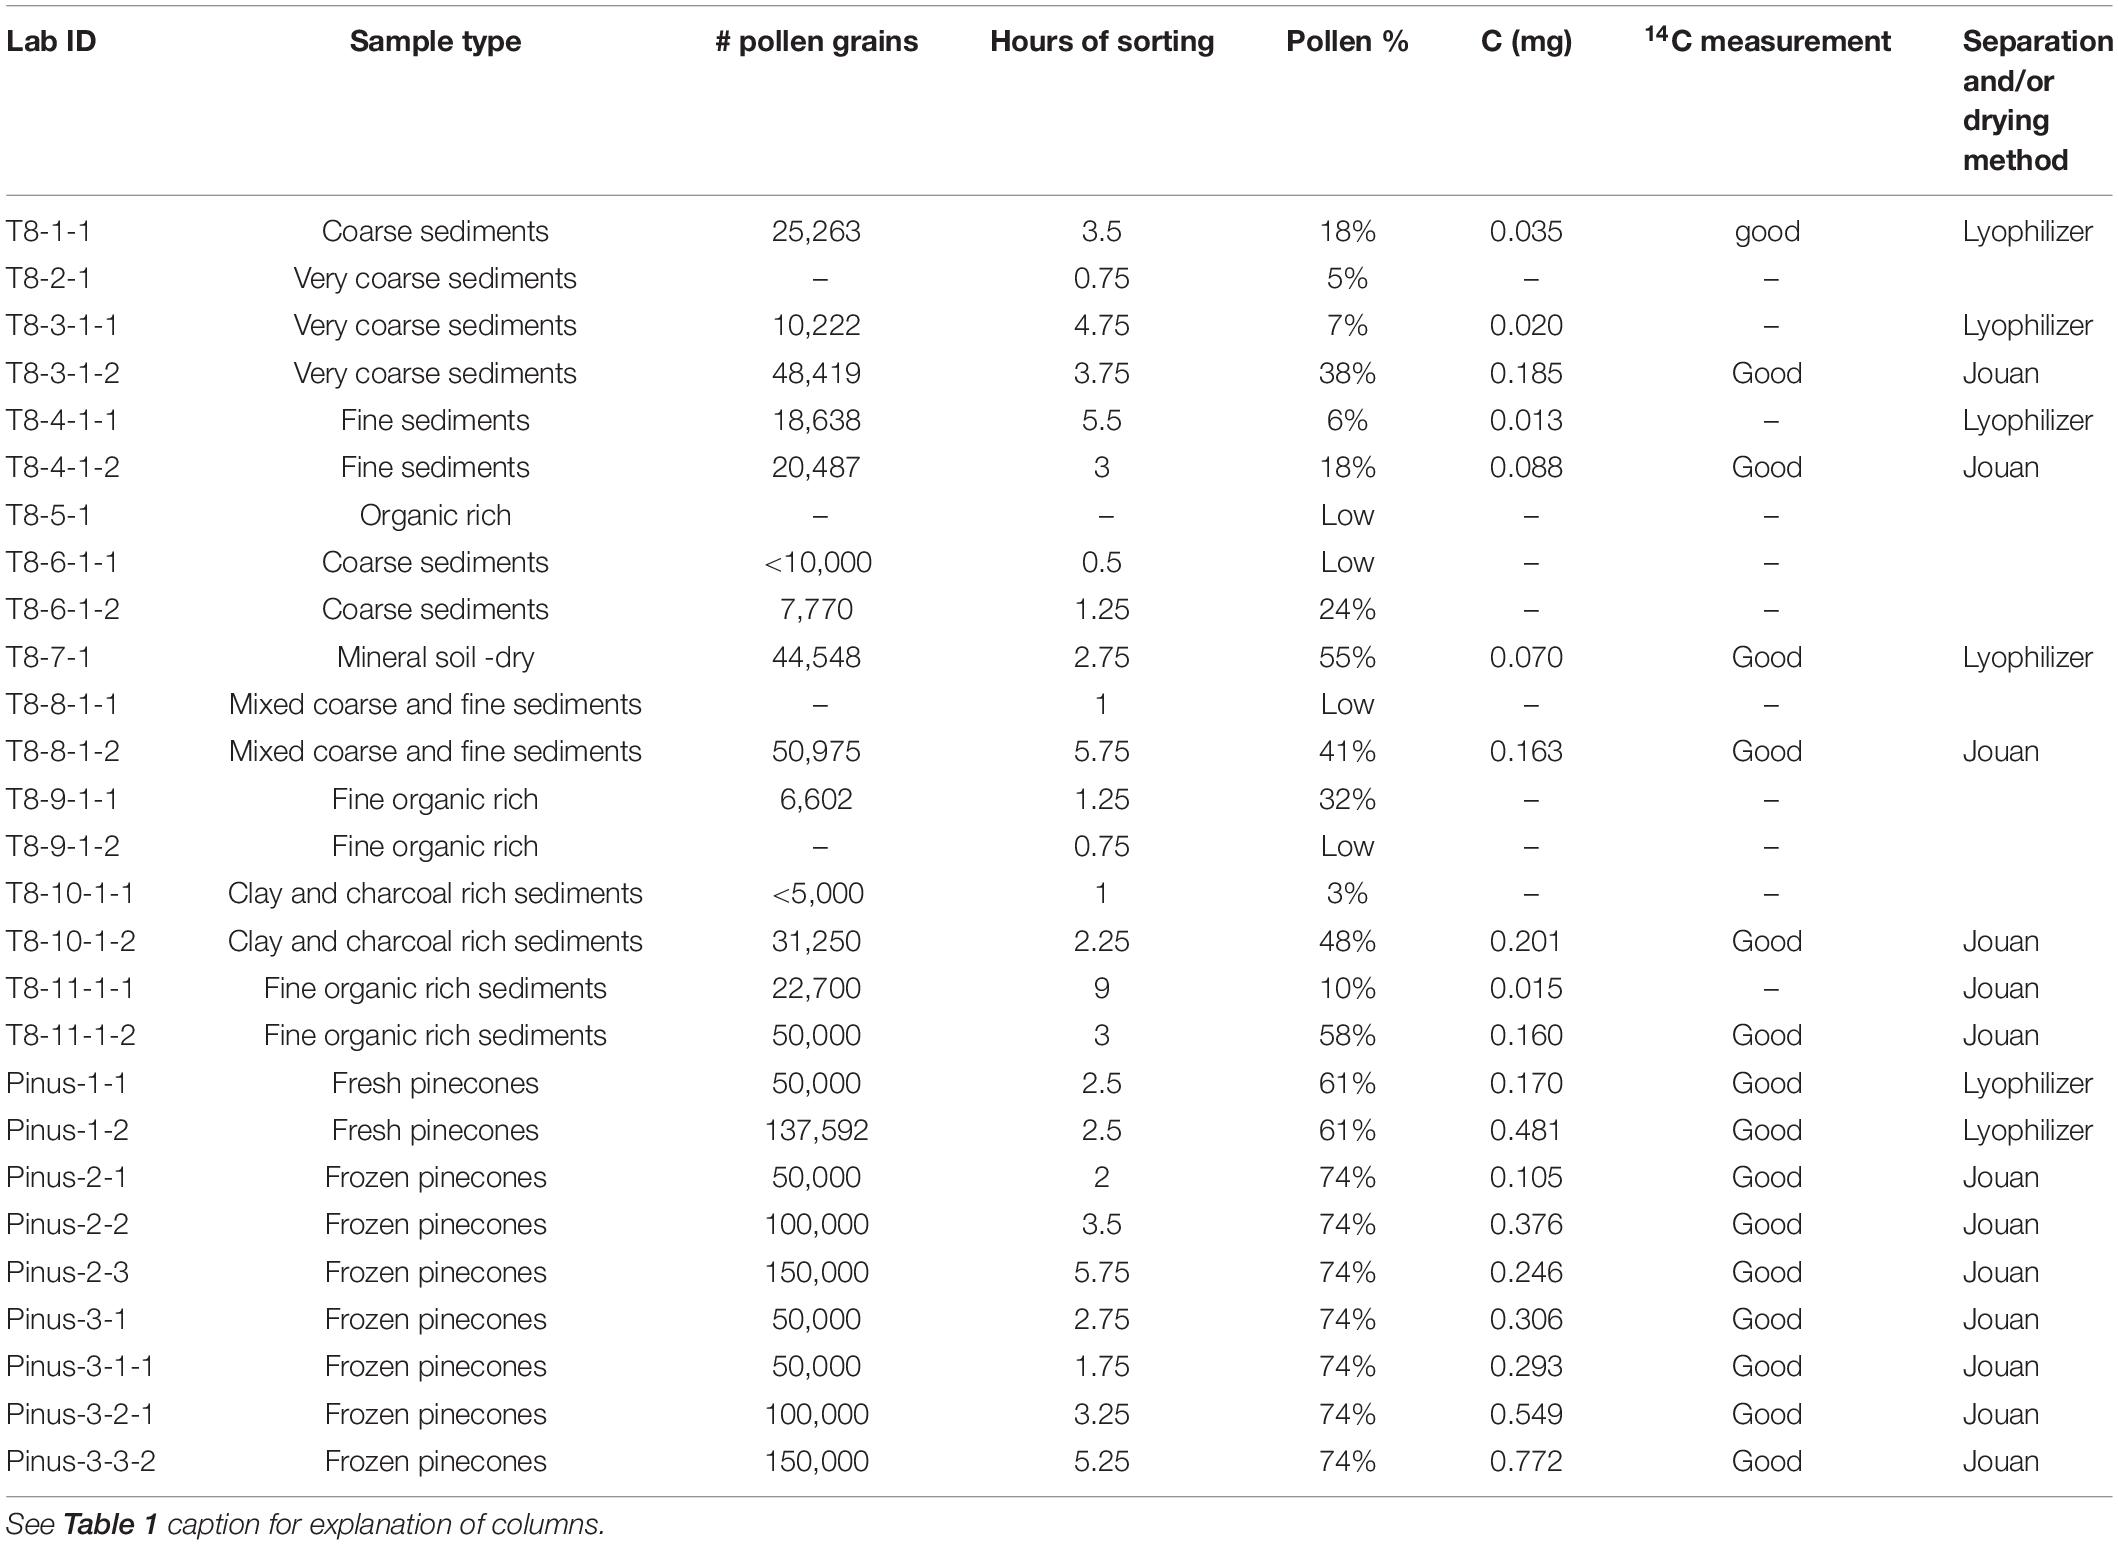
Table 2. Modern samples from surface transect T8 (Figure 1) and fresh pinecones.
Surface Samples
In June 2017, 38 surface samples were collected along six transects from the shore of Mono Lake toward the mountains, following the main creeks present in the basin (Figure 1C). Due to an exceptionally wet winter, the tributary creeks were unusually high, and the surface samples consisted of surficial (1–2 cm depth) soil (above creek level) or sediment (alongside the creek bed) collected within a few meters of the creek, and they vary widely in organic matter content and grain size. The samples were collected in 250 ml Nalgene bottles for the sediments and in 118 ml Nasco Whirl-Pack bags for the soil, sealed and stored at 5°C until the extraction. Because the surface samples presented variable organic content and grain size, different amounts (4–8 cc) of sediment were used for each pollen extraction. The results from transect #8 (T8) are presented here. Eleven samples were collected along this transect between the lake shoreline at Lee Vining Creek (T8-1, 1944 m elevation) and the proximity of Ellery Lake, along Route 120 (T8-11, 2921 m elevation) (Table 2).
Modern Pine Samples
Fresh male cones were collected from two pine trees (Pinus cf. contorta) growing in Livermore CA, in June 2017 and March 2018. Cones were collected from the trees, sealed in plastic bags and stored at –20°C until the pollen extraction. A total of nine samples from fresh cones were extracted, sorted, and dated (Table 2).
Pollen Extraction Protocol
Core- and Surface-Sediment Samples
The pollen extraction protocol applied for radiocarbon dating is different from the standard extraction method for pollen analysis (Faegri and Iversen, 1985) because the goal is to yield the largest amount of carbon for dating, without regard for preserving the varieties of pollen present and their proportions, and without adding carbon during the processing. The optimal pollen extraction will also eliminate most of the non-pollen organic and inorganic particles, as a cleaner sample minimizes the sorting time and consequently the cost of the flow cytometry process. The main steps are summarized in Figure 2, with sieving and heavy-liquid separation using non-toxic sodium polytungstate (low-carbon SPT – SPT-O, Geoliquids, Inc.) being two important steps in separating pollen from the non-pollen matter. The use of any carbon-based chemical was avoided to prevent contamination. For this reason, acetolysis, commonly performed during standard extraction for pollen analysis, was not performed. Sieving was performed with sieves of different materials (metal and nylon) and sizes. Both nylon mesh and SPT were discarded after use, to prevent contamination between samples. All steps involving the centrifuge were performed at 2,500 rpm (=3800 RCF using a Thermo Scientific Sorvall ST 8 compact centrifuge). Soft brake function for slow acceleration and braking was applied for the SPT and sodium hypochlorite steps to avoid the resuspending of the sediment and the sinking of the pollen due to the regular brake of the centrifuge.
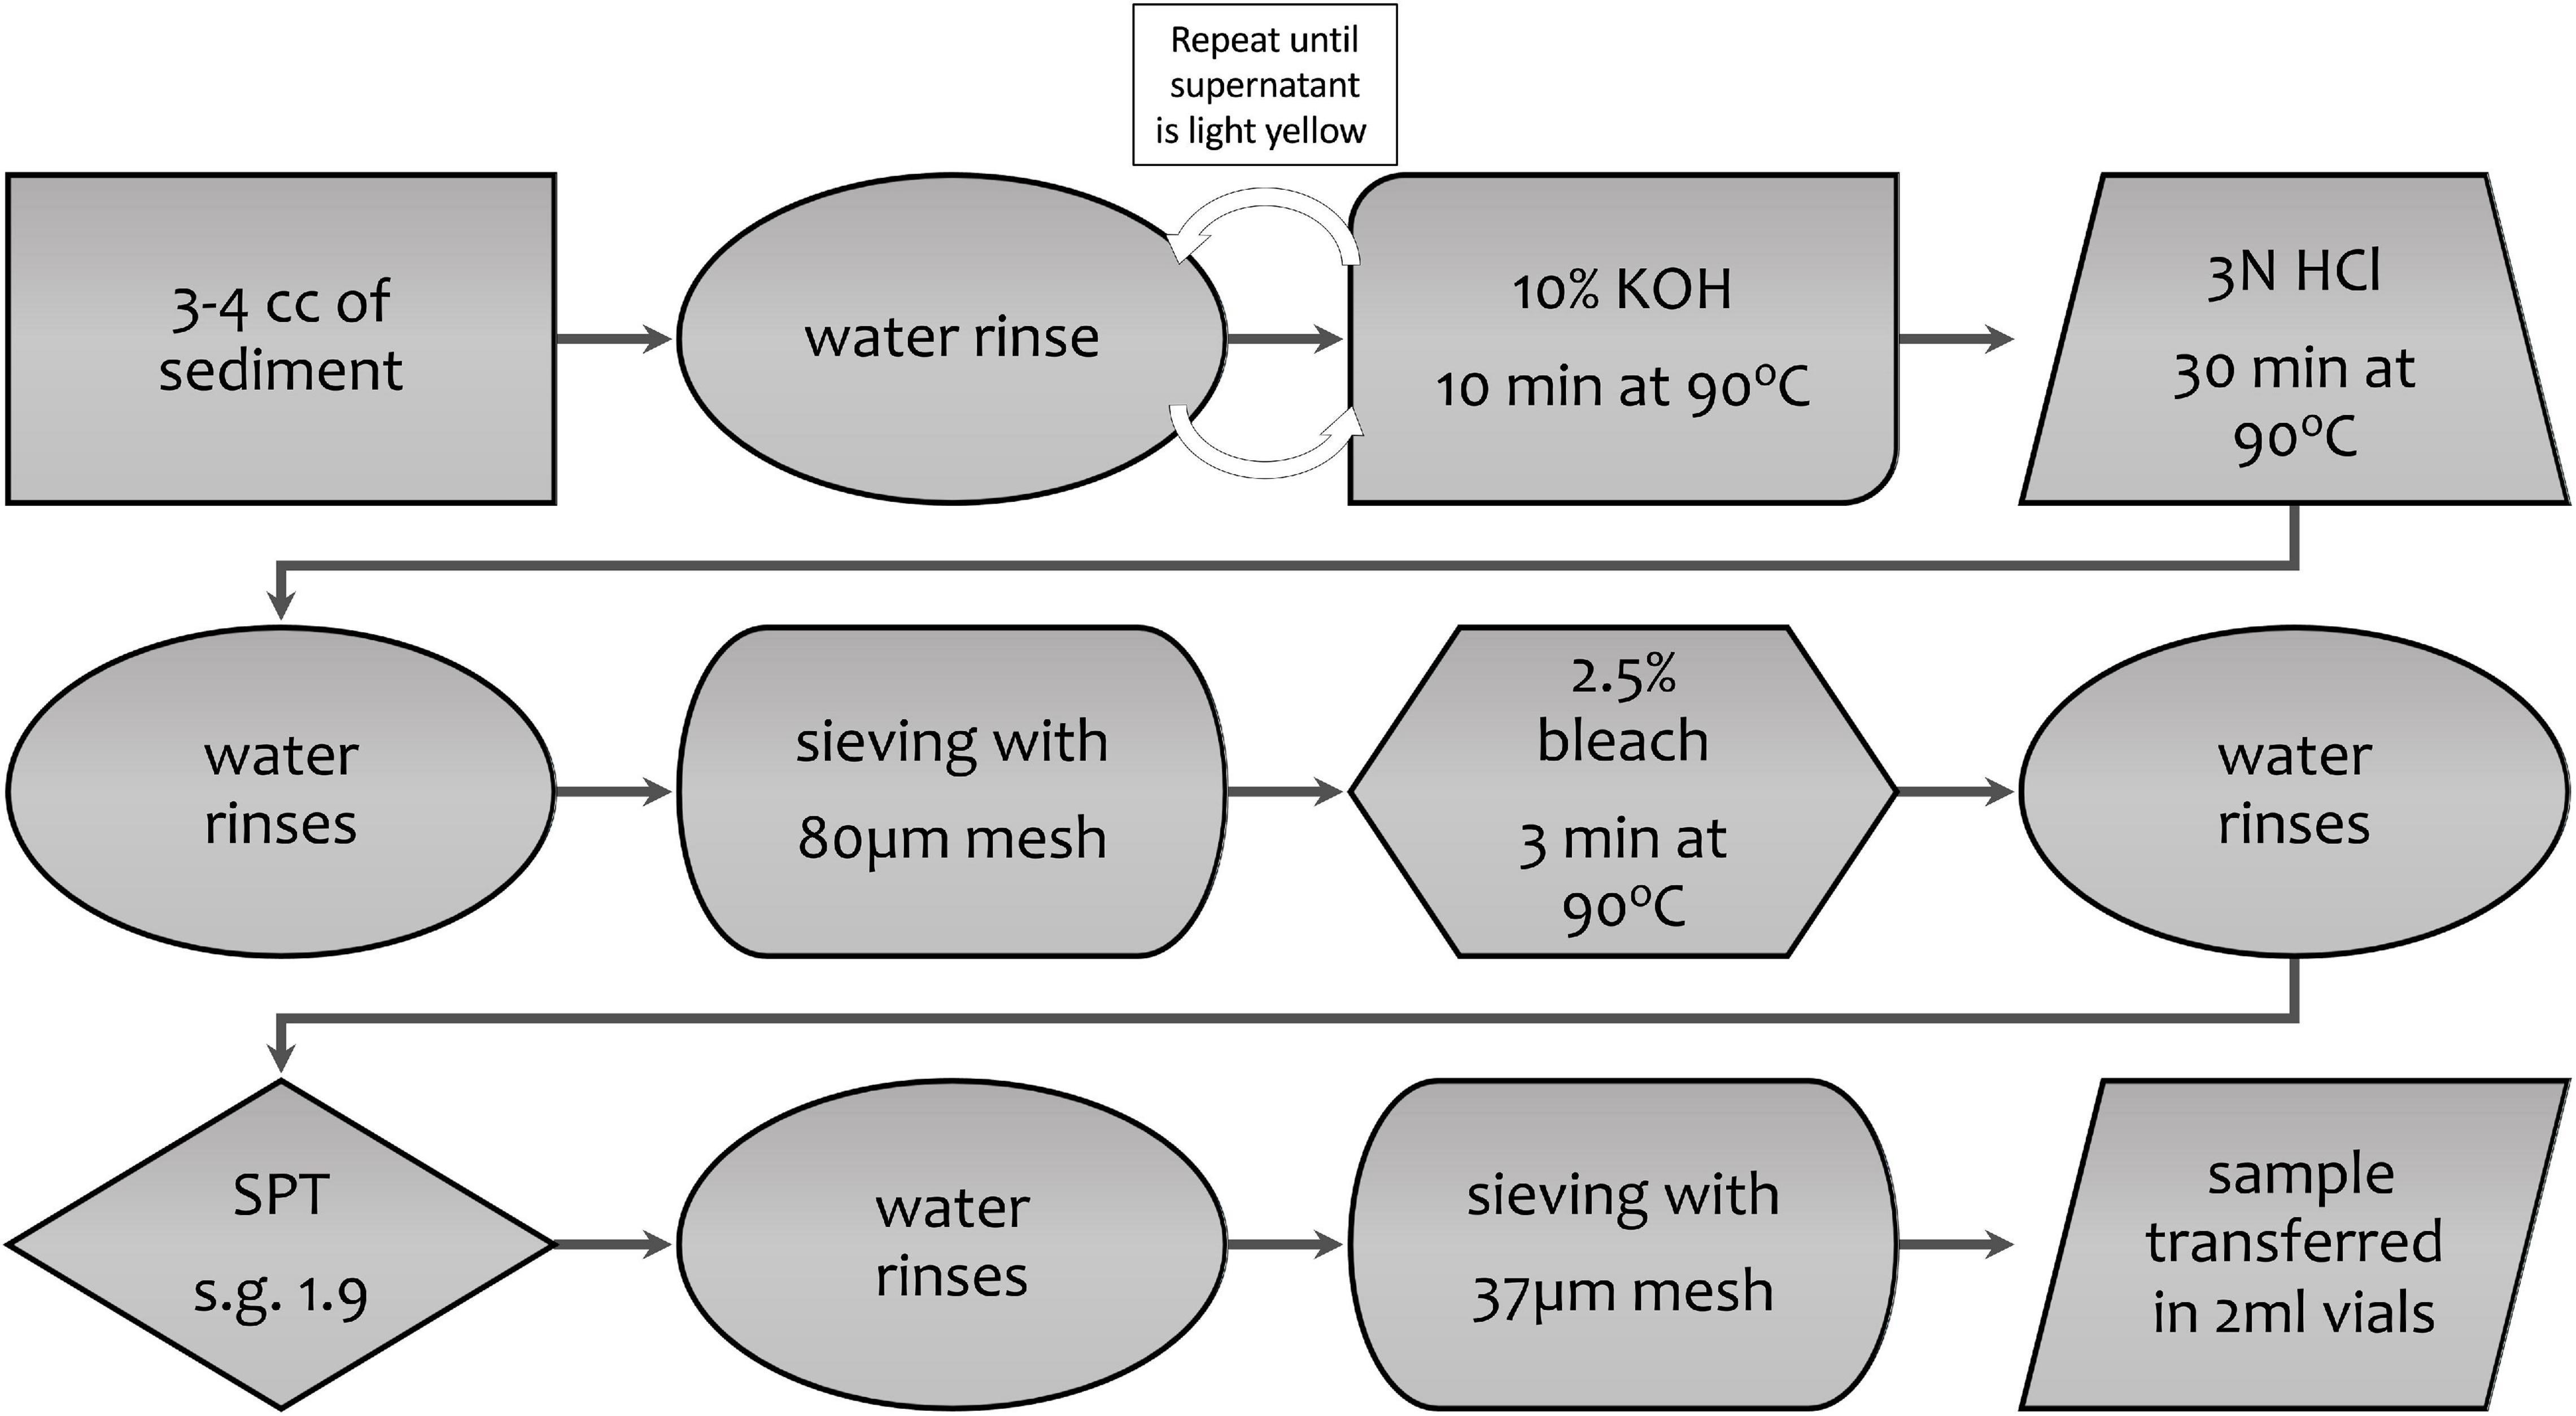
Figure 2. Main steps of the pollen extraction protocol before flow cytometry, including base, acid, bleach, and heavy-liquid steps. Water rinses are indicated by ovals; note that there is no water rinse between the base and acid steps. Size of meshes used for the various steps must be tested and modified depending on the sample and pollen types and other material included in the samples; in every case, the size fractions should be examined to determine into what fraction the pollen appears.
All samples were first transferred to labeled 50 ml test tubes, rinsed and centrifuged for 2.5 min, and then a series of chemical and physical separation techniques were applied following the final protocol below described. Description of the various tests performed to improve the method, including SPT specific gravities and sieve mesh sizes, is given in Section “Discussion.”
Pollen Extraction Protocol
(1) About 30 ml of 10% (by weight) potassium hydroxide (KOH, prepared mixing 59 g of KOH – 86% KOH by weight of dry pellets) and 461 ml MilliQ (MQ) water was added to each test tube and heated at 90°C for 10 min. This was repeated until the supernatant was clear or light-yellow colored.
(2) After the KOH was poured off, about 30 ml of 3 N hydrochloric acid (HCl) was added to each tube to dissolve carbonates, with no water rinses between the KOH and HCl steps. The samples were heated at 90°C for 30 min or until the reaction stopped, and then rinsed of the HCl with MQ water.
(3) Samples were sieved to eliminate the coarser fraction of the sediments without losing pollen grains; 125, 80, and 63 μm sieves were used during this step, depending on the size of the coarser debris. The <125, <80, and <63 μm fractions were kept for the further steps; the coarser fractions were stored in weakly acidified MQ water to preserve the samples in case further analyses were needed.
(4) A 2.5% sodium hypochlorite (NaOCl) solution was added to each sample and heated at 90°C for 3 min to disaggregate and remove the organic material left in the samples. This solution was obtained by diluting an 8% NaOCl unscented commercial bleach. The samples were rinsed with water and centrifuged two times.
(5) After carefully pouring off as much as water possible without disturbing the settled material, about 20 ml of low-carbon 1.9 specific gravity SPT were added to each sample, followed by centrifuging for 20 min to separate the inorganic material. At this stage, the inorganic material sank, and the pollen floated. The supernatant containing the pollen was separated, diluted with water, and centrifuged again; in this lower specific-gravity solution, the pollen completely sank to the bottom of the test tubes. Several water rinses were then performed in order to eliminate the residual SPT from the samples. The tests that led to choosing the value of 1.9 specific gravity for the SPT are discussed in section “Density Separation.”
(6) The samples were sieved with either 37 or 20 μm nylon mesh supported by a modified lidded plastic container. The smaller fraction was discarded, after checking under the microscope to be sure no pollen was included in that fraction. The largest fraction was checked under a microscope for purity, collected and concentrated into 2 ml Nalgene vials and shipped to the Flow Cytometry Core Facility, Indiana University, Bloomington to be sorted using flow cytometry.
Modern Pine Samples
Three batches were prepared using 15 and 50 ml test tubes and 50 ml Falcon plastic tubes. The cones were ground with mortar and pestle and sieved at the beginning with a 125 μm sieve to eliminate the coarse fragments of cone. For the first two batches the pollen was extracted following the same protocol applied to the sediment samples, to test for any possible contamination from the chemicals, the plastic tubes, and the processing. The last batch was extracted as follows: approximately 10 ml 3N HCl was added to the solution containing the <125 μm fraction of pollen concentrates to facilitate the precipitation of the grains during the initial centrifuging steps; ∼10 ml for the 15 ml tubes and ∼ 25 ml for the 50 ml tube 10% (by weight) KOH was then added to the sample and heated at 90°C for 10 min; this step was performed twice, until the supernatant was light-yellow colored. A rinse with 3N HCl at 90°C for 30 min followed this step. Then, after a water rinse, the sample was sieved with 80 μm nylon mesh and the >80 μm fraction was discarded to eliminate the coarse organic fraction, mostly represented by bigger fragments of cone. After one rinse with MQ water, 2.5% sodium hypochlorite (NaOCl) solution was added and heated at 90°C for 3 min. Following a water rinse, the sample was finally sieved with 37 μm nylon mesh; the >37 μm fraction was allowed to settle and excess water was removed, and then the sample was shipped to the flow cytometry facility in Indiana. Based on observation of the previous batches, there was no advantage in performing the heavy-liquid separation due to the absence of inorganic material in the sample.
Flow Cytometry Analysis and Pollen Sorting
Flow cytometry sorting was performed using a COPAS SELECT large-particle sorter (Union Biometrica) with Advanced Acquisition Package, using a 488 nm laser excitation source. The COPAS was specifically selected for its ability to separate larger particles, but it is possible to use different instruments such as the FACSAria to sort pollen smaller than pine (e.g., Quercus spps., Alnus spps., etc.). Flow cytometry is used to detect both light-scatter and fluorescence characteristics of particles using laser excitation in a fluidics-based system. These characteristics (scatter and fluorescence) are used to separate the pollen (autofluorescent) portion of the sample from other materials (non-fluorescent). Following the protocol established by Zimmerman et al. (2018) to check for possible radiocarbon contamination, the instrument was swiped before each batch of pollen sorting, and AMS measurements were performed on the swipes before the pollen samples were handled at CAMS. No elevated-14C contamination has been detected on any swipes from the IUB facility.
Concentrated samples were first diluted with MQ water at a final volume of 10 ml per sample. Samples were briefly analyzed by light microscopy to judge the proportion of pollen versus other material in the sample. If many small particles (<30 micron) were seen, the sample was also filtered through a 30 μm CellTrics filter (Sysmex) and the >30 μm particles collected for analysis and sorting. Sample was then added to MQ water in a 250 ml sample cup and analyzed by the sorter. Particles were selected as pollen by first using a gate region on a plot of TOF (Time Of Flight, relative length) vs. EXT (Extinction, relative structure) parameters (Figure 3). Particles falling within that gate were selected based upon autofluorescence, which is detected in the RED parameter at an emission of 610/20 nm, versus TOF (Figure 3). A test sort was performed to check that ten particles sorted as pollen were indeed pollen (confirmed by light microscopy). Samples were sorted in aliquots based on machine conditions and the selected fractions were collected into sterile petri dishes. These were transferred to 15 ml Falcon tubes and allowed to settle, then fractions of a single sample were re-combined and transferred to a sterile cryogenic tube. To minimize potential contamination from atmospheric carbon, approximately 20 μl of 1N HCl was added to each sorted sample; the samples were then frozen and shipped to CAMS on dry ice and stored at−20°C until pretreatment for AMS was begun.
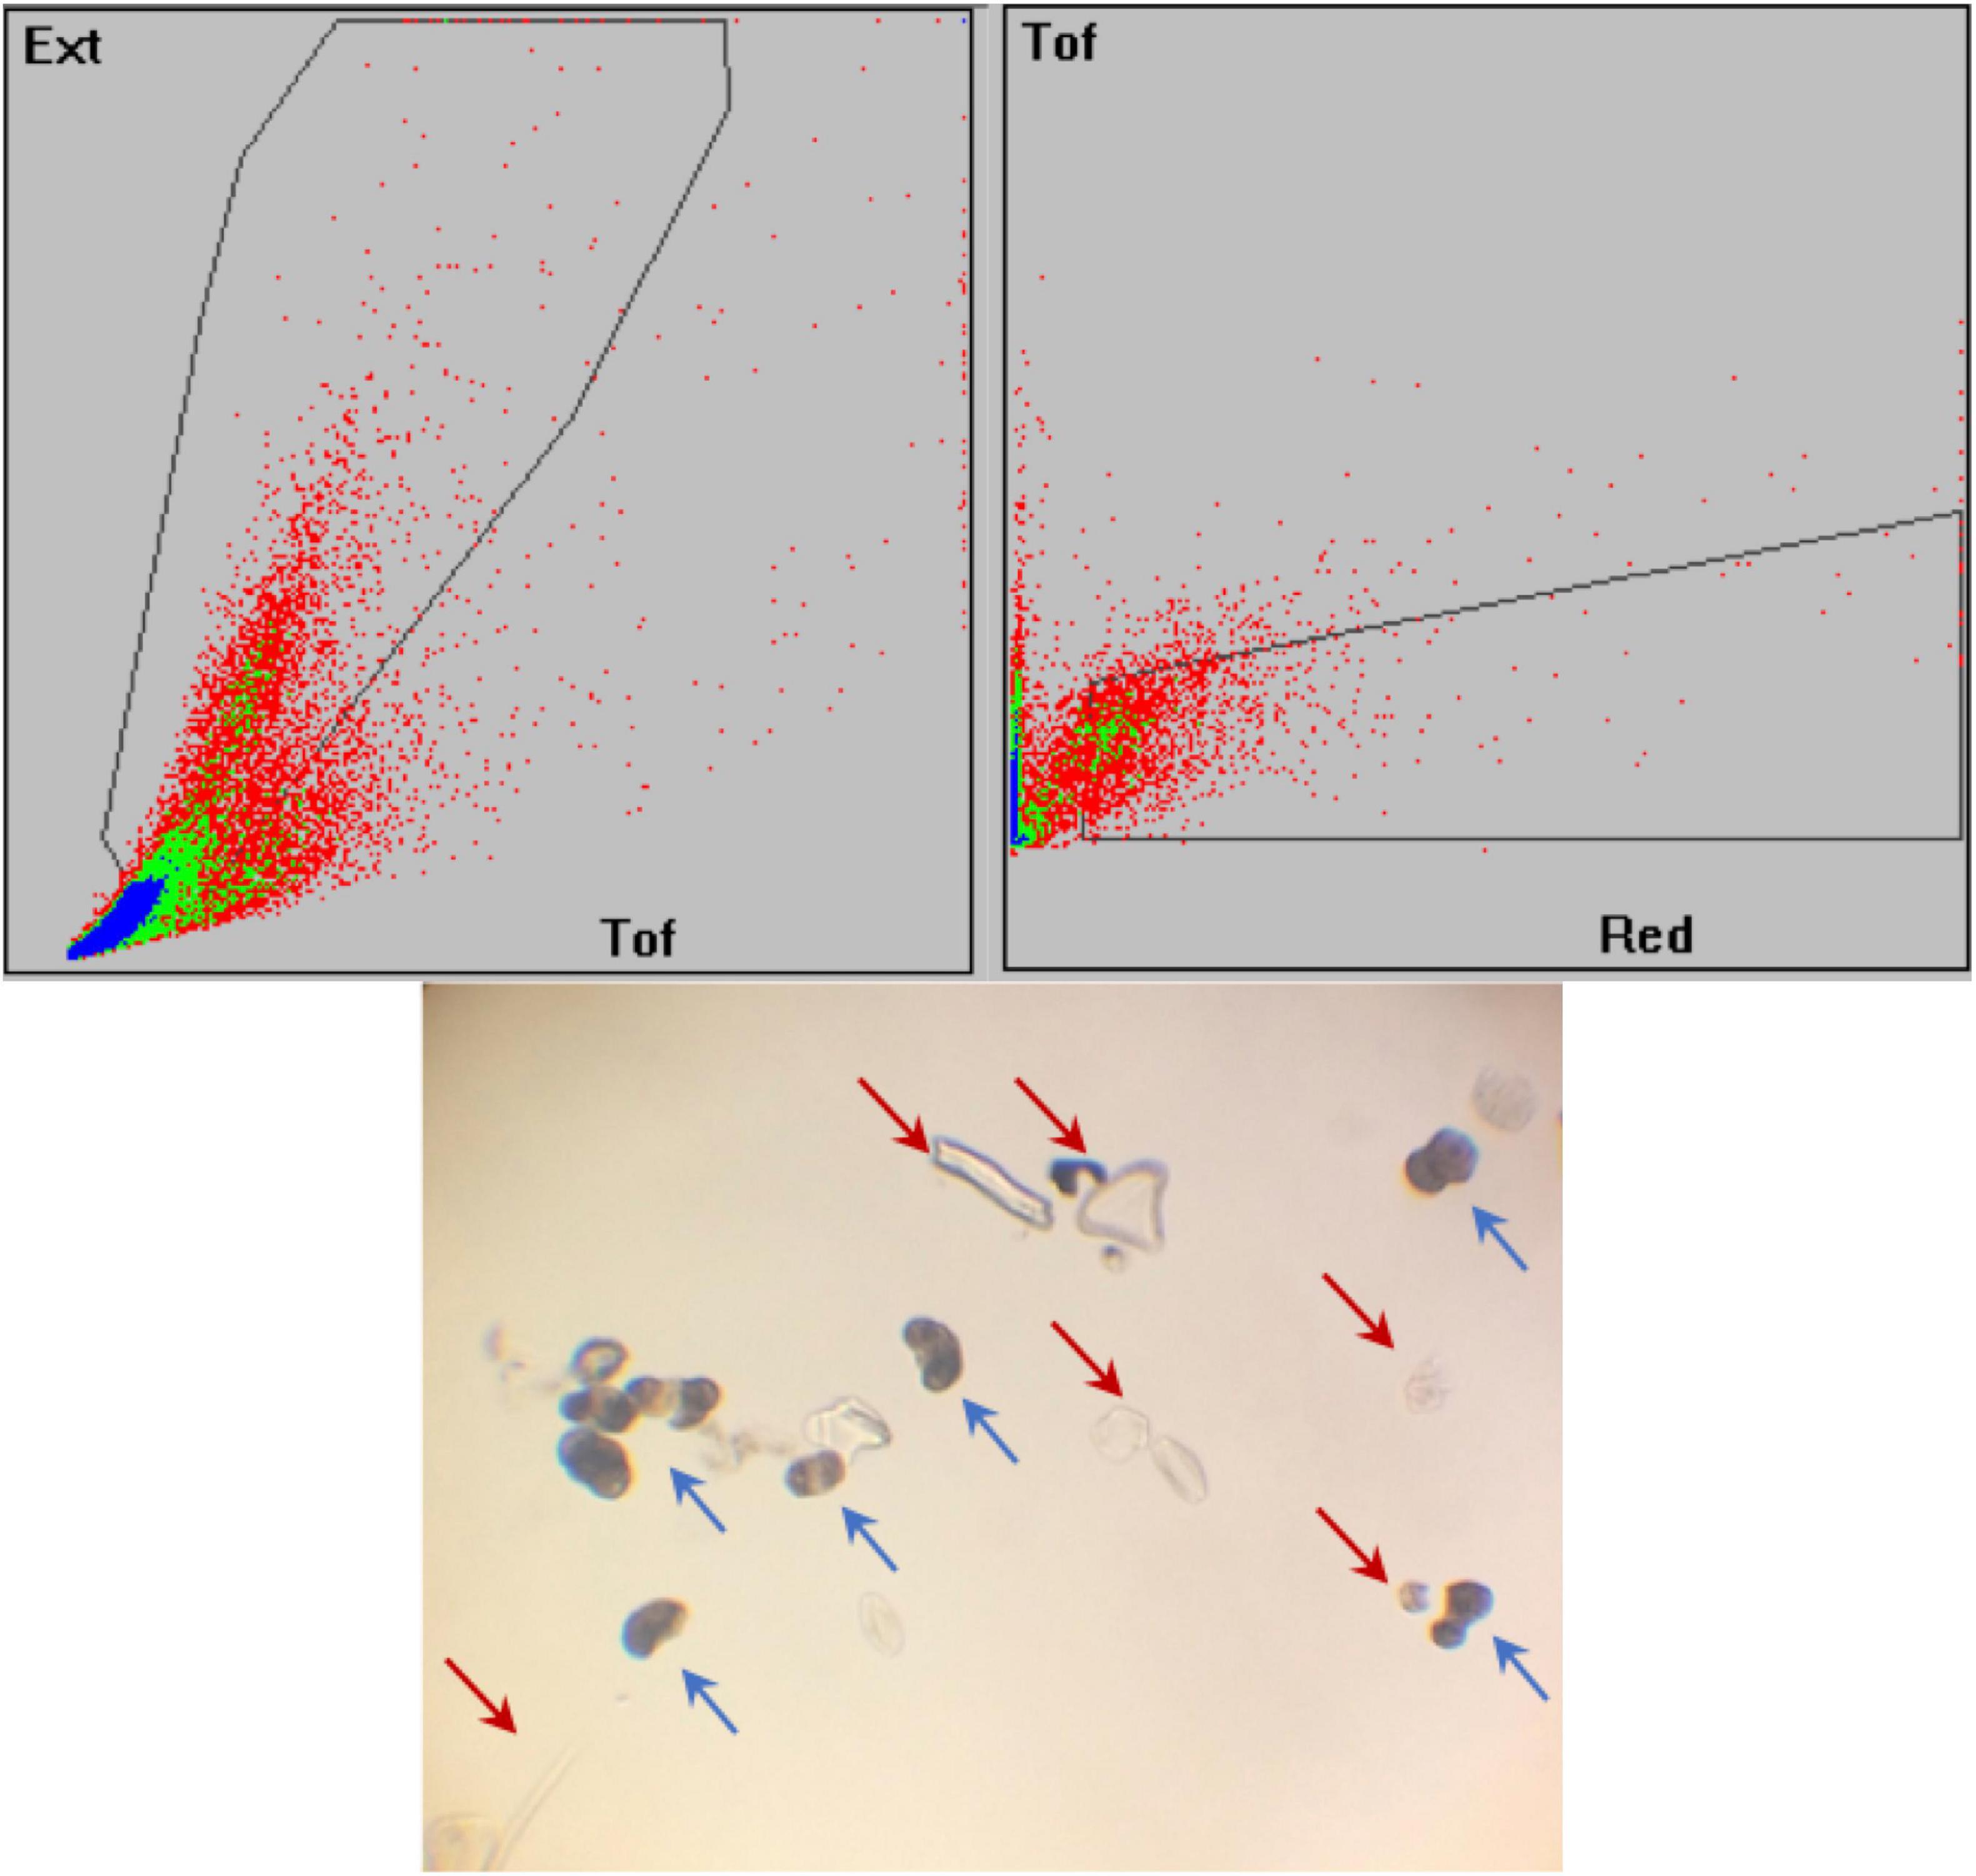
Figure 3. Flow cytometry plots of sample 1D-5U-2-46, as an example of the gates used to separate the pollen grains. The gates are the black polygons, showing the selected areas in which the ideal particles are included; each dot represents a particle that traveled through the COPAS laser. The gates are drawn by the operator based on optical density (Ext = extinction), size (Tof, time of flight), and fluorescence (Red). Photograph below shows the 1D-5U-2-46 sample after extraction and before sorting. The blue arrows indicate some examples of pollen grains, while the red arrows point out non-pollen particles, such as diatoms and organic fragments, that survived chemical digestion and sieving during pollen extraction.
Over the course of the project, the particles that were not selected by the sorter were periodically collected in the recovery cup and checked under the microscope to verify that the rejected fraction did not contain undesirably large fractions of pollen.
Graphitization and AMS Measurement
In order to be combusted to carbon dioxide (CO2), the pollen samples needed to be concentrated, dried and weighed into quartz tubes. The sorted samples were allowed to thaw completely at room temperature at CAMS and to settle undisturbed for 24 h, and then as much liquid as possible was pipetted out from the cryo-tubes without disturbing the pollen settled at bottom of each vial. In all cases, no more than 1 ml of solution, containing the pollen concentrate, was transferred by pipetting from the cryo-vial to the standard quartz tube used for graphitization at CAMS (inner diameter = 6 mm). The time required for drying the samples varied depending on the amount of solution transferred into the quartz tube and the technique used for drying. Three different approaches were used: heat block and oven, lyophilizer, and Jouan concentrator centrifuge (model Jouan RC 10.10 – heated/under-vacuum centrifuge). For the first approach, the tubes were placed on a heating block at ∼80°C and then transferred to a 40°C oven to complete the desiccation process, which required 2–3 days to be completed. For the lyophilizer, the quartz tubes containing the pollen concentrates were frozen in liquid nitrogen and freeze-dried for ∼24 h. Finally, for the third approach, the Jouan was used to dry the samples. In this case the quartz tubes were centrifuged at 65°C until the samples were completely dried. This step required approximately 2–6 h. Based on several tests conducted using these three different methods, the Jouan gave the most reliable sample handling, and greatly reduced the drying time compared to both the lyophilizer and the heat-block methods. Consequently, most of the samples were processed with the Jouan.
Copper oxide (CuO) and silver powder (Ag) were added to each tube after the sample was completely dry. The samples were then sealed under vacuum with an H2/O2 torch and combusted at 900°C for 4 h to oxidize the carbon of the purified pollen to CO2. The CO2 was then reduced to elemental carbon in the presence of a low-carbon, reduced-Fe catalyst and a stoichiometric excess of ultrapure hydrogen, similar to the methodology described in Vogel et al. (1984, 1987).
For these samples, which were anticipated to be of suboptimal masses (i.e., 20–40 μg C), the amount of Fe catalyst was decreased compared to larger (>100 μg C) samples, to 2.5 mg (compared to 5.7 mg for larger samples). Radiocarbon data are corrected for the contribution of modern and dead carbon added during combustion and graphitization following Brown and Southon (1997). Coal backgrounds and modern (OX2) standards were handled similarly and analyzed in order to determine the modern (0.3 ± 0.1 μgC) and dead (0.15 ± 0.1 μgC) contributions, respectively. Due to the small size of the pollen samples and static charge, in most cases it was not possible to measure the mass of the samples accurately, even on a high-precision balance. While this prevented estimation of the % carbon content of many of the purified pollen samples, the sample carbon masses needed for the above-mentioned corrections were obtained from known-volume pressure measurements of the CO2 gas during the graphitization process.
After graphitization, all samples were pressed into sample holders designed for the CAMS high-intensity sputter source and the samples’ 14C contents were measured during routine radiocarbon runs. Due to the very small size of some of the samples, the ion source parameters were modified to extend the length of time small samples could be sputtered.
Between July 2017 and September 2019, 102 final samples were extracted from fresh cones, surface transect and sediment-core samples. AMS measurements were conducted on 56 samples, 44 of which produced reliable dates (Tables 1, 2).
Discussion
Pollen Extraction
The density separation and the sieving were the main steps during the pollen extraction to separate the pollen grains from other organic particles that may represent a contamination source for AMS analysis (Figure 2). The pollen concentrates were mostly pine pollen together with some organic particles, such as charcoal, micro plant remains and diatoms in different amounts, depending on the characteristics of the sediment samples (Figure 4). Occasionally, different types of pollen (e.g., Artemisia type) were observed in the final concentrates.
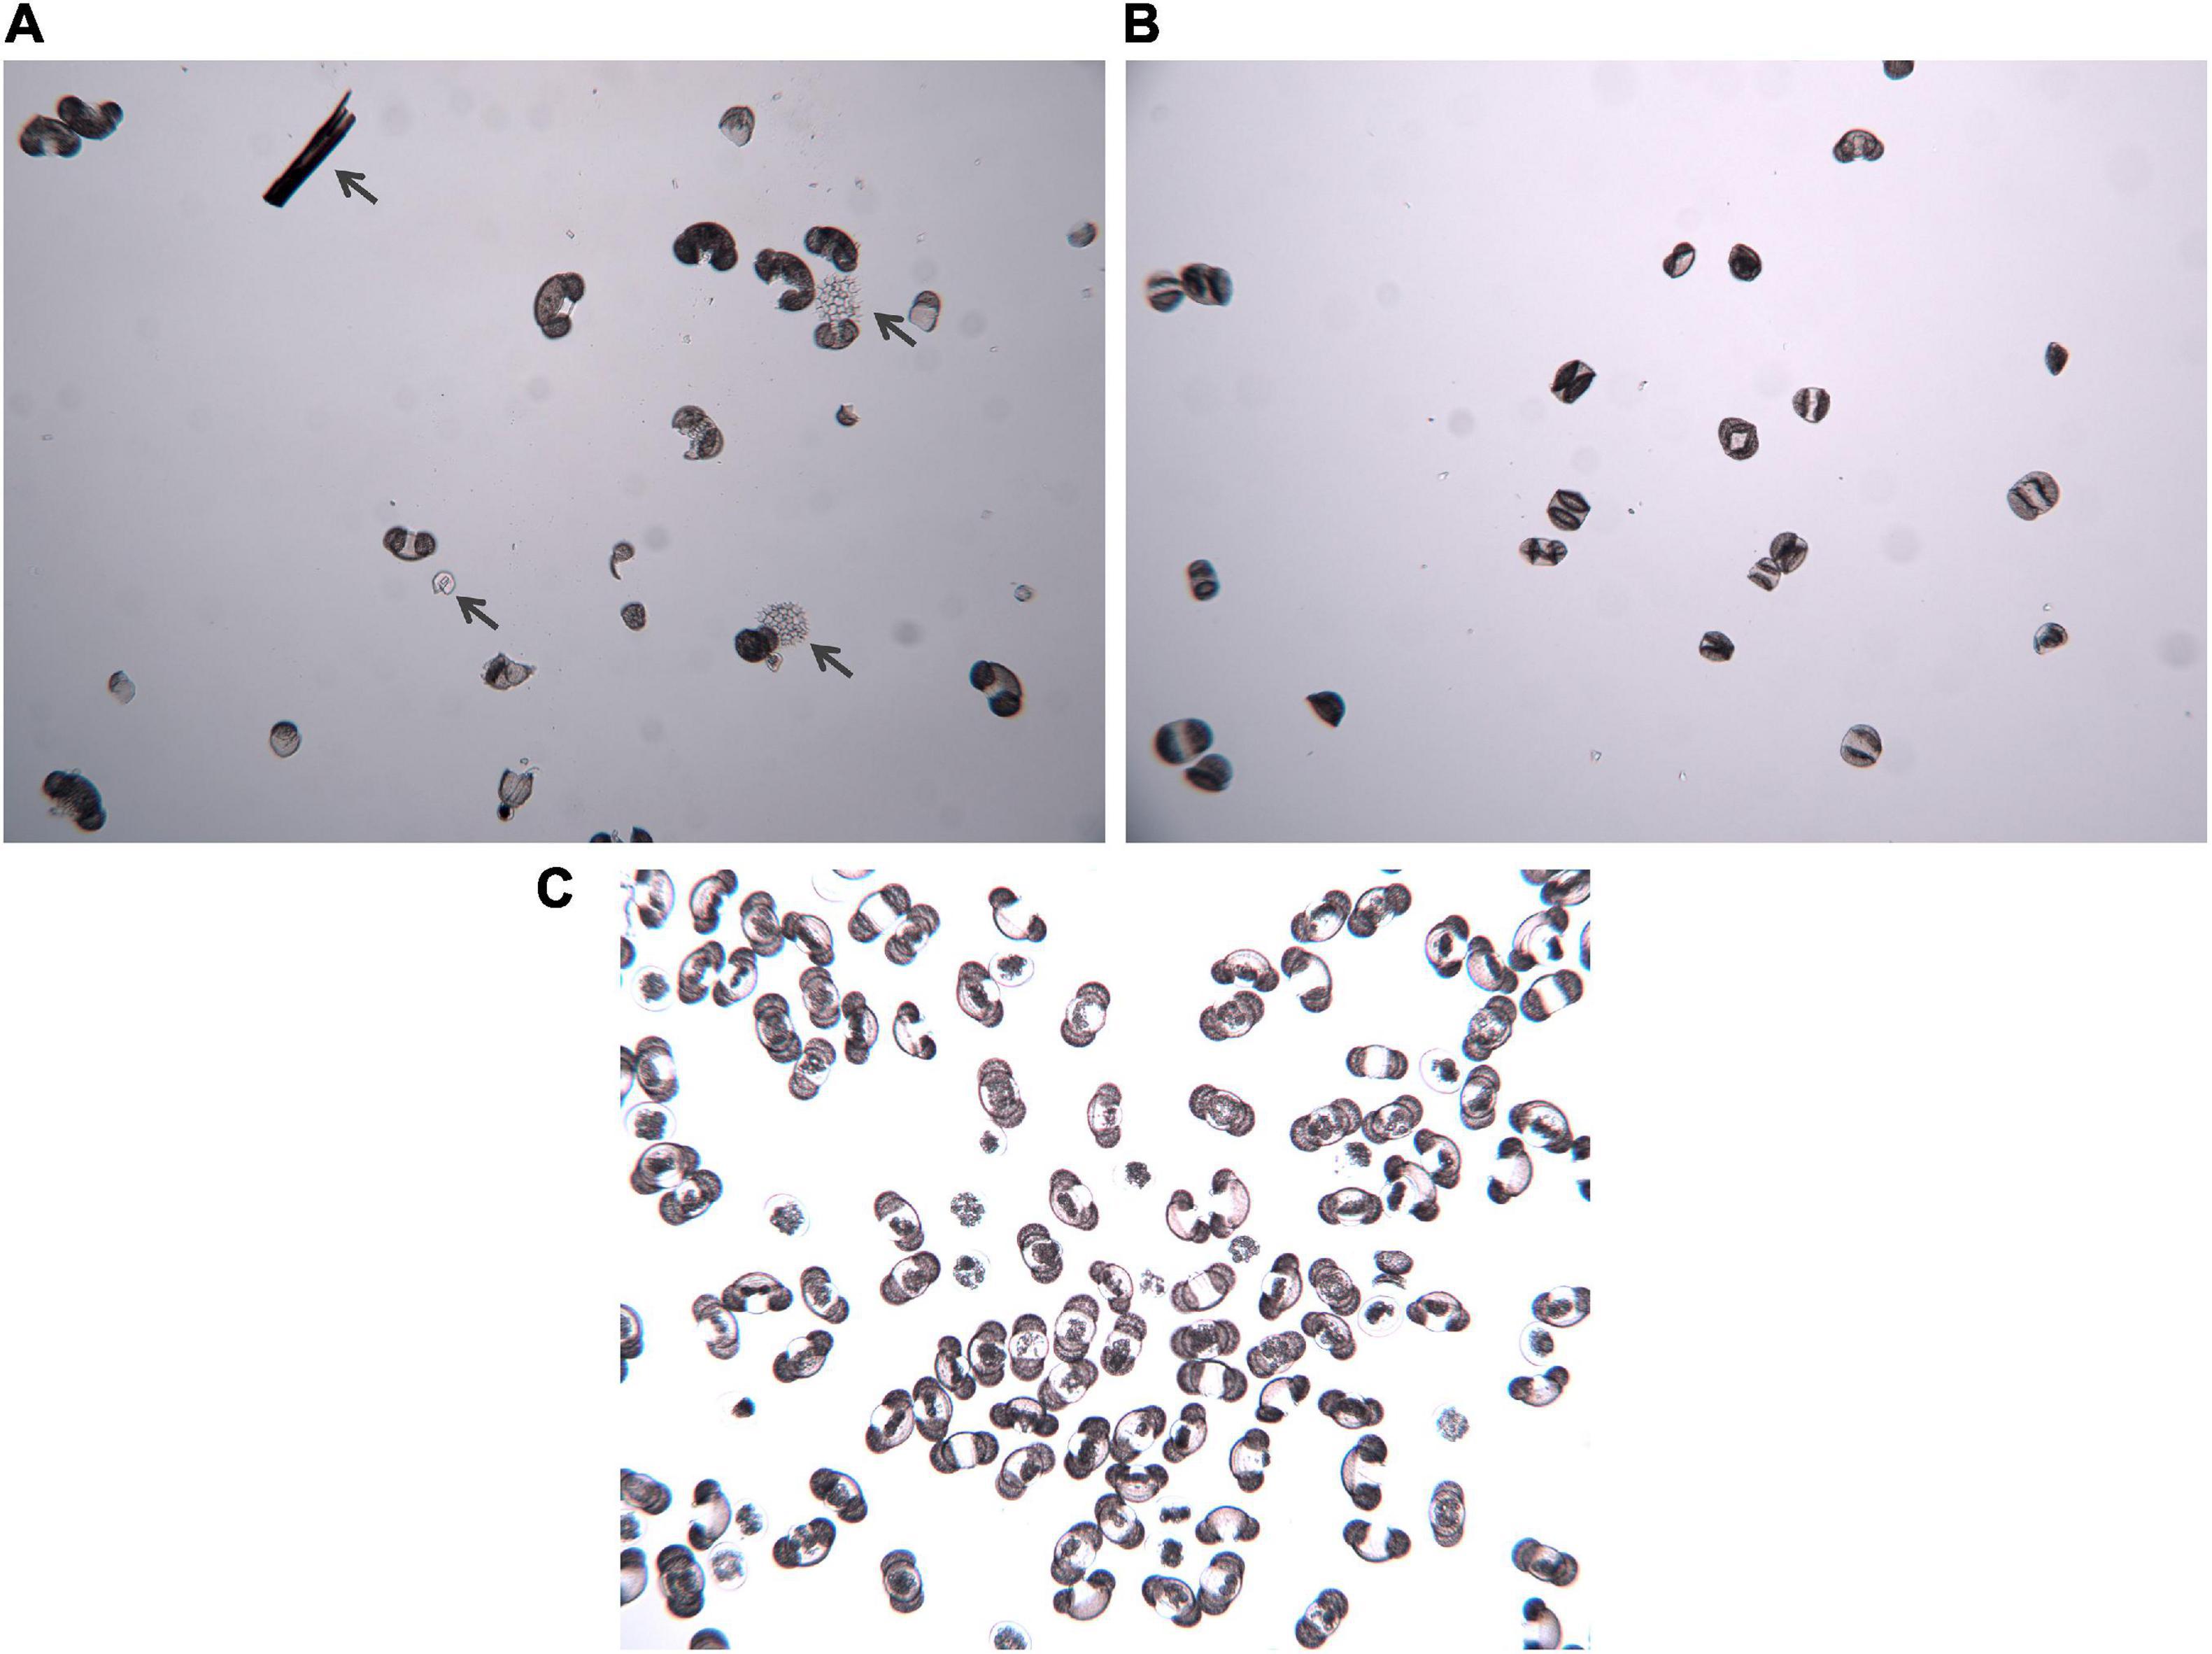
Figure 4. Photos of pollen separates under 100x magnification before and after cytometric sorting. (A) Fossil sample before the sorting, with dark gray arrows highlighting organic particles that survived chemical digestion and physical sieving during pollen extraction. (B) Fossil sample after sorting, illustrating the greatly increased purity of the sample. (C) Modern pinecone sample before the sorting, illustrating the general purity of the sample, even with reduced preparation steps.
The samples were initially processed in 50 ml glass and polypropylene (Falcon) centrifuge test tubes because of suspicion that the chemical steps might leach petroleum-based (i.e., 14C-dead) carbon out of the plastic. Comparison of the 14C Fraction Modern of the fresh pine pollen processed in glass and polypropylene tubes (4x each) showed no contamination from the polypropylene during our processing. Therefore, 50 ml Falcon tubes were preferred to glass tubes because they were easier to handle in the centrifuge.
The first critical goal during the pollen extraction is to obtain enough pollen to have a sufficient amount of C to date. This step may represent a major challenge if pollen concentrations in the different layers of the core are not known. This information is very helpful to determine the adequate amount of sediment for the extraction. For all the samples (ML, FLL and surface-transect samples) about 2–4 cc of sediment was processed during the pollen separation, providing extremely variable results (Table 1, columns 4–6). As expected from the preliminary pollen analysis, FLL samples showed a very high pollen concentration, and it was relatively easy to separate abundant pollen in all the samples that were extracted. For the ML cores the pollen concentrations were not available and, due in part to the heterogeneity of the cores, it was often difficult or impossible to extract sufficient pollen for dating. Based on the results obtained in this study, 4 cc of raw sediment per sample was the preferable volume to produce a minimum amount of ∼30,000 grains of pollen, with an optimum of 50,000 grains desired. The amount of pollen required for AMS analysis and the amount of sediment required to yield that amount of pollen will vary based on the sediment and pollen type.
The first pollen extractions attempted on many modern samples did not provide the expected results, mainly due to the diverse nature and composition of the sediment. The modified and improved extraction protocol given in Section “Core and Surface Sediment Samples” was applied and reliably produced a pollen concentrate that could be easily dated from most samples. The composition of the sediment of some modern samples did not provide enough pollen grains for dating even with the improved method, leading to the conclusion that certain sediment does not preserve or hold pollen like other types (e.g., coarse or sandy versus fine or clayey sediment, Table 2, Column 3).
In general, for samples dominated by a single pollen type (as our samples were), there should be a strong linear correlation between the number of grains sorted and the mg of carbon in the AMS sample. Our results show a weak linear correlation between the number of pollen grains and the C amount for samples dried in the Jouan (Figure 5 and Table 1). Deviation from this trend may result from several parts of the process. To begin with, handling thousands of pollen grains through the many steps required introduces opportunities for loss of grains, until a workable protocol is developed for each lab and handler. Further, the number of “pollen grains” is in reality a number of events identified by the sorter as fitting the gates established by the operator (discussed below in Section “Flow Cytometry Sorting”), and there may be variations in size and condition of the pollen grains. Finally, there may be small but real differences in the amount of carbon contained in each grain, due to the size of the grains, thickness of the exine, and presence or absence of cytoplasm in the grain (especially for fresh pollen).
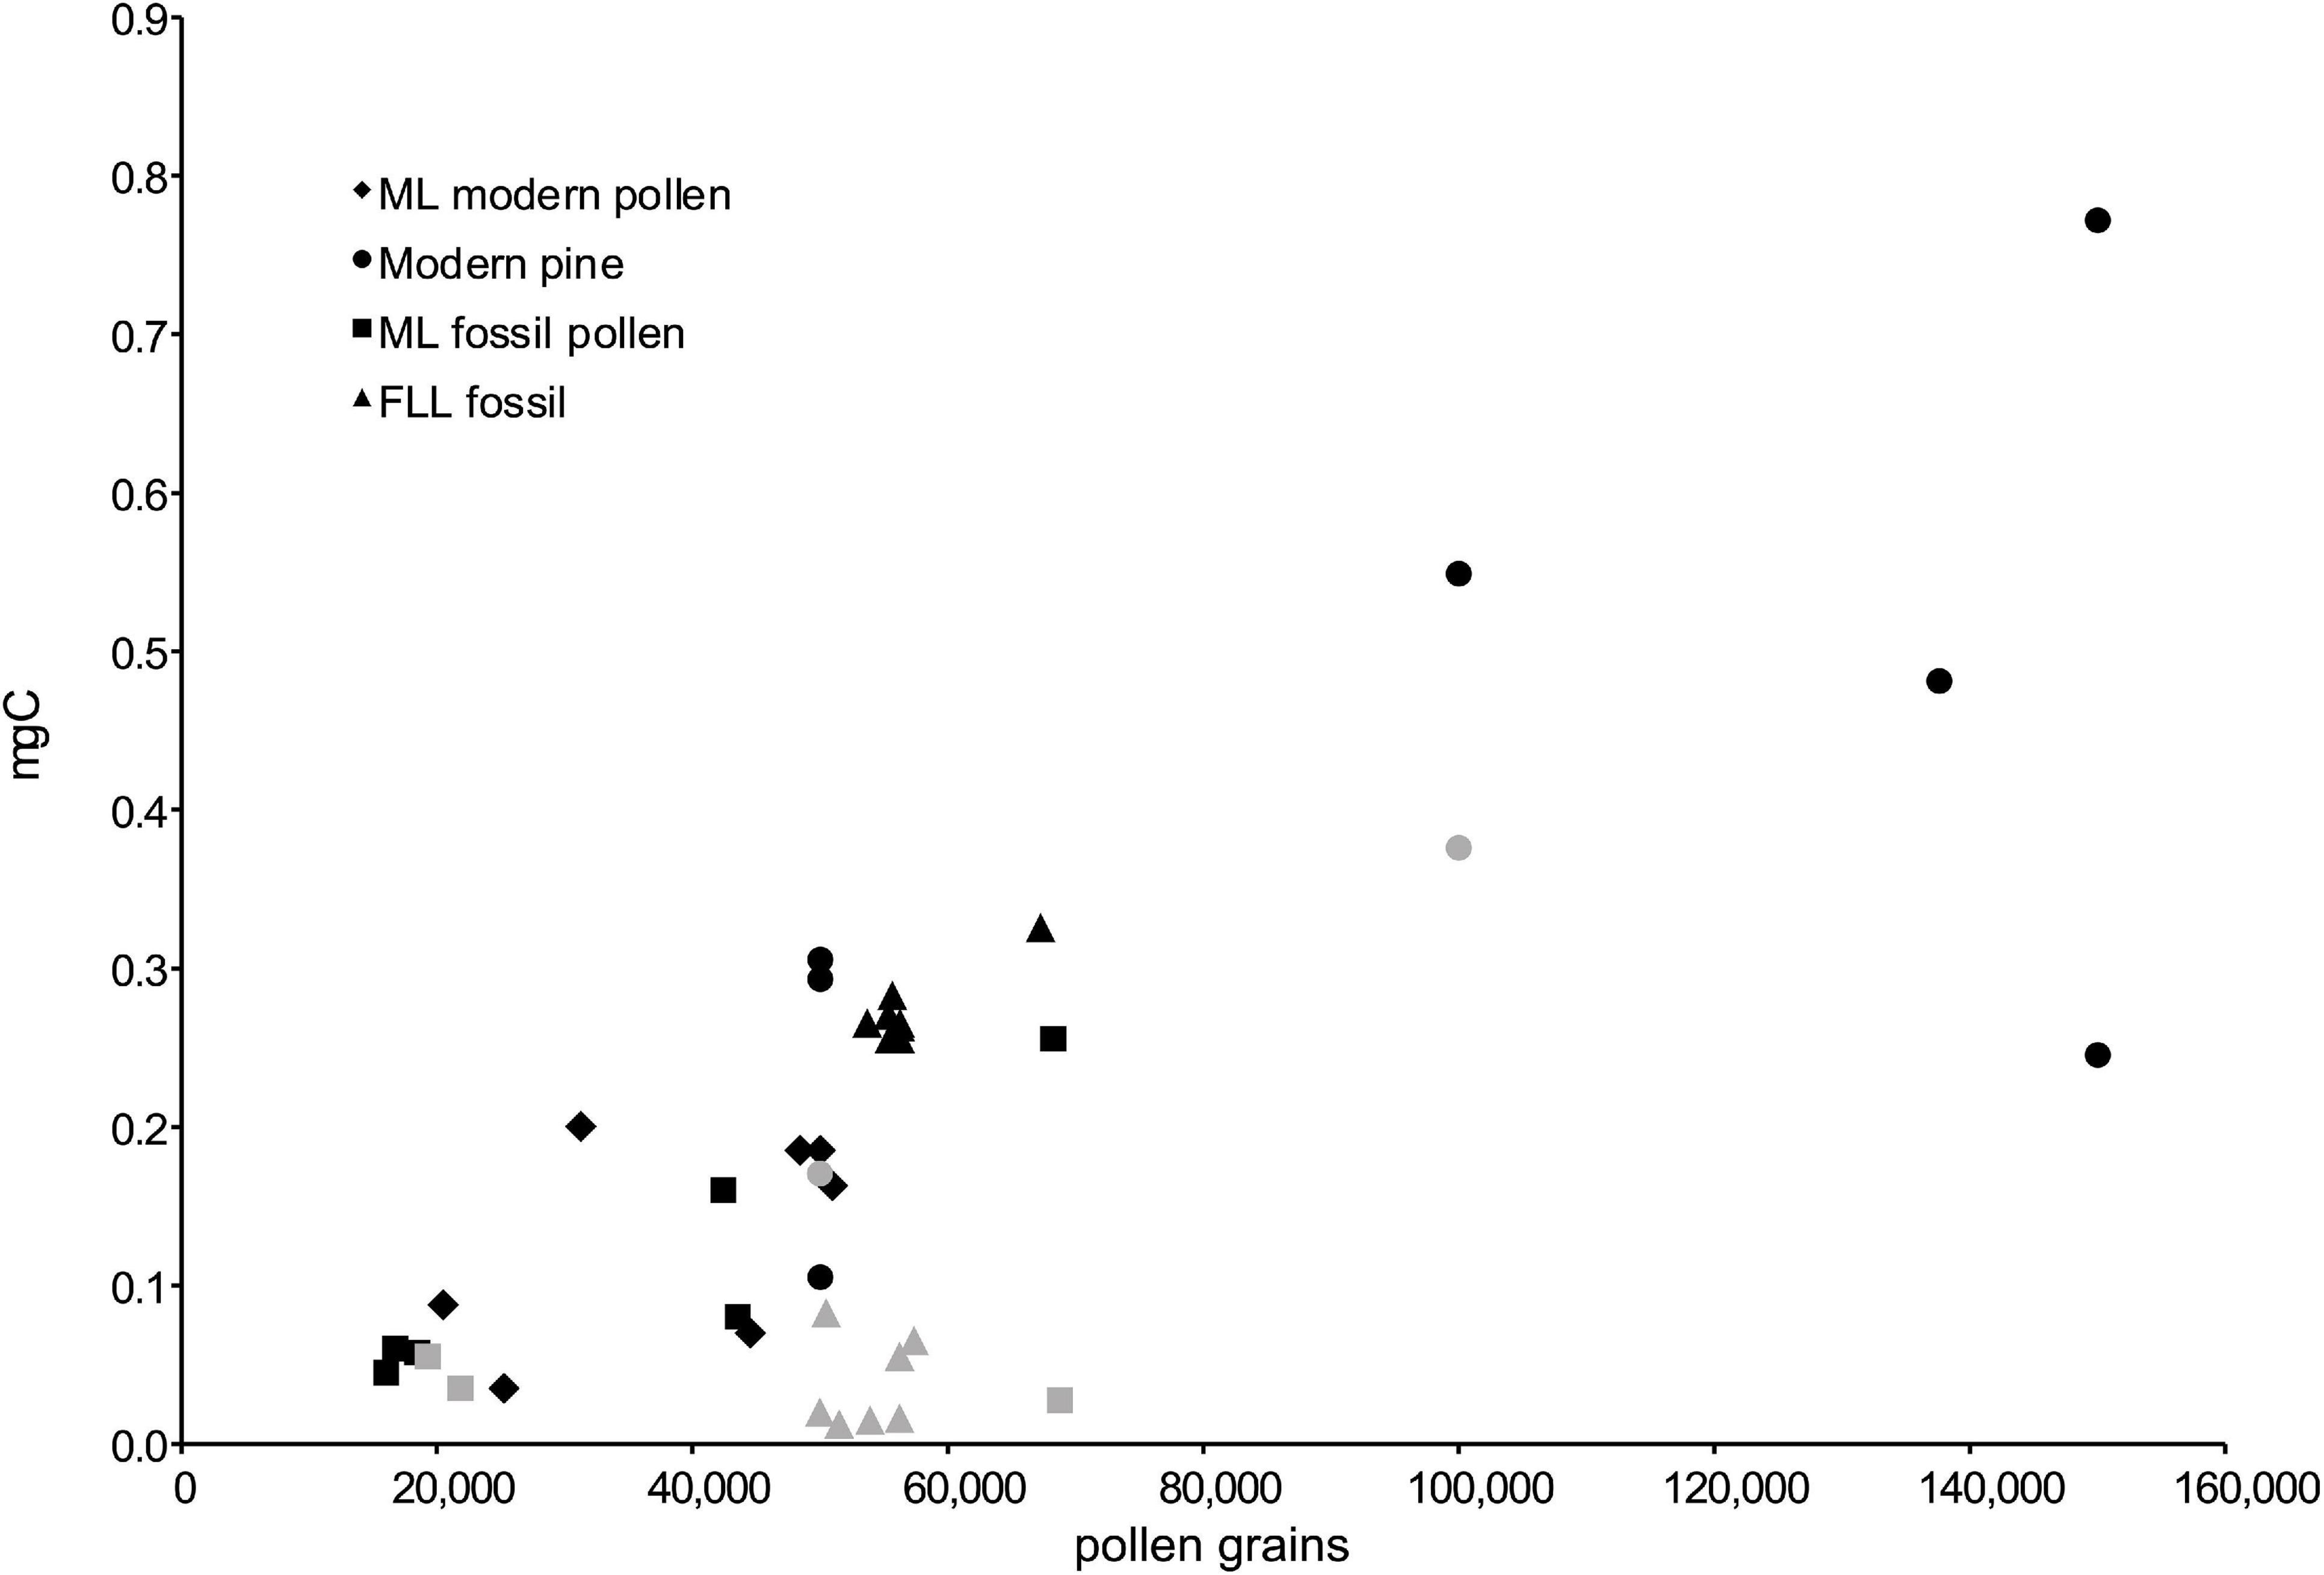
Figure 5. Amount of carbon (mg C) vs. pollen grains in sample, showing only the samples that have been successfully dated. Symbols in gray show the samples that were processed with the lyophilizer, illustrating the significant loss of pollen after sorting and before graphitization. The amount of carbon (mg C) is calculated from the amount of CO2 after the sorted pollen sample was combusted for graphitization, and the number of pollen grains is the number of “accepted” events counted by the sorter during sorting of the sample.
Chemical Treatment
The base treatment (KOH) is applied to remove as much organic material and humic acid as possible from the sediment. In a standard extraction for pollen analysis, acetolysis is usually used for this particularly important step, but it is not appropriate for AMS measurement due to carbon contamination from the chemicals. Instead, 10% KOH solution was applied. The main concern of using basic solutions during the chemical digestion for radiocarbon dating is the possible contamination by absorption of modern carbon from atmospheric CO2 by the KOH. To avoid this contamination, the following precautions were followed: (i) the 10% KOH solution was freshly prepared and stored in a screw-top bottle for no longer than a month; (ii) multiple rinses with a shorter exposure to the base were preferred to a prolonged exposure (e.g., three times 10 min with fresh solution instead of a single time for 30 min); (iii) the base treatment was followed by the acid treatment with HCl without water rinses in between the two steps.
To remove as much organic matter as possible NaOCl was used in place of the acetolysis; exposure to NaOCl was limited to 3 min at 90°C because prolonged exposure may result in damage to the pollen grain walls. Other chemicals can be used in place of NaOCl, such as nitric acid (HNO3) (Tennant et al., 2013) or sulfuric acid (H2SO4) (Piotrowska et al., 2004), but in this study NaOCl was preferred because it is easily accessible, less hazardous and equally effective. The 2.5% solution was freshly prepared and stored tightly closed for no longer than a month to maintain the effectiveness of the solution.
The sediments from Fallen Leaf Lake and Mono Lake presented substantially different characteristics that required modification and adjustments during the pollen extraction. The significant organic component required a prolonged base treatment for FLL. All the samples from the core BOLLY-FLL10 required 3 KOH rinses to obtain a light-yellow colored supernatant, starting from a dark-brown initial color. In contrast, ML samples showed very little reaction to the KOH and only 1 base rinse was necessary for most of the samples.
The second remarkable difference between the samples from the two lakes was the HCl reaction. ML samples strongly reacted to the acid treatment due to the high presence of carbonates in the cores. A prolonged acid treatment was required for several samples until the end of the reaction (40–60 min). FLL sediment did not present any visible reaction with HCl (bubbling), consistent with the low presence of carbonates in the core. For FLL the samples were treated with HCl with the standard duration of 30 min at 90°C.
Physical Separation
The physical separation of the pollen grains from other particles that survived the chemical treatment is crucial to obtain a sample as clean as possible and to reduce the time and the cost of the sorting process. The most appropriate size of the meshes to use is determined by the size of the targeted pollen type. In this study pine pollen was the most abundant in both cores and consequently the desired fraction based on our various experiments was >37 μm and <80 μm. Every fraction was checked under the microscope to avoid a loss of pollen grains.
Sieving was performed with metal sieves (125 and 63 μm) and nylon mesh (80, 37, and 20 μm), targeting pine pollen. Sieving at 125 μm was not necessary for the sediment core samples but was crucial for the modern samples (pinecones and surface transects) to eliminate larger organic debris and small rocks. The 80 and 63 μm sieved samples were cleaner and lacked big fragments that were detected under the microscope in the 125 μm sieved samples. To eliminate smaller particles, initially the final sieving was performed with a 20 μm nylon mesh. However, because of the low percentages of sorted pollen in some batches (Tables 1, 2), the samples were re-sieved at 37 μm. Microscope examination showed that the 20–37 μm fraction contained a large amount of non-pollen material and very little pollen. Thus, the final sieving step was changed from 20 to 37 μm, resulting in higher percent sorted pollen in later batches (Tables 1, 2). For the same reason, the 80 μm mesh was preferred to the 63 μm. Such checks will be required to determine the most efficient mesh sizes for a particular sediment and pollen type.
In an experiment to optimize the sieving process, 10 samples from FLL were sieved in an ultrasonic bath. The use of the sonicator sped up the sieving steps significantly, but, based on the results (Table 1, columns 4–6 and Figure 5, gray symbols), the effect on pollen grains is unclear at this point.
Density Separation
The heavy liquid separation was performed with SPT to separate the organic from the inorganic material. This step can be alternatively performed with hydrofluoric acid (HF), but we preferred SPT in this study, as it is significantly less hazardous to use and dispose of, and is still highly effective.
A specific gravity of 2.1 for SPT is recommended for pollen analysis extraction (e.g., Munsterman and Kerstholt, 1996; Vandergoes and Prior, 2003); however, it allows small organic particles to separate with pollen grains, which should be avoided in preparation for AMS measurements. Several tests were performed using different specific gravities (1.9, 2.0, 2.1, 2.2) in order to eliminate non-pollen particles in the floating layer. The floating material was decanted in a new, clean tube. Adding water to this solution allowed the pollen grains and the organic particles to settle at bottom of the tube. If the organic material separated with the pollen grains was excessive, the specific gravity was reduced. The purity of the pollen concentrates increased significantly with a lower specific gravity and 1.9 was shown to be the most effective specific gravity for using SPT to separate pollen from other organic material without losing pollen in the settled fraction. Specific gravities >1.9 allowed a significant amount of other organic particles to separate with the pollen grains. A minimum of 3–4 rinses was required to clean the samples from the SPT, although this step appeared to be different for each batch of samples. The heavy liquid separation was not required for the pinecones due to the absence of inorganic material in the samples.
A heavy liquid with low-C content is required to avoid C contamination, and for this reason the SPT-O (from Geoliquids, Inc.) was preferred. The heavy liquid can be challenging to eliminate and for this reason only the necessary amount of SPT was added to the samples, which for the 50 ml test tubes was found to be ∼20 ml. To avoid cross-contamination between samples, the SPT was not reused.
The density separation was effectively applied for all the fossil and modern surface samples, allowing the pollen grains to float and the inorganic particles to sink. Thus, no further steps were required to separate the organic and inorganic matter. However, in FLL samples a considerable number of diatoms fragments were detected in the floating section during the heavy liquid separation for a few samples. Diatoms frustules are composed of silica and do not represent a source of contamination for AMS measurements, but a high abundance of diatoms may increase the time and cost for the sorting process. In the case of high concentration of diatoms, a HF rinse would dissolve the frustules, and thus it may be preferred for some samples. In spite of the presence of the diatoms, the sorting time for FLL was efficient and remained under 4.5 h (Table 1, Column 5). Thus, the use of the HF was not necessary in our study.
Flow Cytometry Sorting
The highest percentage of pollen sorted by the flow cytometer (COPAS) was ∼74% of the total particles introduced to the sorter, from fresh cone samples and some FLL fossil samples (Tables 1, 2). This percentage does not seem particularly high, especially as the samples extracted from the fresh cones were characterized by extremely high purity. As we initially expected results closer to 100% for the fresh cones, we examined the sorting process to determine the source of the discrepancy.
The COPAS allows the recovery of the material rejected by the sorter, after the sorting into the recovery cup and before the disposal into the waste container. Several samples were collected during this step and analyzed by light microscopy. The light-microscopic observation revealed that a considerable amount of pollen was rejected during sorting. Most of this pollen was clusters of several grains, or broken or folded grains; however, a few whole, regular-shaped grains were detected as well. These might have been included in the final sample if the gates had been larger; however, larger gates would also increase the likelihood that non-pollen material would be included in the final sample. By selecting a smaller gate, a larger number of pollen grains may be excluded during the sorting (Figure 3), but the purity of the sample is improved. The gated region thus has a major role in the results of the pollen percentage and purity, and additional tests of this component of the preparation are planned.
Handling Sorted-Pollen Concentrates
After the sorting by flow cytometry, the samples were transferred into 3.5 ml cryo-tubes and the supernatant was allowed to settle for at least 2 h to overnight. The samples were then frozen at –18°C and shipped with dry ice to CAMS. Freezing the samples is important to preserve the samples undisturbed as much as possible, to reduce possible loss of pollen grains that may get attached the lid or the internal walls of the vials.
Before proceeding with combustion and graphitization, the samples were allowed to thaw at room temperature and settle overnight, as thawing induces the resuspension of the pollen grains in the solution. Once the pollen had settled, as much of the liquid as possible was removed by pipetting without disturbing the pollen concentrates at the bottom of the vials. The samples were then transferred into quartz tubes and then placed in the Jouan to dry. The Jouan was preferred to the lyophilizer after comparison of the AMS results showed better preservation of pollen concentrates (as indicated by higher C amount in the samples during the graphitization process (Table 2, Column 7 and Figure 5). This identified a likely loss of pollen during the drying process in the lyophilizer. No additional rinsing or pretreatment was necessary due to the extensive pollen extraction process, and post-sorting storage in slightly acidic water.
Comparison of Pollen and Macrofossil Dates From Fallen Leaf Lake
For 12 of the 15 pollen-macrofossil pairs from the Fallen Leaf Lake cores, the macrofossil and pollen ages agree within the combined 2-sigma uncertainty, and within 1-sigma for ten of the pairs (Table 3 and Figure 6). Of the remaining three pairs, the pollen date for sample 2D-1K-8-7 (CAMS 181806) is 145 years older than the macrofossil, just outside the 130-year combined uncertainty. For samples 2D-1K-3-25 and 2D-1K-6-50, the pollen dates (CAMS 181802, 181804) are significantly younger than the macrofossil dates, by 345 and 285 years, respectively. Although there could be several reasons for the disagreement, one possibility is that the macrofossils were pre-aged on the landscape; in such a case, the pollen dates might be a more accurate representation of the age of the sediment. In this case, the macrofossil material dated at 2D-1K-3-25 was a leaf, making pre-aging a somewhat unlikely possibility for that sample. Finding similar disagreement between pollen and leaf dates from Lake Sugeitsu, Tennant et al. (2013) suggested that the small size (0.4 mg) of the pollen sample might be the cause; however, here, the two ‘young’ dates are 0.26–0.27 mg, the same as the other FLL pollen samples and well within the range of the routine small-sample correction at CAMS. Overall, these pollen-macrofossil pairs indicate that dating of pollen separates can produce dates with equal accuracy as macrofossils. However, we acknowledge that Fallen Leaf Lake is an ideal case, where pollen dates are unlikely to be needed except where very high precision is required (e.g., during the extreme climatic swings of the last deglaciation).
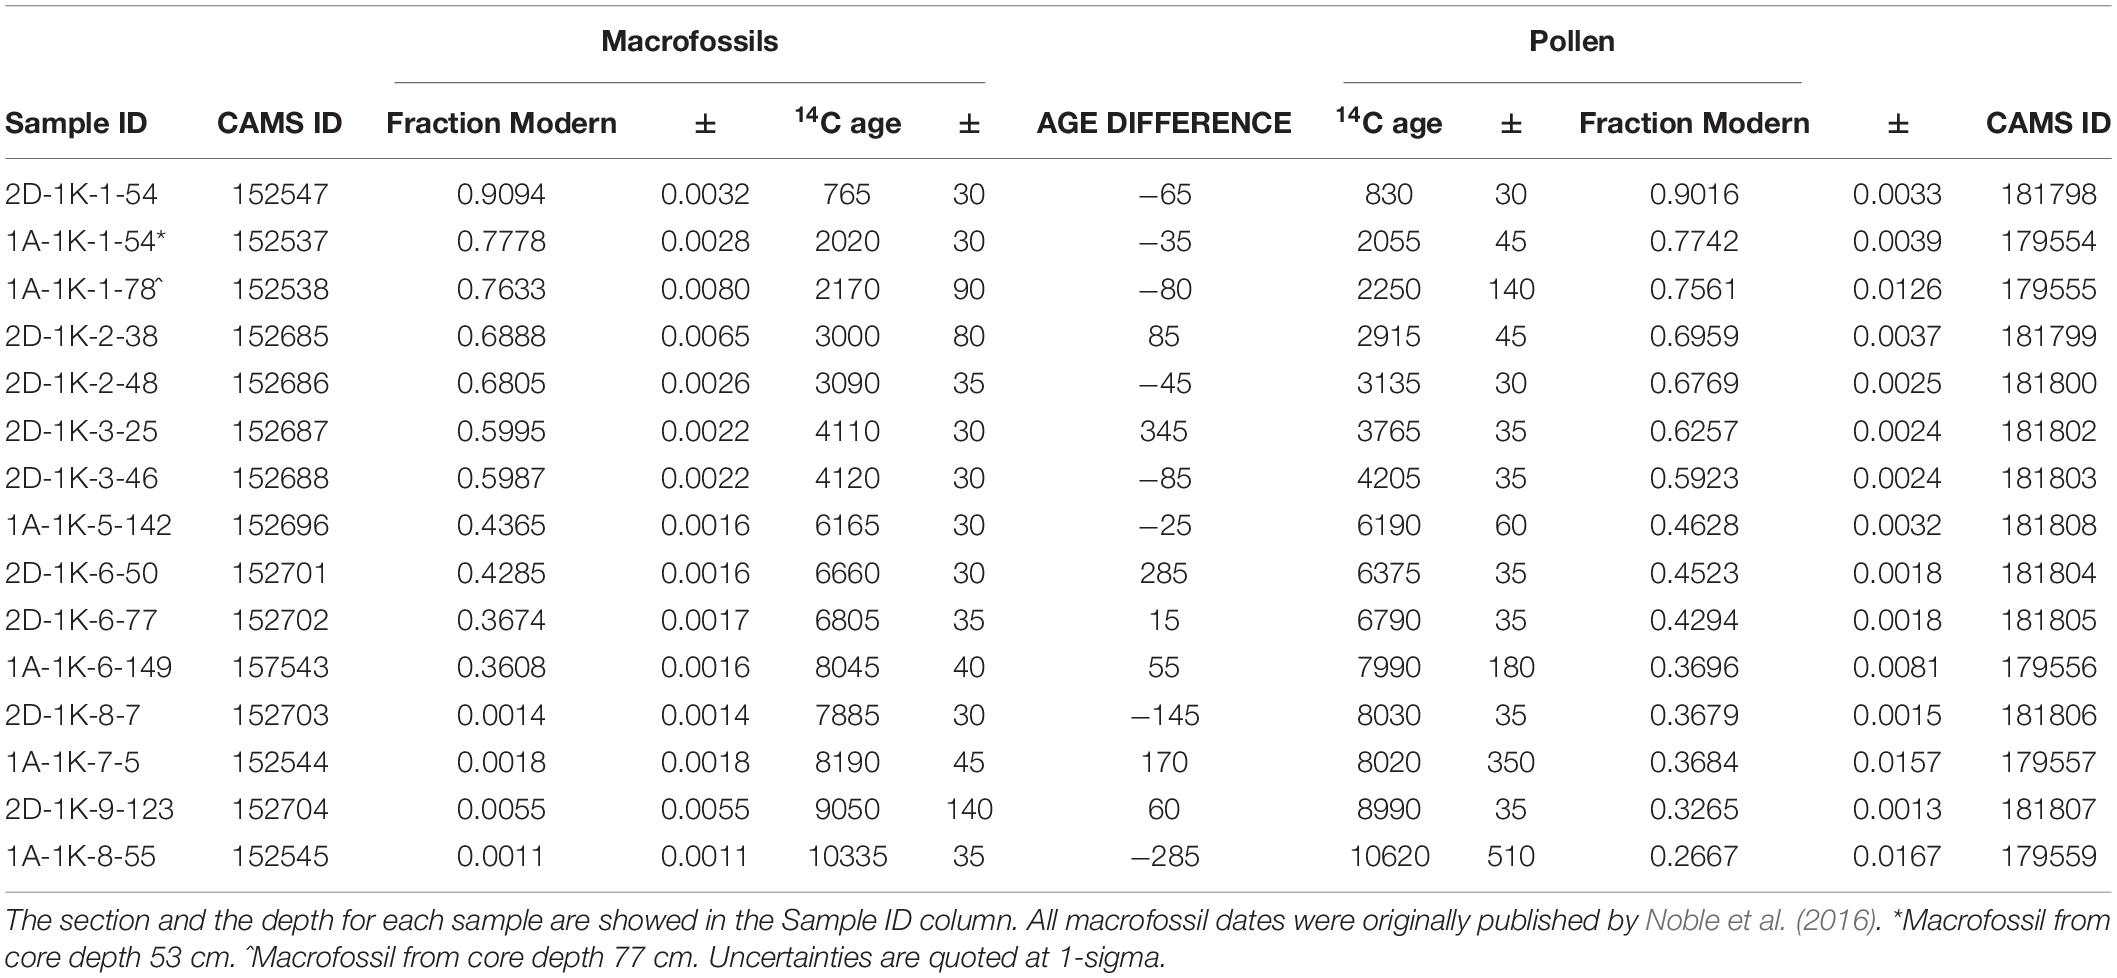
Table 3. Comparison between macrofossils and pollen dates on FLL core samples.
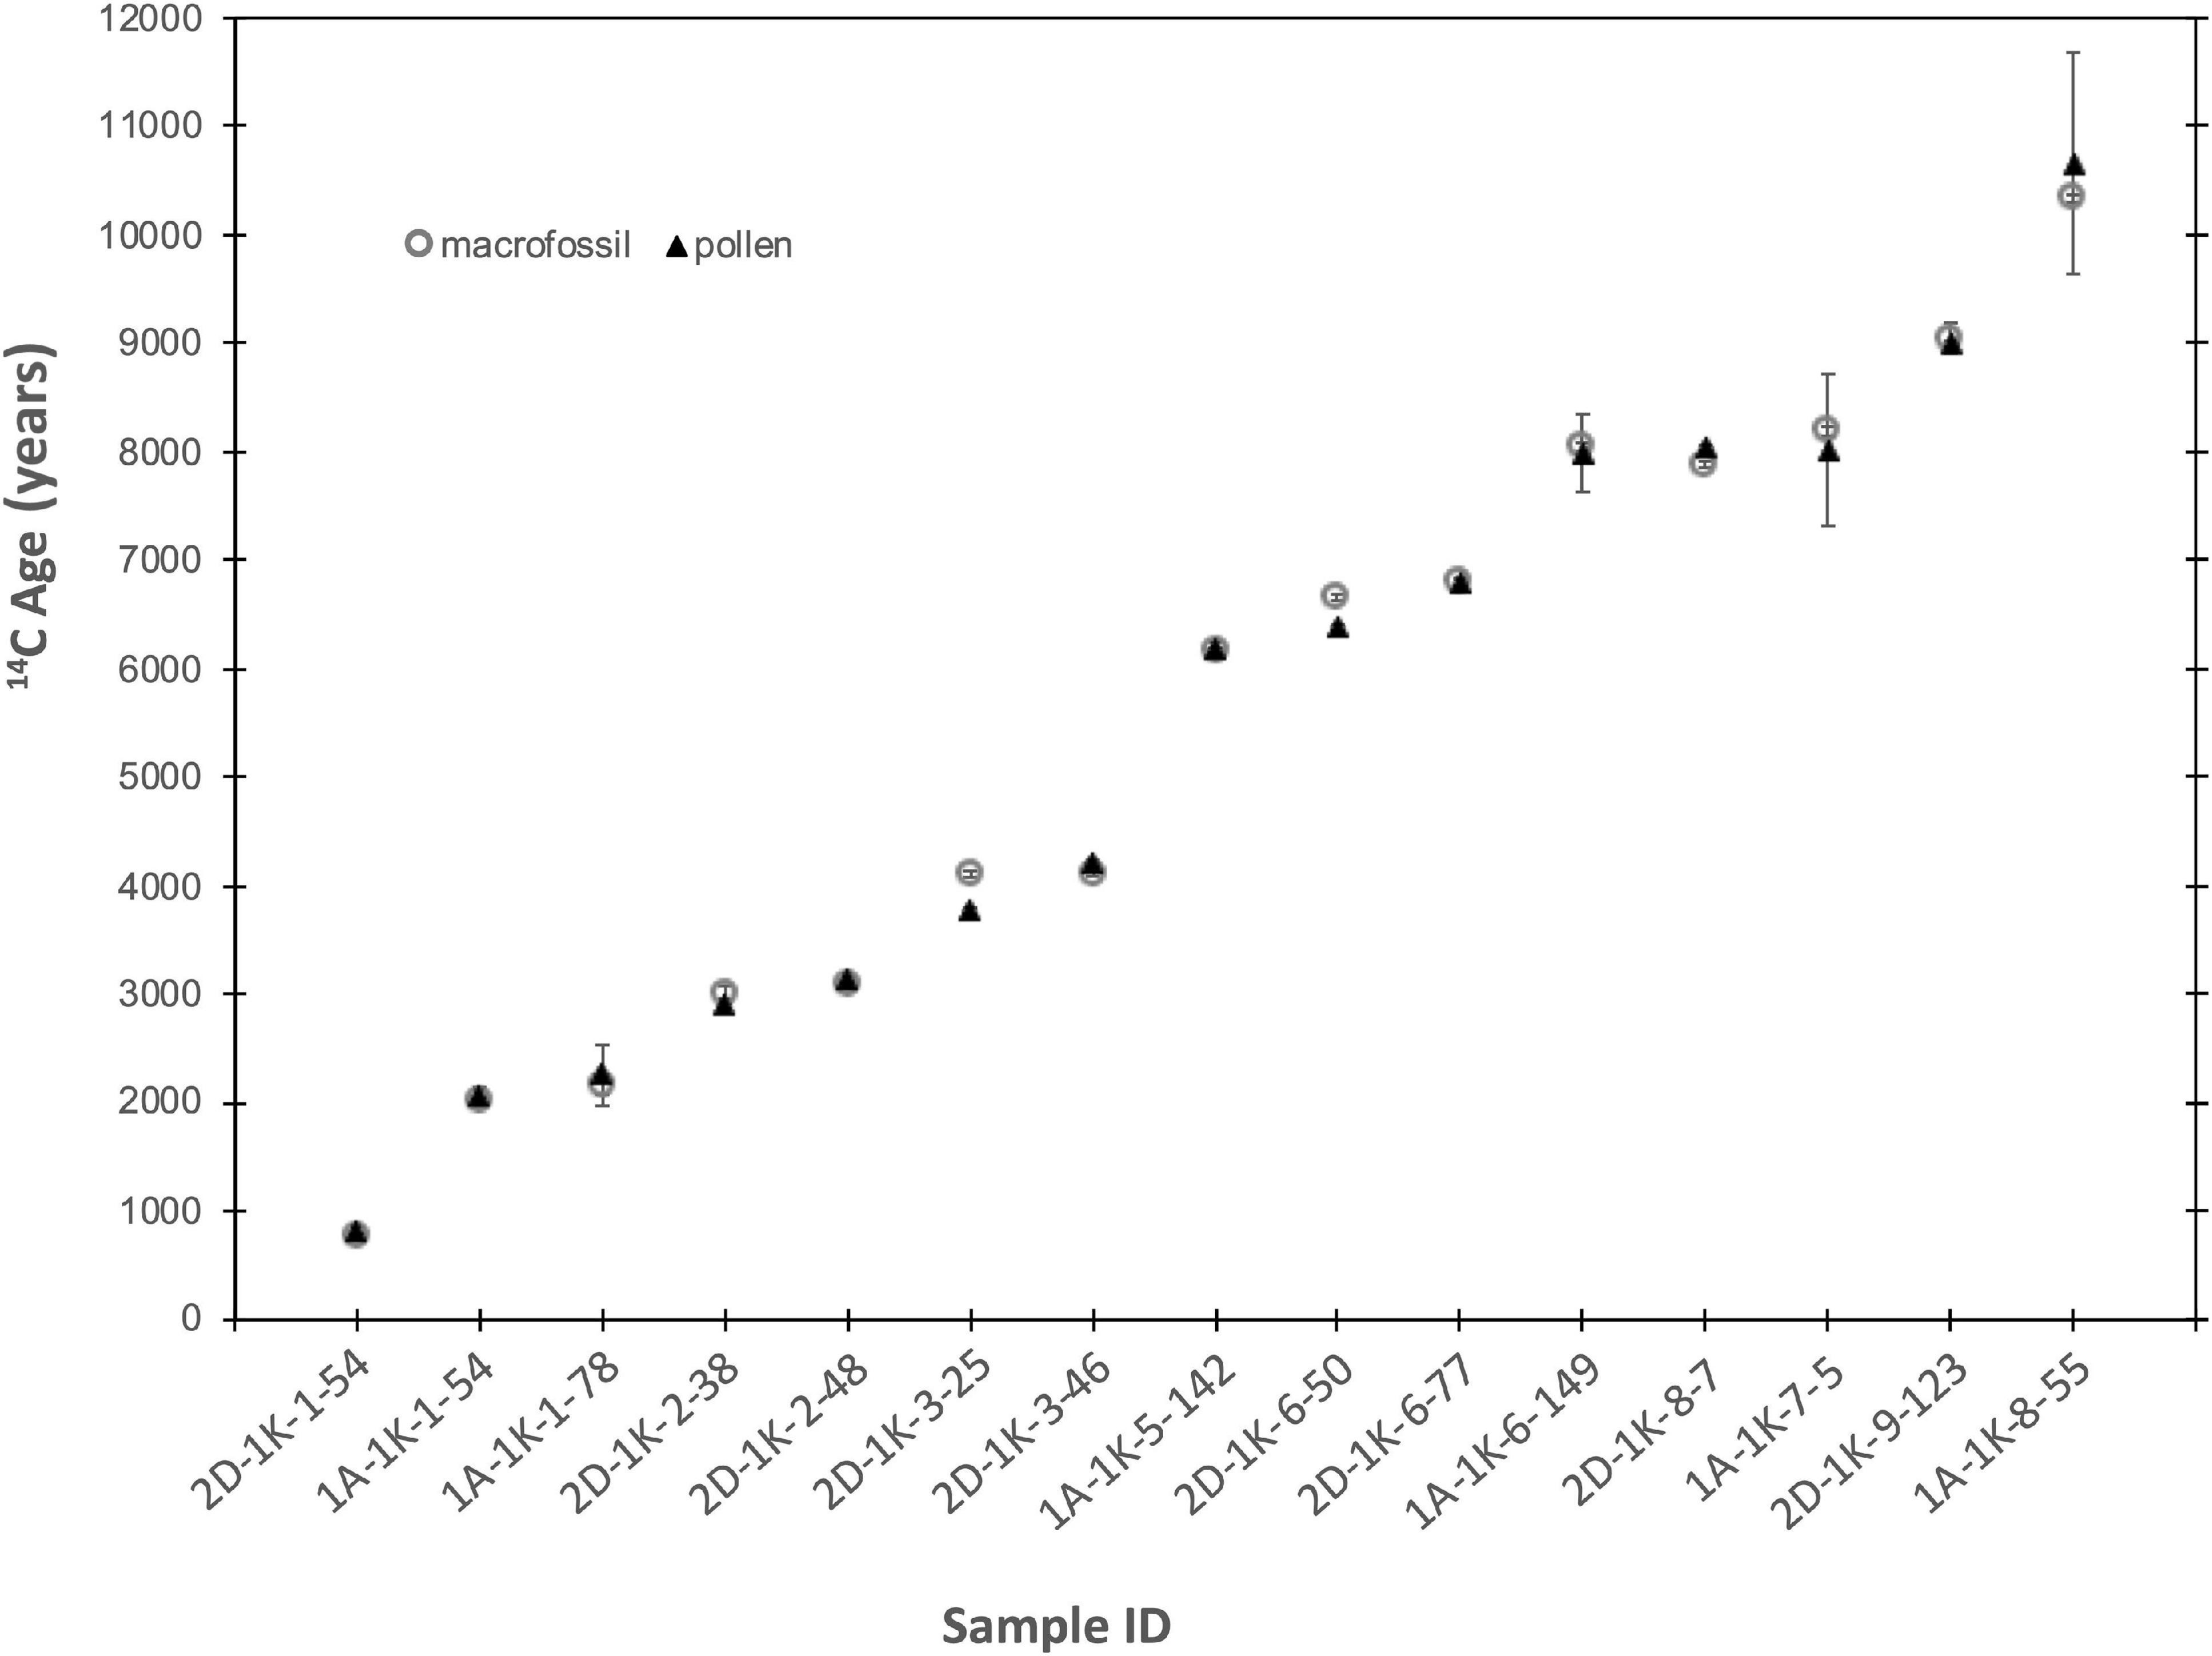
Figure 6. Comparison between macrofossil and pollen dates from FLL sediment core. Samples names refer to the core section and the section depth of the sample.
Conclusion
In the absence of sufficient macrofossils for radiocarbon dating in sediment cores, purified pollen represents a potentially valuable source for obtaining a reliable and high-resolution chronology based on radiocarbon measurements. Completely isolating enough pollen grains in order to have enough carbon for the AMS measurements is the dominant challenge, along with preventing adsorption or addition of carbon during the processing. The method for extraction and concentration of pollen that we present here demonstrates that pine pollen can be successfully and reliably extracted, purified and dated from widely varying sediment types.
Pollen concentrations may vary along the cores; thus, having additional information on the type of pollen and characteristics of the sediments can be important for improving the efficiency and the timing of the extraction and sorting method. Pollen concentration in the sediments depends on the characteristics of the sediments and lake basin, and the grain size, organic matter type and concentration, and carbonate content directly impact the variations required to execute the entire process successfully. If available, a pollen analysis is extremely helpful in identifying the dominant pollen type and the amount of raw sediment required to provide sufficient pollen for dating. Further, the dominant pollen type will determine the size of the meshes to be used during the sieving process, in particular during the last sieving step in which the smaller particles are discarded before the cytometric sorting.
The content of organic matter/humic acid and carbonates affects the number of KOH rises and the duration of the HCl treatment for each sample. Organic-rich sediments may require several rinses with KOH that should be performed until the supernatant appears light-yellowish colored. Carbonate-rich sediments may require a prolonged or multiple HCl treatments, based on the observation of the reaction of the samples to the chemicals.
Reducing the potential carbon contamination is crucial for the reliability of the AMS measurements; thus, it is important to identify and limit the potential sources of carbon contamination. In this context, it is recommended to store the KOH in a bottle with a tight lid and store the solution for no longer than a month to reduce the absorption of modern carbon from the atmosphere. After that time, the solution should be discarded, and a fresh bottle prepared. For the same reason, performing the HCl treatment after KOH without a rinse between is highly recommended. A low-carbon heavy liquid is required to prevent contamination related to the presence of carbon in the chemical. Although somewhat expensive, the heavy liquid and the nylon meshes should be disposed of and not reused for multiple samples.
Limiting the loss of pollen grains after the sorting is crucial to having the largest sample possible. Checking the discarded solutions after the sieving steps and the SPT is highly recommended to assure that the pollen has been isolated in the desired fraction. These checks should be included in the preparation whenever sediment from a new site or time period is being prepared, as the types of pollen may be quite different, and when new chemical or physical methods are introduced into an established protocol. Shipping the samples frozen and letting the samples thaw upright reduces the chance of pollen grains being lost in the vial. In addition, settling after thawing reduce the chances of losing pollen grains before the graphitization.
Excellent agreement between purified pollen dates and macrofossils from the Holocene section of Fallen Leaf Lake shows that pollen dates can be used, at least in some cases, interchangeably and confidently with macrofossil dates. Overall, the method of separating pollen for AMS dating presented here shows that pollen can be reliably separated from a wide variety of lacustrine and surface samples, the first step toward using pollen radiocarbon dates for building high-resolution chronologies for lake-sediment records.
Outlook for the Future
Although we have successfully applied the method and variations presented here on a wide variety of sediment types and demonstrated fidelity between pollen and macrofossil dates at Fallen Leaf Lake, additional work remains to establish purified pollen dating as a routine technique.
First, pollen materials of known age need to be established to monitor for addition of modern and radiocarbon-dead carbon during the processing of pollen, as has been done for wood, shell, bone and other materials. While most labs or investigators should be able to establish a modern pollen reference material by sampling modern vegetation of a relevant type, the development of a radiocarbon-dead pollen material to monitor for addition of modern carbon is more difficult. The ideal pollen must be unequivocally too old to contain original radiocarbon; no more difficult to separate from the geological matrix than most samples of interest; and available in large enough quantities that it can be measured routinely for many years. The first two qualifications were met by ∼90 ka pollen prepared as background by Howarth et al. (2013), but the restricted amount available in a core is less than ideal.
We have focused on pine pollen in this study because it is large and abundant in our study area, but additional work must be done to establish working parameters for deposits dominated by other types of pollen. The size and shape of different pollen types will require different mesh sizes, and affect the number of grains needed to successfully date a sample. Whereas for pine grains we found that 40,000–50,000 grains were ample for a radiocarbon date, for smaller pollen types (e.g., Betula, Alnus, Quercus) the work of Tennant et al. (2013) suggests that an order of magnitude more grains may be necessary to achieve the amount of carbon measured on the FLL samples in this study. In the case of the smaller pollen grains, a sorter such as the Aria II instrument used by Tennant et al. (2013) and also available in the core facility at IUB is more suitable.
Additional testing of the parameters used for gating the events on the flow cytometer is needed to find if different pollen fractions can be separated by the cytometer. For example, Tennant et al. (2013) demonstrated the gate locations of different genera of pollen sorted on the Aria II, but the samples used were modern pollen collected separately; thus far, this separation has not been demonstrated on sediment samples. This would be extremely useful in situations where the sources of material to the pollen fraction are variable, such as where erosion supplies materials with differential preservation in soils (Howarth et al., 2013), and from distinct assemblages from the surrounding watershed (Nambudiri et al., 1980). Perhaps more difficult, but equally useful in some situations, would be the ability to distinguish reworked pollen of the same type as the dominant type, such as pine grains that are torn, crumpled, or otherwise degraded by reworking from an older deposit.
Further, if the application of pollen dating to development of chronologies is to become available to interested paleo scientists, good three-way communication is necessary to successfully move samples from raw mud to a radiocarbon measurement. At least in the United States, flow cytometers tend to be housed in university core facilities that accept outside samples, and are operated by cytometry experts. As the number of AMS facilities and flow cytometry facilities is relatively small compared to the number of chemical laboratories able to chemically concentrate pollen, it seems likely that a key relationship can be established between those two facilities, streamlining the process for investigators wanting to apply pollen dating to their studies.
Finally, as pollen dating is applied more widely, there will be a need to explore the occurrence of pollen in many different kinds of lake systems. While some lakes may present relatively simple results (e.g., Tennant et al., 2013 and the FLL results in Figure 6), in other lakes complications may arise that are specific to the dynamics in that particular basin. Basins where regression has exposed old lake sediments (Zimmerman et al., 2018), where deep soils develop and are periodically eroded into the lake (Howarth et al., 2013); and where the potential for unusual carbon dynamics exists (Schiller et al., 2021) demonstrate the need to understand each lake basin as an individual, until enough lakes have been characterized to understand the variety of locations where pollen dating is likely to be successful.
Data Availability Statement
The raw data supporting the conclusions of this article are presented in the tables included in the published article.
Author Contributions
SZ and TB designed the study and secured the funding. IT and SZ did the field and core sampling. IT performed the pollen extraction, pretreatment, and graphitization with assistance from SZ and TB. CH performed the flow cytometry sorting in consultation with IT and SZ and contributed to analysis of the flow cytometry data. IT, TB, and SZ analyzed the data. All authors contributed to the writing of the manuscript and approved the submitted version.
Funding
This work was performed under the auspices of the U.S. Department of Energy by Lawrence Livermore National Laboratory under contract DE-AC52-07NA27344. This work was supported by the LLNL LDRD grant 17-ERD- 052. Contribution: LLNL-JRNL-790160.
Conflict of Interest
The authors declare that the research was conducted in the absence of any commercial or financial relationships that could be construed as a potential conflict of interest.
Acknowledgments
We thank Paula Noble for providing the samples from Fallen Leaf Lake core; Kimber Moreland for the help in developing the map with the three different site locations; Alexandra Hedgpeth, Bruce Buchholz, and Tom Guilderson for the support during the lab work; Dave Marquart (Mono Lake Tufa Natural Reserve) for providing information and helping with permits for field work.
References
Barss, M. S., and Williams, G. L. (1973). Palynology and Nannofossil Processing Techniques. Geological Survey of Canada, Paper, Vol. 73. Ottawa, Ont: Department of Energy, Mines and Resources, 1–26. doi: 10.4095/102534
Blaauw, M., Christen, J. A., Bennett, K. D., and Reimer, P. J. (2018). Double the dates and go for Bayes – Impacts of model choice, dating density and quality on chronologies. Quat. Sci. Rev. 188, 58–66. doi: 10.1016/j.quascirev.2018.03.032
Brown, T. A., Farwell, G. W., Grootes, P. M., and Schmidt, F. H. (1992). Radiocarbon AMS dating of pollen extracted from peat samples. Radiocarbon 34, 550–556. doi: 10.1017/S0033822200063815
Brown, T. A., Nelson, D. E., Mathewes, R. W., Vogel, J. S., and Southon, J. R. (1989). Radiocarbon dating of pollen by accelerator mass spectrometry. Quat. Res. 32, 205–212. doi: 10.1016/0033-5894(89)90076-8
Brown, T. A., and Southon, J. R. (1997). Corrections for contamination background in AMS 14C measurements. Nucl. Instrum. Methods Phys. Res. B 123, 208–213. doi: 10.1016/S0168-583X(96)00676-3
Byrne, R., Park, J., Ingram, L., and Hung, T. (2003). “Cytometric sorting of Pinaceae pollen and its implications for radiocarbon dating and stable isotope analyses,” in Paper Presented at the 20th Annual Pacific Climate Workshop, Asilomar, CA.
Davis, O. K. (1999). Pollen analysis of a late-glacial and Holocene sediment core from Mono Lake, Mono County, California. Quat. Res. 52, 243–249. doi: 10.1006/qres.1999.2063
Faegri, K., and Iversen, J. (1985). Textbook of Pollen Analysis, 4th Edn. New York, NY: Hafner Press.
Fletcher, W. J., Zielhofer, C., Mischke, S., and Bryant, C. Xu, X., and Fink, D. (2017). AMS radiocarbon dating of pollen concentrates in a karstic lake system. Quat. Geochronol. 39, 112–123. doi: 10.1016/j.quageo.2017.02.006
Hodelka, B. N., McGlue, M. M., Zimmerman, S., Ali, G., and Tunno, I. (2020). Paleoproduction and environmental change at Mono Lake (eastern Sierra Nevada) during the Pleistocene-Holocene transition. Palaeogeogr. Palaeoclimatol. Palaeoecol. 543:109565. doi: 10.1016/j.palaeo.2019.109565
Howarth, J. D., Fitzsimons, S. J., Jacobsen, G. E., Vandergoes, M. J., and Norris, R. J. (2013). Identifying a reliable target fraction for radiocarbon dating sedimentary records from lakes. Quat. Geochronol. 17, 68–80. doi: 10.1016/j.quageo.2013.02.001
Kilian, M. R., van der Plicht, J., van Geel, B., and Goslar, T. (2002). Problematic 14C-AMS dates of pollen concentrates from Lake Gosciaz (Poland). Quat. Int. 88, 21–26. doi: 10.1016/S1040-6182(01)00070-2
Kleppe, J., Brothers, D. S., Kent, G. M., Biondi, F., Jensen, S., and Driscoll, N. W. (2011). Duration and severity of Medieval drought in the Lake Tahoe Basin. Quat. Sci. Rev. 30, 3269–3279. doi: 10.1016/j.quascirev.2011.08.015
Long, A., Davis, O. K., and DeLanois, J. (1992). Separation and 14C dating of pure pollen from lake sediments: nano fossil AMS dating. Radiocarbon 34, 557–560. doi: 10.1017/S0033822200063827
Maloney, J. M., Noble, P. J., Driscoll, N. W., Kent, G. M., Smith, S. B., Schmauder, G. C., et al. (2013). Paleoseismic history of the Fallen Leaf segment of the West Tahoe-Dollar Point fault reconstructed from slide deposits in the Lake Tahoe Basin, California-Nevada. Geosphere 9, 1065–1090. doi: 10.1130/GES00877.1
Mensing, A. M., and Southon, J. R. (1999). A simple method to separate pollen for AMS radiocarbon dating and its application to lacustrine and marine sediments. Radiocarbon 41, 1–8. doi: 10.1017/S0033822200019287
Munsterman, D., and Kerstholt, S. (1996). Sodium polytungstate, a new non-toxic alternative to bromoform in heavy liquid separation. Rev. Palaeobot. Palynol. 91, 417–422. doi: 10.1016/0034-6667(95)00093-3
Nambudiri, E. M. V., Teller, J. T., and Last, W. M. (1980). Pre-quaternary microfossils – a guide to errors in radiocarbon dating. Geology 8, 123–126. doi: 10.1130/0091-7613(1980)8<123:PMGTEI>2.0.CO;2
Newnham, R. M., Vandergoes, M. J., Garnett, M. H., Lowe, D. J., Prior, C., and Almond, P. C. (2006). Test of AMS 14C dating of pollen concentrates using tephrochronology. J. Quat. Sci. 22, 37–51. doi: 10.1002/jqs.1016
Noble, P. J., Ball, G. I., Zimmerman, S. H., Maloney, J., Smith, S. B., Kent, G., et al. (2016). Holocene paleoclimate history of Fallen Leaf Lake, CA., from geochemistry and sedimentology of well–dated sediment cores. Quat. Sci. Rev. 131, 193–210. doi: 10.1016/j.quascirev.2015.10.037
Noble, P. J., Chandra, S., and Kreamer, D. K. (2013). Dynamics of phytoplankton distribution in relation to stratification and winter precipitation, Fallen Leaf Lake, California. West. N. Am. Nat. 73, 302–322. doi: 10.3398/064.073.0301
Piotrowska, N., Bluszcz, A., Demske, D., Granoszewski, W., and Heumann, G. (2004). Extraction and AMS radiocarbon dating of pollen from Lake Baikal sediments. Radiocarbon 46, 181–187. doi: 10.1017/S0033822200039503
Regnéll, J., and Everitt, E. (1996). Preparative centrifugation – a new method for preparing pollen concentrates suitable for radiocarbon dating by AMS. Veg. Hist. Archeobot. 5, 201–205. doi: 10.1007/BF00217497
Schiller, C. M., Whitlock, C., Elder, K. L., Iverson, N. A., and Abbott, M. B. (2021). Erroneously old radiocarbon ages from terrestrial pollen concentrates in Yellowstone Lake, Wyoming, USA. Radiocarbon 63, 321–342. doi: 10.1017/RDC.2020.118
Tennant, R. K., Jones, R. T., Brock, F., Cook, C., Turney, C. S. M., Love, J., et al. (2013). A new flow cytometry method enabling rapid purification of fossil pollen from terrestrial sediments for AMS radiocarbon dating. J. Quat. Sci. 28, 229–236. doi: 10.1002/jqs.2606
Vandergoes, M. J., and Prior, C. A. (2003). AMS dating of pollen concentrates – a methodological study of late Quaternary sediments from south Westland, New Zealand. Radiocarbon 45, 479–491. doi: 10.1017/S0033822200032823
Vogel, J. S., Nelson, D. E., and Southon, J. R. (1987). 14C background levels in an accelerator mass spectrometry system. Radiocarbon 29, 323–333. doi: 10.1017/S0033822200043733
Vogel, J. S., Southon, J. R., Nelson, D. E., and Brown, T. A. (1984). Performance of catalytically condensed carbon for use in accelerator mass spectrometry. Nucl. Instrum. Methods Phys. Res. B 5, 289–293. doi: 10.1016/0168-583X(84)90529-9
Zimmerman, S. R. H., Brown, T. A., Hassel, C. A., and Heck, J. (2018). Testing pollen sorted by flow cytometry as the basis for high-resolution lacustrine chronologies. Radiocarbon 61, 359–374. doi: 10.1017/RDC.2018.89
Zimmerman, S. R. H., Hemming, S. R., Hemming, N. G., Tomascak, P. B., and Pearl, C. (2011). High-resolution chemostratigraphic record of late Pleistocene lake-level variability, Mono Lake, California. Geol. Soc. Am. Bull. 123, 2320–2334. doi: 10.1130/B30377.1
Zimmerman, S. R. H., Hemming, S. R., and Starratt, S. W. (2020). “Holocene sedimentary architecture and paleoclimate variability at Mono Lake, California,” in From Saline to Freshwater: The Diversity of Western Lakes in Space and Time. Geological Society of America Special Paper, Vol. 536, eds S. W. Starratt and M. R. Rose (Boulder, CO: Geological Society of America). doi: 10.1130/2020.2536(19)
Keywords: radiocarbon, AMS, pollen separation, flow cytometry, high-resolution chronology, lake sediment, Sierra Nevada
Citation: Tunno I, Zimmerman SRH, Brown TA and Hassel CA (2021) An Improved Method for Extracting, Sorting, and AMS Dating of Pollen Concentrates From Lake Sediment. Front. Ecol. Evol. 9:668676. doi: 10.3389/fevo.2021.668676
Received: 16 February 2021; Accepted: 28 April 2021;
Published: 25 May 2021.
Edited by:
Scott Andrew Mensing, University of Nevada, United StatesReviewed by:
Brendan Culleton, Pennsylvania State University (PSU), United StatesJohn Southon, University of California, Irvine, United States
Thomas A. Minckley, University of Wyoming, United States
Copyright © 2021 Tunno, Zimmerman, Brown and Hassel. This is an open-access article distributed under the terms of the Creative Commons Attribution License (CC BY). The use, distribution or reproduction in other forums is permitted, provided the original author(s) and the copyright owner(s) are credited and that the original publication in this journal is cited, in accordance with accepted academic practice. No use, distribution or reproduction is permitted which does not comply with these terms.
*Correspondence: Irene Tunno, dHVubm8xQGxsbmwuZ292