 Jeffrey M. DaCosta
 Michael D. Sorenson
- 1Department of Biology, Boston University, Boston, MA, United States
- 2Biology Department, Boston College, Chestnut Hill, MA, United States
Indigobirds (Vidua spp.) are obligate brood parasites in which imprinting on heterospecific hosts shapes adult vocal behavior and mating preferences. Adult male indigobirds mimic the songs and other vocalizations of their respective hosts, which signals their own host environment to prospective mates and has important implications for speciation. In this study, we examined variation within and among indigobird species in the non-mimetic components of their vocal behavior, including both chatter calls and their impressive repertoires of intricate non-mimicry songs. We test whether indigobird species in Tanzania (V. chalybeata, V. codringtoni, V. funerea, and V. purpurascens) differ consistently in general features of their non-mimetic vocalizations, and we test whether local ecological conditions influence vocal behavior. Indigobird non-mimetic song repertories are learned from and shared with other males of the same species. We find that local dialect “neighborhoods” are variable in size among species and regions, depending on habitat continuity and the distribution of male territories. Despite the complete turnover of the specific songs comprising non-mimicry song repertoires from one local dialect to the next, we find significant species effects for more general measures of non-mimicry songs such as repertoire size and diversity, frequency, song length, and pace. For some traits, we also found significant regional differences, which may be mediated by significant relationships between elevation and morphometrics. Chatter calls were broadly similar across both species and localities, but we found significant species and region effects for frequency and to a lesser extent pace. We discuss the possibility that learning and mimicking the vocalizations of different hosts might influence the production of non-mimetic vocalizations and explain many of the species differences we detected. Whether these species differences are purely due to phenotypic plasticity or also reflect genetic divergence in traits influencing sound production and/or female preferences, they may contribute to reproductive isolation among nascent and recently evolved indigobird species.
Introduction
Songbirds (suborder Passeri) comprise a radiation of ca. 4,000 species with a remarkable diversity of morphological, ecological, and behavioral traits. As their name implies, songbirds are best known for their impressive diversity of songs, which are acquired through imitation during development (age-limited learners) or throughout their lifespan (open-ended learners) (Brenowitz and Beecher, 2005). Songbirds vary widely in both the size of their vocal repertoires and in the frequency and temporal features of song elements. Sexual selection is often hypothesized as an important driver of repertoire size (Eens et al., 1991; MacDougall-Shackleton, 1997; but see Byers and Kroodsma, 2009), whereas song traits (e.g., length and number of notes, frequency, modulation) can be shaped by numerous, non-mutually exclusive factors, including selection for optimal transmission through different physical environments (Morton, 1975; Nottebohm, 1985; Badyaev and Leaf, 1997), diversifying selection to enhance species recognition (Miller, 1982; Seddon, 2005), and as a by-product of selection on morphological traits (Podos, 2001; Huber and Podos, 2006). Adding to the overall diversity of songbird vocalizations, many species display geographic variation. If there are relatively sharp boundaries among conspecific populations with different song characteristics, these populations are recognized as having different dialects (Marler and Tamura, 1962). The formation, evolution, and maintenance of dialects can be shaped by selection on the songs themselves, the indirect effects of other evolutionary processes, and/or cultural evolution and drift, which depend on both the song learning and dispersal characteristics of a given species (Slabbekoorn and Smith, 2002; Podos and Warren, 2007).
Indigobirds (Vidua spp.) are obligate brood parasites that acquire part of their vocal repertoire through imprinting on their respective host species. Most of the ten recognized indigobird species are associated with one of the Lagonosticta firefinches, which have small repertoires of ca. 5–10 songs, alarm calls, and begging calls (Payne, 1973), but a few indigobird species are associated with more than one host and/or a host in another estrildid finch genus (e.g., Payne et al., 2005). Indigobirds imprint on host songs and calls during development, and adult males incorporate mimicry of host vocalizations into their singing (Nicolai, 1964; Payne, 1973; Payne et al., 1998), thereby advertising their success in having been reared by a particular host species. This serves as an important mate choice cue for females, in which imprinting on host vocalizations appears to guide both mate choice and the selection of nests to parasitize (Payne et al., 2000). These behaviors result in pre-mating reproductive isolation among indigobirds associated with different host species, with important implications for speciation and host-specific adaptation (Payne, 1973; Sorenson et al., 2003; Jamie et al., 2020).
While learning and mimicry of host songs has long been viewed as key to the establishment of behavioral/cultural reproductive isolation and therefore speciation in indigobirds, the non-mimetic components of indigobird vocal behavior have received less attention. All indigobird species produce similar “chatter” calls comprising rapid sequences of broadband notes (Payne, 1973). Chatters are most often associated with “comfort” behaviors like preening and bill wiping, but are also heard at the beginning of singing bouts, during flight, and when chasing other males (Payne, 1979). Qualitatively similar across species, chatter calls may serve as a general “password” (sensu Hauber et al., 2001) for the recognition of other male indigobirds (i.e., to discriminate indigobirds from non-indigobirds), but this has not been tested experimentally.
The vocal repertoires of male indigobirds also include ca. 10–20 distinctly different non-mimicry (NM) songs (Payne, 1973), each comprising a complex series of notes delivered in a highly consistent manner. Males advertising their territories alternate between NM songs and host song mimicry (Payne, 1973, 1979). There is clear evidence that indigobird males learn these complex NM songs from each other (Payne, 1985; Payne et al., 1998). As a consequence, neighboring males of the same indigobird species share broadly overlapping repertoires of NM songs, but the extent of overlap between conspecific males is negatively correlated with the geographic distance between their call sites, resulting in a complete turnover of NM song dialect “neighborhoods” across the landscape (Payne, 1973, 1985, 1987). However, the size of dialect neighborhoods, and possible interspecific variation in neighborhood size, has not been well studied. Indigobirds are also open-ended song learners, such that their song repertoires can change over time. Adult males have been observed copying the songs of neighbors that are frequently visited by females, or acquiring a completely new repertoire after dispersing outside of their original dialect neighborhood (Payne, 1985). Thus, the songs within a dialect neighborhood evolve over time, with new songs introduced by errors and/or innovation spreading via cultural transmission (Payne, 1973, 1985). Crucially, sympatric indigobird species have entirely non-overlapping repertoires of NM songs, indicating that males learn only from other males associated with the same host. Thus, dispersing males acquire songs only from conspecific males and can subsequently attract conspecific mates. This suggests that juvenile males discriminate among adult males based on their mimicry of different hosts and choose as tutors older male indigobirds that mimic the same host species that raised them.
The multifaceted vocal repertoire of each male indigobird thus contains three elements — chatter, mimicry of host songs and other vocalizations, and a complex repertoire of NM songs — that respectively convey its identity as an indigobird, its host association, and its membership in a local indigobird dialect neighborhood. It is important to note that indigobird species are also distinguished by evolved differences in adult male plumage and soft parts colors, and in the mimetic mouth markings of nestlings (Payne, 1973, 2005; Sorenson et al., 2003; Jamie et al., 2020), traits that clearly have a genetic basis. Thus, indigobird species may have evolved consistent differences in certain general features of their chatter calls and/or NM songs (e.g., frequency and/or temporal traits) even though the specific sequences of notes characterizing unique NM songs are not shared among allopatric populations of the same species. A consistent species difference in frequency, for example, might reflect the indirect effects of ecological selection on bill and body size or direct selection on effective signal transmission in different environments. Alternatively, differences between species may be attributable to males being raised in different host nest environments.
To date, there has been limited analysis of variation in chatter calls or in the general characteristics of NM songs among indigobird species. Payne (1973) measured the overall length of chatter calls and the number of chatter syllables per second in five species (1–8 localities per species), and found that all species occupy the same range of variation. Payne (1973) also measured the length, number of syllables, maximum frequency, and minimum frequency of NM songs in three species (3 localities per species), and similarly concluded that indigobird species are broadly similar in these measures. This result was not evaluated statistically, however, and a more rigorous analysis could provide greater insight into potential divergence in vocal behavior.
To further investigate the evolution of indigobird non-mimetic vocalizations and their potential role in speciation, we used population-level sampling and appropriate statistical methods to analyze intra- and interspecific variation in the chatter calls and NM songs of four indigobird species in Tanzania. Our sampling allowed more robust measurements of NM song dialect neighborhood size than in previous studies, and allowed us to test whether variation in chatter and NM song traits is better explained by species identity (and therefore host association) or sampling locality. If species identity better explains variation in these traits then there may be evolved differences in vocal behavior among species, or vocalizations may be shaped by plastic responses to different developmental environments (i.e., being reared by different host species). Conversely, if locality is the best predictor of vocal characteristics, then local ecological adaptation and/or phenotypic plasticity in response to local environmental conditions may affect the different species in a given region similarly. Our results find support for both effects in different aspects of vocal behavior.
Materials and Methods
Study Sites and Sampling
Fieldwork was conducted in the United Republic of Tanzania during April and May of 2008 and 2009. Four species of indigobirds occur in Tanzania (V. chalybeata, V. codringtoni, V. funerea, and V. purpurascens), with two morphologically distinct subspecies of V. chalybeata distributed in the interior central plateau (V. c. centralis) and “coastal” lowlands (V. c. amauropteryx) (Payne et al., 1992). Singing male indigobirds (n = 114) were recorded for ca. 20 min and then captured using song playback at sites within three political regions: Iringa, Morogoro, and Ruvuma (Figure 1 and Table 1). Since local ecology can affect body size (Ashton, 2002), and thus vocal attributes (see citations below), Table 2 summarizes the average elevation of call sites as well as temperature and precipitation during the breeding season (April–June) for each of these regions. Standard morphological measurements (see below) were taken for each male. Vidua funerea and V. purpurascens cannot be reliably discriminated based on morphology (i.e., plumage and soft parts colors and morphometrics are all similar) in this part of East Africa, but can be differentiated by their mimicry of the unique songs of their respective hosts. Therefore, for the analyses presented here, individual males were assigned to species based on their host mimicry (i.e., host association).
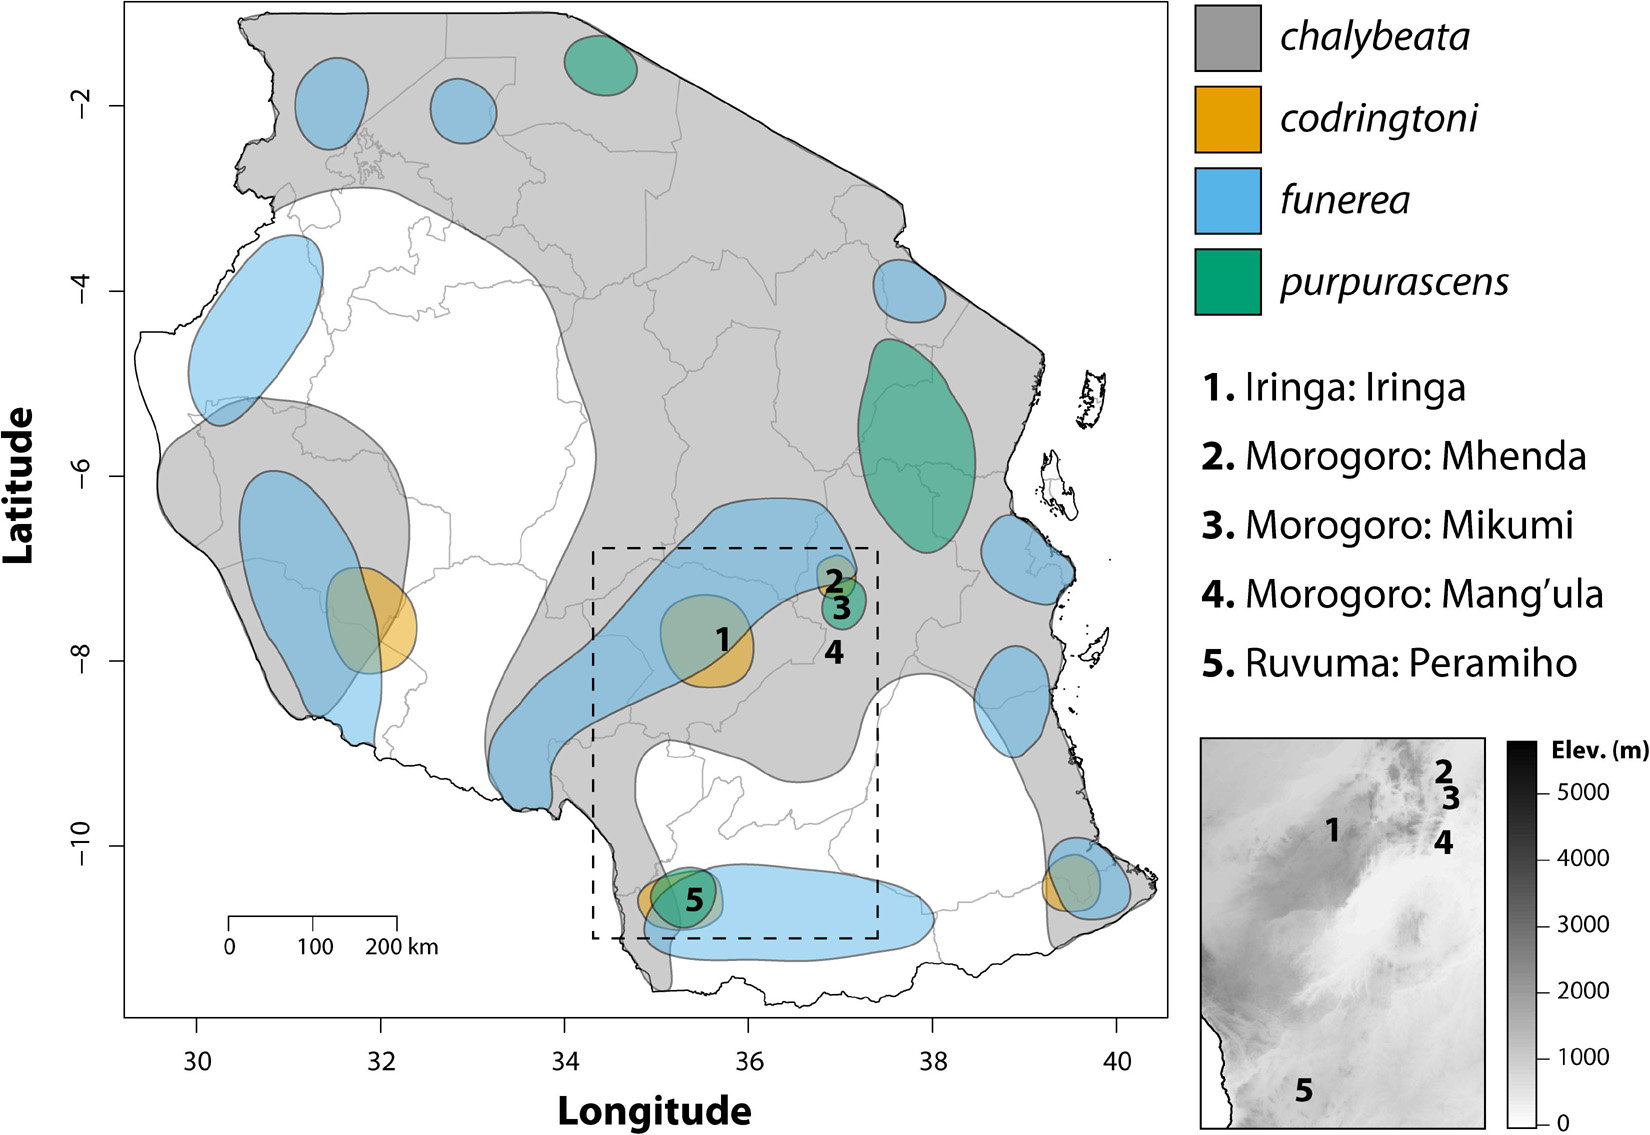
Figure 1. Map showing the geographic distributions of the four indigobird study species in Tanzania adapted from Payne (2010). Numbers indicate sampling localities, interior gray lines show the boundaries of political regions, and the dashed box shows the location of the inset elevation map.
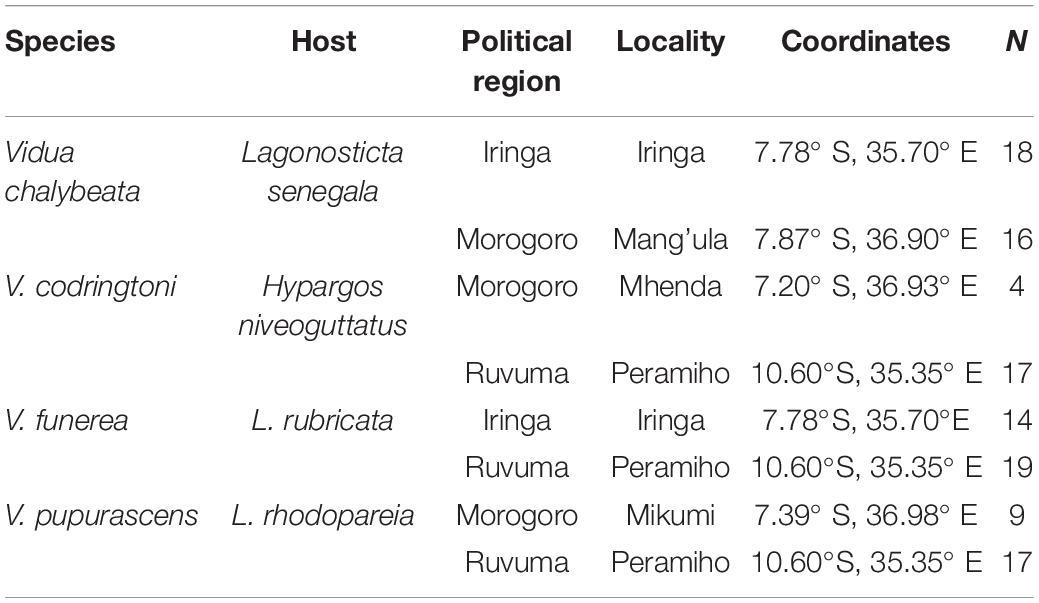
Table 1. Locality and sampling information (N = number of recorded males).
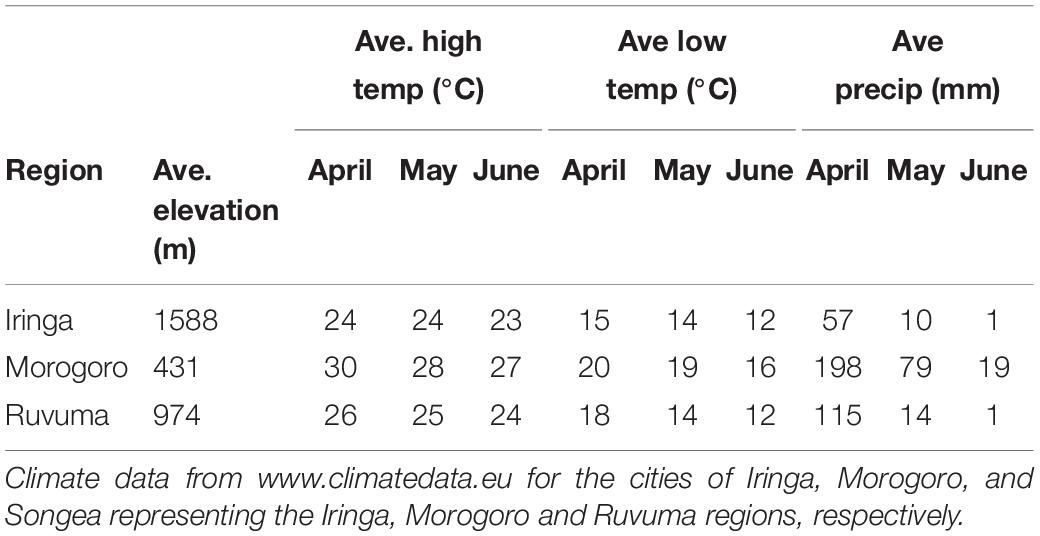
Table 2. Elevation, temperature, and precipitation data for sampled regions during the indigobird breeding season.
Sharing of Non-mimicry Song Repertoires
The negative correlation between the extent of overlap in NM song repertoires between conspecific male indigobirds and geographic distance between their call sites has been quantified only for V. chalybeata (Payne, 1973, 1985), We tested the generality of this relationship by correlating geographic distance and repertoire sharing between all pairs of conspecifics within each political region. The latitude-longitude of each call site was recorded with a Garmin eTrex global positioning system (GPS), and the distances among call sites were calculated using the earth.dist function (fossil package) in R v41. Song recordings for all individuals were visualized using Raven Pro v1.3 (Charif et al., 2008), and the first 100 NM songs were assigned to a song type (song type 1, 2, and 3, etc.) based on the different order and composition of syllables. NM songs are strikingly different from the clear whistles and calls of host species vocalizations that are well cataloged (see Payne, 1996), and each NM song is repeated in essentially identical form over the course of months not only by an individual male but also neighboring males that share the same songs (Payne, 1973). A sample of 100 songs is adequate to detect most or all of the distinct songs in each individual’s repertoire (Payne, 1973; DaCosta, personal observation). Songs of nearly identical composition but with minor differences (e.g., a different number of introductory chatters or omission of a terminal note) were assigned to the same song type. Within each region, the similarity of NM song repertoires for each pair of conspecifics was quantified using the Jaccard index (Jaccard, 1901):
where, the index Jij varies from 0 to 1, Sij is the number of shared song types, and Ri and Rj is the repertoire size of individuals i and j, respectively.
Body Size, Bill Size, and Call Site Elevation Measurements
The size and shape of a bird’s body and bill affect its production of sound, and the evolution of these morphological traits can impose constraints on the frequency and pace of notes (Ryan and Brenowitz, 1985; Podos, 2001; Bertelli and Tubaro, 2002; Huber and Podos, 2006; Gillooly and Ophir, 2010). Body size may also be a sexually selected trait that indicates individual quality (Andersson and Iwasa, 1996), and in some birds it is positively correlated with repertoire size (Kipper et al., 2006; Hesler et al., 2012). We therefore measured body and bill size attributes of each individual and tested whether morphology significantly explains variation in NM song characteristics and repertoire size (see below). For each individual, JMD measured mass, wing length, tail length, tarsus length, bill length, bill width, and bill depth. Since many of these variables were correlated they were collapsed using a principal component analysis (PCA) in R (prcomp function).
Song characteristics may also vary with habitat if signals are optimized for transmission in the local acoustic environment (Morton, 1975; Nottebohm, 1985; Badyaev and Leaf, 1997). Indigobird males perch and sing at or near the tops of trees in relatively open habitats, so we did not measure structural aspects of the vegetation at each territory, but did record elevation above sea level for each call site using a GPS. Elevation, which is correlated with temperature and precipitation in Tanzania (Table 2), was used as a proxy for ecological differences among regions.
Measurements for Non-mimicry Songs and Chatter Calls
Non-mimicry songs were visualized and measured in Raven Pro. The first 100 NM songs recorded from each individual were assigned to a song type based on syllable composition (see above). The repertoire size of each male was calculated as the number of distinct song types observed in this sample (see Supplementary Figure 1 for an example). The repertoire diversity of each male was quantified using the Shannon-Wiener index (Shannon, 1948; Wiener, 1948):
where, s is the number of distinct song types and pi is the proportion of the ith song type in the sample. We subsampled 25 NM songs (every fourth song) for analyses of song characteristics. Introductory chatter notes often precede NM songs, and were included in song measurements only if they were found in every occurrence of a particular song type. For each song in the subsample, we applied a filter to remove low and high frequency background noise (below 500 and above 12,000 kHz, respectively) and then measured center frequency (the frequency that divides the song into two intervals of equal energy), maximum frequency (the frequency of highest energy), overall song length (in seconds), number of syllables, and pace (number of syllables per second). For each variable, measurements from the 25 songs were averaged to generate a single measurement of these traits for each individual. Some of these variables were highly correlated, so we summarized the data using a PCA.
Chatter calls were also measured using Raven Pro with the same filter to remove background noise. The following characteristics from the first five chatter calls of each male were measured and averaged: center frequency, maximum frequency, overall length of the chatter, number of notes, and pace. These variables were also summarized with a PCA.
Statistical Analyses
All statistical tests were conducted in R v4. Within each species and geographic region, we tested for a correlation between pairwise measurements of geographic distance between call sites and song sharing (Jaccard index) by fitting a linear regression model in R (lm function). The significance of these regressions was quantified using a Mantel test (Mantel, 1967) with 1,000 permutations of the data in R (mantel function). PCAs to condense correlated song and morphometric variables were run with scaled variances (scale = TRUE) in R (prcomp function). For each of the first three principal components from the NM song PCA, we ran linear models (lm function) in R with the following factors: species identity, sampling region, morphology PC1, morphology PC2, and elevation. The anova and etaSquared functions were used to generate P-values and η2 values for each factor. Similar linear models were run for the chatter principal components. For each linear model in which species or region was a significant factor, we used a Tukey-Kramer post hoc test (TukeyHSD function; Tukey, 1953; Kramer, 1956) to assess the significance of pairwise comparisons of species/regions. Across all Mantel, linear model, and linear regression analyses, we controlled the false discovery rate associated with multiple hypothesis testing by adjusting P-values into Q-values using the method of Benjamini and Hochberg (1995) in R (p.adjust function).
Results
In pairwise comparisons of conspecifics within each region, sharing of NM songs was negatively correlated with the geographic distance between call sites, albeit with somewhat variable patterns among different species and localities (Figure 2). In Iringa and Morogoro, conspecific V. chalybeata males > 5 km apart had completely different repertoires (i.e., Jaccard index = 0) and were thus members of different dialect neighborhoods, whereas males within ∼2.5 km of each other typically shared 50–100% of their repertoires (Figure 2A). A similar pattern was observed for V. codringtoni males in Ruvuma, with males separated by over 7 km not sharing any songs (Figure 2B). In contrast, both V. funerea and V. purpurascens had large dialect neighborhoods in Ruvuma, with conspecific males 15–20 km apart often sharing over 50% of their NM song repertoires (Figures 2C,D). Limited sampling and/or dispersion of individuals resulted in non-significant trends in the remaining comparisons. A single V. chalybeata male at Iringa was the only individual we sampled that did not share any songs with nearby males, resulting in Jaccard indices of zero for several pairwise comparisons with nearby males (Figure 2A).
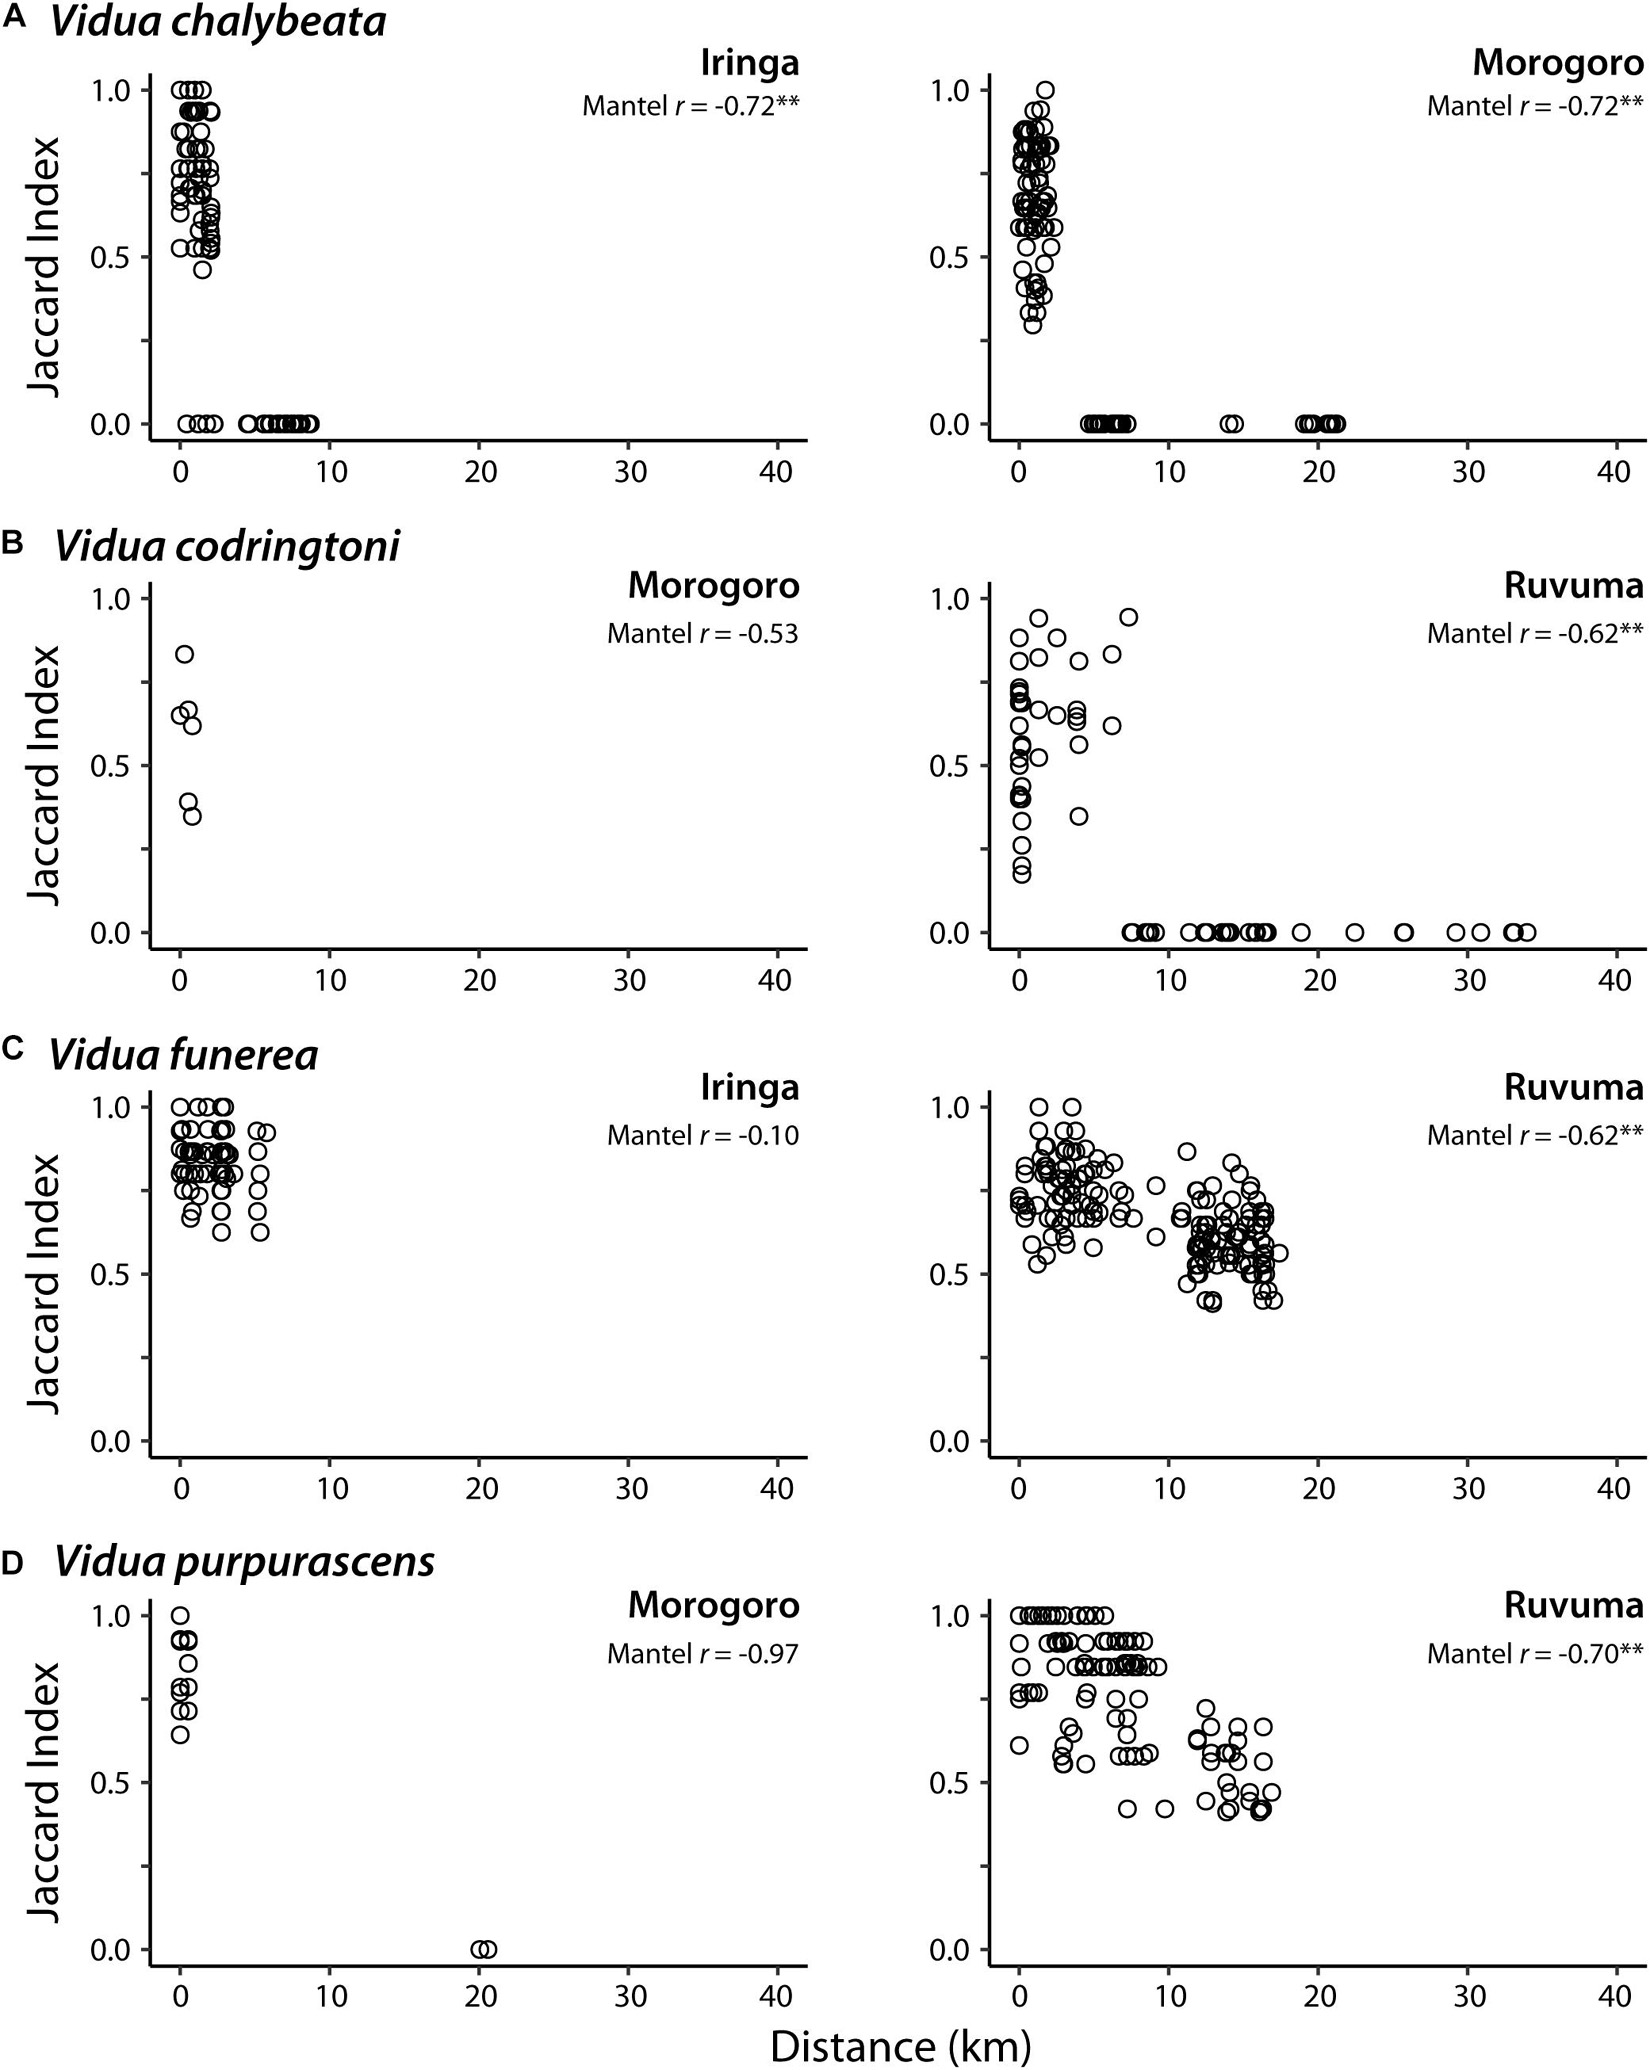
Figure 2. Relationship between pairwise distance between call sites and non-mimicry song sharing (Jaccard index) for indigobird males in eight populations. Each species (A–D) was sampled from two of three regions: Iringa, Morogoro, and Ruvuma. Mantel r = Mantel coefficient; ∗∗Q-value < 0.01.
Our analysis of morphological traits revealed significant effects of elevation (Figure 3). Overall body size, as captured by PC1 (39.8% of variation explained and positive loadings on all five morphometric traits), increased with elevation (P < 0.001; Figure 3B). PC2 (33.9% of variance explained), with positive loadings for bill length (loading = 0.51) and bill width (0.50), and a negative loading for tail length (−0.48), captured variation in bill size and tail length relative to overall body size and was also significantly correlated with elevation (P < 0.001). Thus, indigobirds from the lower elevation Morogoro region are smaller on average, but have relatively large bills and short tails. We used PC1 and PC2 scores for morphology as factors in linear models exploring variation in NM song and chatter attributes (see below).
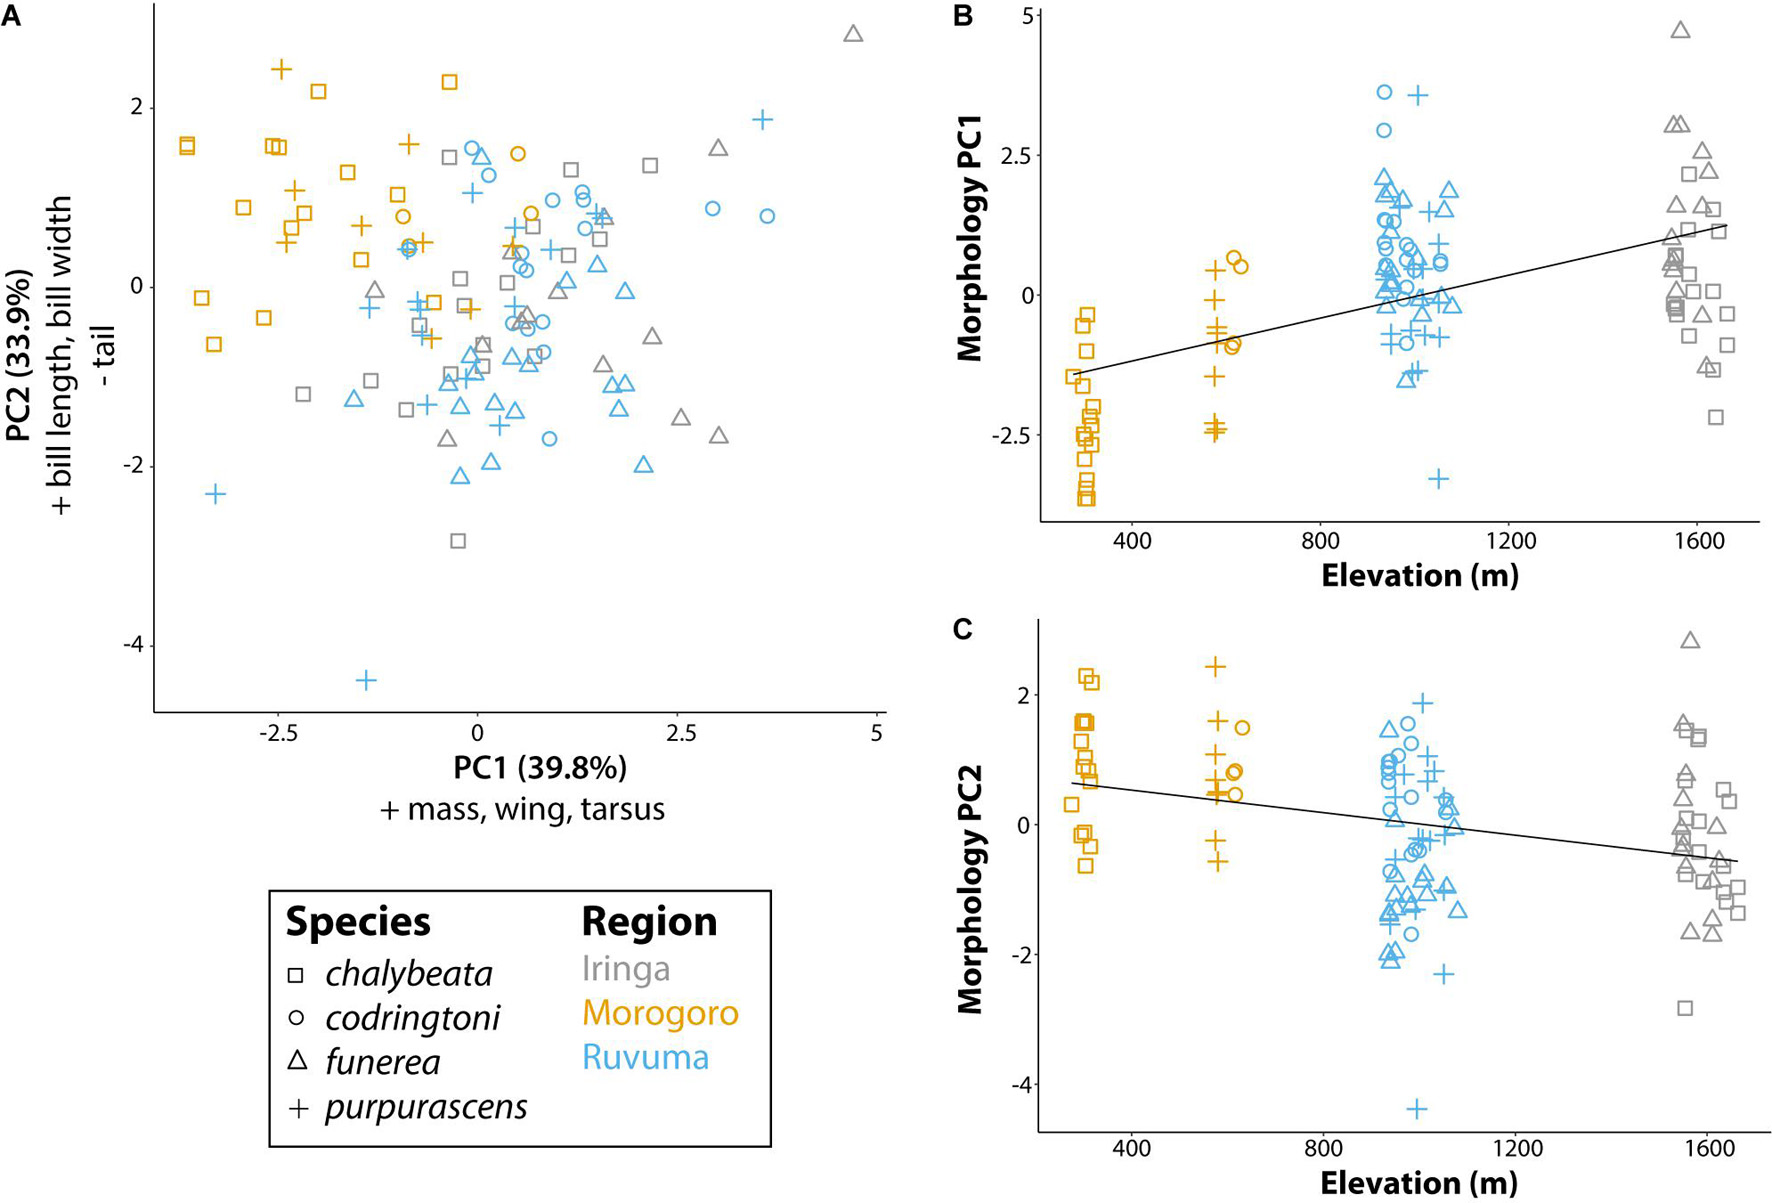
Figure 3. Morphological variation of male indigobirds relative to elevation of their call sites. (A) The first two principal components of a PCA including measurements of mass, wing length, tail length, tarsus length, bill length, bill width, and bill depth. Variables with loadings > 0.4 (+) or <−0.4 (−) for each component are reported in the corresponding axis label. (B,C) Linear regressions for each of the first two morphology principal components with elevation as the explanatory variable. Lines show the least square regression line. Symbols and colors are used to denote different species and regions, respectively.
Across all analyses of variation in NM songs, species identity was the most, and often only, significant predictor of variation (Table 3). Vidua purpurascens had significantly smaller and less diverse repertoires as compared to the other three species, whereas V. chalybeata and V. codringtoni had the largest and most diverse repertoires (Figure 4). We summarized other measures of variation in NM songs using PCA (Figure 5A). PC1 reflected differences in song length, number of syllables, maximum frequency, and center frequency with respective positive and negative loadings as follows : 0.52, 0.50, −0.51, and −0.47. Variation in PC1 scores was best explained by species identity (F3,105 = 15.34, Q-value < 0.0001), followed by sampling region (F2,105 = 8.43, Q-value = 0.002) and elevation (F1,105 = 6.22, Q-value = 0.04) (Table 3). Differences among species in PC1 scores (Figure 5B) indicate that V. purpurascens has longer songs with more syllables, which are sung at lower frequencies, whereas V. codringtoni has shorter songs delivered at higher frequencies. A smaller but significant regional effect was due to differences between Morogoro and Iringa (Figure 5B). For PC2 (31.9% of the variance explained with positive loadings on center frequency, number of syllables, maximum frequency, and song length), species identity was the only significant factor in the linear model (Table 3). As with PC1, V. purpurascens had the highest PC2 scores, whereas V. chalybeata had the lowest (Figure 5C). Because the same variables contribute to both PC1 and PC2, these axes are difficult to understand intuitively; results for the individual variables are shown in Supplementary Figure 2. Both species identity and sampling region were strongly significant predictors of variation in PC3 scores (Table 3), which captured pace (positive loading of 0.93). Among species, V. chalybeata and V. codringtoni sang the fastest and slowest songs, respectively, and songs were faster in Morogoro as compared to other regions (Figure 5D).
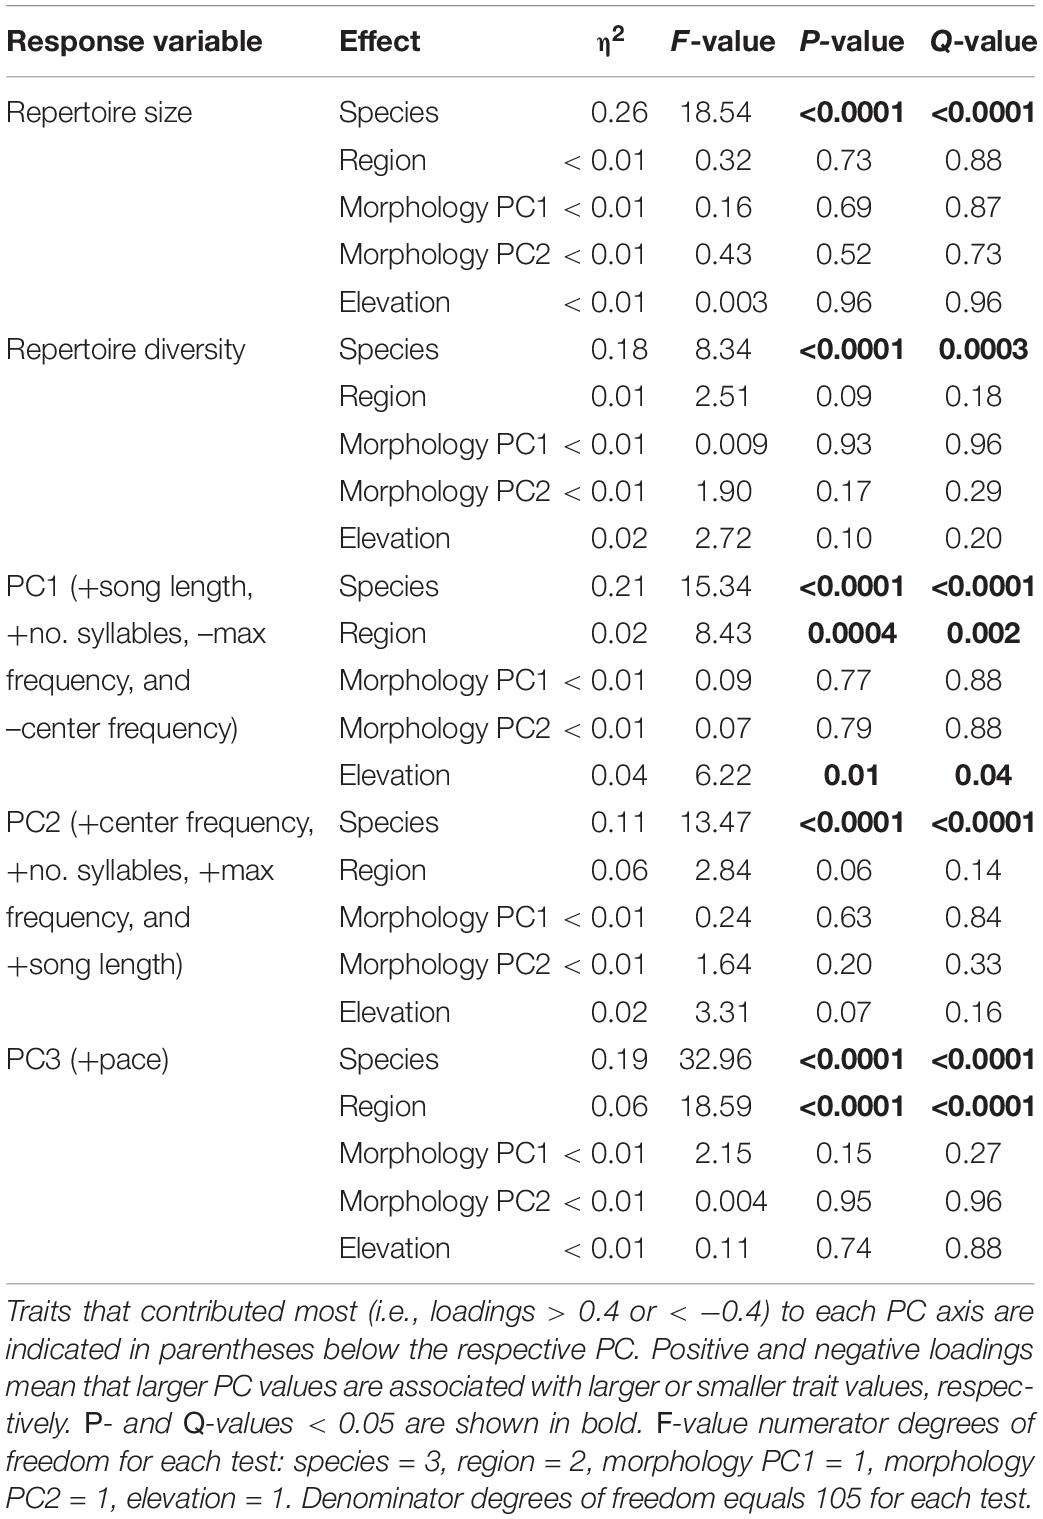
Table 3. Linear model results for different measures of variation in the general characteristics of indigobird non-mimicry songs.
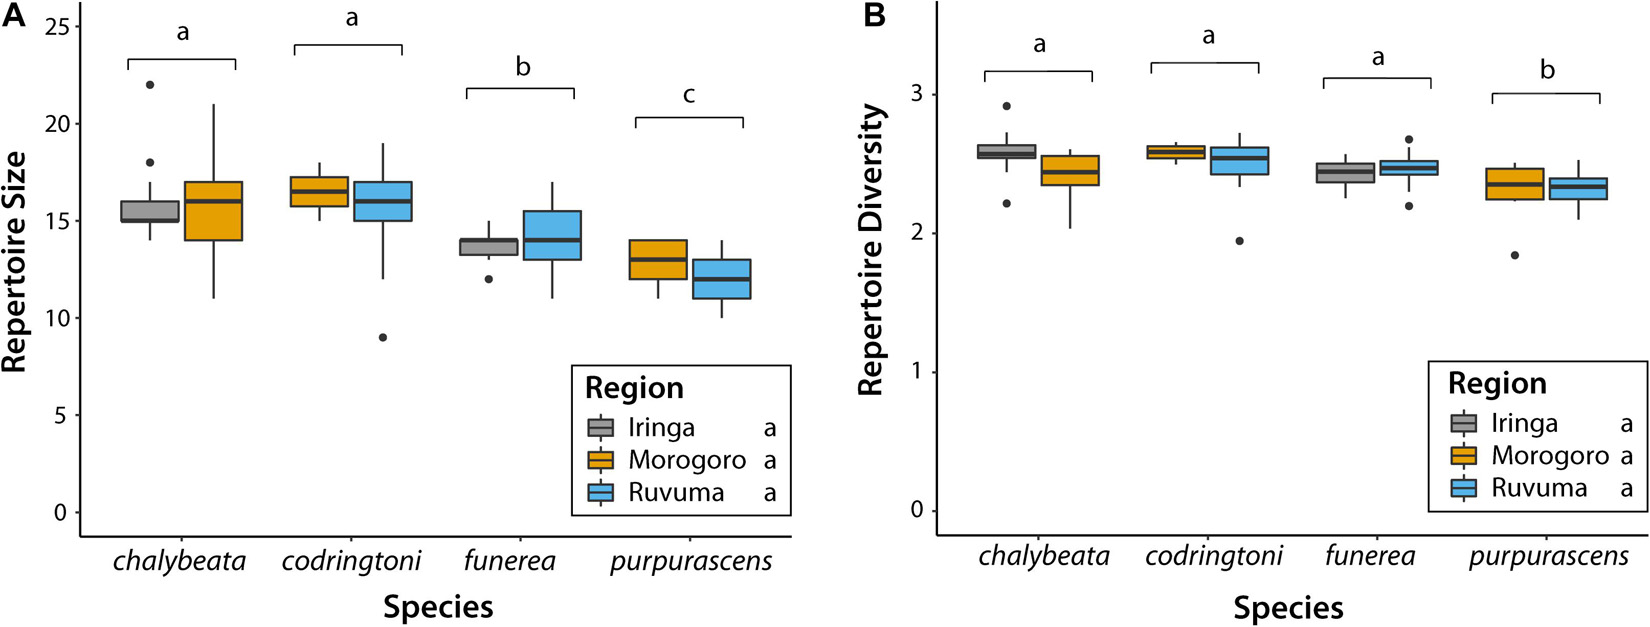
Figure 4. Variation in (A) size and (B) diversity of non-mimicry song repertoires among indigobird species and sampled regions. Populations of the same species are grouped on the X-axis; boxplots are color-coded by sampling region. Species labeled with different lowercase letters (above brackets) differed significantly (adjusted P < 0.05) in post hoc tests. There were no significant differences among regions in these two measures.
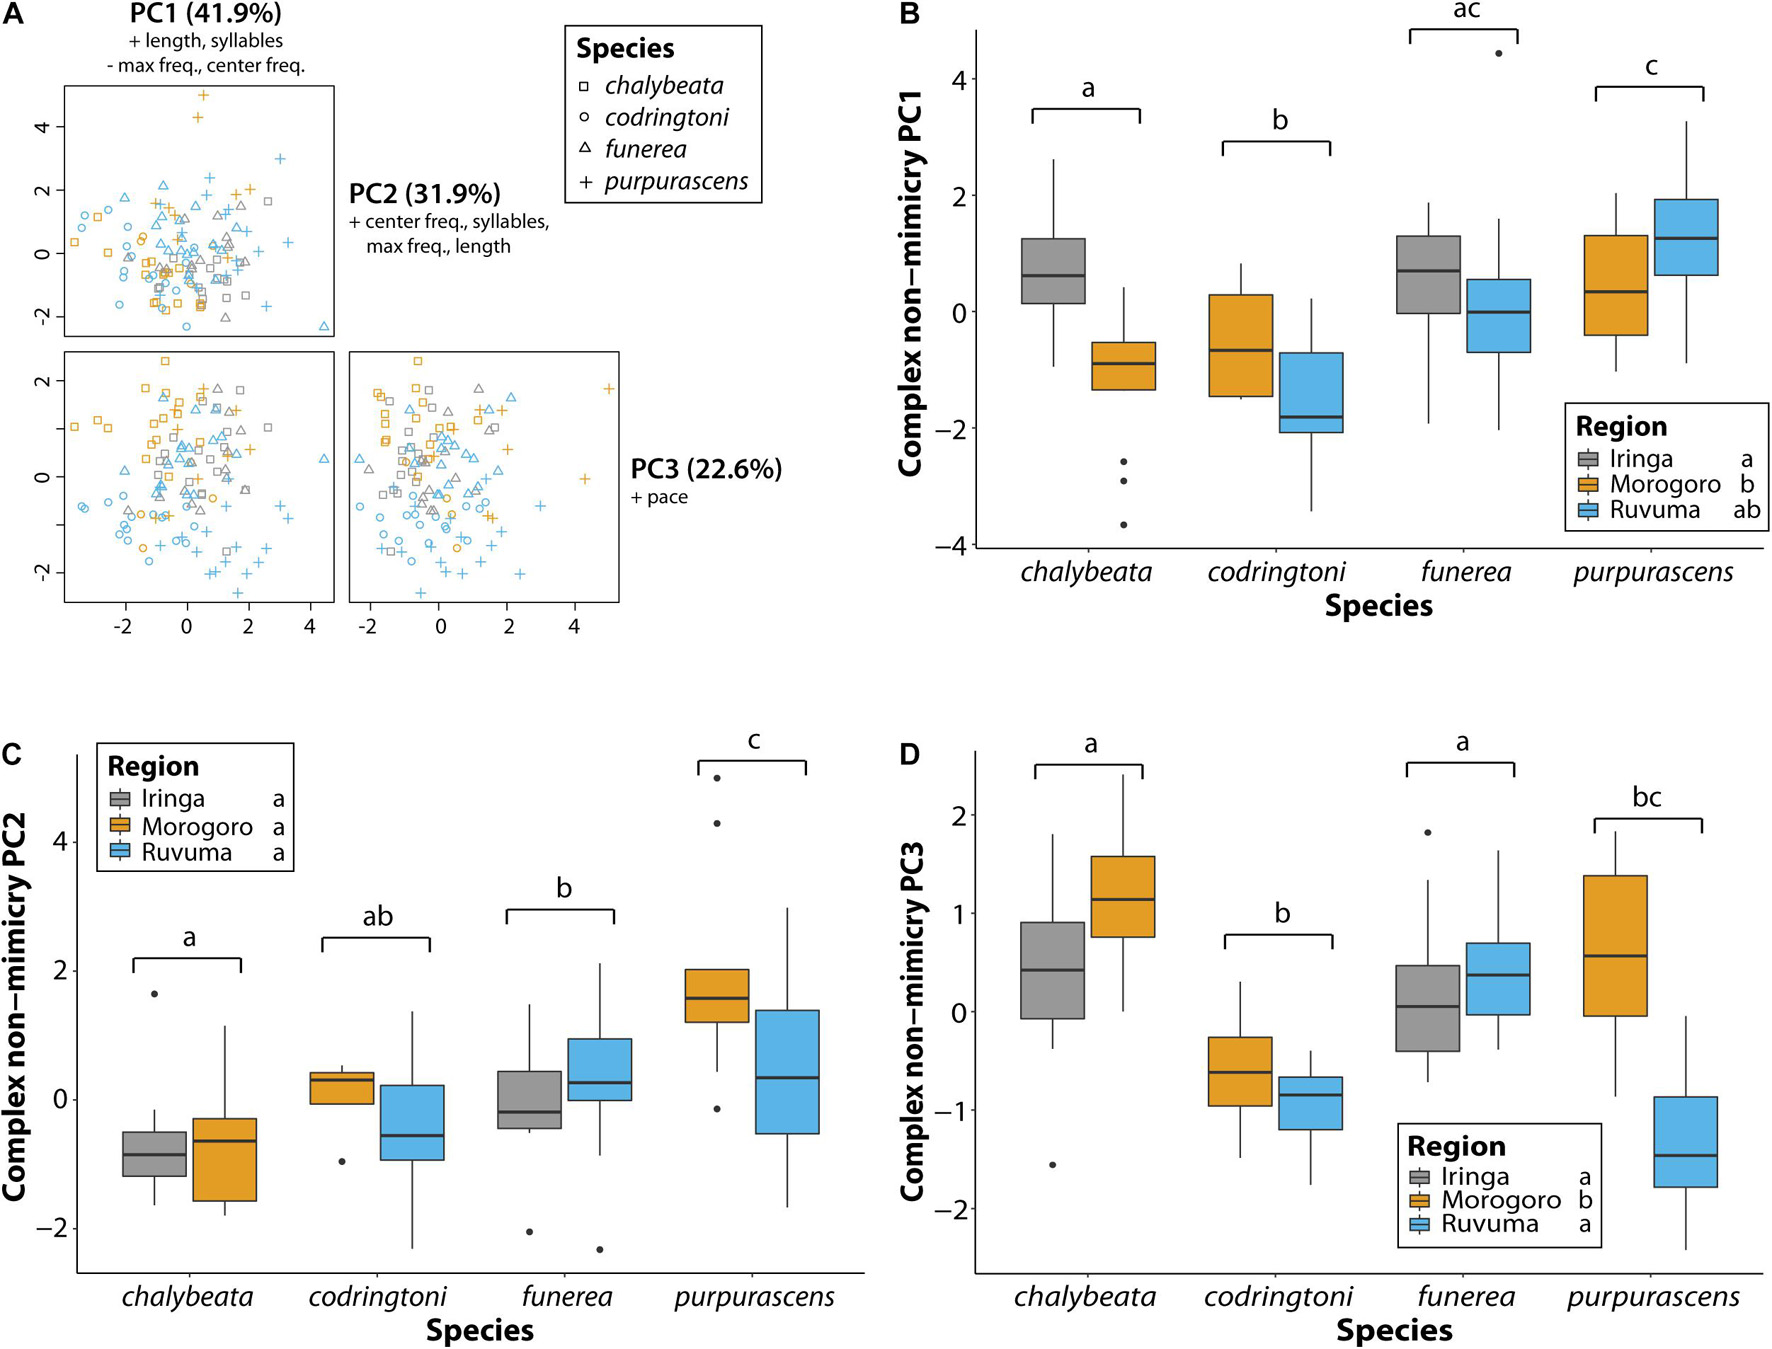
Figure 5. Variation in general characteristics of non-mimicry songs between indigobird species and sampled regions. Song length, number of syllables, pace, center frequency, and maximum frequency measurements were collapsed via a principal component analysis (A). Variables with loadings > 0.4 (+) or <−0.4 (−) are indicated for each principal component. Variation among species and regions in the first three PC axes is shown in panels (B–D). Significant differences between species (adjusted P < 0.05) are indicated by different lowercase letters above the brackets for each species. Similarly, regions labeled with different lowercase letters were significantly different in post hoc tests.
A comparable analysis of chatter calls revealed no species or regional differences in overall length or number of syllables, the variables contributing most to PC1 (39.8% of variance explained), but a few differences were detected for other measures of chatter call variation (Table 4 and Figure 6). As captured by PC2 (33.9% of variance explained), chatter calls in V. funerea were significantly lower in frequency than in the other three species, whereas chatter calls in the Morogoro region were of significantly higher frequency (Figure 6C). Finally, V. codringtoni produced chatters with a significantly slower pace than in V. chalybeata and V. purpurascens (Figure 6D).
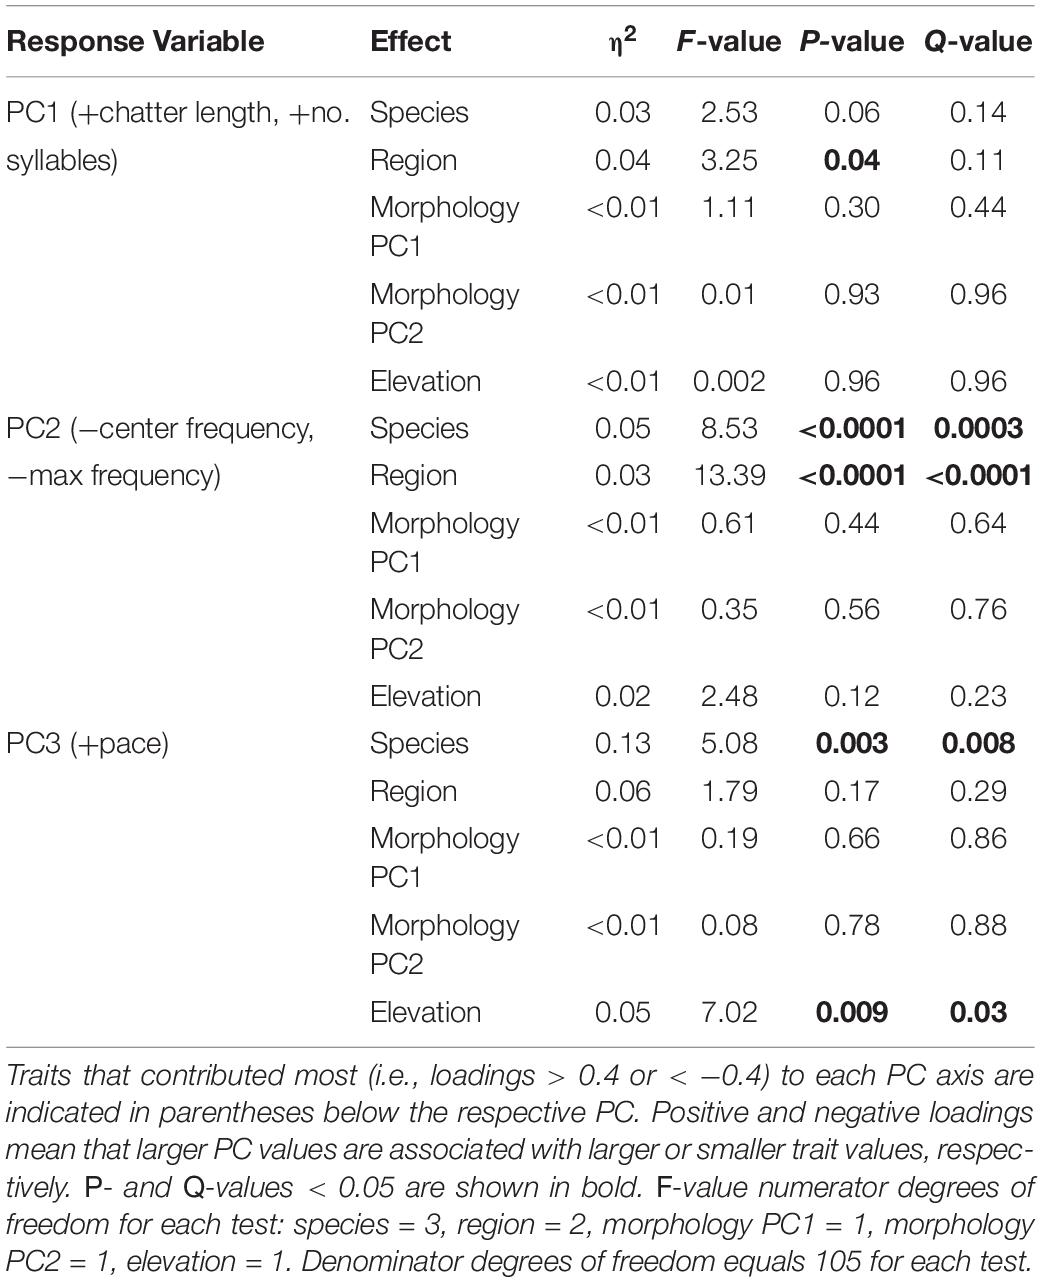
Table 4. Linear model results for measures of variation in the general characteristics of indigobird chatter calls.
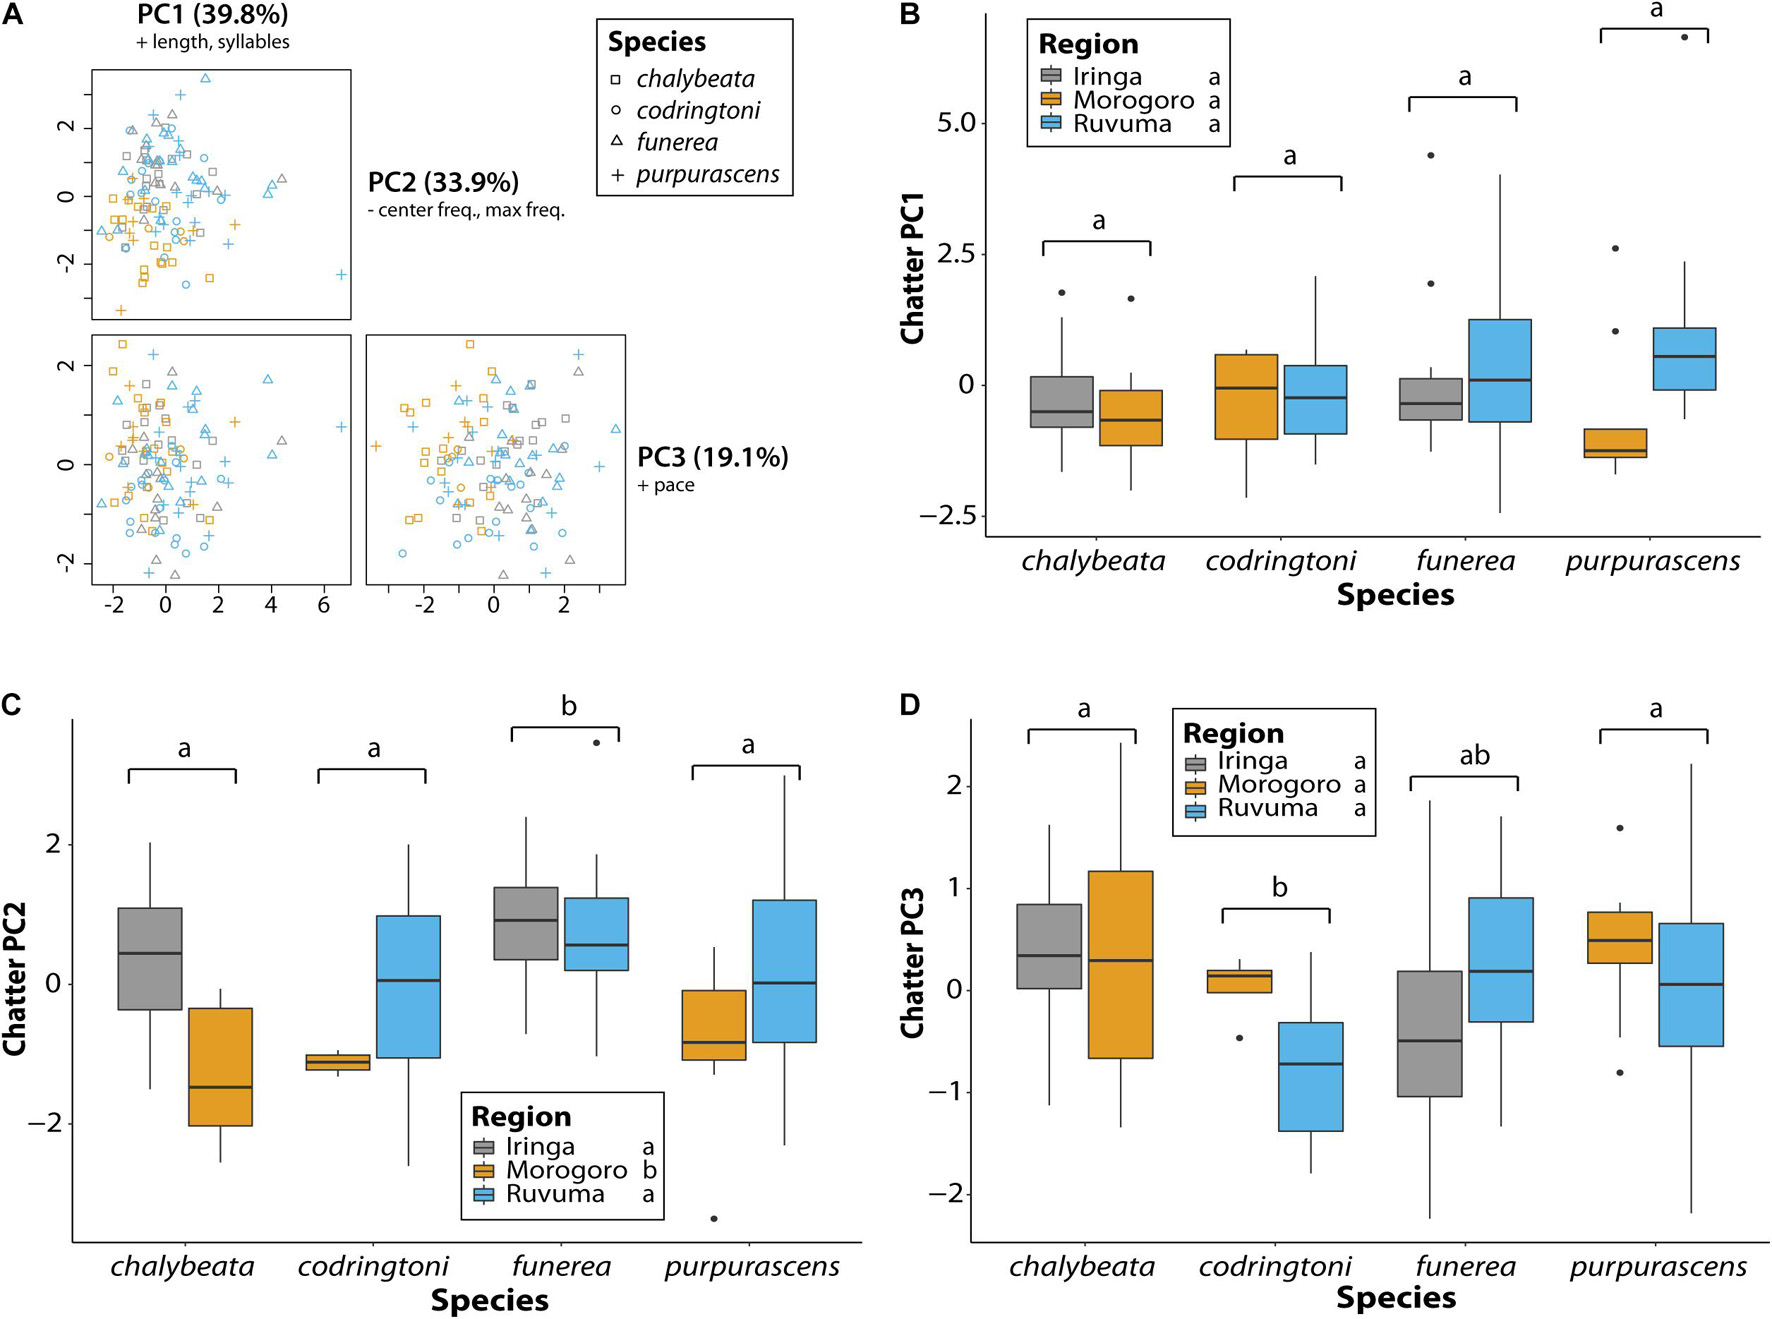
Figure 6. Variation in chatter calls between indigobird species and sampled regions. Chatter length, number of syllables, pace, center frequency, and maximum frequency measurements were collapsed via a principal component analysis (A). Variables with loadings > 0.4 (+) or < –0.4 (–) are indicated for each principal component. Variation among species and regions in the first three PC axes is shown in panels (B–D). Significant differences between species (adjusted P < 0.05) are indicated by different lowercase letters above the brackets for each species. Similarly, regions labeled with different lowercase letters were significantly different in post hoc tests.
Discussion
The complexity of indigobird vocal behavior is both a consequence and important catalyst of their evolutionary diversification as host-specific obligate brood parasites. As shown in earlier work (Payne et al., 1998, 2000), imprinting on host vocalizations by young indigobirds shapes the vocal behavior of males as well as the mate and host preferences of females. In theory (Gavrilets, 2003), these features of indigobird social behavior are sufficient to account for reproductive isolation of indigobirds associated with different hosts, facilitating rapid, sympatric speciation when a new host is colonized (Sorenson et al., 2003). This reproductive isolation is imperfect (Payne and Sorenson, 2004; Balakrishnan et al., 2009), however, and indigobird species have diverged in other traits that are clearly under genetic control, including male plumage and soft part colors and mimicry of the intricate nestling mouth markings of their respective hosts (Payne, 2005; Jamie et al., 2020). These traits likely reinforce reproductive isolation. This study poses the question of whether indigobirds may have also diverged in measurable aspects of their vocal behavior (perhaps associated with divergence in female preferences, which would be difficult to test). While it was already known that indigobirds’ chatter calls are broadly similar and that their complex repertoires of NM songs evolve through cultural evolution and are highly labile over space and time, previous work has not rigorously tested for possible differences in more general measures of indigobird vocalizations (e.g., average repertoire size, song length, frequency, and pace). While any observed differences between species in these traits could be due to either genetic divergence, cultural evolution, or developmental effects (e.g., different host nest environments), the lack of such differences would allow genetic divergence to be ruled out.
Male indigobirds have large repertoires of intricate NM songs, which they share and presumably learn from local conspecifics, whereas the NM song repertoires of different indigobird species inhabiting a local area are entirely non-overlapping. Our results confirm the complete turnover of within species repertoires across short distances, resulting in landscapes filled with relatively small dialect neighborhoods, but also show that there is considerable variation in this pattern among species and localities. For example, V. funerea and V. purpurascens both occurred at relatively high density in the Ruvuma region, where their respective host species appear to be more evenly dispersed across the landscape than in other regions (DaCosta, personal observation). This presumably leads to higher connectivity of these local populations and more interaction among competing males, as evidenced by conspecific males > 15 km apart still sharing at least half their songs. In contrast, V. codringtoni males establish territories adjacent to riparian thickets, which provide the preferred nesting habitat of their host (Hypargos niveoguttatus), and are unevenly distributed in the region. This results in lower connectivity among V. codringtoni call sites and smaller dialect neighborhoods; males > 7 km apart were associated with different river drainages and did not share songs. Similarly, in the Iringa and Morogoro regions, song sharing between conspecifics often dropped to zero with distances greater than ∼5 km. This may be due to greater patchiness of suitable habitat for host species in these regions, leading to lower connectivity between call sites of their respective indigobirds.
Despite some variation, NM song dialect neighborhoods of all indigobirds are quite small on a regional scale, such that cultural transmission is unlikely to account for any consistent differences in NM song characteristics between indigobird species. Nonetheless, our analyses revealed significant species effects for all of the general measures of NM song variation we considered (Table 3 and Figures 4, 5). The NM song repertoires of V. purpurascens were the smallest and least diverse, but comprised longer songs with more syllables. Conversely, V. chalybeata and V. codringtoni had larger, more diverse repertoires featuring shorter songs with fewer syllables. Vidua funerea was intermediate for NM song repertoire size and for principal components that included song length and frequency measures (Figure 5). The apparent negative correlation between repertoire size and song length suggests a tradeoff between these traits, perhaps because the volume of brain nuclei involved in song learning or production imposes constraints on the overall complexity of the full repertoire (Devoogd et al., 1993). Particular NM song types are associated with courtship (Payne and Payne, 1977; Payne, 1979), and sexual selection in combination with this constraint may contribute to differences among species. For example, if female V. purpurascens prefer longer songs, this could result in smaller repertoires for this species. Sampling region was also a significant factor explaining variation in PC1 (song length, number of syllables, center frequency, maximum frequency) and PC3 (pace), with birds from Morogoro delivering shorter, lower frequency songs at a faster pace (i.e., syllables/second) (Figure 5). Call sites in Morogoro were at lower elevations, and indigobirds in this region were of smaller body size, but with relatively large bills and short tails (Table 2 and Figure 3). These results support a role for local ecology in shaping morphometrics and in turn NM song characteristics, but for both of these principal components species identity explained a larger proportion of the variance. Moreover, species identity was the only significant factor in analyses of PC2 scores, as in analyses of repertoire size, and repertoire diversity. Thus, these results indicate consistent differences between indigobird species in NM song characteristics even though distant populations of the same species share no specific songs in common.
Despite the recent diversification of indigobird species, these differences might reflect divergent evolution of NM songs in much the same manner as indigobird species have diverged in other traits that likely play a role in mate choice and species recognition (i.e., plumage and soft parts colors). Alternatively, species differences in NM song attributes may reflect the phenotypic effects of being reared by different host species. In addition to possible effects on body size, learning, and mimicking the songs of a particular host species, a critical component of the social and breeding behavior of indigobirds (Payne, 1973, 1979; Payne et al., 2000), might influence the characteristics of the indigobird’s NM songs. For example, males reared by hosts with small repertoires may have greater neural capacity available for acquiring and memorizing large repertoires of NM songs, and/or indigobirds associated with hosts that produce songs with particular characteristics (e.g., high frequency or rapid delivery of notes) might develop neural circuits that favor NM songs with similar attributes. Qualitative assessments provide some support for these possibilities. The red-billed firefinch (Lagonosticta senegala) has the smallest repertoire among the host species in Tanzania (Payne et al., 1992), and individual males of its indigobird parasite (V. chalybeata) had relatively large repertoires of NM songs (Figure 4A). Among the hosts of the indigobird species we sampled, the Peter’s twinspot (Hypargos niveoguttatus) produces vocalizations with the highest frequencies, and the NM songs of their indigobird parasite (V. codringtoni) also tend to be higher in frequency as compared to other indigobirds (Figures 5B,C). Jameson’s firefinches (Lagonosticta rhodopariea) produce unusually rapid alarm calls with notes delivered at rates of 22+ per second (Payne, 1996). Males of the indigobird parasitizing this species (V. purpurascens) mimic these alarm calls precisely, and their NM songs have a fast pace in Morogoro but not in Ruvuma (Figure 5D). A rigorous test of whether learning and mimicking the vocalizations of particular hosts shapes indigobird NM songs in predictable ways should include quantitative analyses of both host and parasite song recordings from multiple localities, and sampling of all ten indigobird species and their respective hosts to increase the power of the analysis.
Generally, chatter calls were more similar across both species and sampled regions as compared to NM songs (Table 4 and Figure 6). Species identity was a significant factor explaining variation in PC2 and PC3 scores, whereas sampling region was significant only for PC2. One notable species difference was a slower pace of chatter calls in V. codringtoni (Figure 6D), mirroring the slower pace of its NM songs (Figure 5D) and suggesting the possibility of a common underlying mechanism. Nonetheless, our findings are consistent with the conclusion of Payne (1973) that chatter calls are broadly similar across species, supporting the hypothesis that chatter may represent an innate signal or password (sensu Hauber et al., 2001) that allows young male indigobirds to recognize and associate with other indigobird males, and then, using host song mimicry to identify conspecifics, select appropriate tutors for acquiring their NM songs. While an alternative mechanism by which male indigobirds could acquire the appropriate local dialect is not obvious, we note that the above scenario has not been experimentally tested.
Our analyses revealed consistent differences among indigobird species in general features of their non-mimetic songs despite the fact that conspecifics, including those in relatively close geographic proximity (e.g., 5–20 km) and those in different regions, may have entirely different repertoires of specific songs (i.e., sequences of notes), and despite the influence of significant environmental effects likely mediated through effects on body size and relative bill size. Divergent selection on female preferences and/or male sound production might contribute to the observed differences, but we speculate that phenotypic plasticity and, more specifically, the effects of learning and mimicking the songs of different hosts likely explains most of the differences we observed. Notably, V. funerea and V. purpurascens are broadly syntopic at Ruvuma but are associated with different hosts and have NM song repertoires that differ significantly in the length and pace of songs (Supplementary Figure 2) as well as repertoire size and diversity (Figure 4). Notably, allopatric populations of V. funerea and V. purpurascens are similar to their respective conspecific Ruvuma populations in repertoire size and diversity. The two populations at Ruvuma, however, are morphologically and genetically indistinguishable (DaCosta, 2014), which is not typically the case for sympatric indigobird species. Thus, genetic divergence between these populations is unlikely as an explanation for the observed differences in song traits. Regardless of the relative contributions of genetic divergence and phenotypic effects, the species differences in song traits documented in this study may contribute to reproductive isolation among nascent and recently evolved indigobird species.
Data Availability Statement
The original contributions presented in the study are included in the article/Supplementary Material, further inquiries can be directed to the corresponding author.
Ethics Statement
The animal study was reviewed and approved by Boston University Institutional Animal Care and Use Committee.
Author Contributions
JD and MS conceived and designed the study, collected indigobird vocalization recordings, and wrote the manuscript. JD conducted data analyses. Both authors contributed to the article and approved the submitted version.
Funding
This work was supported by the National Science Foundation grant DEB 0640759 with the approval of the Tanzania Wildlife Research Institute and the Tanzania Commission for Science and Technology.
Conflict of Interest
The authors declare that the research was conducted in the absence of any commercial or financial relationships that could be construed as a potential conflict of interest.
Publisher’s Note
All claims expressed in this article are solely those of the authors and do not necessarily represent those of their affiliated organizations, or those of the publisher, the editors and the reviewers. Any product that may be evaluated in this article, or claim that may be made by its manufacturer, is not guaranteed or endorsed by the publisher.
Acknowledgments
David Moyer, Neil Baker, and Liz Baker provided indigobird locality information and valuable logistical support in Tanzania. Elia Mulungu provided field assistance during data collection. Two reviewers provided helpful comments on an earlier version of the manuscript.
Supplementary Material
The Supplementary Material for this article can be found online at: https://www.frontiersin.org/articles/10.3389/fevo.2021.725979/full#supplementary-material
Supplementary Figure 1 | Repertoire of non-mimicry vocalizations from a representative Vidua purpurascens male from the Ruvuma region. (A) Sampling of 100 non-mimicry songs recovered a repertoire size of 14 songs. Numbers above songograms show the number of times each song appeared in the sample of 100. (B) Three representative chatters to display characteristics of the calls and variation in length.
Supplementary Figure 2 | Variation in measured characteristics of non-mimicry songs before variables were condensed with a principal component analysis.
Supplementary Figure 3 | Variation in measured characteristics of chatter calls before variables were condensed with a principal component analysis.
Supplementary File 1 | DaCostaSorenson_measurements.xlsx. Measurements of morphological, non-mimicry song, and chatter characteristics for each indigobird (n = 114) sampled in the study.
Supplementary File 2 | DaCostaSorenson_song_sharing.xlsx. Jaccard index calculations of non-mimicry song sharing among conspecific indigobirds, with a separate worksheet for each region.
Supplementary File 3 | DaCostaSorenson_PCA_results.xlsx. Results (rotations, importance of components, and eigenvalues) for PCA analyses of morphology, chatter, and NM songs.
Footnotes
References
Ashton, K. G. (2002). Patterns of within-species body size variation of birds: strong evidence for Bergmann’s rule. Glob. Ecol. Biogeogr. 11, 505–523.
Badyaev, A. V., and Leaf, E. S. (1997). Habitat associations of song characteristics in Phylloscopus and Hippolais warblers. Auk 114, 40–46. doi: 10.2307/4089063
Balakrishnan, C. N., Sefc, K. M., and Sorenson, M. D. (2009). Incomplete reproductive isolation following host shift in brood parasitic indigobirds. Proc. R. Soc. B Biol. Sci. 276, 219–228. doi: 10.1098/rspb.2008.0733
Benjamini, Y., and Hochberg, Y. (1995). Controlling the false discovery rate: a practical and powerful approach to multiple testing. J. R. Stat. Soc. Ser. B Methodol. 57, 289–300. doi: 10.1111/j.2517-6161.1995.tb02031.x
Bertelli, S., and Tubaro, P. L. (2002). Body mass and habitat correlates of song structure in a primitive group of birds. Biol. J. Linn. Soc. 77, 423–430. doi: 10.1046/j.1095-8312.2002.00112.x
Brenowitz, E. A., and Beecher, M. D. (2005). Song learning in birds: diversity and plasticity, opportunities and challenges. Trends Neurosci. 28, 127–132. doi: 10.1016/j.tins.2005.01.004
Byers, B. E., and Kroodsma, D. E. (2009). Female mate choice and songbird song repertoires. Anim. Behav. 77, 13–22. doi: 10.1016/j.anbehav.2008.10.003
Charif, R. A., Waack, A. M., and Strickman, L. M. (2008). Raven Pro 1.3 User’s Manual. Ithaca, NY: Cornell Laboratory of Ornithology.
DaCosta, J. M. (2014). Behavioral, Morphological, and Genomic Analyses of Population Structure in Brood Parasitic Indigobirds (Vidua spp.). Ph.D. Thesis. Boston, MA: Boston University. 77, 13–22.
Devoogd, T. J., Krebs, J. R., Healy, S. D., and Purvis, A. (1993). Relations between song repertoire size and the volume of brain nuclei related to song: comparative evolutionary analyses amongst oscine birds. Proc. R. Soc. B Biol. Sci. 254, 75–82. doi: 10.1098/rspb.1993.0129
Eens, M., Pinxten, R., and Verheyen, R. F. (1991). Male song as a cue for mate choice in the European starling. Behaviour 116, 210–238. doi: 10.1163/156853991x00049
Gavrilets, S. (2003). Perspective: models of speciation: what have we learned in 40 years? Evolution 57, 2197–2215. doi10.1111/j.0014-3820.2003.tb00233.x
Gillooly, J. F., and Ophir, A. G. (2010). The energetic basis of acoustic communication. Proc. R. Soc. B Biol. Sci. 277, 1325–1331. doi: 10.1098/rspb.2009.2134
Hauber, M. E., Russo, S. A., and Sherman, P. W. (2001). A password for species recognition in a brood-parasitic bird. Proc. R. Soc. Lond. Ser. B Biol. Sci. 268, 1041–1048. doi: 10.1098/rspb.2001.1617
Hesler, N., Mundry, R., Sacher, T., Coppack, T., Bairlein, F., and Dabelsteen, T. (2012). Song repertoire size correlates with measures of body size in Eurasian blackbirds. Behaviour 149, 645–665. doi: 10.1163/156853912x649920
Huber, S. K., and Podos, J. (2006). Beak morphology and song features covary in a population of Darwin’s finches (Geospiza fortis). Biol. J. Linn. Soc. 88, 489–498. doi: 10.1111/j.1095-8312.2006.00638.x
Jaccard, P. (1901). Distribution de la flore alpine dans le bassin des Dranses et dans quelques régions voisines. Bull. Soc. Vaudoise Sci. Nat. 37, 241–272.
Jamie, G. A., Belleghem, S. M. V., Hogan, B. G., Hamama, S., Moya, C., Troscianko, J., et al. (2020). Multimodal mimicry of hosts in a radiation of parasitic finches. Evolution 74, 2526–2538. doi10.1111/evo.14057
Kipper, S., Mundry, R., Sommer, C., Hultsch, H., and Todt, D. (2006). Song repertoire size is correlated with body measures and arrival date in common nightingales. Luscinia Megarhynchos. Anim. Behav. 71, 211–217. doi: 10.1016/j.anbehav.2005.04.011
Kramer, C. Y. (1956). Extension of multiple range test to group means with unequal numbers of replication. Biometrics 12, 307–310. doi: 10.2307/3001469
MacDougall-Shackleton, S. A. (1997). Sexual selection and the evolution of song repertoires. Curr. Ornithol. 14, 81–124. doi: 10.1007/978-1-4757-9915-6_3
Mantel, N. (1967). The detection of disease clustering and a generalized regression approach. Cancer Res. 27, 209–220.
Marler, P., and Tamura, M. (1962). Song “dialects” in three populations of white-crowned sparrows. Condor 64, 368–377. doi: 10.2307/1365545
Miller, E. H. (1982). “Character and variance shift in acoustic signals of birds,” in Acoustic Communication in Birds, eds D. E. Kroodsma and E. H. Miller (New York, NY: Academic Press), 253–295. doi: 10.1016/b978-0-08-092416-8.50017-6
Morton, E. S. (1975). Ecological sources of selection on avian sounds. Am. Nat. 109, 17–34. doi: 10.1086/282971
Nicolai, J. (1964). Der brutparasitismus der Viduinae als ethologisches problem. Z. Für Tierpsychol. 21, 129–204.
Nottebohm, F. (1985). Sound transmission, signal salience, and song dialects. Behav. Brain Sci. 8, 112–113. doi: 10.1017/s0140525x00019919
Payne, R. B. (1973). Behavior, mimetic songs and song dialects, and relationships of the parasitic indigobirds (Vidua) of Africa. Ornithol. Monogr. 11, 1–333. doi: 10.1111/j.1439-0310.1985.tb00498.x
Payne, R. B. (1979). Song structure, behaviour, and sequence of song types in a population of village indigobirds. Vidua chalybeata. Anim. Behav. 27, 997–1013. doi: 10.1016/0003-3472(79)90047-2
Payne, R. B. (1985). Behavioral continuity and change in local song populations of village indigobirds Vidua chalybeata. Z. Für Tierpsychol. 70, 1–44. doi: 10.1111/j.1439-0310.1985.tb00498.x
Payne, R. B. (1987). Song dialects and neighborhood habitats in the indigobirds Vidua chalybeata and Vidua purpurascens at Lochinvar National Park, Zambia. J. Field Ornithol. 58, 152–170.
Payne, R. B. (1996). Field identification of the indigobirds. Bull. Afr. Bird Club 3, 14–25. doi: 10.5962/p.308899
Payne, R. B. (2005). Nestling mouth markings and colors of Old World finches Estrildidae: mimicry and coevolution of nestling finches and their Vidua brood parasites. Misc Publ Mus Zool Univ Mich. 194, 1–45.
Payne, R. B. (2010). “Family Viduidae (Whydahs and Indigobirds),” in Handbook of the Birds of the World, Vol. 15, eds J. del Hoyo, A. Elliott, and D. A. Christie (Barcelona: Lynx Edicions).
Payne, R. B., and Payne, K. (1977). Social organization and mating success in local populations of village indigobirds, Vidua chalybeata. Z. Für Tierpsychol. 45, 113–173. doi: 10.1111/j.1439-0310.1977.tb02115.x
Payne, R. B., Barlow, C. R., Balakrishnan, C. N., and Sorenson, M. D. (2005). Song mimicry of Black-bellied Firefinch Lagonosticta rara and other finches by the brood-parasitic Cameroon Indigobird Vidua camerunensis in West Africa. Int. J. Avian Sci. 147, 130–143. doi: 10.1111/j.1474-919x.2004.00378.x
Payne, R. B., Payne, L. L., Nhlane, M. E. D., and Hustler, K. (1992). “Species status and distribution of the parasitic indigobirds Vidua in east and southern Africa,” in Proceetings of the . 5th Pan-African Ornithological Congress, Bujumbura, 40–52.
Payne, R. B., Payne, L. L., and Woods, J. L. (1998). Song learning in brood-parasitic indigobirds Vidua chalybeata: song mimicry of the host species. Anim. Behav. 55, 1537–1553. doi: 10.1006/anbe.1997.0701
Payne, R. B., Payne, L. L., Woods, J. L., and Sorenson, M. D. (2000). Imprinting and the origin of parasite-host species associations in brood-parasitic indigobirds, Vidua chalybeata. Anim. Behav. 59, 69–81. doi: 10.1006/anbe.1999.1283
Payne, R. B., and Sorenson, M. D. (2004). Behavioral and genetic identification of a hybrid Vidua: maternal origin and mate choice in a brood-parasitic finch. Auk 121, 156–161. doi: 10.1093/auk/121.1.156
Podos, J. (2001). Correlated evolution of morphology and vocal signal structure in Darwin’s finches. Nature 409, 185–188.
Podos, J., and Warren, P. S. (2007). The evolution of geographic variation in birdsong. Adv. Study Behav. Vol 37, 403–458. doi: 10.1016/s0065-3454(07)37009-5
Ryan, M. J., and Brenowitz, E. A. (1985). The role of body size, phylogeny, and ambient noise in the evolution of bird song. Am. Nat. 126, 87–100. doi: 10.1086/284398
Seddon, N. (2005). Ecological adaptation and species recognition drives vocal evolution in neotropical suboscine birds. Evolution 59, 200–215. doi: 10.1111/j.0014-3820.2005.tb00906.x
Slabbekoorn, H., and Smith, T. B. (2002). Bird song, ecology and speciation. Philos. Trans. R. Soc. Lond. Ser. B-Biol. Sci. 357, 493–503. doi: 10.1098/rstb.2001.1056
Sorenson, M. D., Sefc, K. M., and Payne, R. B. (2003). Speciation by host switch in brood parasitic indigobirds. Nature 424, 928–931. doi: 10.1038/nature01863
Keywords: Vidua, indigobirds, vocalization, brood parasitism, speciation
Citation: DaCosta JM and Sorenson MD (2021) Variation in the Non-mimetic Vocalizations of Brood-Parasitic Indigobirds and Their Potential Role in Speciation. Front. Ecol. Evol. 9:725979. doi: 10.3389/fevo.2021.725979
Received: 16 June 2021; Accepted: 17 September 2021;
Published: 22 October 2021.
Edited by:
Brian Peer, Western Illinois University, United StatesReviewed by:
Christina Riehl, Princeton University, United StatesCanwei Xia, Beijing Normal University, China
Copyright © 2021 DaCosta and Sorenson. This is an open-access article distributed under the terms of the Creative Commons Attribution License (CC BY). The use, distribution or reproduction in other forums is permitted, provided the original author(s) and the copyright owner(s) are credited and that the original publication in this journal is cited, in accordance with accepted academic practice. No use, distribution or reproduction is permitted which does not comply with these terms.
*Correspondence: Jeffrey M. DaCosta, amVmZnJleS5kYWNvc3RhQGJjLmVkdQ==