 Shuguang Hao1
 Chuan Ma
 Wei Guo
 Le Kang
- 1State Key Laboratory of Integrated Management for Pest Insects and Rodents, Institute of Zoology, Chinese Academy of Sciences, Beijing, China
- 2CAS Center for Excellence in Biotic Interactions, University of Chinese Academy of Sciences, Beijing, China
- 3Beijing Institutes of Life Science, Chinese Academy of Sciences, Beijing, China
Climate warming has a remarkable effect on the distribution, phenology, and development of insects. Although the embryonic development and phenology of non-diapause grasshopper species are more susceptible to warming than those of diapause species, the responses of developmental traits in conspecifically different populations to climate warming remain unknown. Here, we compared the mtDNA sequences and embryonic development of eight populations of grasshopper species (Chorthippus dubius) in field-based manipulated warming and laboratory experiments. The mtDNA sequences showed a significant genetic differentiation of the southernmost population from the other seven populations on the Mongolian Plateau. The embryonic development of the southernmost population was significantly slower than those of the northern populations at the same incubation temperatures. Interestingly, laboratory experiments showed that a significant difference exists in the effective accumulated degree days (EADD) but not in the lower development threshold temperatures (LDTT) among the different populations. The high-latitude populations required less EADD than the low-latitude populations. The warming treatments significantly accelerated the embryonic development in the field and decreased duration from embryos to hatchlings of all eight populations in the incubation. In addition, warming treatments in field significantly increased EADD requirement per stage in the incubation. Linear regression model confirmed that the embryonic development characteristics of eight populations were correlated with the annual mean temperature and total precipitation of embryonic development duration. The results indicated that grasshopper species have evolved a strategy of adjusting their EADD but not their LDTT to adapt to temperature changes. The variations in the EADD among the different populations enabled the grasshopper eggs to buffer the influences of higher temperatures on development and preserve their univoltine nature in temperate regions while encountering warmer climatic conditions. Thus, the findings of this study is valuable for our understanding species variation and evolution, and as such has direct implication for modeling biological response to climate warming.
Introduction
The responses of the developmental rates of insects to climate warming are a major issue in ecology, contributing to the understanding and prediction of the distributions, phenological patterns and diversity conservation of insects under conditions of global change (Deutsch et al., 2008; Duffy et al., 2015; Garcia-Robledo et al., 2016). Studying the developmental traits of insects across environmental gradients offers the opportunity to make predictions about the effects of future climate warming on the distribution, persistence and ecosystem stability of insects (Harrington et al., 2001; Hagen et al., 2007; Parmesan, 2007; Rasmann et al., 2014). As ectothermic animals, insects are an important functional group that is highly susceptible to environmental temperature changes in terrestrial ecosystems. Documented temporal responses of insects to climate warming include shifts in their distribution and advance in their biological phenology (Bale et al., 2002; Gardner et al., 2011; Ohlberger and Fox, 2013; Parmesan et al., 2013). For example, as temperatures increased by 1–1.5°C from 1988 to 2002 in the Mediterranean region, the first occurrence times of 5 species advanced 1–7 weeks in 16 investigated butterfly species, and the peak periods of 8 species were significantly advanced for 1–5 weeks in 18 investigated butterfly species (Stefanescu et al., 2003). In the last century, 63% of 35 non-migrating butterfly species in Europe expanded their distributions northward by 35–240 km (Parmesan et al., 1999). These aspects are associated with the developmental rate shift of a given species and environmental temperature variations, especially the developmental rate of the insect species, which is highly correlated with the physiological and ecological traits of the insect. However, the underlying mechanism that only certain groups of insect species expand their distributions or advance their phenologies while others do not is not clear.
Environmental thermal gradients, such as those that exist across latitudes and elevations, are expected to yield a range of development rates for insects (Bale et al., 2002; Blanckenhorn and Demont, 2004; Parmesan, 2006, 2007; Bonebrake and Deutsch, 2012; Nilsson-Ortman et al., 2012, 2013a,b). Therefore, latitudinal or elevational changes in the gradients are expect for investigating the responses and adaptations of insects to climate warming, as well as for developing a better understanding of the potential impacts of changing temperatures on terrestrial organisms (De Frenne et al., 2013). Insect species distributed along latitudinal gradients may form geographic clines resulting from their long-term adaptations to local temperatures and the length of their growing seasons. These clines have the potential to supplement the scarcity of manipulation experiments by investigating the responses of organisms to climate warming.
Individuals living in cold, high-latitude environments maintain higher developmental rates than those living in warm, low-latitudinal environments; this effect is termed latitudinal compensation (Rhymer, 1992; Yamahira and Conover, 2002) and reflects the local adaptation of population to the short growth periods prevalent in high-latitudinal environments (Yamahira et al., 2007). In general, the use of latitudinal gradients is still an underutilized study resource in this aspect (De Frenne et al., 2013). Hence, understanding the life history evolution of organisms along latitudinal gradients can become an increasingly important focus that may help researchers interpret changes in response to climate warming over time and the potential impacts of climate warming on ecosystems (Zera and Harshman, 2001; Millien et al., 2006). To date, although some studies have reported that populations of insects living at lower latitudes have lower developmental rates than conspecifics living at higher latitudes under the same incubation temperatures (Niewiarowski and Angilletta, 2008; Nilsson-Ortman et al., 2013a; Ohlberger and Fox, 2013), there are no field-based manipulated warming experiments in which the developmental responses of widely distributed insect populations from different latitudes are compared in response to climate warming.
Diapause is an important biological trait that can be used to determine the responses of insects to climate warming. Variant grasshopper species with diapause or non-diapause traits can differentially respond to warming treatments. The warming treatments applied in previous studies have resulted in contrasting effects on different grasshopper species depending on their diapause-related traits (Guo et al., 2009). Warming did not significantly advance the hatching phenologies of grasshopper species that undergo diapause, whereas the phenologies of non-diapause species were significantly advanced (Guo et al., 2009). Diel asymmetric warming experiments have revealed that nighttime warming is more effective than daytime warming in advancing the egg development of non-diapause grasshopper species (Wu et al., 2012). Diapause can buffer the effect of warming associated with an advanced insect developmental rate, thus determining the response patterns of insects to climate warming and whether their distributions and phenologies are altered. However, the differential responses of conspecifically different populations of non-diapause insects to climate warming have not been well investigated.
The non-diapause grasshopper species Chorthippus dubius is widely distributed in Eurasian grasslands (Bey-Bienko and Mistshenko, 1951; Yin, 1984; Childebaev and Storozhenko, 2001; Li et al., 2007). Despite its very broad geographic distribution along latitudes, this grasshopper species maintains a strictly univoltine life cycle across its distribution range (Kang and Chen, 1995; Zheng, 1998). Thus, we hypothesize that different populations of C. dubius may respond differently to temperature warming and attempt to determine how these populations remain univoltine in low- and high-latitude locations under climate warming. We conducted comparative experiments on eight conspecific populations along a transect with a latitude gradient of approximately 10 degrees (nearly 1,000 km) on the Mongolian Plateau and adjacent area. First, we analyzed the genetic differentiation and phylogeography of the different populations based on mtDNA sequences. Second, we investigated variation in lower development threshold temperatures (LDTT) and effective accumulated degree days (EADD) of grasshoppers from these populations in the laboratory. Third, a set of field-based warming experiments on eight geographic populations were performed to compare the variations in embryonic development. Our results indicated that to some extent, non-diapause grasshopper species can adjust their developmental duration and EADD to temperature warming.
Materials and Methods
Grasshopper Sampling Sites
To collect the grasshoppers, we selected eight sites to form a north-south transect comprising 7 sites on the Mongolian Plateau and 1 adjacent site in Hebei Province (Figure 1). The sampling sites covered approximately 10 degrees of latitude and a distance of more than 1,000 km from north to south. Along this transect, we collected eight populations of C. dubius from Erguna (ER), Dongqi (DQ), Dongwuqi (DW), Xiwuqi (XW), Dingweizhan (DWZ), Lanqi (LQ), Taiqi (TQ), and Wanquan (WQ) (Figure 1) in early September 2010 and 2011. The northernmost population (ER) was located at an elevation of 500 m at 50° 14′ N and 120° 12′ E, while the southernmost population (WQ) was at an elevation of 850 m at 40° 30′ N and 114° 15′ E. The annual mean temperature (AMT) at the eight sites, consisting of a temperature gradient from north to south, varied from -2.0 to 8.3°C. The mean temperature of embryonic development duration (MTEDD) from April to June ranged from 12.9 to 18.6°C. The annual total precipitation (ATP) ranged from 251.0 to 383.4 mm. The total precipitation of embryonic development duration (TPEDD) from April to June ranged from 83.1 to 120.3 mm (Table 1, data are collected by local weather station). Sampling sites were separated from each other by at least 100 km (approximately 1° latitude) with a sampling area of about 2–6 square kilometers for each site. In fact, the latitudinal gradient spanning 1,000 km covered the main distribution range of the grasshopper species from north to south in Eurasian steppe regions, with substantial variations in climate conditions overall (Figure 1 and Table 1).
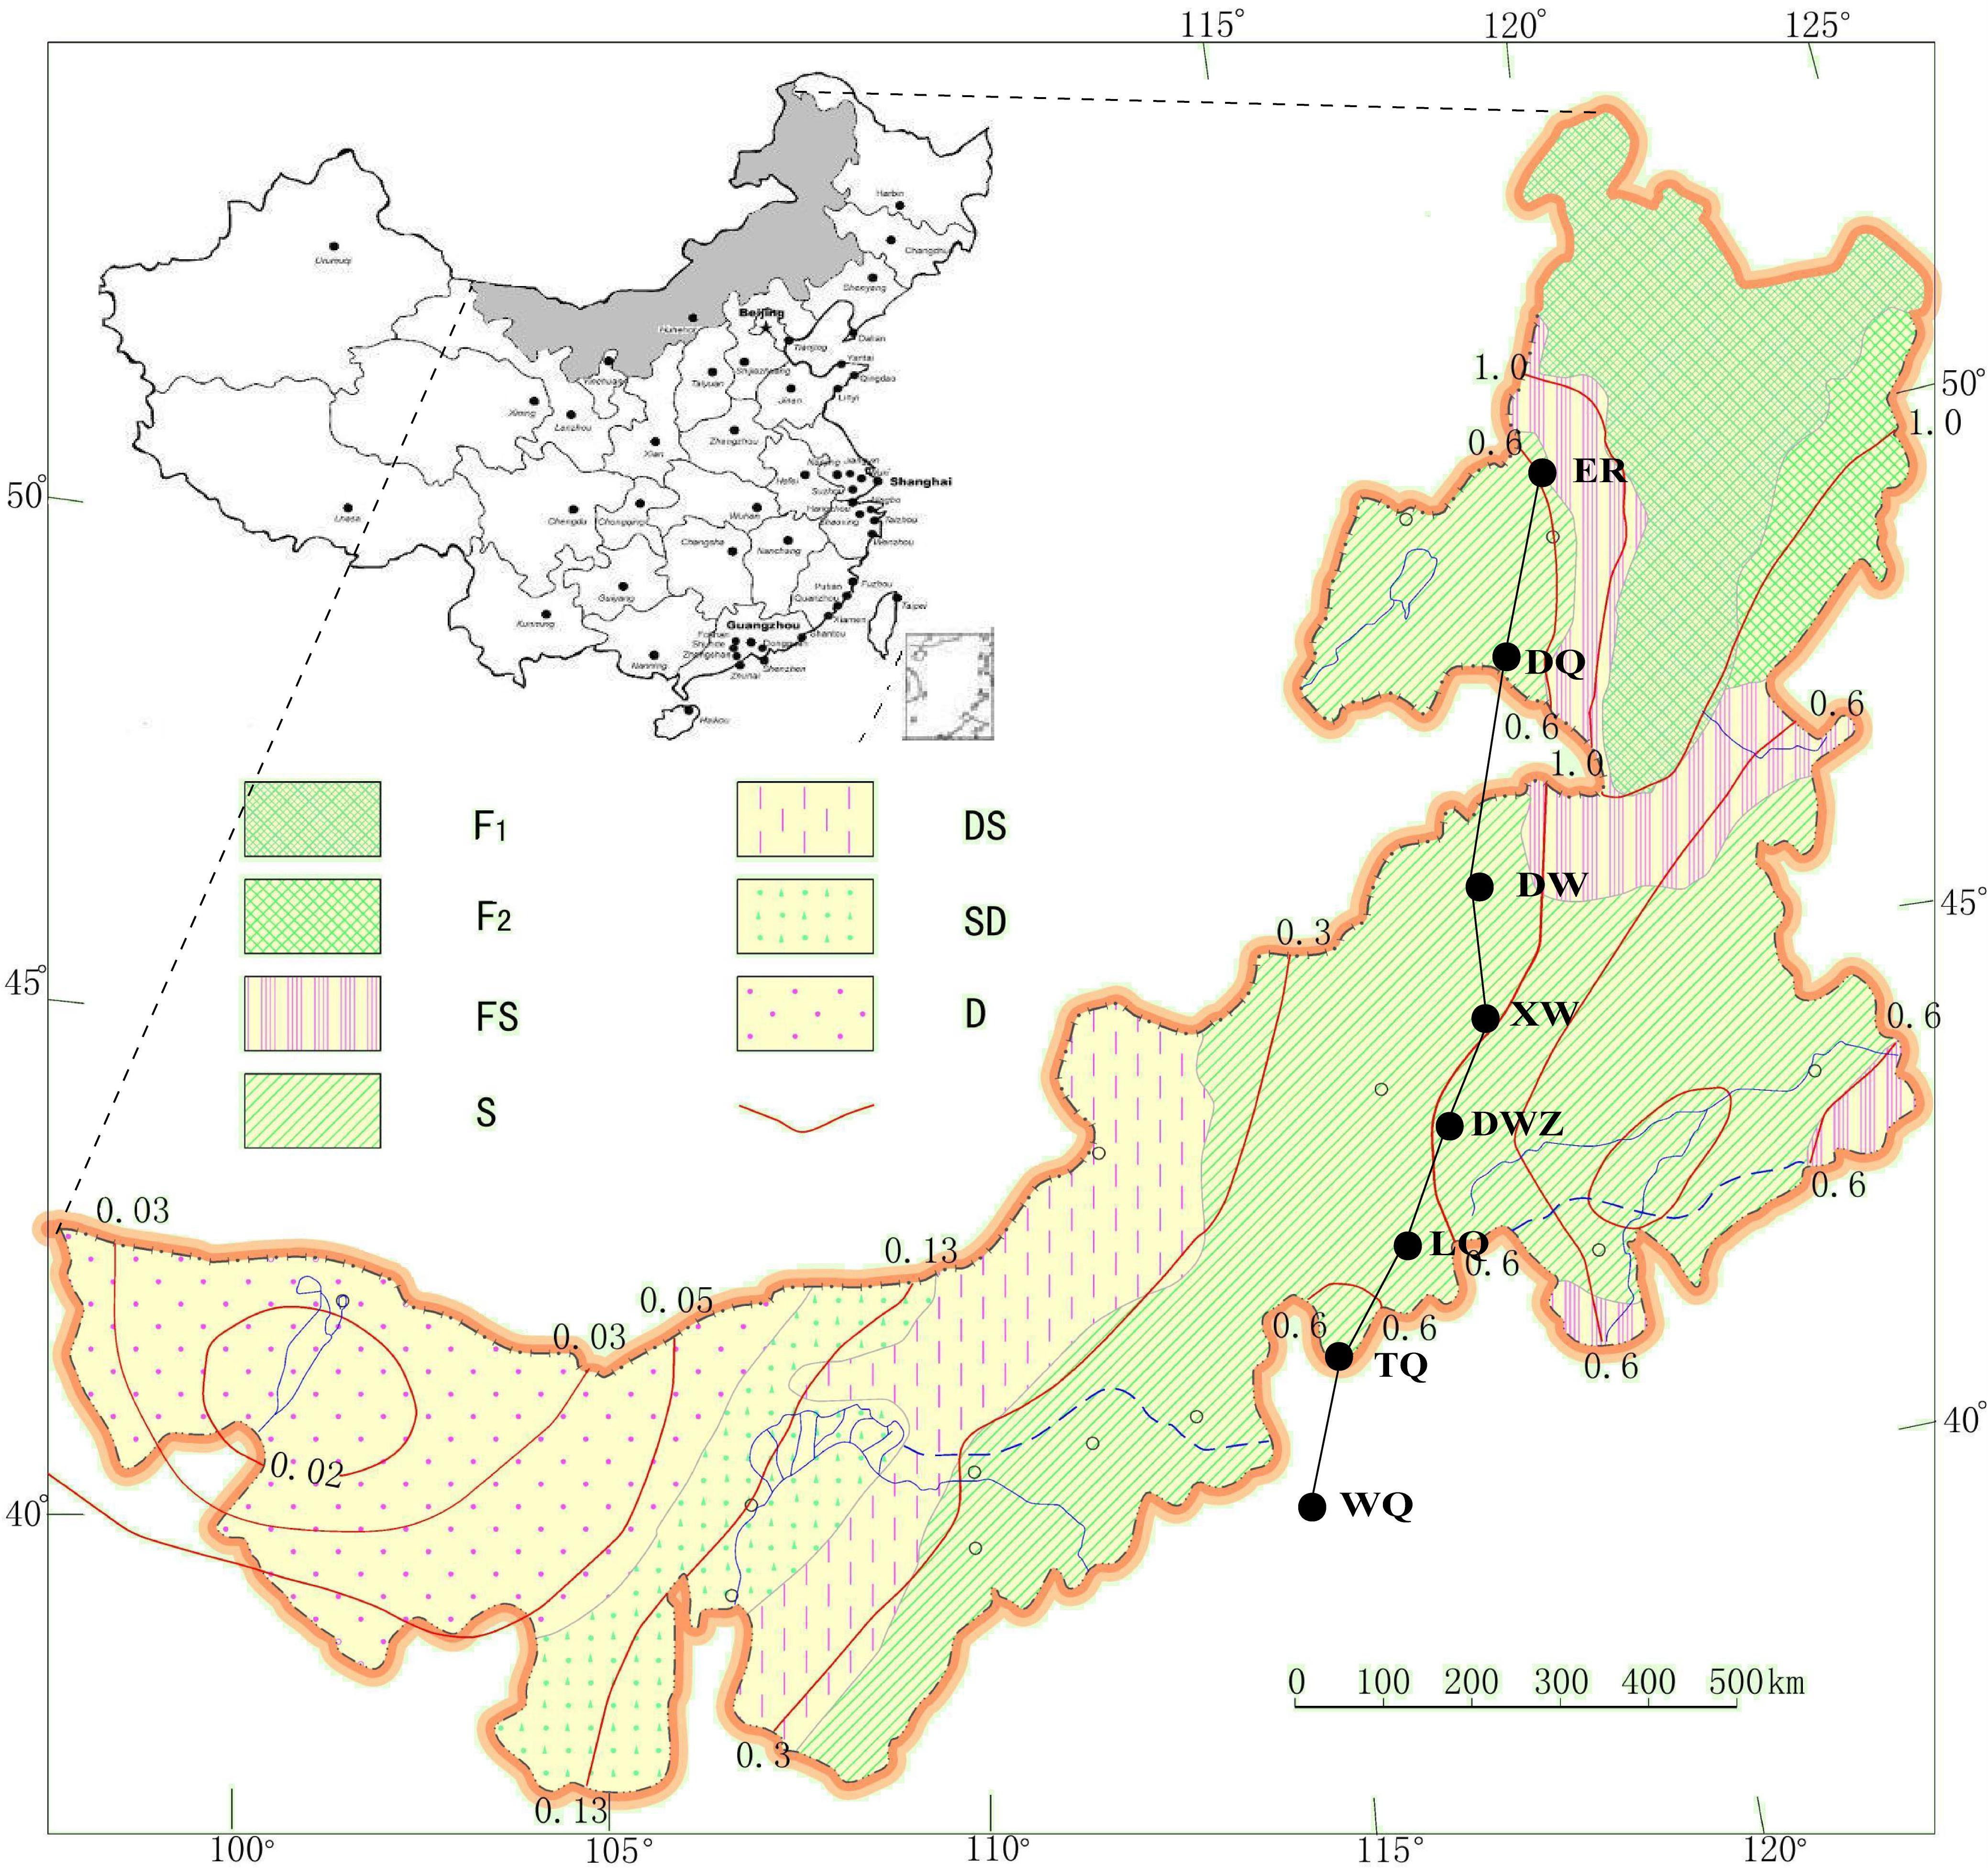
Figure 1. Locations of the geographic populations from which adult grasshoppers Chorthippus dubius were collected in early September 2010 and 2011. The sampling sites are shown from north (N) to south (S) as black circles: ER (Erguna), DQ (Dongqi), DW (Dongwuqi), XW (Xiwuqi), DWZ (Dingweizhan), LQ (Lanqi), TQ (Taiqi), and WQ (Wanquan) from north to south. F1, Light coniferous forest zone of the cold-temperate type; F2, Deciduous broad-leaf forest zone of the mid-temperate type; FS, Forest steppe zone. TS; Typical steppe zone. DS, Desert steppe zone; SD, Steppe desert subzone of the warm-temperate type; TD, Typical desert subzone of the warm-temperate type; Red line, isoline of the moisture index. The map is adopted from Li et al. (2007).
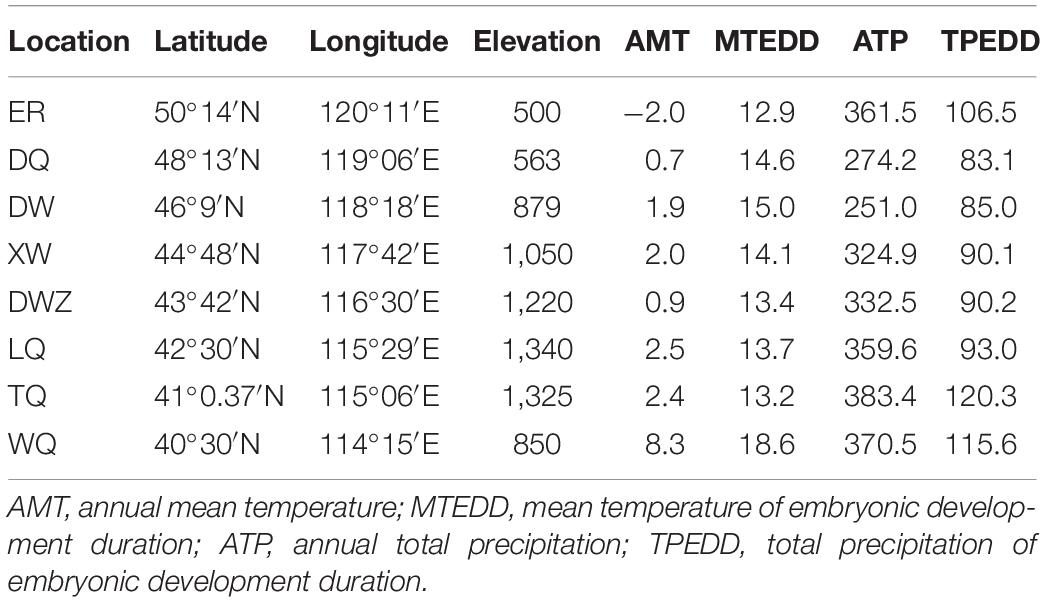
Table 1. Environmental data of sampling sites.
Collection of Grasshopper Adults and Eggs
The Chorthippus dubius eggs hatched in early July each year, and adults developed in late August. Because the peak adult abundance occurred approximately 10 days later in the southernmost WQ population than in the northernmost ER population by field observation, the collections of adult grasshoppers were completed from the northernmost ER site to the southernmost WQ site over 10-day periods in early September 2010 and 2011. We collected more than 600 adult grasshoppers (female:male = 1:1) from each of the eight sites and brought them to the laboratory at the Research Station of Inner Mongolia for the egg collection.
Adult grasshoppers from each population were separately reared in two wooden cages (60 cm × 60 cm × 60 cm), each with five holes at the bottom where plastic pots (with both diameter and height of 15 cm) full of sterilized sand were placed for egg laying. Approximately 300 adult grasshoppers were randomly placed in each cage at a sex ratio of 1:1. Therefore, the experiment used a total of 16 cages to rear eight geographic populations of grasshoppers. All grasshoppers were fed fresh grasses (Leymus chinensis and Stipa grandis) and bran. Two 40-W incandescent lamps were installed at the top of each rearing cage to increase the interior temperature to 30 ± 1°C during the day and to 20 ± 1°C at night with a photoperiod of 14:10 h (light:dark), which was similar to the temperature and photoperiod in the local field. The temperature and photoperiod of the rearing cages were autoregulated by a temperature and photoperiod controller. We collected egg pods from the rearing cages every 2 days and transferred the eggs to plastic cups (6 cm in diameter × 10 cm in height) filled with sterilized sand (sifted through a 40 mesh filter) with 8% moisture content. These eggs were then stored at 8 ± 1°C to restrict their development and ensure that the embryos were at the beginning of development until sufficient egg pods were collected for use in the field experiments (Hao and Kang, 2004a,b).
Mitochondrial DNA Sequencing and Correlation Analyses
We selected 11–30 female adult individuals from the eight studied populations to sequence and analyze their mtDNA differentiation and phylogeographic structure. The protocol for the mtDNA extraction, amplification, and sequencing was as per Ma et al. (2012). Our preliminary sequencing experiments revealed that the mtDNA segments spanning cob (encoding cytochrome b), trnS (tRNA-Ser), nad1 (NADH dehydrogenase subunit 1), and trnL (tRNA-Leu) and partial rrnL (16S ribosomal RNA) were more variable than other parts of the mtDNA. These segments were amplified using LA-Taq (Takara Co., Dalian, China) with the following cycling settings: 95°C for 1 min; 30 cycles of 98°C for 10 s and 60°C for 10 s; 65°C for 3 min; and 65°C for 5 min. Then, the PCR products were sequenced via primer walking in an ABI 3,730 × 1 DNA Analyzer (Table 2). We assembled the sequencing data into a consecutive sequence using SeqMan software (DNAStar, Inc.). The haplotype and nucleotide diversity were calculated using DnaSP5.10.01 (Librado and Rozas, 2009). To assess the genetic differentiation among population samples, ΦST was calculated using Arlequin 3.5 (Excoffier and Lischer, 2010) with 20,000 permutations (Table 3). The Tamura and Nei model selected by the jModel test (Posada, 2008) was used. To investigate the genealogical relationships among haplotypes, a median-joining network was constructed using PopART (Leigh et al., 2015). To confirm whether sampling involved a single, widely distributed species, we calculated the Isolation By Distance (IBD) among the eight grasshopper populations using Mantel test analyses in software GenAlEx6.51b2. Finally, we calculated the correlations between the pairwise ΦST and latitudinal/temperature difference using Mantel test analyses.
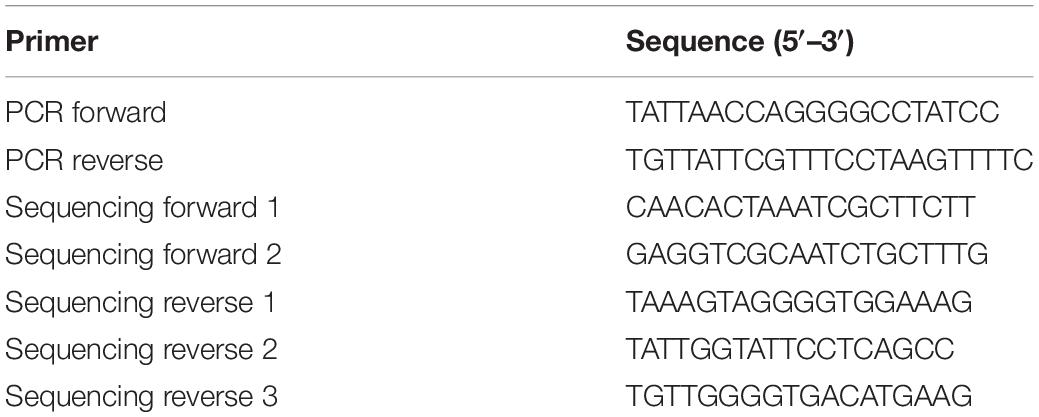
Table 2. PCR and sequencing primers.
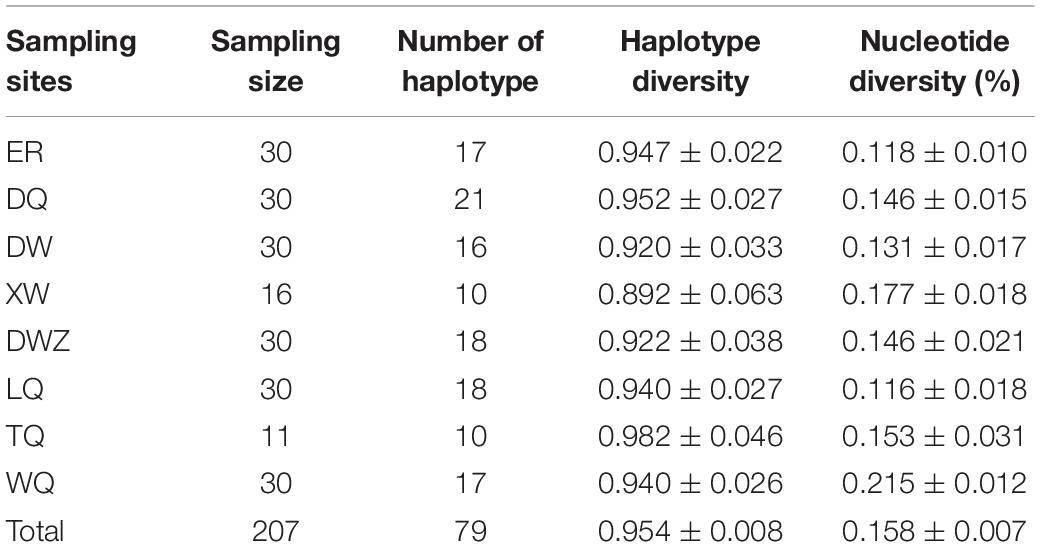
Table 3. Haplotype number, haplotype diversity, and nucleotide diversity of mitochondrial DNA (mtDNA) of Chorthippus dubius.
Determination of Egg Lower Development Threshold Temperatures, Effective Accumulated Degree Days, and Relative Sensitivity Index
To accurately measure the lower development threshold temperatures (LDTT) and effective accumulated degree days (EADD) of the eggs obtained from the studied grasshopper populations, we investigated the development of the eggs at constant temperatures in the laboratory. After collecting sufficient egg pods from the rearing cages, we placed 10 egg pods at a depth of 2 cm within plastic cups filled with sterilized sand (sifted through a 40-mesh filter) with 8% moisture content. We placed the cups with eggs in climate-controlled chambers in which constant temperatures of 15, 20, 25, 30, and 35 ± 1°C were maintained for the subsequent hatching of the eggs. We recorded and removed the hatchlings and dead eggs in each cup daily for up to 120 days at 15 and 20°C and up to 60 days for the other temperatures because egg development was rapid at temperatures above 25°C. If the eggs turned flaccid, brown, or moldy, they were determined dead. Otherwise, eggs that were cream colored and turgid were considered alive (Hao and Kang, 2004b). Because there were more than 100 eggs in each cup, we used the live eggs to calculate the embryonic duration at different constant temperatures. The LDTT and EADD were calculated using the linear regression equation EADD = (T – LDTT) × D, where T is the temperature in the chambers and D represents the embryonic duration in days to hatchlings at different constant temperatures. In addition, we defined a relative sensitivity index (RSI) for the development of grasshopper embryos to warming representing the percent change in the developmental duration between the warming and control treatments. RSI = (accumulated degree-days for embryo development in the control treatment – accumulated degree-days for embryo development in the warming treatment)/accumulated degree-days for embryo development in the control treatment.
Embryonic Development in Response to Warming
To investigate the embryonic development duration and the responses of the embryonic stages of each population to climate warming, we set up field-based warming experiments at the Research Station of Inner Mongolia in Duolun County from October 2010 to July 2011. This research station is located in a semiarid steppe region (42°02′N, 116°17′E; 1324 m in elevation), where the annual mean temperature is 1.6°C and the annual total precipitation and potential evaporation average 386 and 1,748 mm, respectively.
We conducted a set of field-based warming experiments with five replicated blocks spaced at 5-m intervals; each block included two plots for warming and control treatments spaced 2 m apart. The warming treatment was achieved by suspending a 165-cm (L) × 15-cm (W) MSR-2420 infrared radiator (Kalglo Electronics, Bethlehem, PA, United States) 1.85 m above each plot. The soil temperature was increased by 1.5–2°C via this treatment (Guo et al., 2009; Wu et al., 2012). For each geographic population, we embedded 10 egg pods; each with a minimum of 100 initially synchronized eggs, into plastic cups at a 3-cm depth and then randomly buried two egg cups from each population at the soil surfaces in all 10 plots on 15 October 2010. On 10 June of the following year, we retrieved the egg cups from the field plots and returned them to the laboratory to determine the embryonic stages and embryonic duration to hatchlings. As two cups of eggs were analyzed for each geographic population in all plots, we used one cup to determine the embryonic stages according to the embryonic morphological traits (Van Horn, 1966) by dissecting the eggs under a microscope. We transferred another cup to an incubator for hatching in the laboratory with a daytime temperature of 30 ± 1°C (20 ± 1°C at night) and a relative humidity of 60 ± 10%. The embryonic development of the grasshoppers was divided into 27 developmental stages according to embryonic morphogenesis (Van Horn, 1966). We recorded and removed hatchlings and dead eggs daily and ended the experiment after 60 days.
Statistical Methods
Analysis of variance (ANOVA) were used to analyze differences in the lower development threshold temperatures (LDTT) and effective accumulated degree days (EADD) among different geographical populations. Embryonic stages and embryonic duration to hatchlings between the warming and control treatments were analyzed by independent samples t-tests. Pearson correlations were calculated between a series of developmental parameters and the annual mean temperature (AMT), mean temperature of embryonic development duration (MTEDD), annual total precipitation (ATP), and mean precipitation of embryonic development duration (MPEDD), respectively. Differences were considered significant at P < 0.05. Values are reported as Mean ± SE. Data were analyzed using IBM SPSS Statistics v.19 software (SPSS Inc.).
Results
Relationship Between Genetic Differentiation and Environmental Factors Among Grasshopper Populations
To test the relationships between genetic differentiation and latitude or temperature, the mtDNA of all eight populations were sequenced. Our study identified mtDNA sequences consisting of four whole gene sequences of cob, trnS, nad1, and trnL and a partial sequence of rrnL; the final data matrix spanned 3,189 bp in length. A total of 79 haplotypes were identified in 207 individuals from eight population samples. Overall, the mtDNA data comprised high haplotype diversity (0.954 ± 0.008) and low nucleotide diversity (0.158 ± 0.007%) in the eight populations. The median-joining haplotype network displayed no split among populations (Figure 2A), although these population samples represent a latitudinal gradient of approximately 10°. To confirm whether sampling involved a single, widely distributed species, we calculated the Isolation By Distance (IBD) among the eight grasshopper populations. The results confirmed that variation due to IBD is rejected as indicated by R2 = 0.0366 and P = 0.170 (Figure 2B). The haplotype diversity was similar among the population samples ranging from 0.892 ± 0.063 to 0.952 ± 0.027, whereas the southernmost WQ population exhibited a higher nucleotide diversity (0.215 ± 0.012%) with lower values in other 7 populations on the Mongolian Plateau (Table 3). The southernmost WQ population yielded significant pairwise ΦST values of 0.0830, 0.1266, 0.1575, 0.0388, and 0.0575 with ER, DW, XW, DWZ, and LQ populations, respectively on the Mongolian Plateau (Table 4). The northernmost ER population on the Mongolian Plateau yielded significant pairwise ΦST values of 0.1984, 0.07928, 0.1490, 0.1169, and 0.0830 with the DW, DWZ, LQ, TQ, and WQ populations, respectively (Table 4). The Mantel correlation between the pairwise ΦST of population samples and the latitudinal or temperature differences of the associated sampling sites was not significant as indicated by R2 = 0.0194, P = 0.350 and R2 = 0.0021, P = 0.420, respectively (Figures 2C,D). Therefore, genetic differentiation among these eight grasshopper populations was independent of latitudinal or temperature changes in wild grasslands.
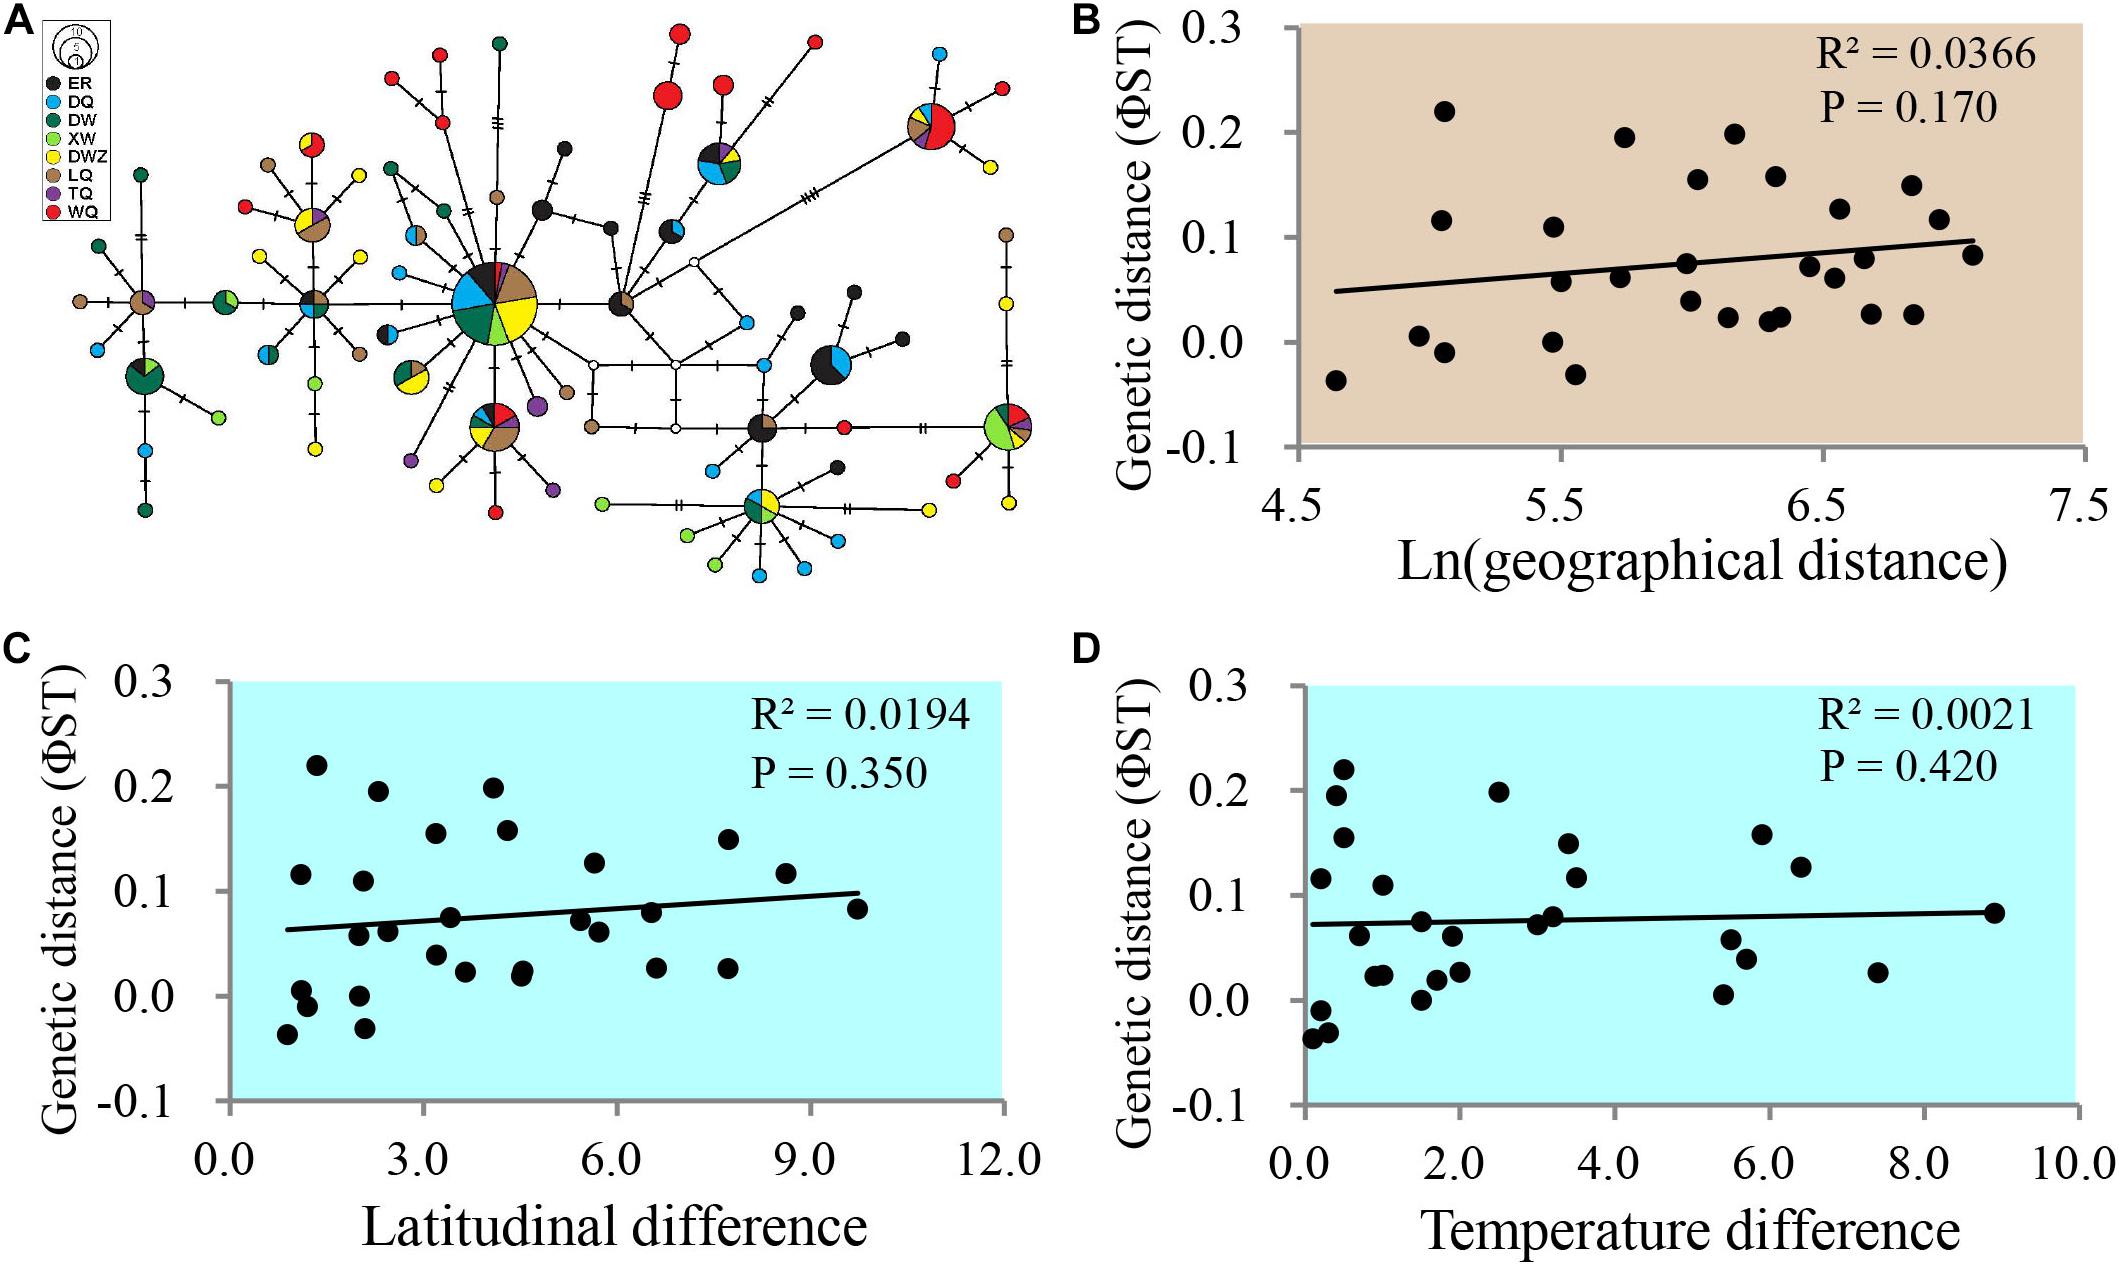
Figure 2. Genetic differentiation among grasshopper populations. (A) Median-joining haplotype network derived from the concatenated cob, trnS, nad1, and trnL and the partial rrnL mitochondrial DNA segments. The circle sizes are proportional to the haplotype frequencies. The small, empty circles represent hypothetical intermediate haplotypes. The colors indicate the population sample of each haplotype. Each hatch mark between joined haplotypes corresponds to a nucleotide substitution. The median-joining network was constructed using PopART software (Leigh et al., 2015). (B) Mantel correlation between the genetic distance (ΦST) of each compared pair of populations and the geographical distance of the associated sampling sites. (C) Mantel correlation between the genetic distance (ΦST) of each compared pair of populations and the latitudinal differences of the associated sampling sites. (D) Mantel correlation between the genetic distance (ΦST) of each compared pair of populations and the temperature differences of the associated sampling sites. R2, adjusted correlation coefficient. P < 0.05 means significant correlation.
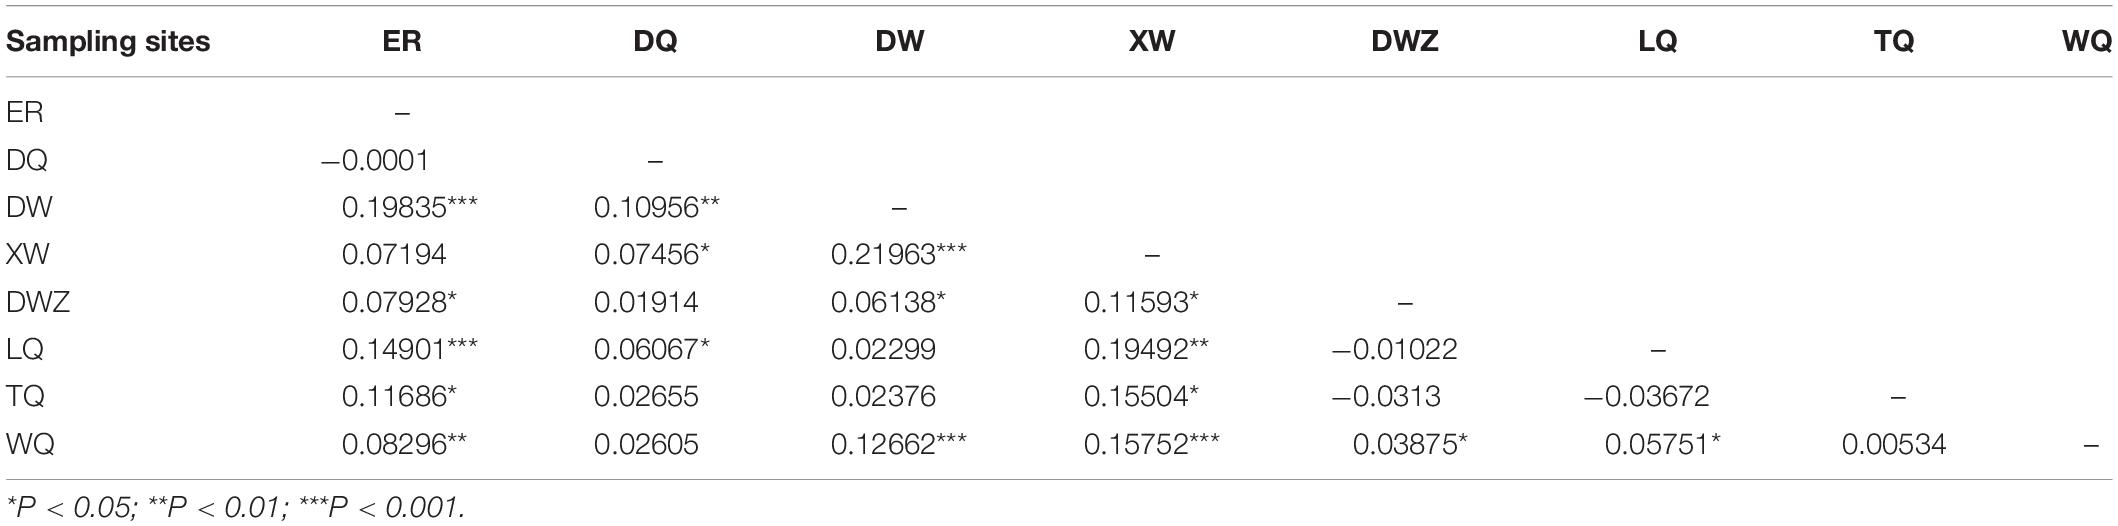
Table 4. Pairwise ΦST values among 8 Chorthippus dubius populations.
Determination of Low Developmental Threshold Temperatures and Effective Accumulated Degree Days
Because the embryonic development of grasshoppers is closely related to the low developmental threshold temperatures (LDTT) and effective accumulated degree days (EADD), we conducted a series of constant temperature experiments to determine the LDTT or EADD of embryos from 8 population samples in the laboratory. LDTT displayed no significant difference among eight geographic populations (Figure 3A). Embryonic duration significantly decreased with increase of incubation temperatures (Figure 3B). At each constant temperature, only the southernmost WQ population showed significantly higher embryonic duration compared to those of the other 7 populations on the Mongolian Plateau (Figure 3B). With the increase of incubation temperatures, the difference in embryonic duration among populations diminished (Figure 3B). The EADD displayed ascending trend beginning from LQ population to WQ population and the WQ population showed a significantly higher EADD than the other 7 populations on the Mongolian Plateau (Figure 3C). With the increase of latitudes, less EADD was required for embryonic development (R2 = 0.537, P = 0.023) (Figure 3D).
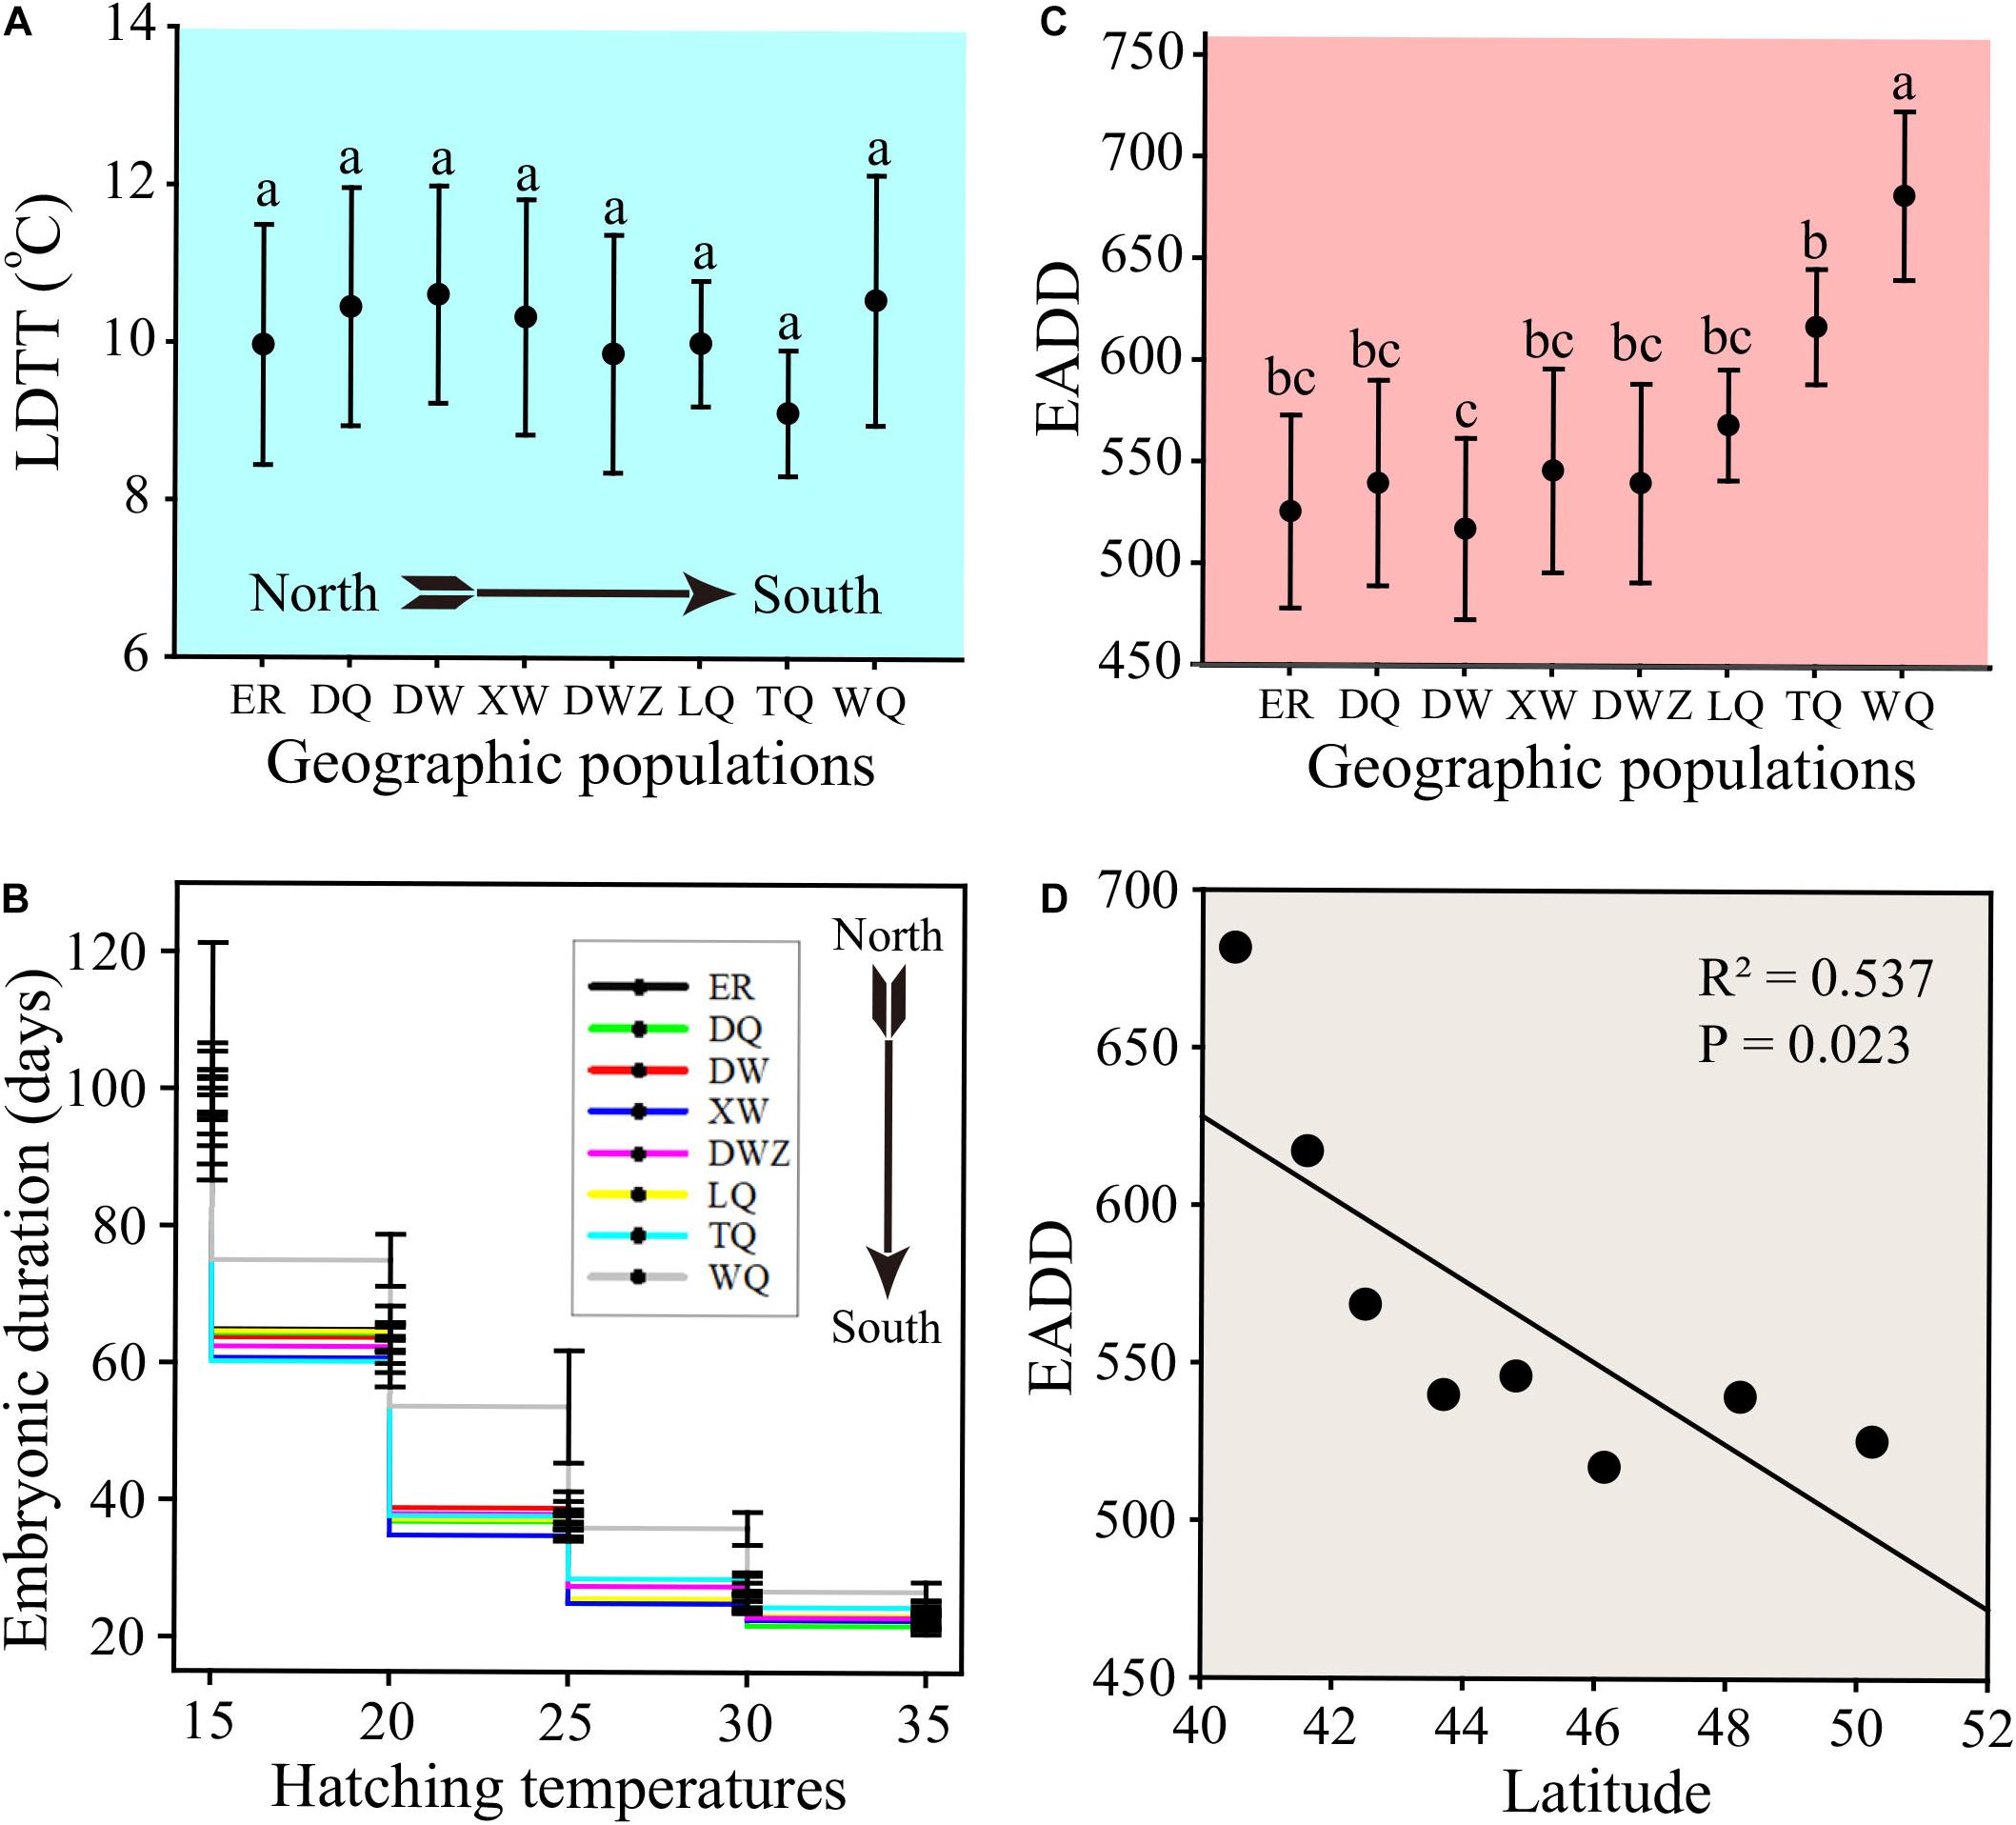
Figure 3. The developmental traits of C. dubius at various constant temperatures. (A) The lower developmental threshold temperatures (LDTT) of eggs collected from different geographical populations. (B) The embryonic duration of eggs collected from different geographic populations at various constant temperatures. (C) The effective accumulated degree days (EADD) of eggs collected from different geographical populations. (D) The correlation of EADD with latitude in different geographical populations.
Embryonic Development in Response to Temperature Warming
We collected eggs from 8 geographic populations and performed all field block warming experiments at the Research Station of Inner Mongolia in Duolun County. The warming treatments significantly accelerated the embryonic stages from all geographic populations (Figure 4A), but the magnitude of this effect varied significantly among different populations. The smallest difference in level was observed in the southernmost WQ population (Figure 4B). After warming treatment in the field, the control and warming eggs were transferred into incubator for hatching in the laboratory. Eggs previously exposed to warming treatment had shorter embryonic duration to hatchlings than eggs from the same population samples under control treatment conditions in the incubator (Figure 4C). Similarly, the warming treatment had the smallest effect on embryonic duration in WQ population (Figure 4D). Although experiencing shorter embryonic duration to hatchlings after warming treatment, the required EADD per stage dramatically increased, indicating long-term temperature warming increased embryonic EADD requirement (Figure 4E). Moreover, the warming effect was more conspicuous on 7 geographical populations on the Mongolian Plateau (Figure 4F).
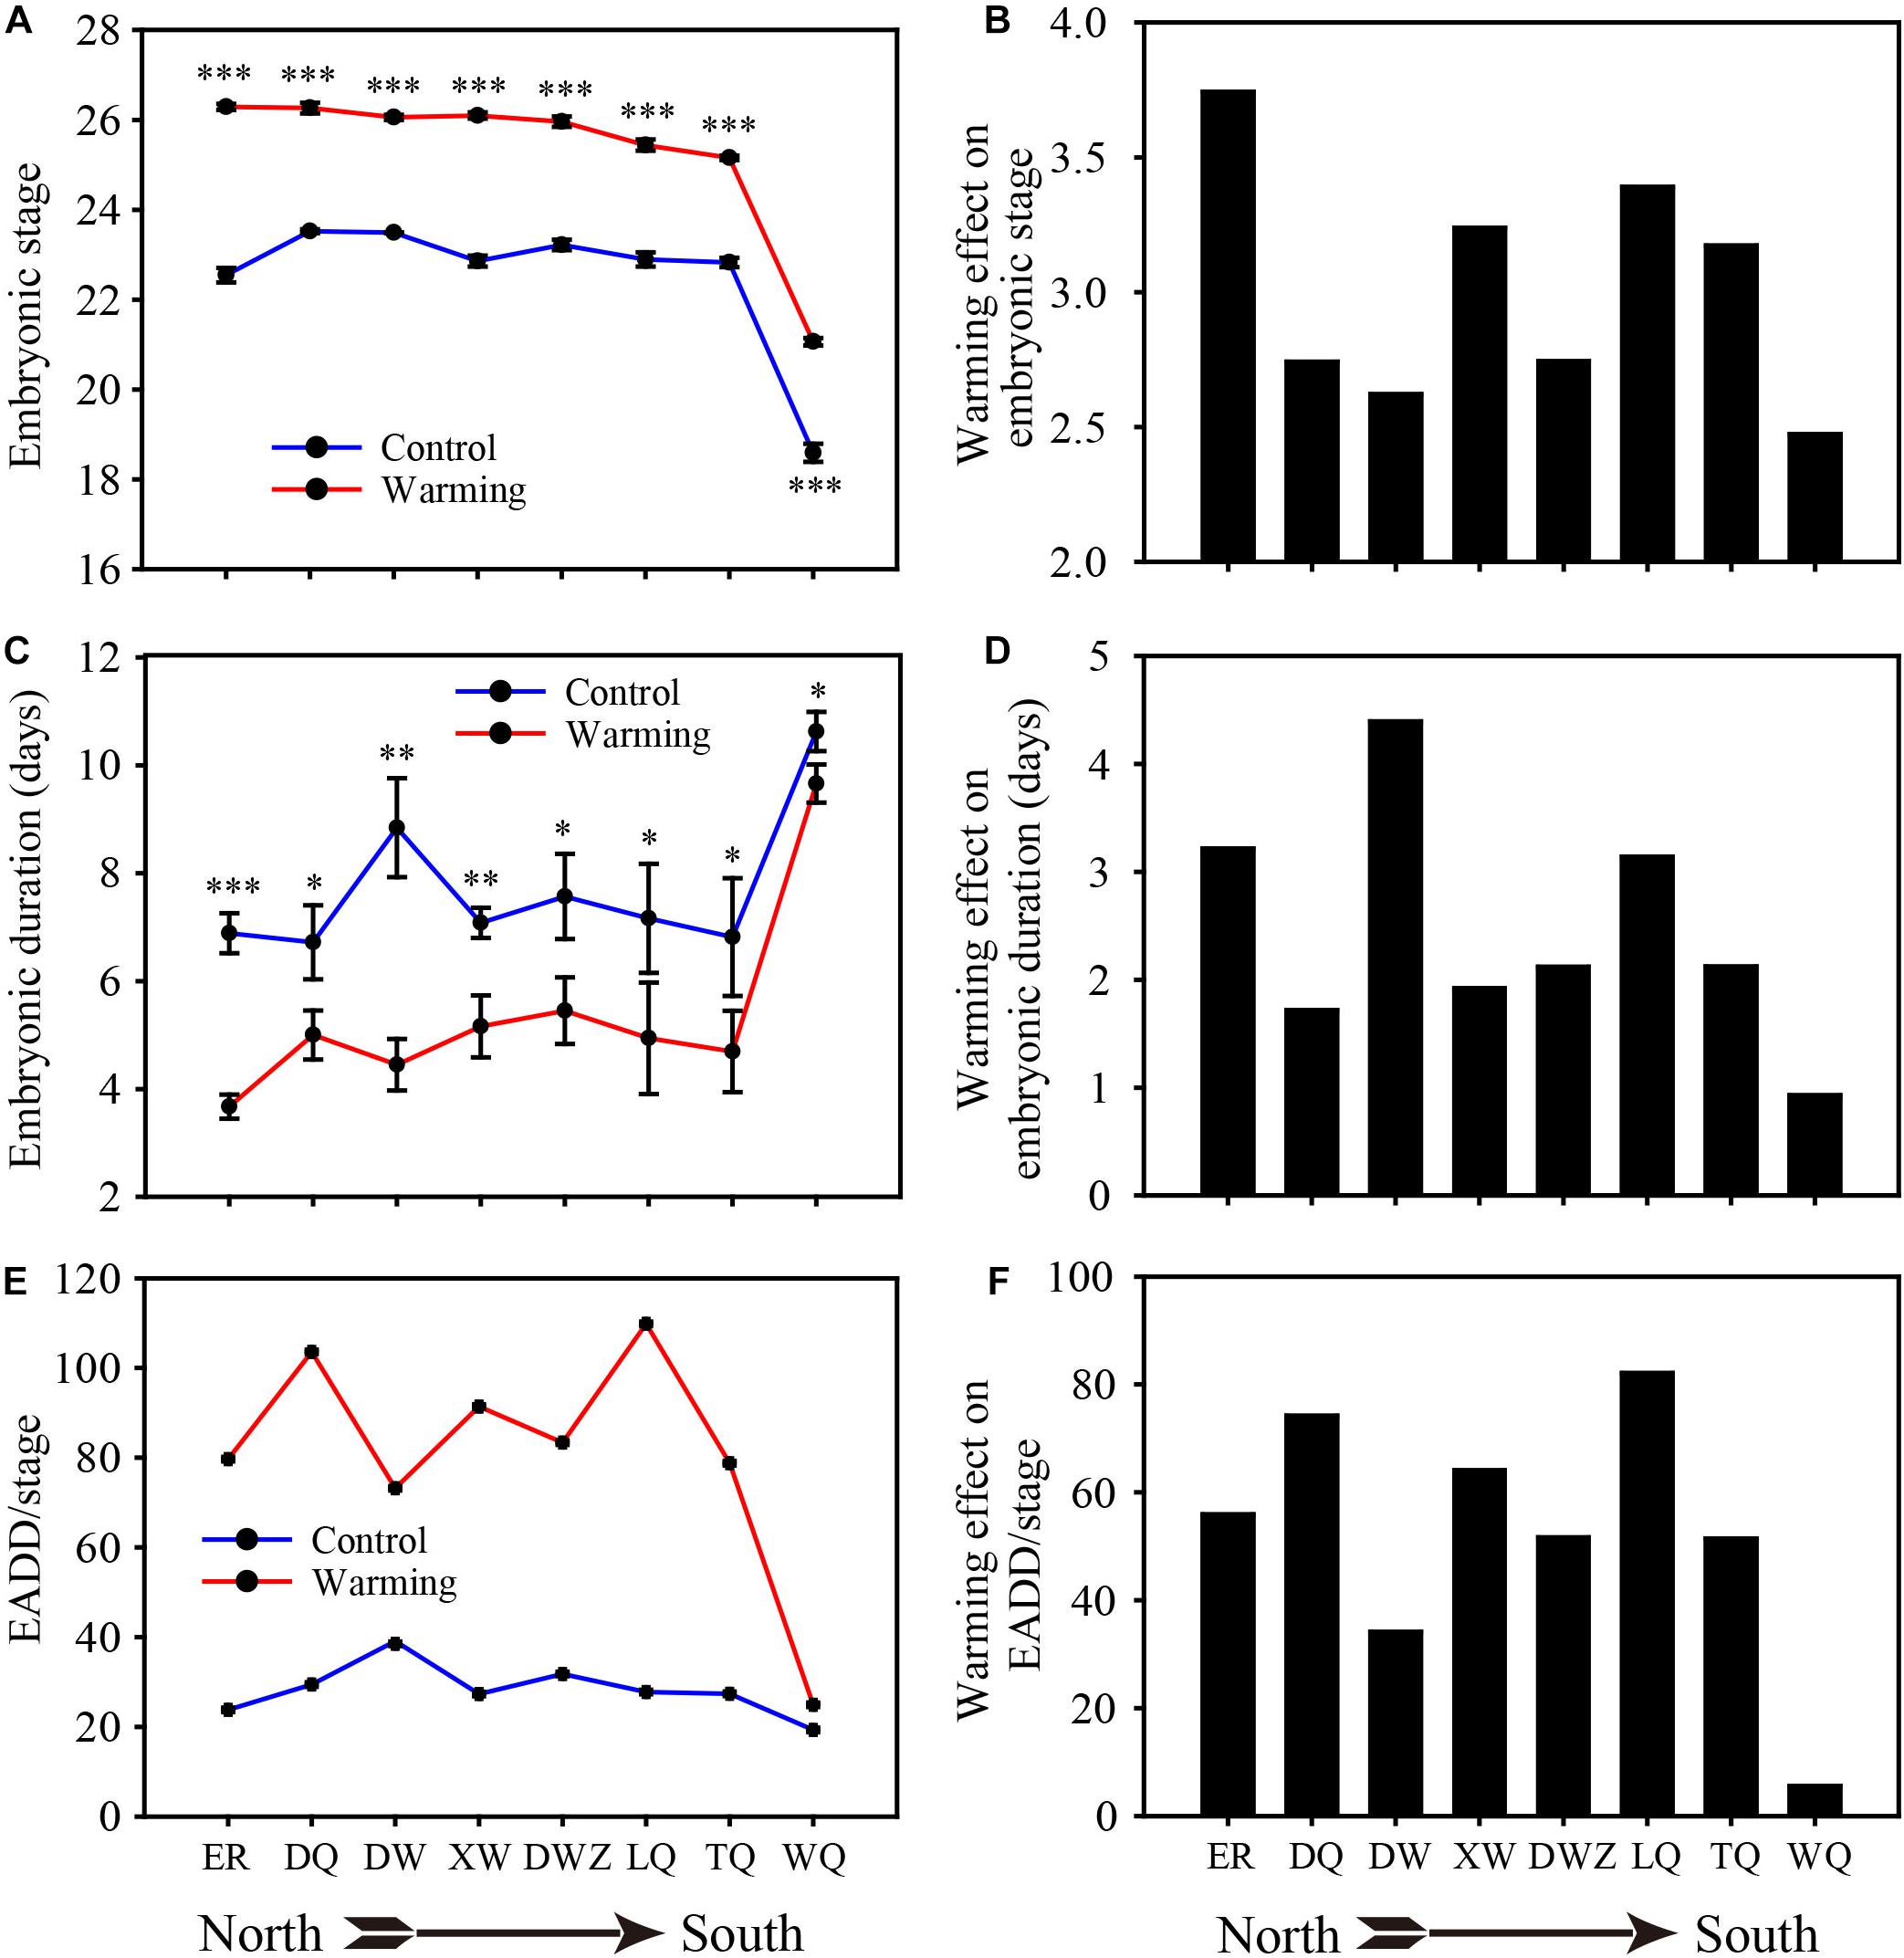
Figure 4. The effects field-warming experiments on embryonic stage, embryonic duration and EADD. (A,B) Mean embryonic stage. (C,D) Embryonic duration. (E,F) EADD per stage. *P < 0.05; **P < 0.01; ***P < 0.001.
Correlation of Embryonic Development Parameters With Environmental Factors
Temperature and precipitation are two main environmental factors that were correlated with egg development. Thus, we performed correlation analyses of EADD or relative sensitivity index (RSI) with annual mean temperature (AMT), mean temperature of embryonic development duration (MTEDD), annual total precipitation (ATP), or total precipitation of embryonic development duration (TPEDD), respectively in geographical populations along latitudes. EADD was significantly correlated with AMT (Figure 5A, R2 = 0.705, P = 0.006) and TPEDD (Figure 5D, R2 = 0.501, P = 0.030), and marginally correlated with MTEDD (Figure 5B, R2 = 0.374, P = 0.063) and ATP (Figure 5C, R2 = 0.289, P = 0.098) in eight populations. However, EADD was not correlated with both AMT and MTEDD (Supplementary Figures 1A,B) and marginally correlated with AMP and MPEDD (Supplementary Figures 1C,D) when southmost WQ population was excluded.
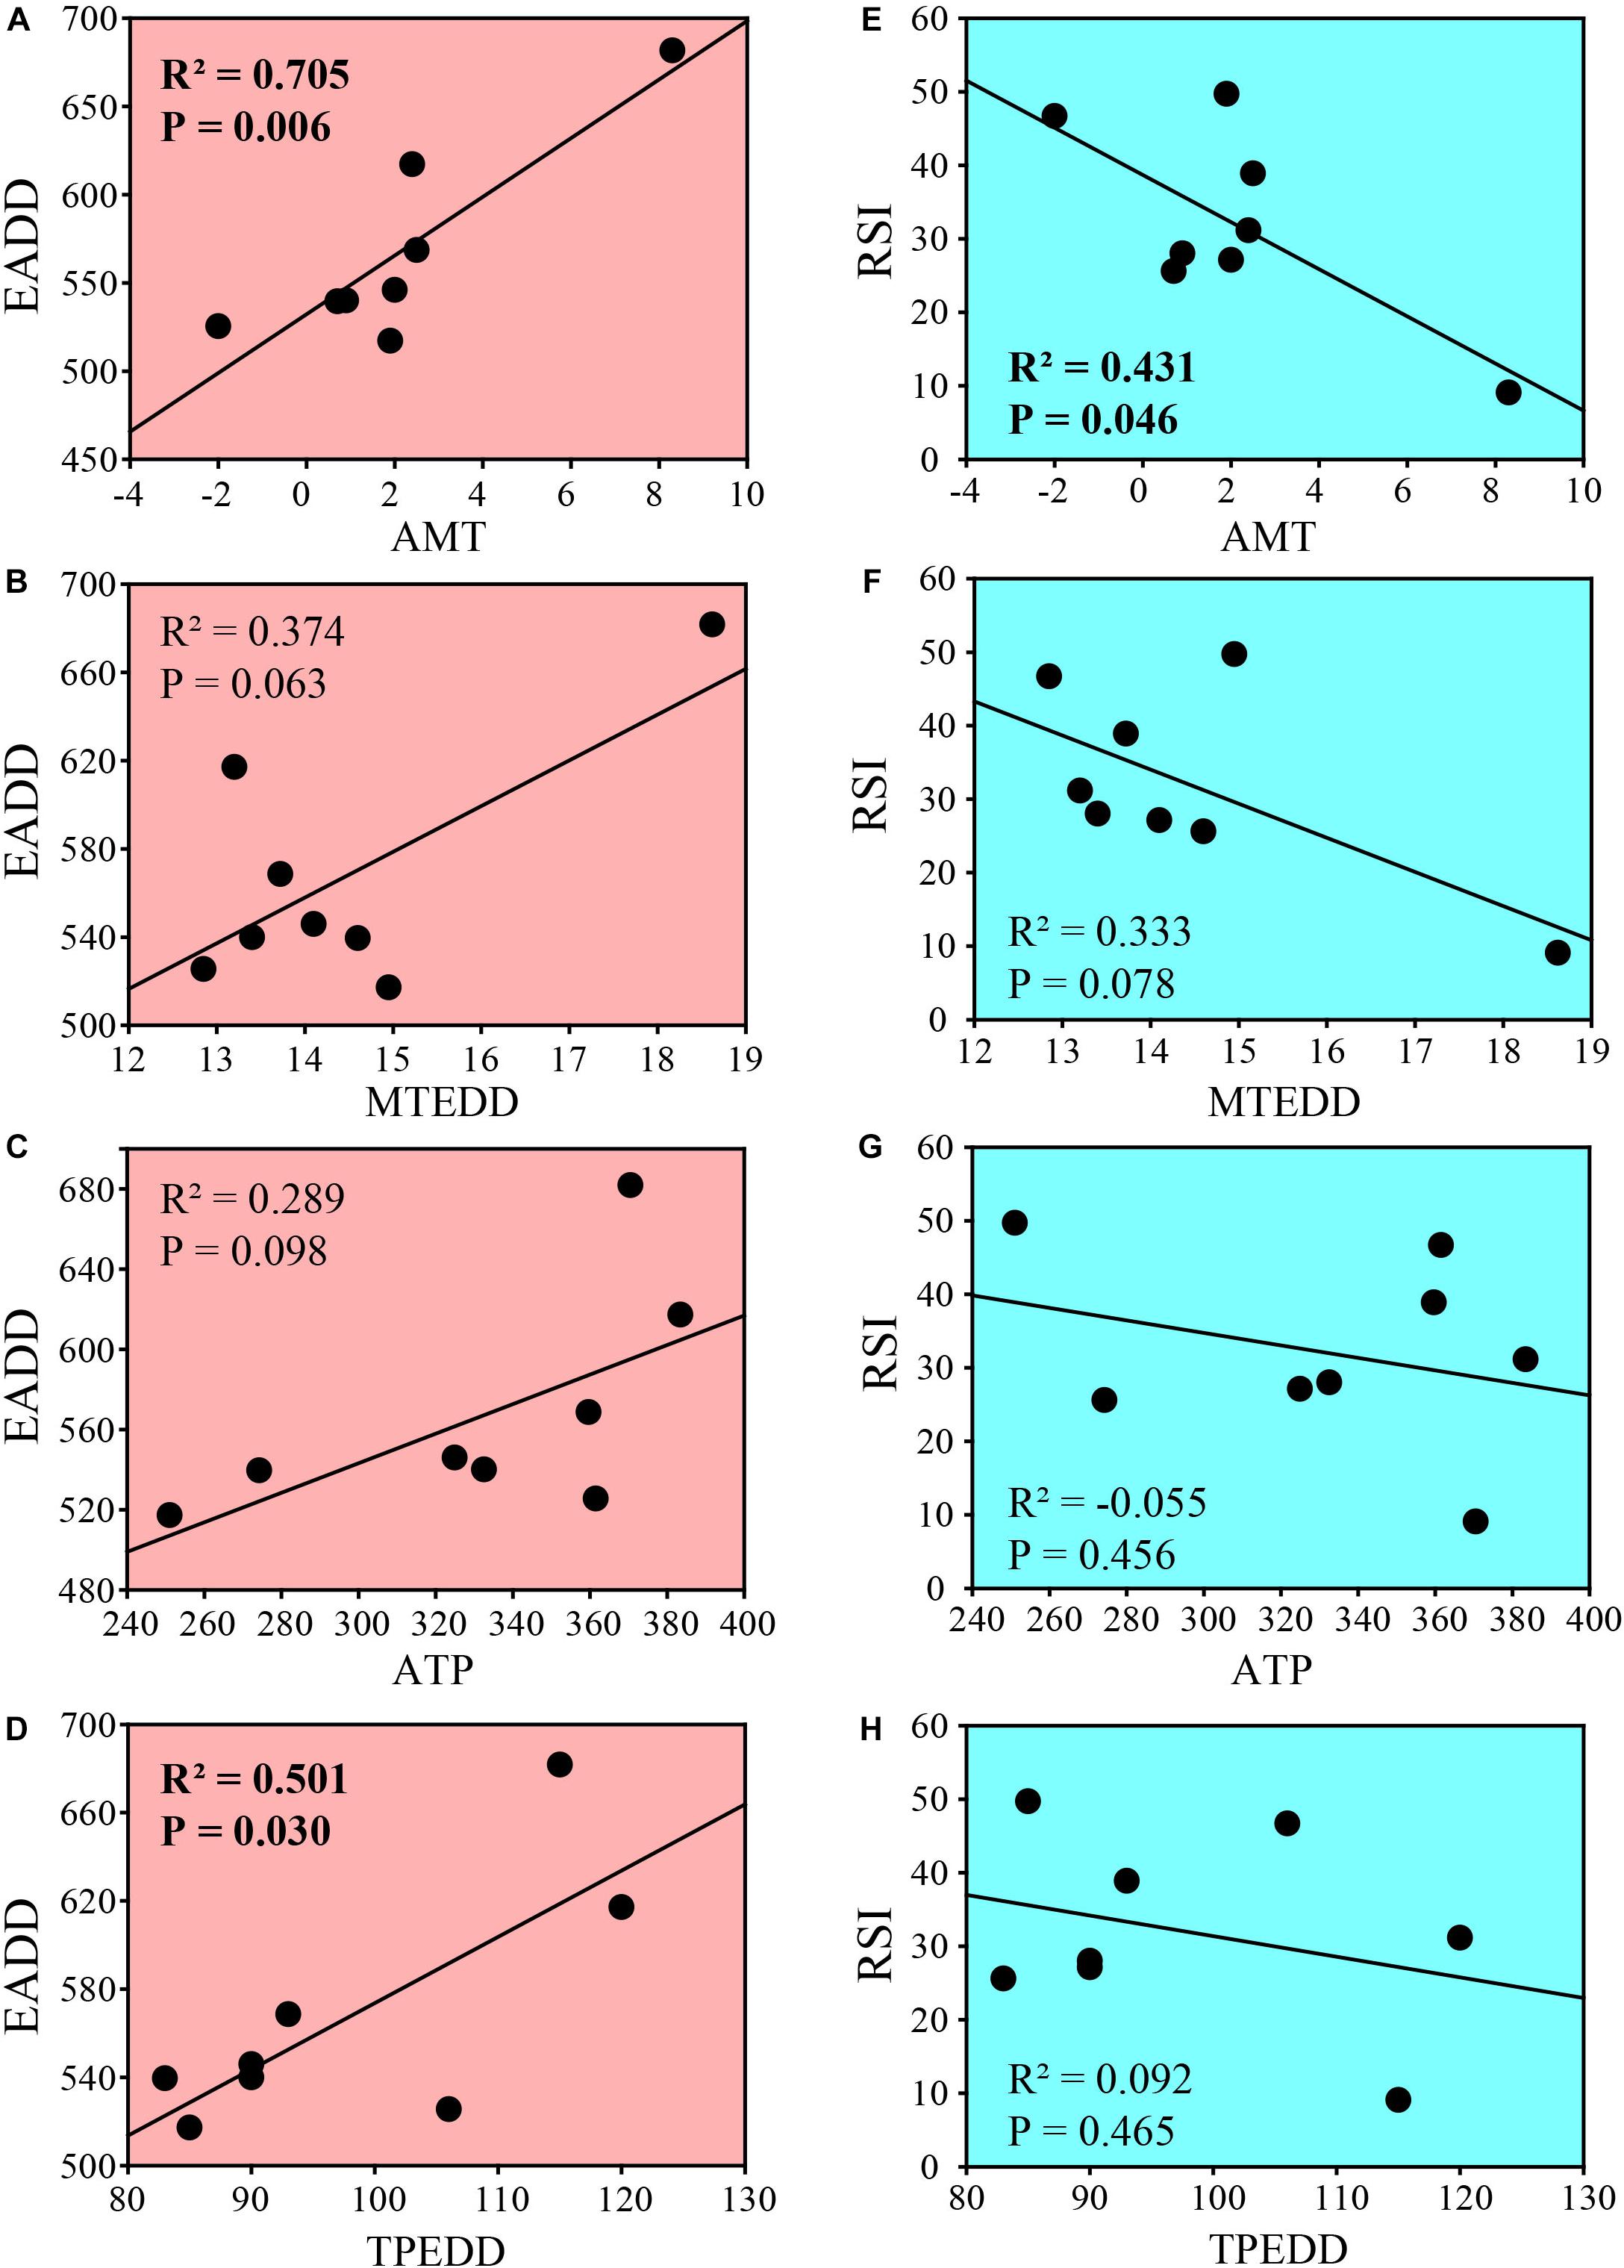
Figure 5. Correlation of embryonic development parameters with environmental factors among 8 geographic populations of C. dubius. (A–D) Correlation between EADD and annual mean temperature (A), mean temperature of embryonic development duration (B), annual total precipitation (C), and total precipitation of embryonic development duration (D). (E–H) Correlation between RSI and annual mean temperature (E), mean temperature of embryonic development duration (F), annual total precipitation (G) and total precipitation of embryonic development duration (H). R2, adjusted correlation coefficient. P < 0.05 means significant correlation.
RSI values of the embryos from different populations were negatively correlated with AMT (Figure 5E, R2 = 0.431, P = 0.046) and marginally correlated with MTEDD (Figure 5F, R2 = 0.333, P = 0.078), and no correlation with ATP and TPEDD (Figures 5G,H). However, RSI values were not correlated with environmental factors when southmost WQ population was excluded (Supplementary Figures 1E–H).
Discussion
Research on the plasticity and adaptation of organisms along latitudinal gradients to climate warming have important ecological and evolutionary significance, especially research on insects, the body temperatures of which are closely associated with their habitats. Studies comparing populations across sites with contrasting temperatures, such as over latitudinal gradients, can provide invaluable information regarding the role of temperature on the plasticity and adaptation of ectotherms to global warming (De Frenne et al., 2013). To our knowledge, this study provides in situ experiments to test, for the first time, the developmental responses of grasshopper eggs from different latitudinal areas to warming. The grasshopper eggs obtained from different geographic latitudes displayed different development traits in response to warming treatment. In particular, the southernmost population sample displayed little change in egg development, while the populations from high latitudes were more sensitive to warming. Accordingly, the same warming treatments resulted in different scenarios for the southernmost population compared with other populations on the Mongolian Plateau.
The results imply that geographic populations of grasshopper species may be used in space-for-time substitution research through field-based warming experiments that seek to determine the developmental rate of insects in response to short-term temperature increases or long-term climate warming. Therefore, insect species may exhibit either short-term responses or long-term adaptation strategies to accommodate climate warming. The variations in grasshopper development observed in the field-based warming experiments suggest that the developmental rates possibly selected by their living habitats. Developmental plasticity is important mechanistic explanation for the geographic variation among different populations observed in response to climate warming. For example, in both fruit flies and damselflies, incubation periods at controlled temperatures were shorter for high-latitude populations than for low-latitude conspecifics (Liefting et al., 2009; Nilsson-Ortman et al., 2013b).
The effects of climate change on terrestrial organisms are often predicted to increase with latitude and to be related to geographical variations, owing to the high degree of climate variation in high-latitude regions and in areas with higher local temperatures that are close to the optimal developmental temperatures of insects in low-latitude regions (Deutsch et al., 2008; Aragon et al., 2010). The greatest differences are generally observed in high-latitude populations between warming and control treatments (Yamahira et al., 2007; Teplitsky et al., 2008; Ohlberger and Fox, 2013; van Asch et al., 2013; Hassall et al., 2014). In our results, although different geographic grasshopper populations showed similarity in their responses to climate warming, the change level of different developmental parameters of the populations differed significantly depending on the location in which the grasshopper populations lived. Thus, we propose an alternative mechanism that implies a particularly complex set of responses to warming treatments by grasshopper species. Climate warming in high temperature regions may result in deleterious consequences because insects in high temperature regions are currently living very close to their optimally physiological temperatures. In contrast, the insect species in low temperature zones possess broad thermal tolerance and expect to expand to some places that are currently cooler than their physiological tolerance; thus, warming may even enhance their fitness (Deutsch et al., 2008). Consequently, various responses of ectotherms to climate warming necessitate further investigation at different hierarchical and spatial scales to understand how organisms are affected by and evolve in response to climate warming (Nilsson-Ortman et al., 2013b; Buckley et al., 2015).
In our study, increasing the EADD but not reducing the LDTT was an adaptive strategy observed in grasshopper eggs responding to warming conditions. The northern populations had lower EADD requirement than the southern populations. However, our results differ from the results of previous studies, in which variations in the developmental rates of eggs of other grasshoppers were found to be related to the LDTT, and populations from warm environments featured high LDTT and short egg developmental periods (Groeters and Shaw, 1992; Dingle and Mousseau, 1994). Two competing hypotheses exist to explain the alternative observations mentioned above. First, large-scale geographic variations represent an adaptation to prevailing temperatures. Thus, populations from low latitudes feature higher optimal temperatures than those from high latitudes. In addition, what matters to the insects is how much time is spent above the threshold and it is extremely interesting that in the northern locations these grasshoppers complete their development much quicker than in the south. Thus, a second hypothesis is that because the length of the growth periods is shorter at higher latitudes, organisms from high latitudes have less available time for development than their low-latitude counterparts do. There must be a trade-off in terms of size, fecundity and/or population density that will be critical in the species response to changing environmental conditions over time. Consequently, we expect that high-latitude populations would exhibit a higher capacity to develop across all temperatures to compensate for their shorter growing periods. Both hypotheses have gained empirical support (Yamahira and Conover, 2002; Laugen et al., 2003). Our results are significantly associated with the second hypothesis owing to the similarities of the LDTT and optimal temperatures among all studied populations. As a widespread grasshopper species, C. dubuis has evolved to adapt to temperature warming by increasing the EADD to delay the completion of development. This adaptive strategy is very different from those observed in diapause grasshopper species (Guo et al., 2009; Wu et al., 2012). We consider that the developmental traits of low-latitude populations of this grasshopper species have undergone long-term adaptations to warmer climates. Increasing the EADD or decreasing the developmental rates in low-latitude populations have become very common strategies in response to climate warming. For non-diapause grasshoppers, the stability of development under climate warming can maintain the species persistence and life cycles of low-latitude populations, which determines the univoltine of the grasshopper within 1 year. In contrast, their high-latitude counterparts are at risk of extinction because climate warming is more variable at high latitudes, and the yearly variation in temperature is large (Deutsch et al., 2008). We infer that the LDTT of an insect species is a relatively stable and genetic biological trait, while the EADD is an ecological trait that is relatively flexible with changing environmental conditions. Non-diapause insects adapt to climate change by redesigning their EADD over long-term evolution. Similarly, many diapause species can employ this principle to face climate warming in prediapause and postdiapause development (Guo et al., 2009; Wu et al., 2012).
In summary, our study demonstrated that warming significantly promoted the development of all studied non-diapause grasshopper populations. Low-latitude populations can buffer the influence of warming by increasing their EADD requirement to delay their development and to conserve their phenological stability. The findings of this study have important ecological implications for the plasticity and evolutionary adaptations of ectotherms to climate warming. Given that almost all previous studies have dealt only with the short-term responses of ectotherms to climate warming, our results reinforce the above-described view of the long-term adaptations of low-latitude populations to climate warming. Thus, we infer that the short-term response reported herein is a passive reaction and not an active response of ectotherms to environmental changes. Because short-term responses and long-term adaptations proceed in different evolutionary directions, further studies on global climate warming must include explanations and forecasts of the evolutionary directions of ectotherms under latitudinal variations linked with long-term adaptations.
Data Availability Statement
The datasets presented in this study can be found in online repositories. The names of the repository/repositories and accession number(s) can be found below: CNGBdb with accession number: CNP0002278.
Author Contributions
LK, WG, and SH conceived the ideas and designed the methodology and wrote the manuscript. SH collected the samples and constructed the constant temperature and warming experiments. CL and CM conducted the data analyses. All authors contributed critically to the drafts and gave final approval for publication.
Funding
This work was supported by the National Natural Science Foundation of China (Grant No. 31572459) and Knowledge Innovation Program in the Chinese Academy of Sciences (Grant No. KSCX2-YW-Z-1021).
Conflict of Interest
The authors declare that the research was conducted in the absence of any commercial or financial relationships that could be construed as a potential conflict of interest.
Publisher’s Note
All claims expressed in this article are solely those of the authors and do not necessarily represent those of their affiliated organizations, or those of the publisher, the editors and the reviewers. Any product that may be evaluated in this article, or claim that may be made by its manufacturer, is not guaranteed or endorsed by the publisher.
Supplementary Material
The Supplementary Material for this article can be found online at: https://www.frontiersin.org/articles/10.3389/fevo.2021.736456/full#supplementary-material
References
Aragon, P., Rodriguez, M. A., Olalla-Tarraga, M. A., and Lobo, J. M. (2010). Predicted impact of climate change on threatened terrestrial vertebrates in central Spain highlights differences between endotherms and ectotherms. Animal Conserv. 13, 363–373. doi: 10.1111/j.1469-1795.2009.00343.x
Bale, J. S., Masters, G. J. I, Hodkinson, D., Awmack, C., Bezemer, T. M., Brown, V. K., et al. (2002). Herbivory in global climate change research: direct effects of rising temperature on insect herbivores. Glob. Change Biol. 8, 1–16. doi: 10.1046/j.1365-2486.2002.00451.x
Bey-Bienko, G. J., and Mistshenko, L. L. (1951). Locusts and Grasshoppers of the U.S.S.R. and Adjacent Countries. Washington, DC: U.S. Dept of Commerce.
Blanckenhorn, W. U., and Demont, M. (2004). Bergmann and Converse Bergmann latitudinal clines in arthropods: two ends of a continuum? Integ. Compar. Biol. 44, 413–424. doi: 10.1093/icb/44.6.413
Bonebrake, T. C., and Deutsch, C. A. (2012). Climate heterogeneity modulates impact of warming on tropical insects. Ecology 93, 449–455. doi: 10.1890/11-1187.1
Buckley, L. B., Nufio, C. R., Kirk, E. M., and Kingsolver, J. G. (2015). Elevational differences in developmental plasticity determine phenological responses of grasshoppers to recent climate warming. Proc. R. Soc. B Biol. Sci. 282:20150441. doi: 10.1098/rspb.2015.0441
Childebaev, M. K., and Storozhenko, S. Y. (2001). An annotated list of brachycerous orthopterous insects (Orthoptera: Caelifera) occurring in Kazakhstan. Tethys Entomol. Res. 3, 5–48.
De Frenne, P., Graae, B. J., Rodríguez-Sanchez, F., Kolb, A., Chabrerie, O., Decocq, G. M., et al. (2013). Latitudinal gradients as natural laboratories to infer species’ responses to temperature. J. Ecol. 101, 784–795. doi: 10.1111/1365-2745.12074
Deutsch, C. A., Tewksbury, J. J., Huey, R. B., Sheldon, K. S., Ghalambor, C. K., Haak, D. C., et al. (2008). Impacts of climate warming on terrestrial ectotherms across latitude. Proc. Nat. Acad. Sci. U. S. A. 105, 6668–6672. doi: 10.1073/pnas.0709472105
Dingle, H., and Mousseau, T. A. (1994). Geographic variation in embryonic development time and stage of diapause in a grasshopper. Oecologia 97, 179–185. doi: 10.1007/bf00323147
Duffy, G. A., Coetzee, B. W. T., Janion-Scheepers, C., and Chown, S. L. (2015). Microclimate-based macrophysiology: implications for insects in a warming world. Curr. Opin. Insect Sci. 11, 84–89. doi: 10.1016/j.cois.2015.09.013
Excoffier, L., and Lischer, H. E. (2010). Arlequin suite ver 3.5: a new series of programs to perform population genetics analyses under Linux and Windows. Mol. Ecol. Res. 10, 564–567. doi: 10.1111/j.1755-0998.2010.02847.x
Garcia-Robledo, C., Kuprewicz, E. K., Staines, C. L., Erwin, T. L., and Kress, W. J. (2016). Limited tolerance by insects to high temperatures across tropical elevational gradients and the implications of global warming for extinction. Proc. Nat. Acad. Sci. U. S. A. 113, 680–685. doi: 10.1073/pnas.1507681113
Gardner, J. L., Peters, A., Kearney, M. R., Joseph, L., and Heinsohn, R. (2011). Declining body size: a third universal response to warming? Trends Ecol. Evol. 26, 285–291. doi: 10.1016/j.tree.2011.03.005
Groeters, F. R., and Shaw, D. D. (1992). Association between latitudinal variation for embryonic development time and chromosome structure in the grasshopper Caledia captiva (Orthoptera: Acrididae). Evolution 45, 245–257. doi: 10.1111/j.1558-5646.1992.tb01999.x
Guo, K., Hao, S., Sun, O. J., and Kang, L. (2009). Differential responses to warming and increased precipitation among three contrasting grasshopper species. Glob. Change Biol. 15, 2539–2548. doi: 10.1111/j.1365-2486.2009.01861.x
Hagen, S. B., Jepsen, J. U., Ims, R. A., and Yoccoz, N. G. (2007). Shifting altitudinal distribution of outbreak zones of winter moth Operophtera brumata in sub-arctic birch forest: a response to recent climate warming? Ecography 30, 299–307. doi: 10.1111/j.2007.0906-7590.04981.x
Hao, S., and Kang, L. (2004a). Effects of temperature on the post-diapause embryonic development and the hatching time in three grasshopper species (Orth. Acrididae). J. Appl. Entomol. 128, 95–101. doi: 10.1046/j.1439-0418.2003.00810.x
Hao, S., and Kang, L. (2004b). Postdiapause development and hatching rate of three grasshopper species (Orthoptera: Acrididae) in Inner Mongolia. Environ. Entomol. 33, 1528–1534. doi: 10.1603/0046-225X-33.6.1528
Harrington, R., Fleming, R. A., and Woiwod, I. P. (2001). Climate change impacts on insect management and conservation in temperate regions: can they be predicted? Agri. Forest Entomol. 3, 233–240. doi: 10.1046/j.1461-9555.2001.00120.x
Hassall, C., Keat, S., Thompson, D. J., and Watts, P. C. (2014). Bergmann’s rule is maintained during a rapid range expansion in a damselfly. Glob. Change Biol. 20, 475–482. doi: 10.1111/gcb.12340
Kang, I., and Chen, Y. (1995). Dynamics of grasshopper communities under different grazing intensities in Inner Mongolian steppes. Entomol. Sinica 2, 265–281. doi: 10.1111/j.1744-7917.1995.tb00048.x
Laugen, A. T., Laurila, A., and Merila, J. (2003). Latitudinal and temperature-dependent variation in embryonic development and growth in Rana temporaria. Oecologia 135, 548–554. doi: 10.1007/s00442-003-1229-0
Leigh, J. W., Bryant, D., and Nakagawa, S. (2015). Popart : full-feature software for haplotype network construction. Methods Ecol. Evol. 6, 1110–1116. doi: 10.1111/2041-210x.12410
Li, H., Hao, S., and Kang, L. (2007). Regional diferentiation of the Acridoidea ecofaunas in different vegetational zones (subzones) of Inner Mongolia region. Acta Entomol. Sinica 50, 361–375.
Librado, P., and Rozas, J. (2009). DnaSP v5: a software for comprehensive analysis of DNA polymorphism data. Bioinformatics 25, 1451–1452. doi: 10.1093/bioinformatics/btp187
Liefting, M., Hoffmann, A. A., and Ellers, J. (2009). Plasticity versus environmental canalization: population differences in thermal responses along a latitudinal gradient in Drosophila serrata. Evolution 63, 1954–1963. doi: 10.1111/j.1558-5646.2009.00683.x
Ma, C., Yang, P., Jiang, F., Chapuis, M., Shali, Y., Sword, G. A., et al. (2012). Mitochondrial genomes reveal the global phylogeography and dispersal routes of the migratory locust. Mol. Ecol. 21, 4344–4358. doi: 10.1111/j.1365-294X.2012.05684.x
Millien, V., Kathleen, L. S., Olson, L., Smith, F. A., Wilson, A. B., and Yom-Tov, Y. (2006). Ecotypic variation in the context of global climate change: revisiting the rules. Ecol. Lett. 9, 853–869. doi: 10.1111/j.1461-0248.2006.00928.x
Niewiarowski, P. H., and Angilletta, M. J. (2008). Countergradient variation in embryonic growth and development: do embryonic and juvenile performances trade off? Funct. Ecol. 22, 895–901. doi: 10.1111/j.1365-2435.2008.01441.x
Nilsson-Ortman, V., Stoks, R., De Block, M., and Johansson, F. (2012). Generalists and specialists along a latitudinal transect: patterns of thermal adaptation in six species of damselflies. Ecology 93, 1340–1352. doi: 10.1890/11-1910.1
Nilsson-Ortman, V., Stoks, R., De Block, M., and Johansson, F. (2013a). Latitudinal patterns of phenology and age-specific thermal performance across six Coenagrion damselfly species. Ecol. Monograp. 83, 491–510. doi: 10.1890/12-1383.1
Nilsson-Ortman, V., Stoks, R., De Block, M., Johansson, H., and Johansson, F. (2013b). Latitudinally structured variation in the temperature dependence of damselfly growth rates. Ecol. Lett. 16, 64–71. doi: 10.1111/ele.12013
Ohlberger, J., and Fox, C. (2013). Climate warming and ectotherm body size - from individual physiology to community ecology. Funct. Ecol. 27, 991–1001. doi: 10.1111/1365-2435.12098
Parmesan, C. (2006). Ecological and evolutionary responses to recent climate change. Ann. Rev. Ecol Evol. Syst. 37, 637–669. doi: 10.1146/annurev.ecolsys.37.091305.110100
Parmesan, C. (2007). Influences of species, latitudes and methodologies on estimates of phenological response to global warming. Glob. Change Biol. 13, 1860–1872. doi: 10.1111/j.1365-2486.2007.01404.x
Parmesan, C., Burrows, M. T., Duarte, C. M., Poloczanska, E. S., Richardson, A. J., Schoeman, D. S., et al. (2013). Beyond climate change attribution in conservation and ecological research. Ecol. Lett. 16, 58–71. doi: 10.1111/ele.12098
Parmesan, C., Ryrholm, N., Stefanescu, C., Hill, J. K., Thomas, C. D., Descimon, H., et al. (1999). Poleward shifts in geographical ranges of butterfly species associated with regional warming. Nature 399, 579–583. doi: 10.1038/21181
Posada, D. (2008). jModelTest: phylogenetic model averaging. Mol. Biol. Evol. 25, 1253–1256. doi: 10.1093/molbev/msn083
Rasmann, S., Pellissier, L., Defossez, E., Jactel, H., and Kunstler, G. (2014). Climate-driven change in plant-insect interactions along elevation gradients. Funct. Ecol. 28, 46–54. doi: 10.1111/1365-2435.12135
Rhymer, J. M. (1992). An experimental study of geographic variation in avian growth and development. J. Evol. Biol. 5, 289–306. doi: 10.1046/j.1420-9101.1992.5020289.x
Stefanescu, C., Penuelas, J., and Filella, I. (2003). Effects of climatic change on the phenology of butterflies in the northwest Mediterranean Basin. Glob. Change Biol. 9, 1494–1506. doi: 10.1046/j.1365-2486.2003.00682.x
Teplitsky, C., Mills, J. A., Alho, J. S., Yarrall, J. W., and Merila, J. (2008). Bergmann’s rule and climate change revisited: disentangling environmental and genetic responses in a wild bird population. Proc. Nat. Acad. Sci. U. S. A. 105, 13492–13496. doi: 10.1073/pnas.0800999105
van Asch, M., Salis, L., Holleman, L. J. M., van Lith, B., and Visser, M. E. (2013). Evolutionary response of the egg hatching date of a herbivorous insect under climate change. Nat. Clim. Change 3, 244–248. doi: 10.1038/nclimate1717
Van Horn, S. N. (1966). Studies on the embryogenesis of Aulocara elliotti (Thomas) (Orthoptera;Acrididae). I. External morphogenesis. J. Morphol. 120, 83–114.
Wu, T. J., Hao, S., Sun, O. J., and Kang, L. (2012). Specificity responses of grasshoppers in temperate grasslands to diel asymmetric warming. PLoS One 7:e41764. doi: 10.1371/journal.pone.0041764.g001
Yamahira, K., and Conover, D. O. (2002). Intra- vs. interspecific latitudinal variation in growth: adaptation to temperature or seasonality. Ecology 83, 1252–1262. doi: 10.1890/0012-96582002083
Yamahira, K., Kawajiri, M., Takeshi, K., and Irie, T. (2007). Inter-and intrapopulation variation in thermal reaction norms for growth rate: evolution of latitudinal compensation in ectotherms with a genetic constraint. Evolution 61, 1577–1589. doi: 10.1111/j.1558-5646.2007.00130.x
Zera, A. J., and Harshman, L. G. (2001). The physiology of life history trade-offs in animals. Ann. Rev. Ecol. Syst. 32, 95–126. doi: 10.1146/annurev.ecolsys.32.081501.114006
Keywords: Chorthippus dubius, embryonic development, diapause, climate warming, mitochondrial DNA
Citation: Hao S, Liu C, Ma C, Guo W and Kang L (2021) Embryonic Development of Grasshopper Populations Along Latitudinal Gradients Reveal Differential Thermoaccumulation for Adaptation to Climate Warming. Front. Ecol. Evol. 9:736456. doi: 10.3389/fevo.2021.736456
Received: 05 July 2021; Accepted: 18 October 2021;
Published: 23 November 2021.
Edited by:
Mauro Fois, University of Cagliari, ItalyReviewed by:
Steve Trewick, Massey University, New ZealandJiufeng Wei, Shanxi Agricultural University, China
Copyright © 2021 Hao, Liu, Ma, Guo and Kang. This is an open-access article distributed under the terms of the Creative Commons Attribution License (CC BY). The use, distribution or reproduction in other forums is permitted, provided the original author(s) and the copyright owner(s) are credited and that the original publication in this journal is cited, in accordance with accepted academic practice. No use, distribution or reproduction is permitted which does not comply with these terms.
*Correspondence: Wei Guo, Z3Vvd2VpQGlvei5hYy5jbg==; Le Kang, bGthbmdAaW96LmFjLmNu