 Imre Demeter
 Adalbert Balog
 Miklós Sárospataki
- 1Department of Zoology and Ecology, Institute of Wildlife Management and Nature Conservation, University of Agriculture and Life Science, Gödöllő, Hungary
- 2Department of Horticulture, Faculty of Technical and Human Science, Sapientia Hungarian University of Transylvania, Tirgu-Mures, Romania
During the study, the honeybee effects on wild bees were tested and hypothesized that smaller distances from beehives will increase competitions between honeybees and wild bees, while greater distances will have a deleterious effect on competition. The impact on species richness and diversity was tested with distances from beehives, considering that this may differ when large and small wild bee species are considered separately. Altogether 158 species and 13,164 individuals were collected, from which 72% (9,542 individuals) were Apis mellifera. High variation in abundances was detected from one year to another, and the species turnover by sites was 67% in site A, 66% in site V, and 63% in site F. This last one was the site with the previous contact with honeybees. Considering distances from beehives, significant decreases in small bee species diversity were detected from one year to another at each distance except site F, 250 m from hives. The changes in species diversity and community structure of small bee species are detected from one year to another.
Introduction
The current large-scale decline in the number of pollinating insects can have a negative impact on global food production and human wellbeing (Potts et al., 2010) since the quality and yield of many plants are based on the pollination by insects (Potts et al., 2016). Nearly 45% of the most commonly grown plant species in the world depend on pollinators (Klein et al., 2007). The role of bees in pollination is highly significant, as it is responsible for pollinating a large number of nutrient-rich plants important in human nutrition (Ellis et al., 2015). In the developed world, 14.7% of total agricultural production, and in the developing world, 22.6% (Aizen et al., 2009) are directly linked to bee activity, which is estimated to have annually a total value of €153 billion (Gallai et al., 2009).
It is a common practice to introduce managed pollination in order to meet the pollination need of plants by placing honeybee (Apis mellifera) colonies on specific areas (Garibaldi et al., 2017). The presence of wild bees in crop production is also significant even when the presence of honeybees is high because wild bee communities often prove to be more effective pollinators, and at the same time, interspecies interactions can increase pollination efficiency (Brittain et al., 2013; Garibaldi et al., 2013; Woodcock et al., 2013). In seminatural landscapes, wild bees are the most important pollinators of flowering plants (Garibaldi et al., 2013). Diverse bee communities increase landscape biodiversity and provide steady pollination services (Hoehn et al., 2008; Eeraerts et al., 2020; MacInnis and Forrest, 2020).
The diversity and density of wild bees are declining in many parts of the world due to habitat loss and habitat degradation, the use of chemicals, and the presence of parasites. Furthermore, due to intensive agriculture, croplands are less suitable for sustainable honey production, so professional beekeepers regularly move large apiaries to natural areas, either to exploit prosperous resources or to avoid chemical hazards or intermittent food shortages (Henry et al., 2012; Odoux et al., 2014; Requier et al., 2017). As both honeybees and wild bees feed on nectar and pollen, it is not a recent concern that there might be a competition for food resources between the native wild bees and the artificially placed honeybees (Schaffer et al., 1983; Danner et al., 2016; Thomson, 2016; Geslin et al., 2017; Magrach et al., 2017).
Honeybees can negatively affect the reproduction of bumblebees (Thomson, 2004) and solitary bees (Hudewenz and Klein, 2015) and can change the collection habits of bumblebees by displacing them from the area (Walther-Hellwig et al., 2006). In addition, bumblebee workers develop to a smaller size, probably due to malnutrition during the larval stage (Goulson and Sparrow, 2009). Due to these competitive effects, a total ban on beekeeping on nature reserves is more and more pronounced (Geldmann and González-Varo, 2018; González-Varo and Geldmann, 2018; Kleijn et al., 2018; Saunders et al., 2018). Several studies have attempted to assess the effect of honeybees on wild bees, but some of them have failed to show significant competition (Paini, 2004). According to this, in Europe, under natural conditions, competition between honeybees and bumblebees is unlikely, as both taxa are native. The foraging-related traits of bumblebees may differ from those of honeybees (Walther-Hellwig et al., 2006), as the tongue of the bumblebees is longer than that of the honeybees (Balfour et al., 2013), which allows for food niche separation (Ranta and Lundberg, 1980). An inclusive conservation approach would allow these conflicting hypotheses to be conciliated, involving all parties for sustainable results (Kleijn et al., 2018). One such solution could be to regulate the density of apiaries with a maximum number of colonies of 3.1 colonies/km2 (Steffan-Dewenter and Tscharntke, 2000) or 3.5 colonies/km2 as suggested by another author (Torné-Noguera et al., 2016). Having the appropriate hive density in a given area is extremely difficult, as current apiaries often consist of 100–200 colonies. The appropriate density is furthermore influenced by the fact that honeybees can fly up to several kilometers, the hive density may depend on the density of wild pollinators, in addition, most nature reserves are not homogeneous, and available flowering plants vary seasonally and year by year.
Altogether more detailed researches are needed to test the effect of honeybees on wild bee species in “sensu lato” and effects on large and small bee species separately in highly diverse and protected habitats. By understanding these mechanisms, a better explanation of honeybee influences on wild bees and the habitat effect on these interactions can be explained. Thus, our hypotheses were as follows: H1. Honeybee effects on wild bees can be detected differently if distances from beehives are considered; smaller distances from beehives will increase competitions between honeybees and wild bees, while higher distances will have a deleterious effect on competition. H2. Exchange in species richness and diversity can be detected with distances from beehives, and this may differ when large and small wild bee species are considered separately.
Materials and Methods
Study Area and Sampling
This study was carried out between 2018 and 2019 in Central Europe (Transylvania), in Harghita and Covasna counties. Three seminatural protected, high nature value (HNV) areas were selected where extensive farming takes place, and the diversity and number of wild bees are extremely high, but the number of artificially placed honeybees (A. mellifera) is missing from two areas and is low in one area. The first area is the Vârghiş Valley area (coded as V) (N:46.2034539, E:25.5344264), which is a nature reserve, where prior to our research no artificially placed honeybees were introduced, and it is characterized by meadows and forest patches. The second one is the Almas-Meresti area (coded as A) (N:46.2394164, E:25.5322366) where again no artificially placed honeybees were present, and it is characterized by meadows, pastures, and forest patches. The third area is the Filia area (coded as F) (N:46.1731241, E:25.6236372), which was considered as the control area, honeybees have been present artificially in low density for 5 years, and this area is characterized by meadows, forest patches, and very few arable lands. The distances between the sampling areas were as follows: F–A 10 km; F–V 7 km; A–V 3.7 km. In all three areas, the average altitude is 530–630 m (Figure 1A).
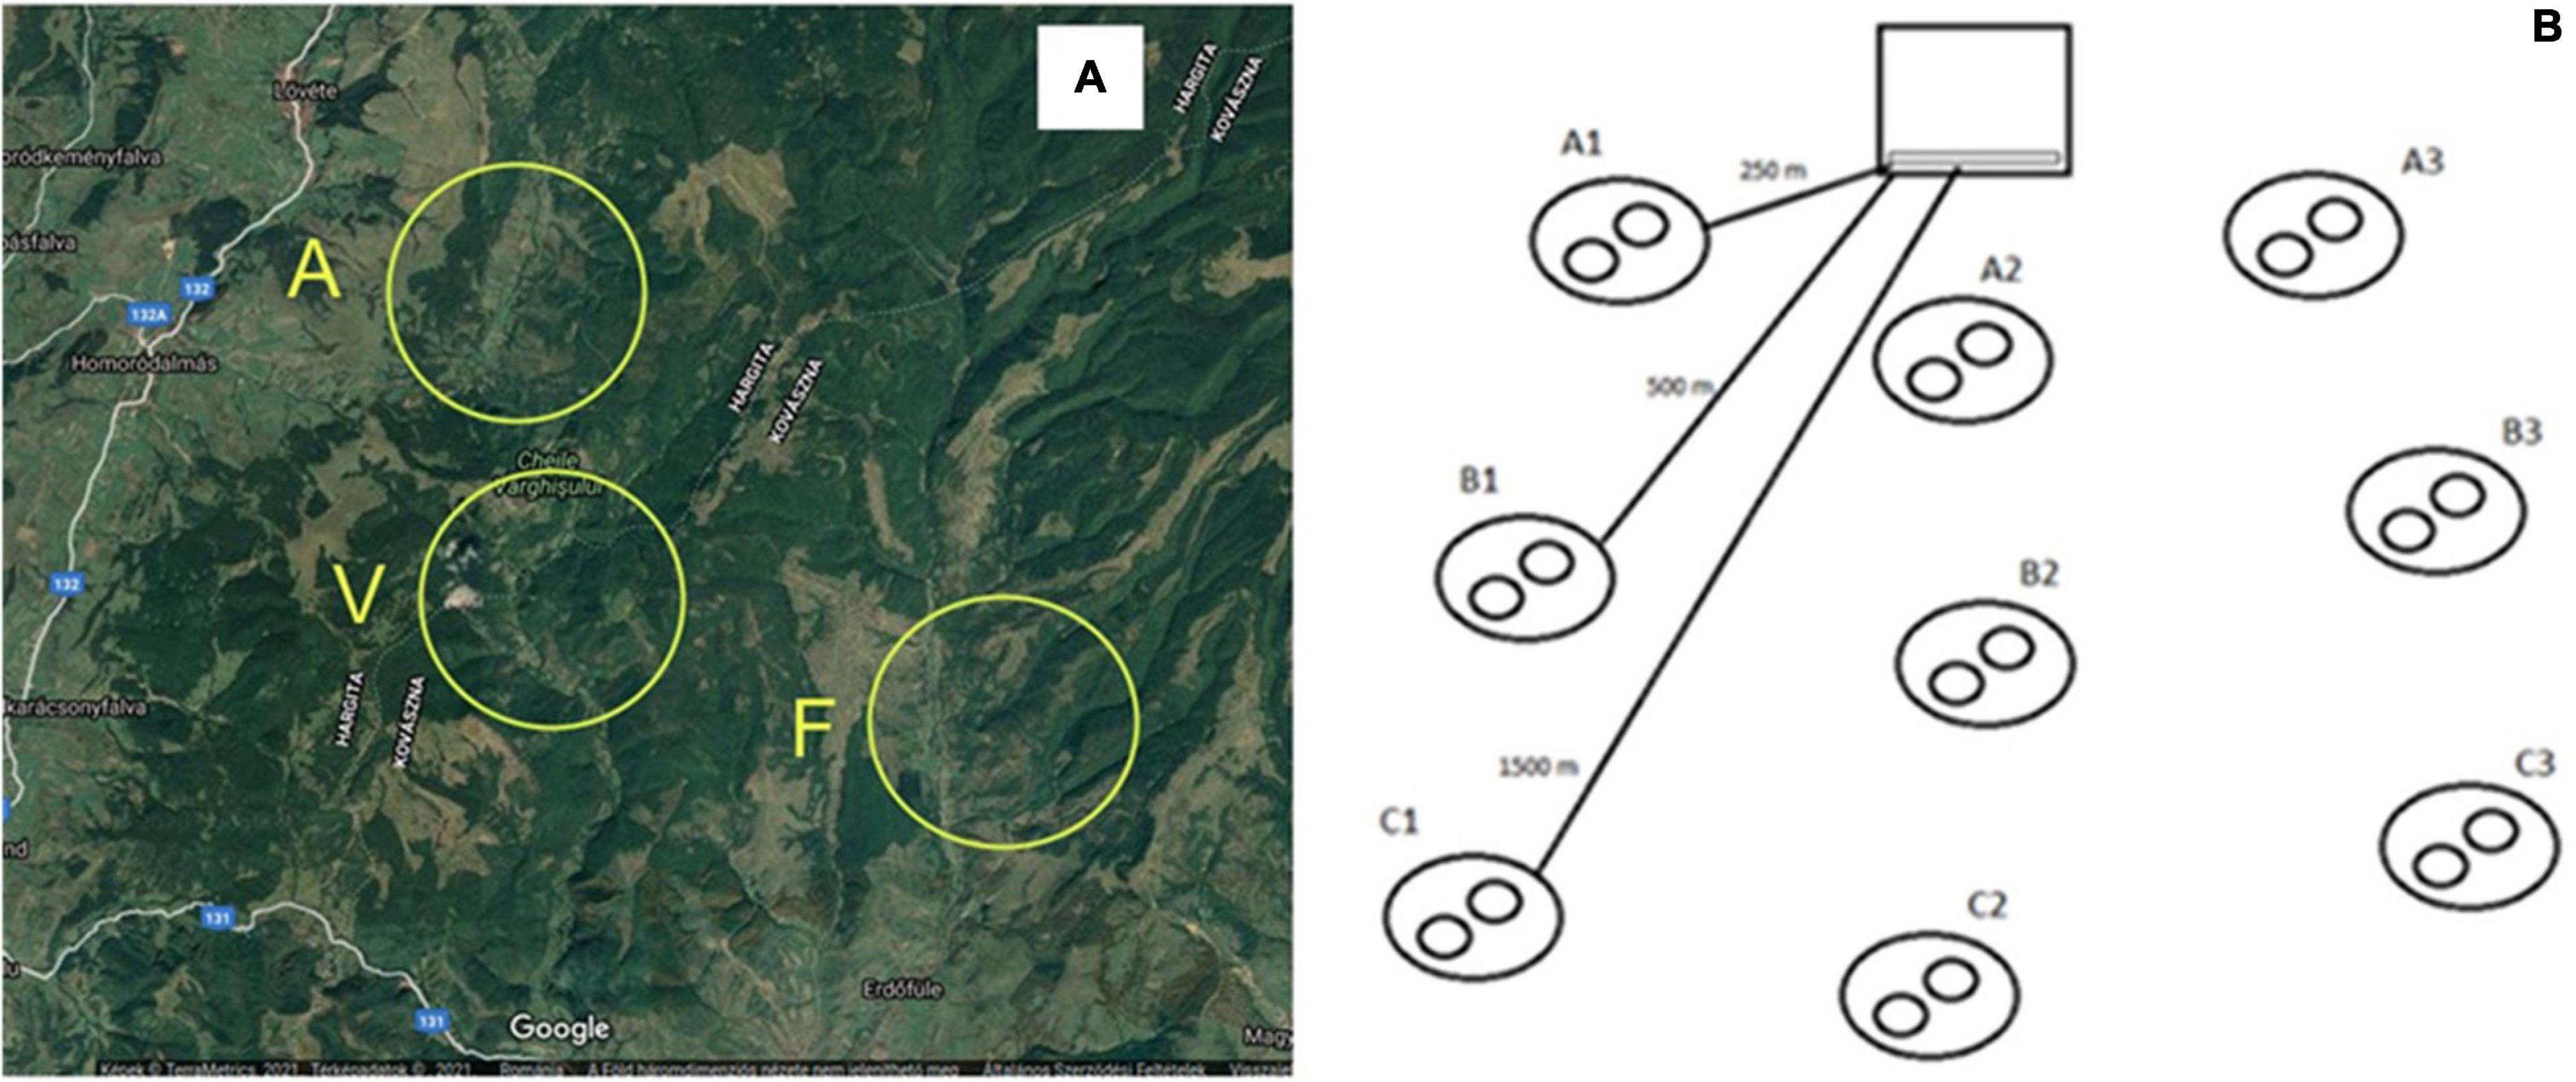
Figure 1. Map of the sampled areas (A), natural reserve sites A (N:46.2394164, E:25.5322366) and V (N:46.2034539, E:25.5344264), and control area F (N:46.1731241, E:25.6236372), which includes honeybees previously. Sampling model (B) including distances from beehives.
The studied areas, which are located relatively far from the closest villages, and the complex natural habitat are diversely represented by small grassland-woodland-scrub mosaics. The grasslands are mainly used as meadows. Mowing on mosaic grassland patches was made at different times, providing a continuous food resource for pollinators. Although differences in plant diversity can be observed in the three areas, several plant species were common in all areas (Supplementary Material).
In all three valleys, sampling was performed four times in both 2018 and 2019 (i.e., one time in May, two times in June, and one time in July). The first assessment started in May and was made before the placement of honeybee colonies. Then, 7–10 days prior to the second assessment, 30 honeybee colonies were placed in each area; thus, during the second, third, and fourth assessments, honeybee colonies were present in all three areas. The average weight of a hive was 60–70 kg, and the bees populated 20 frames (300 mm/470 mm/37 mm) when hives were initially placed on these areas. Beehives were removed from the sites immediately after the last assessment and replaced next year in a same way.
The sampling area was a circle with a radius of 1,200 m around beehives and contained nine randomly selected subsampling sites. From these, three sampling sites were at a distance of 250 m, three at 500 m, and three at 1,500 m from beehives. Each assessment was made parallel (at each distance) by collecting for 20 min along a 200-m transect of all bee species using a sweep net. Then, the whole procedure was repeated two times at each distance (Figure 1B). All insects were stored in 70% ethanol, and species were identified in the laboratory.
Data Analyses
The collected species were divided into two groups, namely, bumblebees (referred to as large bees) and other wild bees (referred to as small bees), as these may show significant differences partly in social behavior and partly in home-range size (Gathmann et al., 1994). The endangered status of the species was determined based on the European Red List (Nieto et al., 2014). To characterize the differences of wild bee communities between areas, we compared the species composition and also the k-dominance relationships. The data were averaged by sampling numbers (three sampling/distances/sampling period) and used for all analyses.
Analyses comparing abundances and diversity prior to hive placement and after hive placement in 2018 were performed. This makes sense for data collected in 2018 because the data from 2019 represent samples after hive placement in 2018. The Kruskal–Wallis test was performed to compare abundances. Alpha diversity profiles and diversity indices were computed using PAST version 4.02.
Mann–Whitney U test followed by Tukey’s pairwise comparisons were made to compare species numbers and abundances between years and distances from beehives inside each site. For this comparison, the data from the first sampling period in 2018 were incorporated. The densities of honeybees, large bees, and small bees were also compared between sites for all distances (i.e., 250, 500, and 1,500 m) using the same method. Diversity profiles at each distance and diversity T-test between years were computed for the entire wild bee community (Tóthmérész, 1995). The analyses were made using PAST version 4.02.
The effect of years, sites, and distances on honeybees, small bees, large bees, and endangered species (averaged data as mentioned above) was tested using each species group as a response variable and the sites, years, and distances as explanatory variables. Main effects as significant positive and negative relationships were defined at the level of P < 0.01.
The variation in the densities of honeybees as well as small and large bees for each site, year, and distance from beehives, respectively, were tested using repeated measures multivariate ANOVA (MANOVA). Interactions were then compared using χ2 tests on the differences between the covariance matrices and by the root mean square error of approximation. This comparison was made between the densities of honeybees and the densities of small and large bees for each distance separately. Due to the low density of endangered species, comparisons were made without statistical analyses, and differences were only mentioned according to the species and individual numbers. The statistical analyses were performed in R version 3.0.1 (R Core Team, 2013).
The canonical correspondence analyses were used to test the effect of years and sites on wild bee species; in this study, sites and years were used as components and species abundances as variables. The analyses were made in PAST version 4.02.
Results
Altogether 158 species and 13,164 individuals were collected, from which 72% (9,542 individuals) were A. mellifera. Dominant large wild bee species were Bombus humilis (889 individuals), Bombus terrestris (874 individuals), Bombus pascuorum (225 individuals), Bombus hortorum (174 individuals), Bombus ruderarius (79 individuals), and Bombus sylvarum (67 individuals). Dominant small bee species were Andrena flavipes (152 individuals), Andrena ovatula (81 individuals), Lasioglossum calceatum (67 individuals), Eucera nigrescens (55 individuals), Eucera longicornis (53 individuals), and Halictus tumulorum (44 individuals).
No significant differences were detected in abundances and diversity between the first sampling period (prior to hive placement) and other sampling periods (after hive placement) in 2018 in all sites (Supplementary Material). Significant differences between abundances in the last sampling period and all others in site A 500 m, 1,500 m, and site V 250 m from hives were observed. Also, some differences in abundances at site F 250 m between the third sampling data and at 1,500 m between the fourth sampling data and all others were observed. The same differences can also be detected at diversity profiles and indices (Supplementary Material).
Some variation in species richness and abundances can be detected between sites, years, and distances from beehives when small and large bees are considered together in analyses. In site A at 250 m distances from beehives 45, at 500 m 43 species while at 1,500 m 42 wild bee species were detected in 2018, this was 43 (250 m), 30 (500 m), and 29 (1,500 m) in 2019, a significant reduction was detected at 500 and 1,500 m (Figure 2A). The same trend in site V was also detected with no differences in species numbers at 250 m (39 in 2018 and 29 in 2019), and a significant decrease was detected at 500 m (47 in 2018 and 28 in 2019) and at 1,500 m (65 in 2018 and only 18 in 2019) (Figure 2B). Again, no changes at 250 m in site F were detected (44 species in 2018 and 47 in 2019), and decreases at 500 m (50 species in 2018 and 36 in 2019) and at 1,500 m (45 in 2018 and 26 in 2019) were observed (Figure 2C). No such accentuated changes in abundances were detected; increase from 2018 to 2019 (from 181 to 228) in site A at 250 m, no changes at 500 m (208 and 200), and decrease at 1,500 m (from 256 to 171) were detected (Figure 2D). A decrease in site V at 500 m was only detected (from 336 to 214), while the same trend as in site A was observed in site F (Figures 2E,F). Significant differences in honeybee densities and any other wild bees were detected at 250 and 500 m between site A and sites V and F in both 2018 and 2019, while at 1,500 m, differences in honeybee densities in 2018 between site F and the other species in sites A and V were detected (Supplementary Material). The variations “sensu lato” of wild bee populations within years considering distances from beehives in each site separately were as follows:
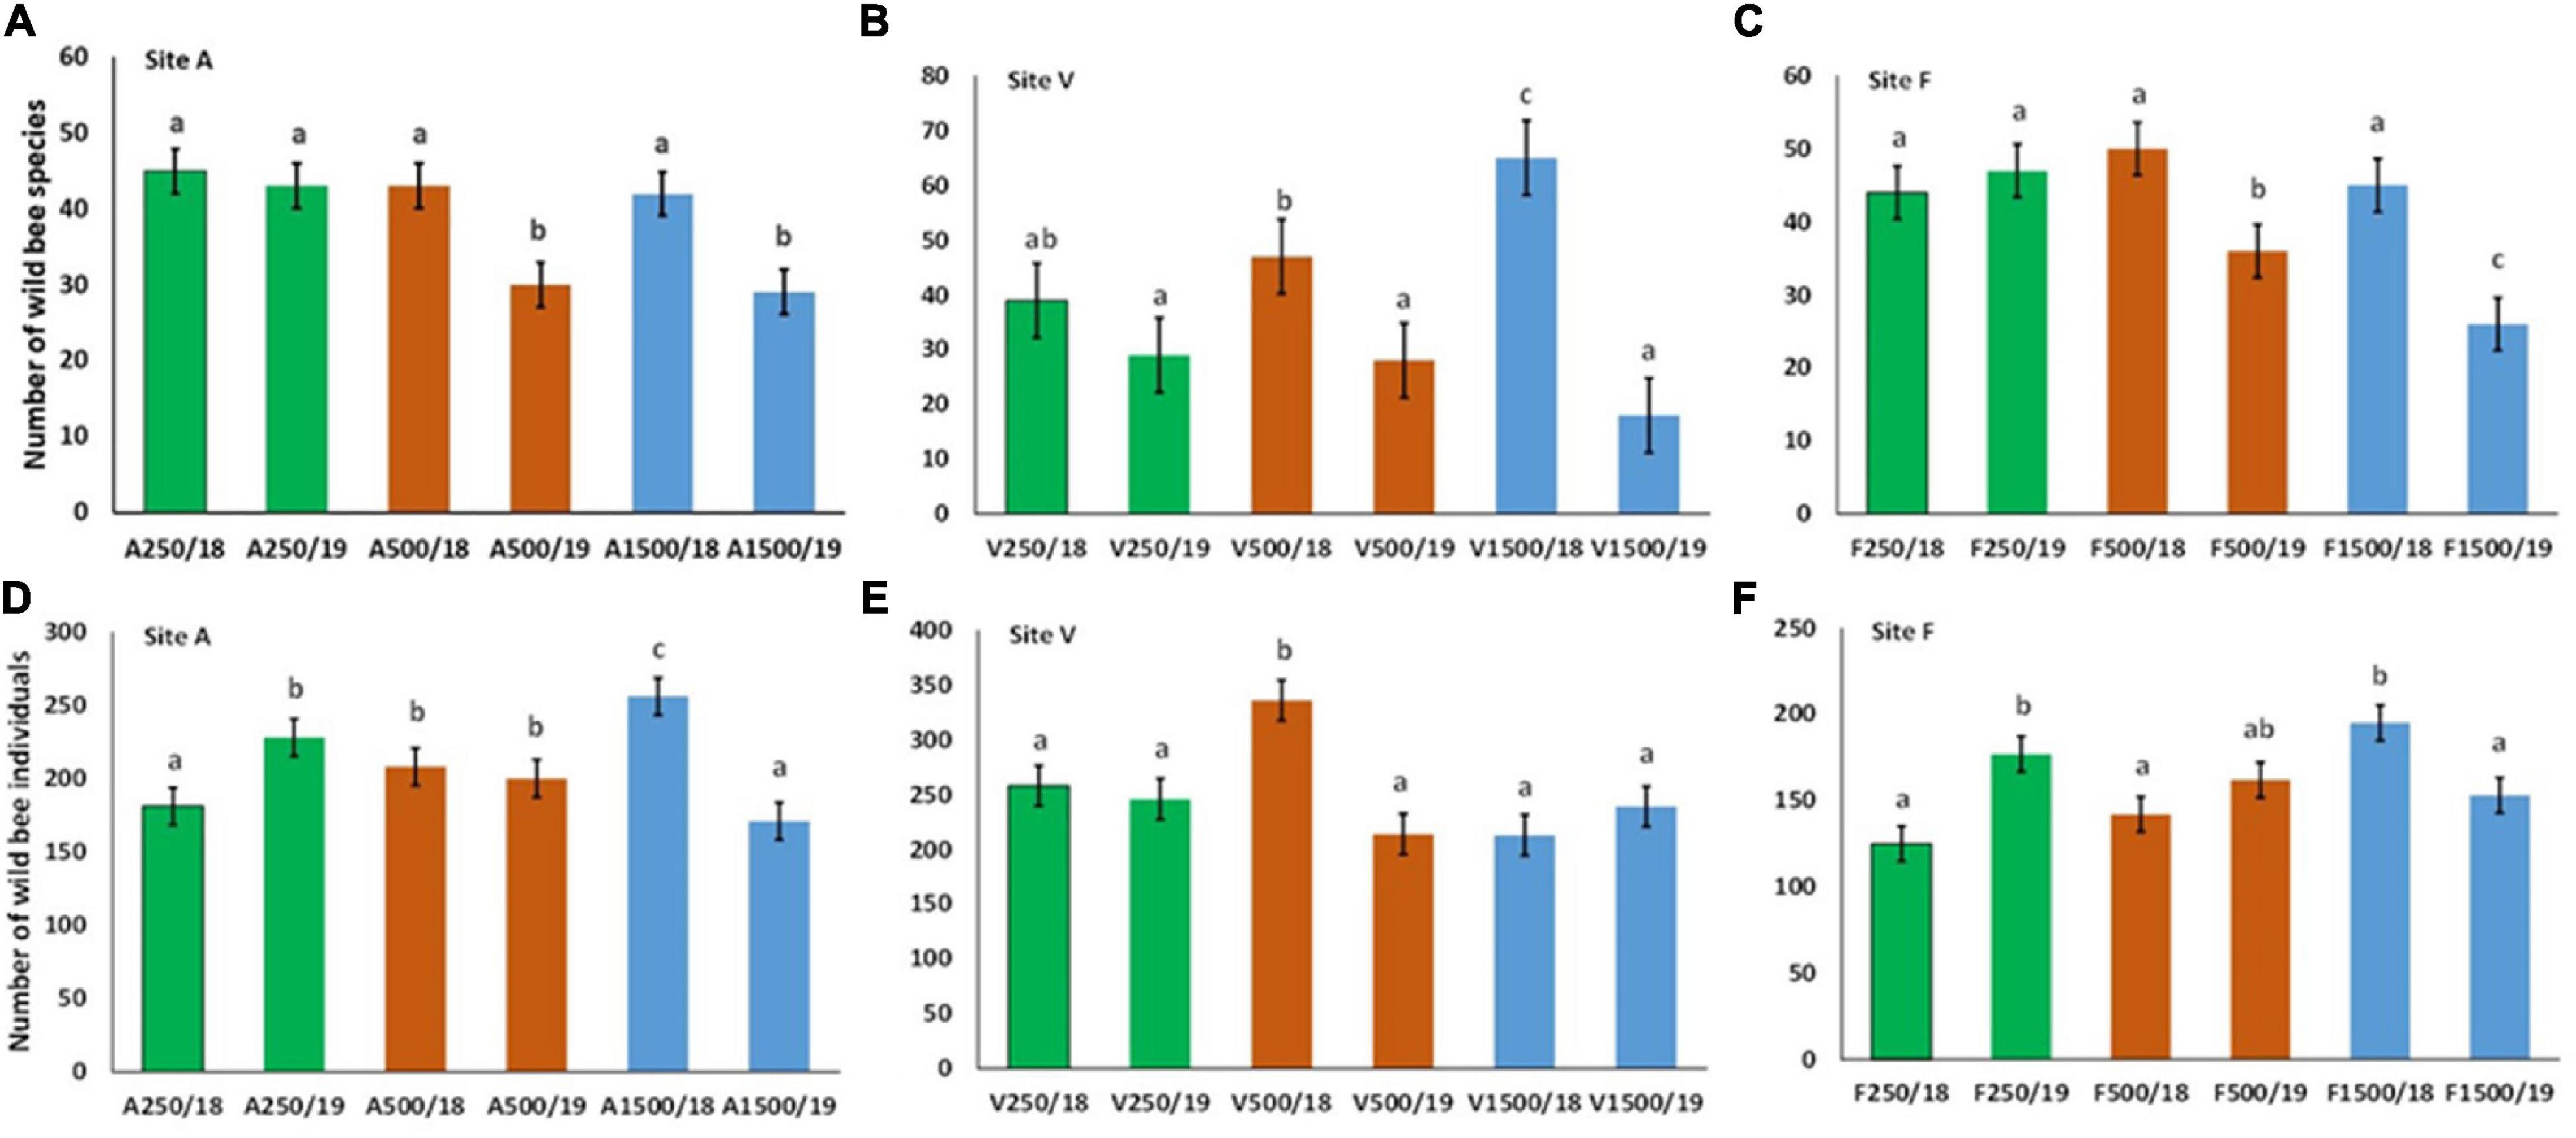
Figure 2. Species richness (A–C) and abundances (D–F) of wild bees collected in 2018 and 2019 at 250 m (green bars), 500 m (brown bars), and 1,500 m (blue bars) from beehives in site A, V, and F. Different letters represent statistically significant differences between groups, i.e., Site A species at P < 0.05 level (Mann–Whitney U test followed by Tukey’s test).
Species richness by distances from beehives within years:
2018: site V small increase, no change in site A and F.
2019: site V no change, small decrease in site A, strong decrease in site F.
Abundance variations by distances from beehives within years:
2018: increase in all sites (strong in site A and small increase in sites V and F).
2019: no change in site V, small decrease in sites A and F.
The variations “sensu lato” of wild bee populations from one year to another considering distances from beehives in each site separately were as follows:
Species richness variations by distances from beehives between years:
Site A: 250 m no changes; 500 m decrease; 1,500 m decrease.
Site V: 250 m no changes; 500 m decrease; 1,500 m decrease.
Site F: 250 m no change; 500 m decrease; 1,500 m decrease.
Abundance variations by distances from beehives between years:
A: 250 m increase; 500 m no changes; 1,500 m decrease.
V: 250 m no change; 500 m decrease; 1,500 m no changes.
F: 250 m increase; 500 m no changes; 1,500 m decrease.
High change in species richness and composition and also in abundances was detected from one year to another, and the species exchange rates by sites were 67% in site A, 66% in site V, and 63% in site F. Considering again distances from beehives, a significant decrease in diversity was detected from one year to another at each distance except site F, 250 m from hives (F18/19, t = −0.35, P = 0.72) (Figures 3A–C).
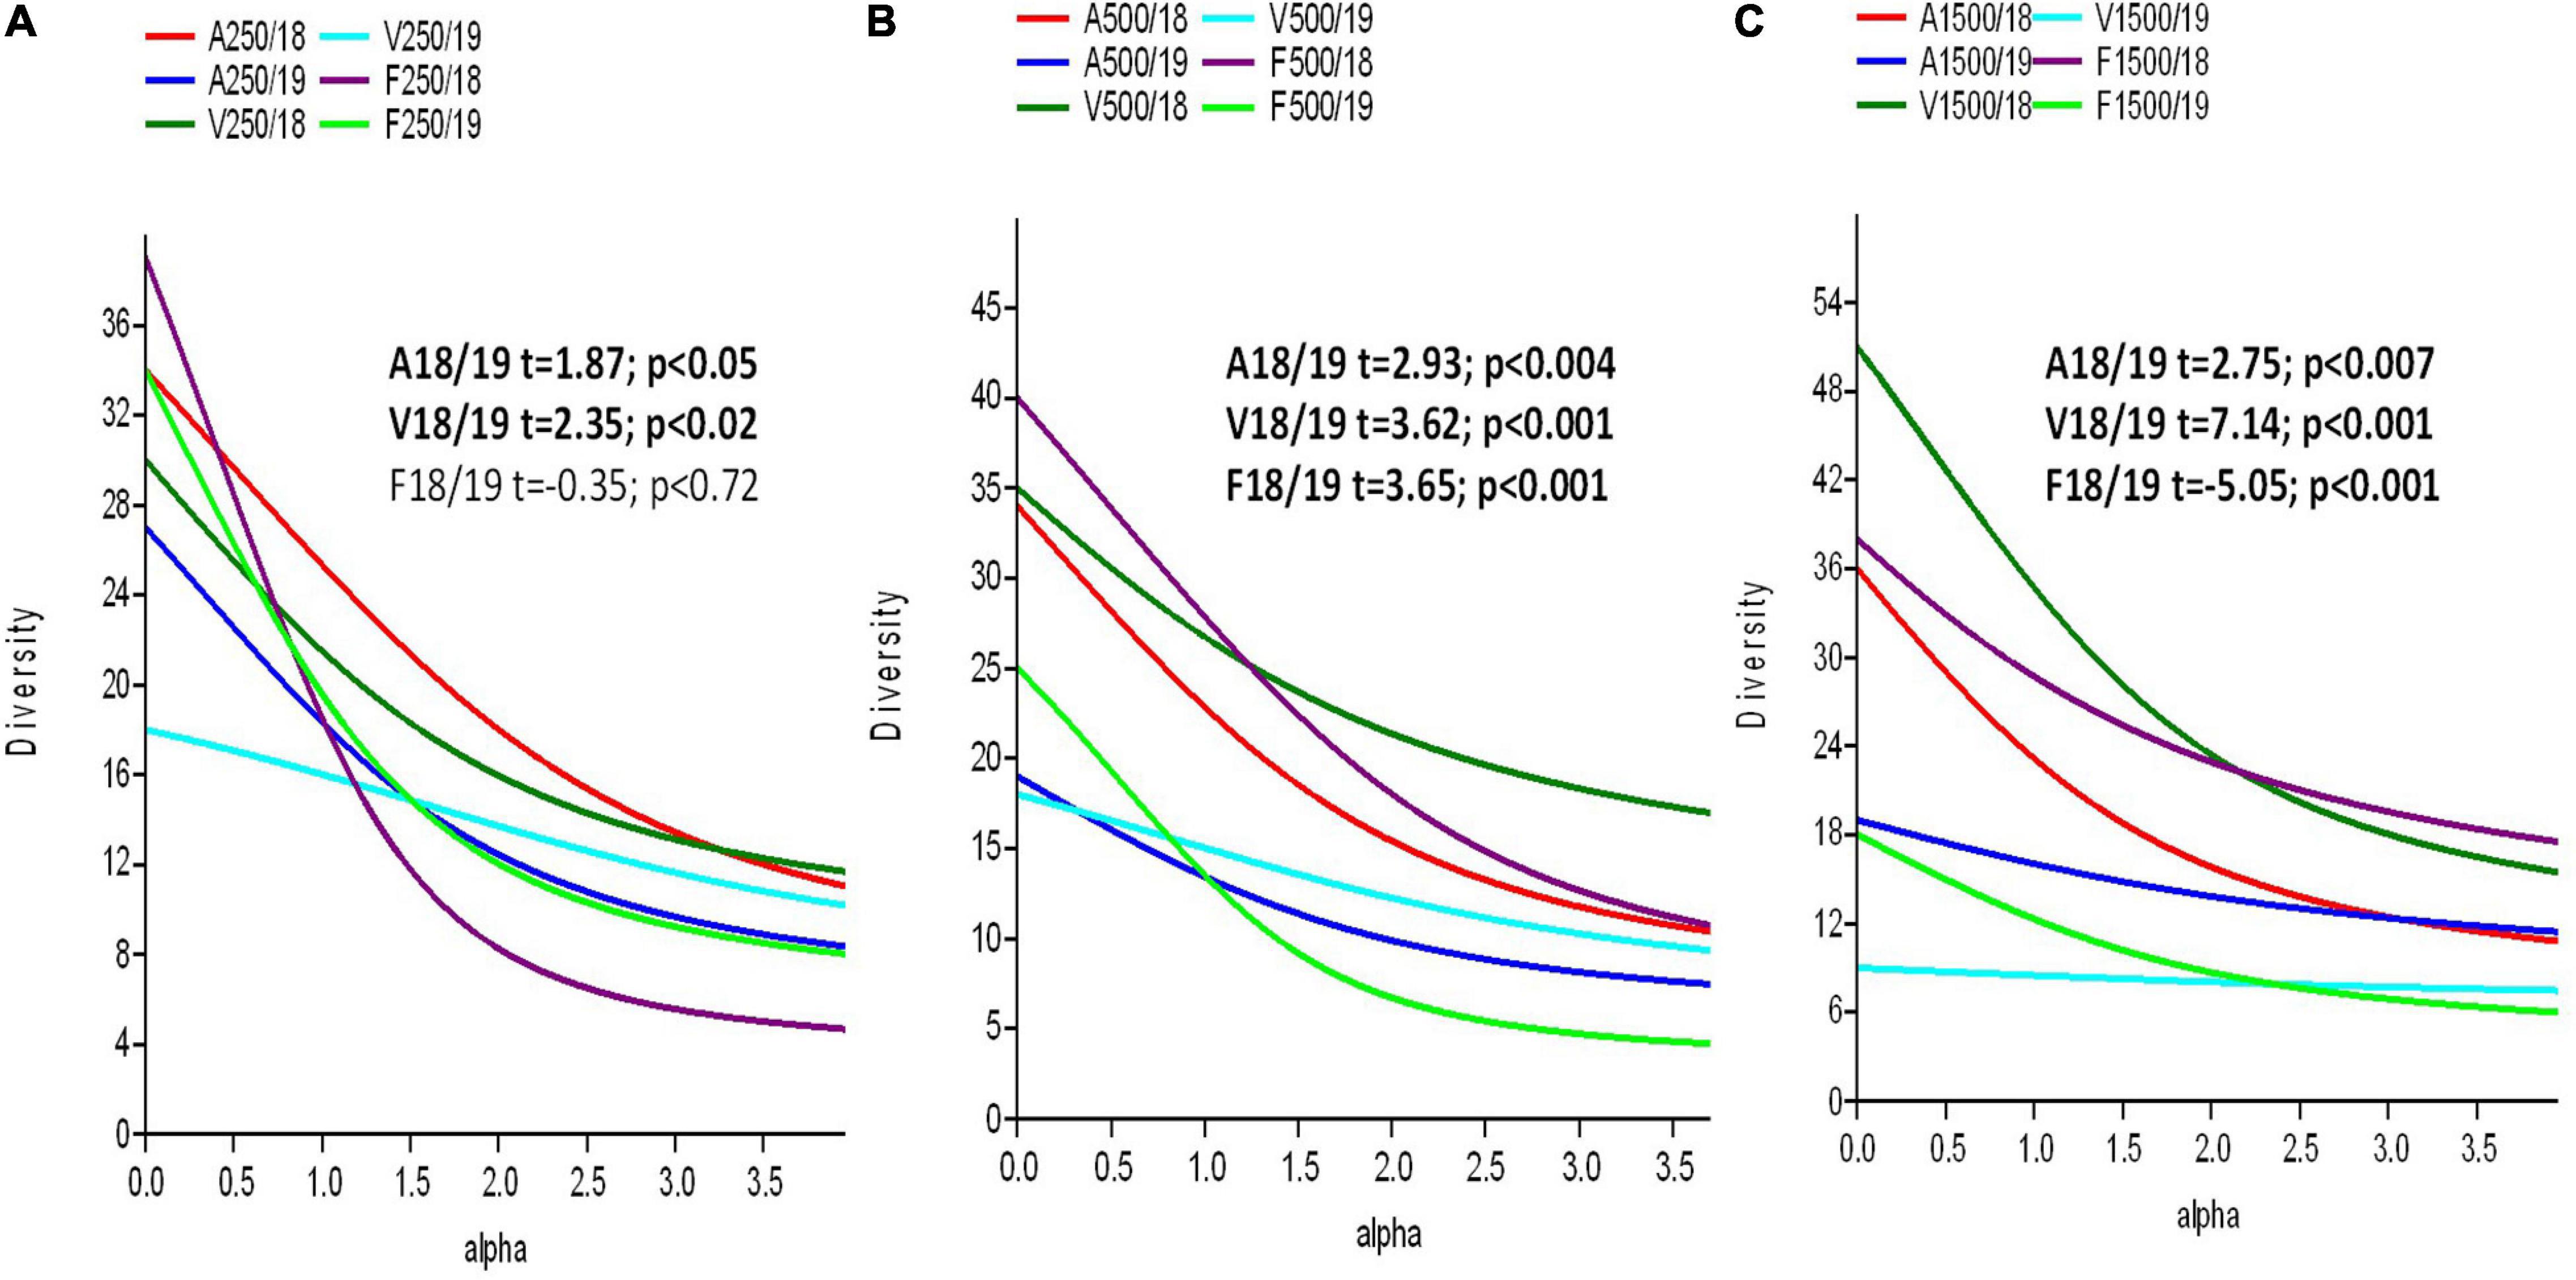
Figure 3. The diversity profiles and diversity T-test of wild bees between years in the same site from 250 m (A), 500 m (B), and 1,500 m (C) from beehives. A confidence limit of P < 0.05 was considered. Methods reported by Tóthmérész (1995) were used.
Considering separately, the effects of honeybees on small and large bees for each site, year, and distance from beehives (MANOVA and χ2 test) revealed a significant decrease in small bee species richness at all distances and all sites from 2018 when experiments started in 2019. As an example, in site A, 34 species at 250 m and 500 m and 36 species at 1,500 m were detected in 2018, this was reduced to 26 species at 250, 18 at 500, and 19 at 1,500 m in 2019. No such trend in large bee species richness was observed (Figures 4A,B). More significant decreases in site V were detected from 2018 when 28, 35, and 51 species from small bees were collected in 2019, and when only 17 species at 250 and 500 m and seven species at 1,500 m were counted again, no such decreases of large bees were detected (Figures 4C,D). Also, a small decrease of small bees (38, 40, and 39 species in 2018 and 34, 24, and 16 species in 2019) and no change in large bees were observed in control site F (Figures 4E,F). Changes in abundances at small bees can also be detected from one year to another and no changes at large bees. No clear trend in species and abundance variations for endangered species was observed. Altogether the data present that honeybees, in general, had a negative effect on both small and large bees and on endangered species, but if years and distances from beehives are considered in analyses as explanatory variables and species group as a response variable, a significant negative effect on only small bees can be detected (Table 1).
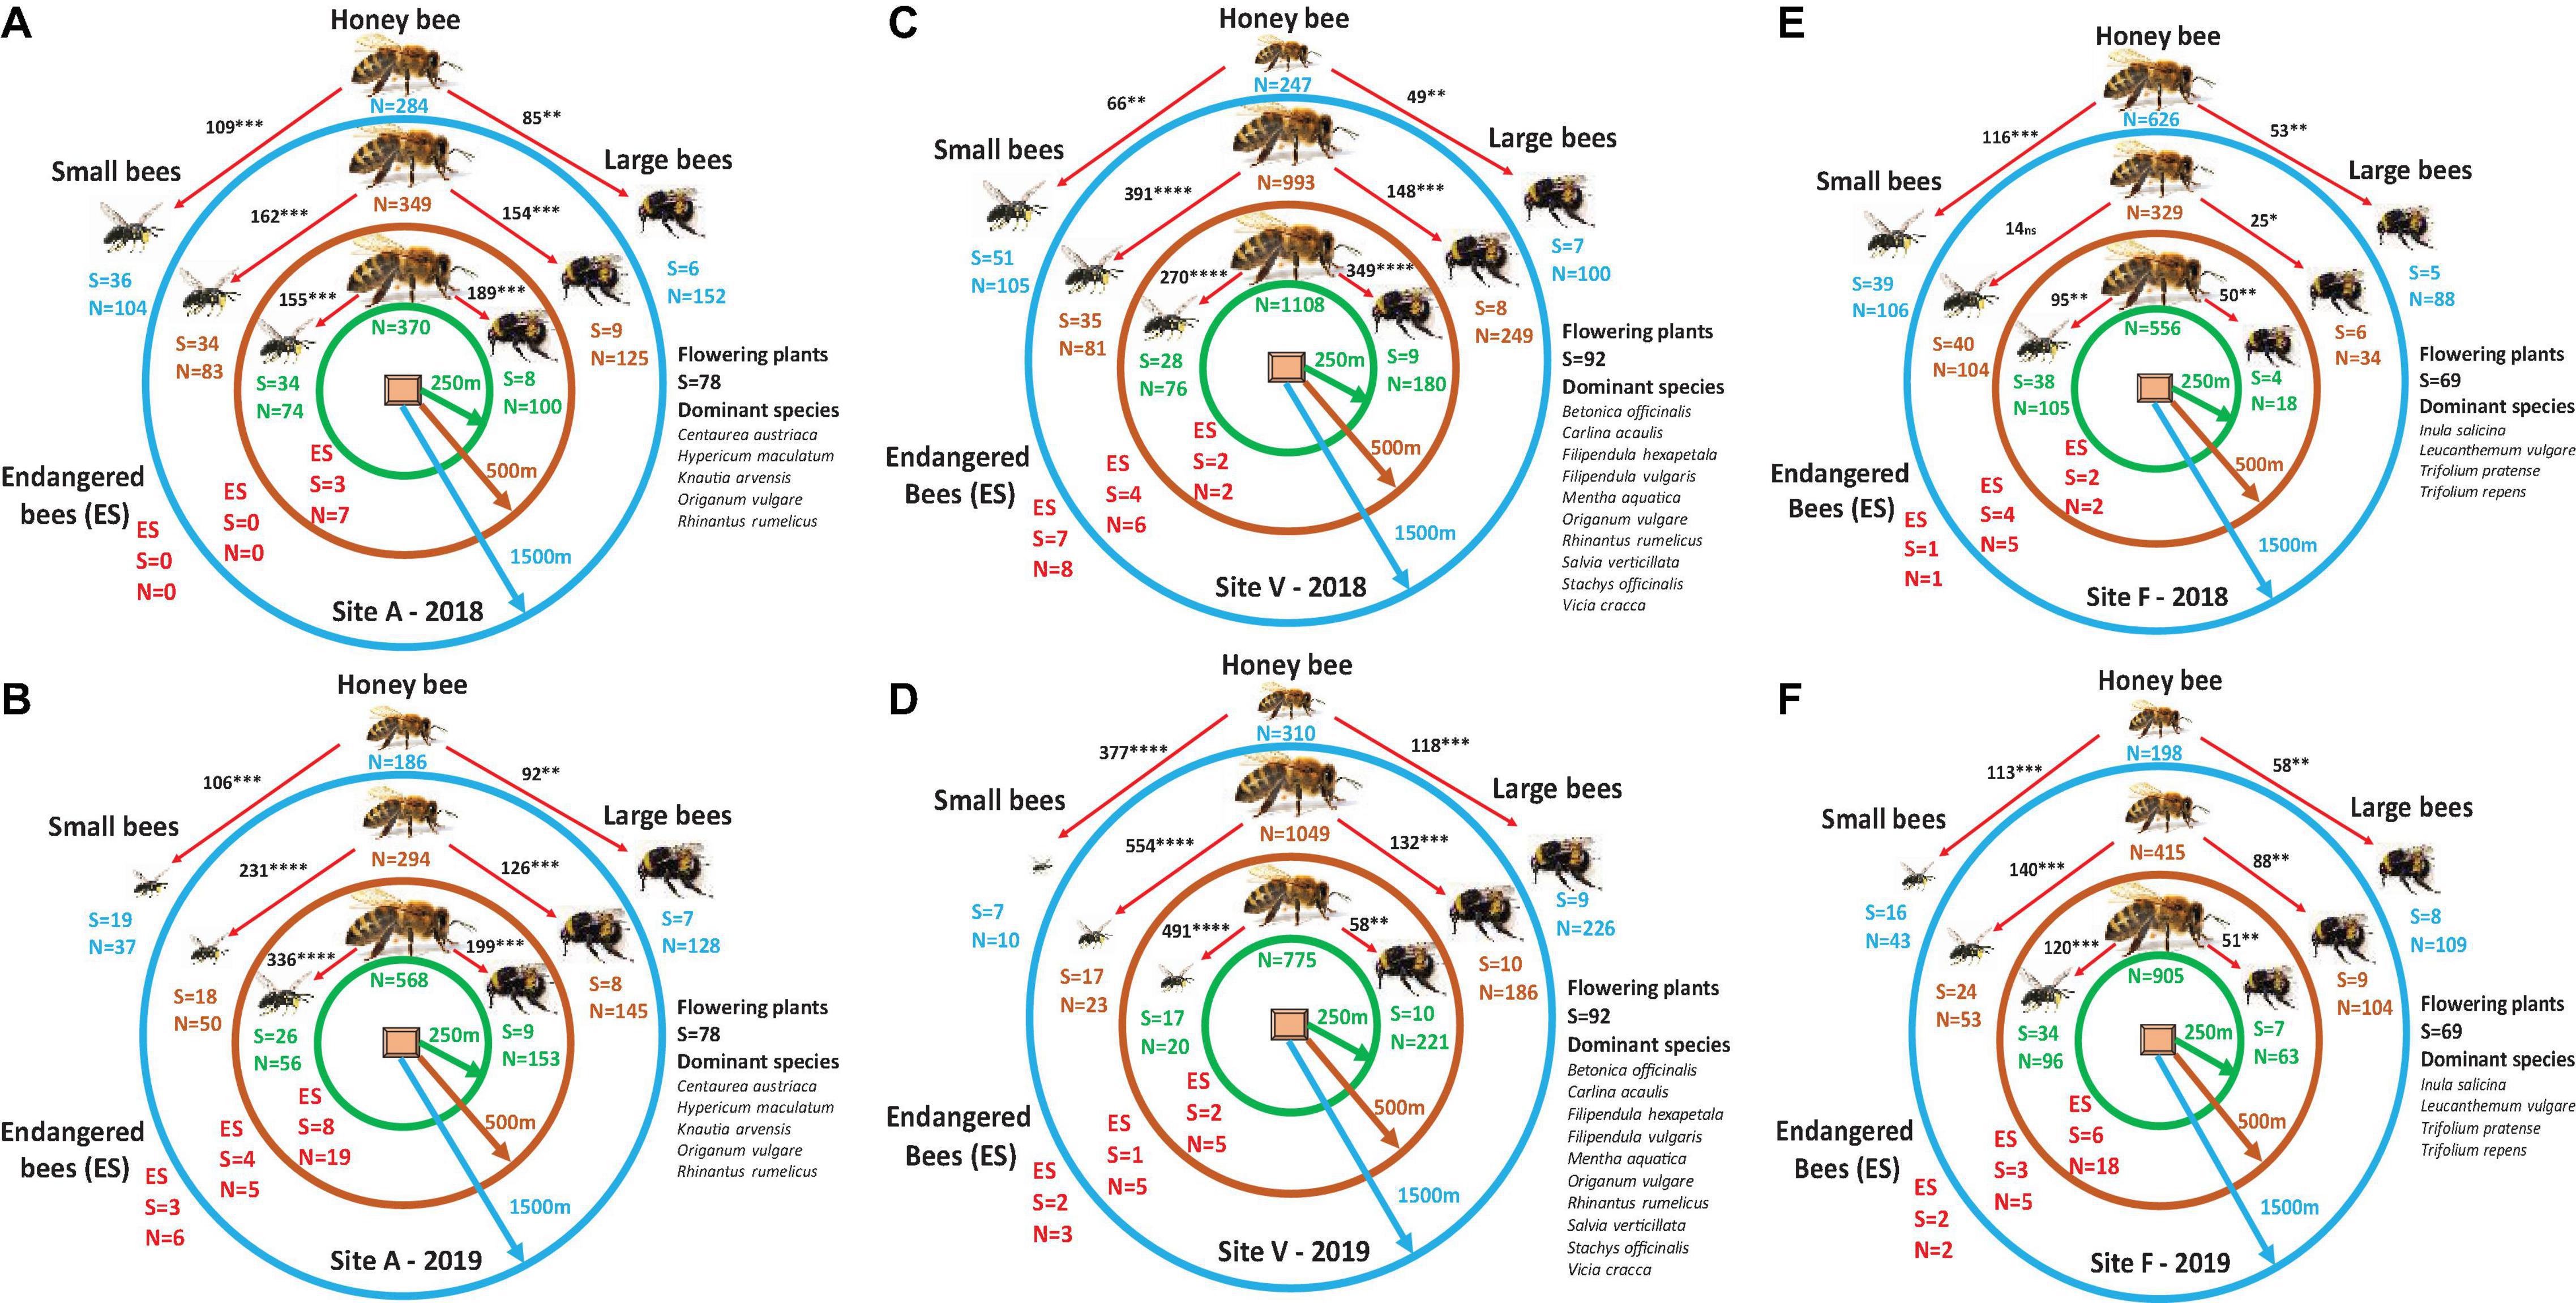
Figure 4. The variation in the densities of honeybees as well as small and large bees for each site, year, and distance from beehives, respectively [multivariate ANOVA (MANOVA)], and interactions tested using χ2 tests on the differences between the covariance matrices and by the root mean square error of approximation. The initial comparison was made between the densities of honeybees and the densities of small and large bees for each distance separately. Due to the low density of endangered species, comparisons were made without statistical analyses. S, number of species; N, number of individuals. Green circles represent 250 m, brown circles represent 500 m, and blue circles represent 1,500 m distances from beehives. Chi-square values are presented in black inside figures, ***P < 0.001, **P < 0.01, NS denotes not significant.
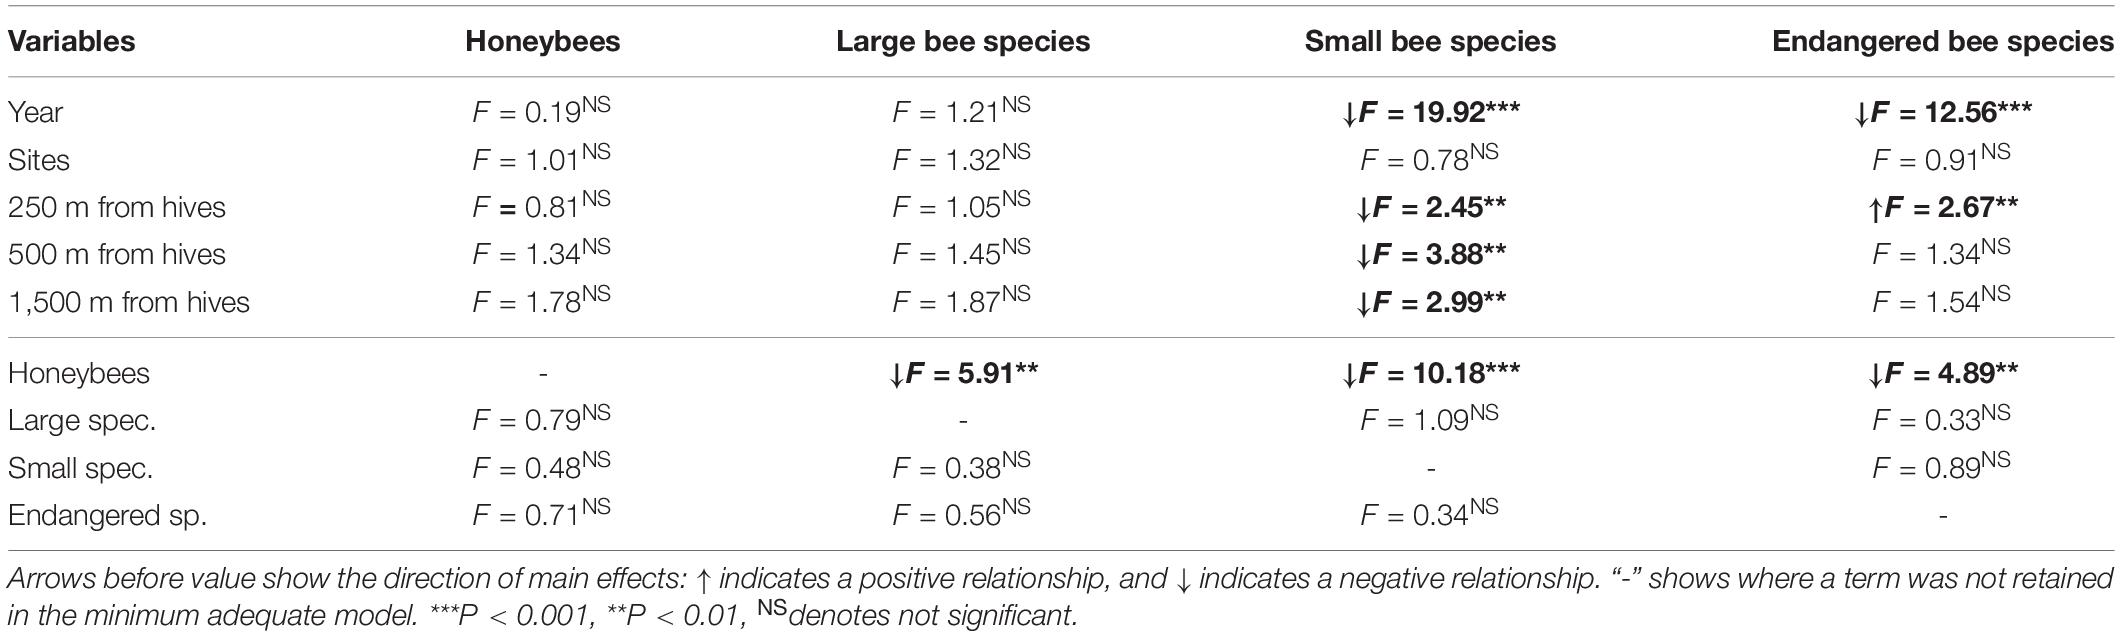
Table 1. The effect of years, sites, and distances on honeybee, small bees, and large bees, respectively, on endangered species (relative proportion found in each sampling data) using each species group as a response variable and the sites, years, and distances as explanatory variables.
The canonical correspondence analyses revealed again high species richness variation between years when sites were considered as grouping factors (Figure 5A) but also when distances from beehives were considered as grouping factors (Figure 5B). In both cases, year effect determined 30% species distributions, while site effect was only representative at 20%.
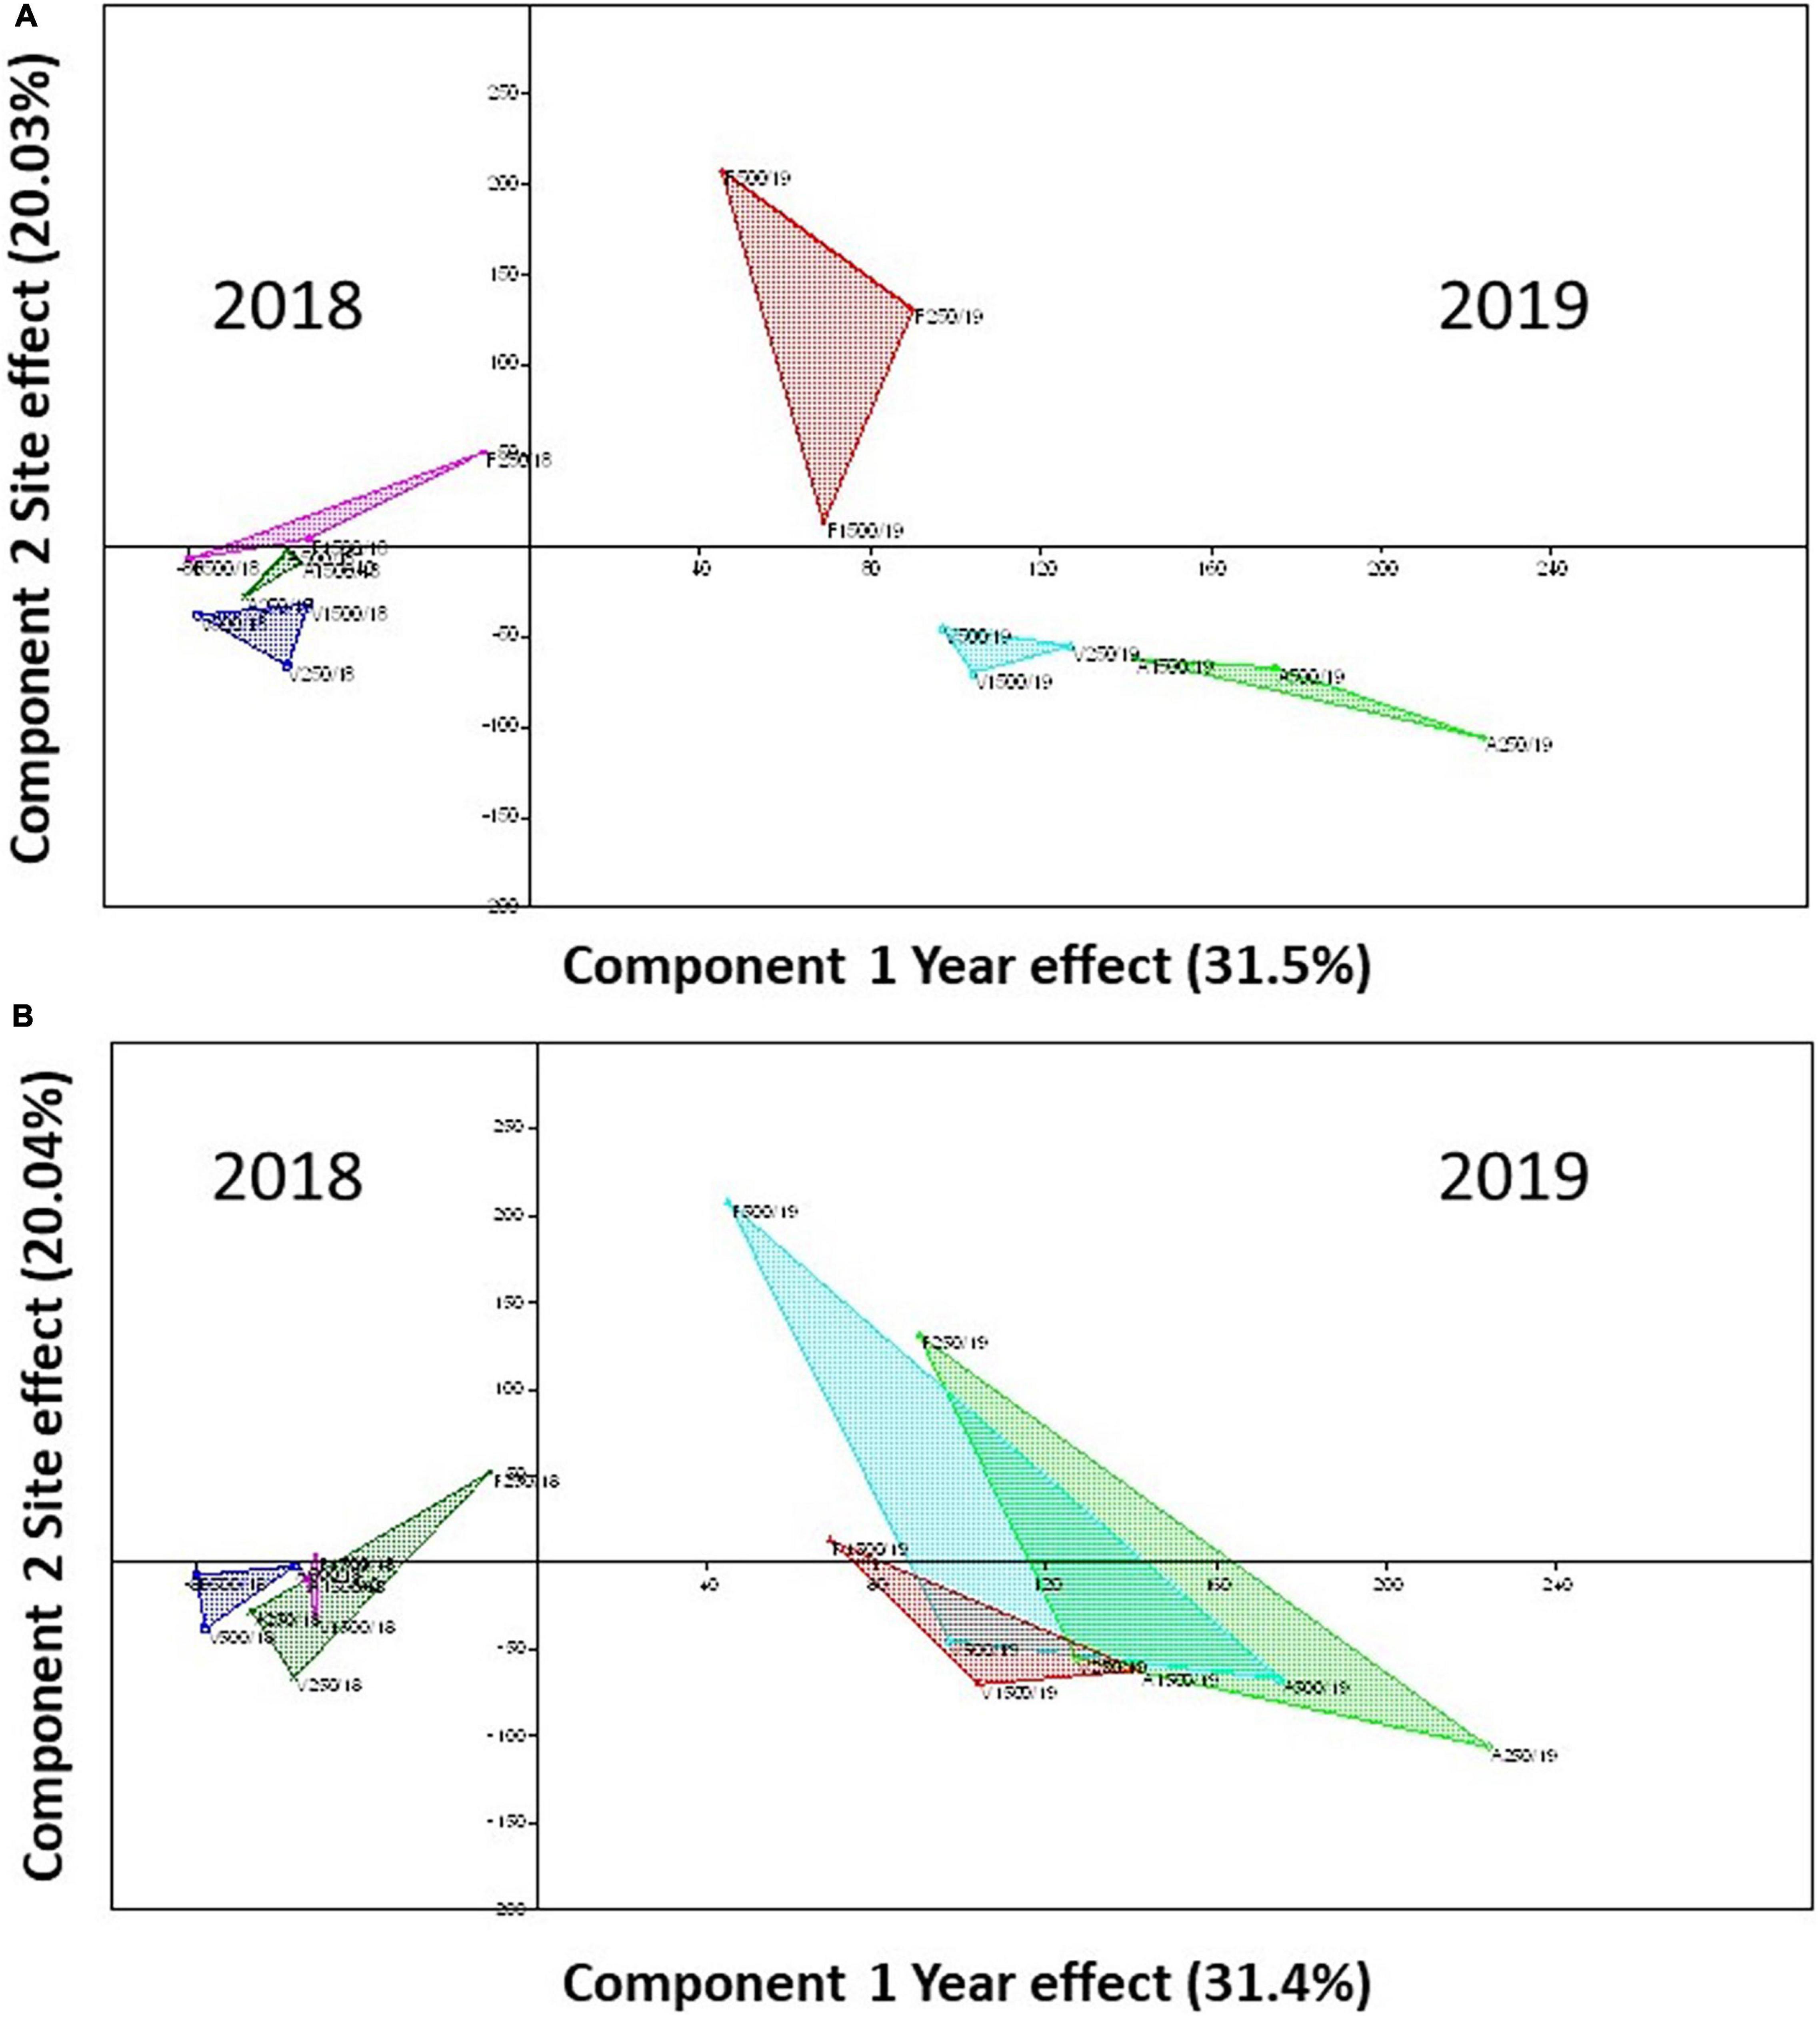
Figure 5. The canonical correspondence analyses to test the species overlap between sites and years, where sites and years were used as components and species densities as variables. (A) species composition by sites; (B) species composition by distances from beehives. Green color represents site A, blue represents site V, and red represents site F panel in (A), while the green color represents 250 m, blue represents 500 m, and red 1,500 m distances from beehives in panel (B).
Discussion
Altogether no general trend in decrease or increase in wild bee species richness and abundances was detected; however, wild bee abundances increased in 2018 with distances from beehives in all sites. While other similar researches clearly detected the negative influence of honeybees on wild bee species (Mallinger et al., 2017), we cannot conclude such a very clear effect for all distances from beehives (especially when large wild bees are considered). This finding comes partially in concordance with our first hypothesis, such as wild bee species richness increasing with distances from beehives. This was clearly detected in 2018 at site V and less obvious in sites A and F. This can be due to the competition with honeybees; however, the trend has changed in 2019, decreases in abundances in sites A and F were detected with distances, and no changes in site V observed. The rapid change in the first year of contact with honeybees was observed, and the change in species diversity and community structure of wild bees (mostly small bee species) was detected. This new community structure in the next year was less sensible to the honeybees, and the effect with distances was not significant. This can be because European wild bee communities are more tolerant to honeybees, because A. mellifera is native in Eurasia. Even if no previous interactions were reported (in two of our sites), still the habitat and floral diversity may have delaying effects on competition. The long-term presence of honeybees in other habitats (our F site) has no significant negative effect in all cases on wild bee populations as niche overlap is not a forcing effect for food competition (Paini, 2004; Habel et al., 2019).
Considering separately large and small bee species richness, a significant decay in species numbers can be detected only at small bee species but not at large ones. However, in the control area, we examined that (site F), where 60 families of honeybees have been regularly displaced during the season, the number of bumblebees was 70 and 48% lower in 2018 and 2019, respectively, compared to the other two study areas. In light of this research, it is possible that the long-term presence of the honeybee hive at the control site (site F) led to a decreased abundance of bumblebees. Generalist bees tend to be more significantly affected by honeybees than oligolectic bees (Wojcik et al., 2018). Thus, honeybees, which have been present in area F for a long time and in smaller numbers, were more likely to have a greater effect on bumblebees, reducing their numbers (Thomson, 2004) and causing bumblebees to avoid foraging areas where the numbers of honeybees were high, and thus, the lack of food sources or interference is also significant (Rogers et al., 2013). Other studies suggest that bumblebees are forced to select suboptimal foraging areas to avoid honeybees (Walther-Hellwig et al., 2006). In addition to the short-term and direct competitive effects mentioned above, competition with honeybees may have the long-term, multiyear effects on the bumblebee community through body size reduction and consequent changes in fecundity. Such an effect can be, for example, a slowing of the weight gain of the bumblebee colony and a decrease in the body size of queens and workers (Elbgami et al., 2014). Body size plays an important role in winter hibernation in bumblebee queens, so a decrease in body size can also lead to a decrease in reproductive capacity in the long run (Elbgami et al., 2014).
In addition to the decline in species number of small bees, a high exchange in species richness composition has been observed, and differences in species richness and diversity can also be detected from one year to another. This may be due to the competition, but the confirmation of this would require further research. However, in the case of small bees, even if their numbers have not decreased near apiaries, low levels of nectar and pollen can have a negative effect. Hudewenz and Klein (2015) found that the growth of Osmia bicornis was reduced in the presence of honeybees. The adult body size is directly determined by the amount of pollen and nectar consumed by the larva (Bosch, 2008). Smaller offsprings are more likely to die during development (Bosch, 2008) and wintering (Bosch and Kemp, 2002), and smaller individuals are less likely to find a nesting site (Bosch and Vicens, 2006). Low levels of food sources can also increase the number of parasites in the nest (Goodell, 2003), as females spend more time obtaining food and therefore leave nests unattended for longer periods of time (Seidelmann, 2006).
In contrast, smaller bee species require less energy to fly and maintain nesting sites (Heinrich, 1975). In addition, they require less pollen and nectar to raise offspring (Müller et al., 2019). In areas where there are large apiaries, the amount of pollen and nectar may be sufficient for small bees but not sufficient for larger species, so these are forced to look for sufficient food somewhere further away or to broaden their food spectrum to other plants (Greenleaf et al., 2007; Guedot et al., 2009), and thus, the wild bee community structure and species composition may change near the hives.
Other studies that are examining competition as a function of honeybee abundance found that competition was strongest near honeybees (usually within 800 m). Less or no effect was observed with increasing distance, suggesting that the effect of honeybees may be local (Steffan-Dewenter and Kuhn, 2003; Thomson, 2004; Walther-Hellwig et al., 2006). In this study, we did not find significant effects on abundance or species richness as a function of distance. The degree of competition and thus its direct effects may depend on the availability of resources, with significant impacts occurring only where resources are scarce, such as in the homogeneous agricultural intensification landscapes. However, competition can have less effect when abundant resources are available or when we study heterogeneous landscapes (Thomson, 2006; Herbertsson et al., 2016; Lindström et al., 2016). In addition to the heterogeneity of the landscape, the Apiary Influence Range (AIR) can vary seasonally depending on the amount of the flowering plants in the area (Couvillon et al., 2014). Our study areas are characterized by high heterogeneity, and due to the extensive pasture and meadow farming, the naturalness and plant species richness of the areas are quite high (Babai and Molnár, 2014). Probably due to this, the direct short-term effects (i.e., variations from one year to another) of the competition (i.e., a decline in abundance and species richness) are not noticeable in the results of our studies. Also, no differences in abundances and diversity can be detected in 2018, comparing data prior to and after hive placement. Nevertheless, it is important to know that the mass presence of honeybees may have not only the short-term effects on wild bees: through offspring body size (Henry and Rodet, 2020) and reducing fecundity (Hudewenz and Klein, 2015), possible food shortages may have the long-term negative effects on populations (similar to large bees, refer to the abovementioned contents).
In general, the effects of honeybees on wild bees are measured through which diversity and community structure from one year to another can be considered drastic (i.e., diversity values changed 63–67% between years depending on the site). In contrast, the honeybee can be considered native to the studied areas, so the community structure of the wild bees at the study sites probably was less sensible to the honeybee invasion. It may also be important that the relatively small number of bee colonies deployed for the experiments may not have been sufficient to exert a truly significant competitive effect. Some studies suggest that small apiaries have virtually no effect (Henry and Rodet, 2020) or may develop a much less competitive situation (Requier et al., 2017). In such circumstances, the impact of honeybees on the wild bee community would probably be observed only in long term in such areas, so the long-term monitoring of the wild bee communities would be essential, even if only the 2-year assessments were allowed in these protected areas. It would also be important to examine whether the deployment of larger apiaries (100–200 families) has similarly mild consequences. Such studies could potentially determine the approximate amount of honeybee load in nature reserves that can still be tolerated by wild bee communities.
Data Availability Statement
The original contributions presented in the study are included in the article/Supplementary Material, further inquiries can be directed to the corresponding author/s.
Ethics Statement
Ethical review and approval was not required for the animal study because working with bees does not require such approval.
Author Contributions
AB took the lead in writing the manuscript, conducted the statistical analyses, and created the figures. ID and MS contributed to the writing and provided critical feedback on the manuscript, and planned and conducted the field experiments. All authors contributed to the article and approved the submitted version.
Funding
During the study, ID had a Ph.D. “Collegium Talentum” research grant from the Sapientia Hungariae Foundation. The research was also funded by TKP2020-NKA-16_One Health.
Conflict of Interest
The authors declare that the research was conducted in the absence of any commercial or financial relationships that could be construed as a potential conflict of interest.
Publisher’s Note
All claims expressed in this article are solely those of the authors and do not necessarily represent those of their affiliated organizations, or those of the publisher, the editors and the reviewers. Any product that may be evaluated in this article, or claim that may be made by its manufacturer, is not guaranteed or endorsed by the publisher.
Acknowledgments
We would like to thank Zsolt Józan for identifying the sampled insects and the Asociaţia Speo-Turistică şi de Protecţia Naturii “Lumea Pierdută” Baraolt and Agenţia Naţională pentru Arii Naturale Protejate for the research permissions in the protected areas.
Supplementary Material
The Supplementary Material for this article can be found online at: https://www.frontiersin.org/articles/10.3389/fevo.2021.750236/full#supplementary-material
References
Aizen, M. A., Garibaldi, L. A., Cunningham, S. A., and Klein, A. M. (2009). How much does agriculture depend on pollinators? Lessons from long-term trends in crop production. Ann. Bot. 103, 1579–1588. doi: 10.1093/aob/mcp076
Babai, D., and Molnár, Z. (2014). Small-scale traditional management of highly species-rich grasslands in the Carpathians. Agric. Ecosyst. Environ. 182, 123–130. doi: 10.1016/j.agee.2013.08.018
Balfour, N. J., Garbuzov, M., and Ratnieks, F. L. W. (2013). Longer tongues and swifter handling: why do more bumble bees (Bombus spp.) than honey bees (Apis mellifera) forage on lavender (Lavandula spp.)? Ecol. Entomol. 38, 323–329. doi: 10.1111/een.12019
Bosch, J. (2008). Production of undersized offspring in a solitary bee. Anim. Behav. 75, 809–816. doi: 10.1016/j.anbehav.2007.06.018
Bosch, J., and Kemp, W. (2002). Developing and establishing bee, species as crop pollinators: the example of Osmia spp. (Hymenoptera: Megachilidae) and fruit trees. Bull. Entomol. Res. 92, 3–16. doi: 10.1079/BER2001139
Bosch, J., and Vicens, N. (2006). Relationship between body size, provisioning rate, longevity and reproductive success in females of the solitary bee Osmia cornuta. Behav. Ecol. Sociobiol. 60, 26–33. doi: 10.1007/s00265-005-0134-4
Brittain, C., Williams, N., Kremen, C., and Klein, A.-M. (2013). Synergistic effects of non-apis bees and honey bees for pollination services. Proc. R. Soc. B Biol. Sci. 280:20122767. doi: 10.1098/rspb.2012.2767
Couvillon, M. J., Schürch, R., and Ratnieks, F. L. W. (2014). Waggle dance distances as integrative indicators of seasonal foraging challenges. PLoS One 9:e93495. doi: 10.1371/journal.pone.0093495
Danner, N., Molitor, A. M., Schiele, S., Härtel, S., and Steffan-Dewenter, I. (2016). Season and landscape composition affect pollen foraging distances and habitat use of honey bees. Ecol. Appl. 26, 1920–1929. doi: 10.1890/15-1840.1
Eeraerts, M., Vanderhaegen, R., Smagghe, G., and Meeus, I. (2020). Pollination efficiency and foraging behaviour of honey bees and non-Apis bees to sweet cherry. Agric. For. Entomol. 22, 75–82. doi: 10.1111/afe.12363
Elbgami, T., Kunin, W. E., Hughes, W. O. H., and Biesmeijer, J. C. (2014). The effect of proximity to a honeybee apiary on bumblebee colony fitness, development, and performance. Apidologie 45, 504–513. doi: 10.1007/s13592-013-0265-y
Ellis, A. M., Myers, S. S., and Ricketts, T. H. (2015). Do pollinators contribute to nutritional health? PLoS One 10:e114805. doi: 10.1371/journal.pone.0114805
Gallai, N., Salles, J.-M., Settele, J., and Vaissière, B. E. (2009). Economic valuation of the vulnerability of world agriculture confronted with pollinator decline. Ecol. Econ. 68, 810–821. doi: 10.1016/j.ecolecon.2008.06.014
Garibaldi, L. A., Requier, F., Rollin, O., and Andersson, G. K. (2017). Towards an integrated species and habitat management of crop pollination. Curr. Opin. Insect Sci. 21, 105–114. doi: 10.1016/j.cois.2017.05.016
Garibaldi, L. A., Steffan-Dewenter, I., Winfree, R., Aizen, M. A., Bommarco, R., Cunningham, S. A., et al. (2013). Wild pollinators enhance fruit set of crops regardless of honey bee abundance. Science 339, 1608–1611. doi: 10.1126/science.1230200
Gathmann, A., Greiler, H.-J., and Tscharntke, T. (1994). Trap-nesting bees and wasps colonizing set-aside fields: succession and body size, management by cutting and sowing. Oecologia 98, 8–14. doi: 10.1007/BF00326084
Geldmann, J., and González-Varo, J. P. (2018). Conserving honey bees does not help wildlife. Science 359, 392–393. doi: 10.1126/science.aar2269
Geslin, B., Gauzens, B., Baude, M., Dajoz, I., Fontaine, C., Henry, M., et al. (2017). “Chapter four - massively introduced managed species and their consequences for plant–pollinator interactions,” in Advances in Ecological Research Networks of Invasion: Empirical Evidence and Case Studies, eds D. A. Bohan, A. J. Dumbrell, and F. Massol (Cambridge, MA: Academic Press), 147–199. doi: 10.1016/bs.aecr.2016.10.007
González-Varo, J. P., and Geldmann, J. (2018). Response—“Bee conservation: key role of managed bees” and “Bee conservation: inclusive solutions.” Science 360, 390–390. doi: 10.1126/science.aat3746
Goodell, K. (2003). Food availability affects Osmia pumila (Hymenoptera: Megachilidae) foraging, reproduction, and brood parasitism. Oecologia 134, 518–527. doi: 10.1007/s00442-002-1159-2
Goulson, D., and Sparrow, K. R. (2009). Evidence for competition between honeybees and bumblebees; effects on bumblebee worker size. J. Insect Conserv. 13, 177–181. doi: 10.1007/s10841-008-9140-y
Greenleaf, S. S., Williams, N. M., Winfree, R., and Kremen, C. (2007). Bee foraging ranges and their relationship to body size. Oecologia 153, 589–596. doi: 10.1007/s00442-007-0752-9
Guedot, C., Bosch, J., and Kemp, W. (2009). Relationship between body size and homing ability in the genus Osmia (Hymenoptera; Megachilidae). Ecol. Entomol. 34, 158–161. doi: 10.1111/j.1365-2311.2008.01054.x
Habel, J. C., Samways, M. J., and Schmitt, T. (2019). Mitigating the precipitous decline of terrestrial European insects: requirements for a new strategy. Biodivers. Conserv. 28, 1343–1360. doi: 10.1007/s10531-019-01741-8
Heinrich, B. (1975). Energetics of pollination. Annu. Rev. Ecol. Syst. 6, 139–170. doi: 10.1146/annurev.es.06.110175.001035
Henry, M., and Rodet, G. (2020). The apiary influence range: a new paradigm for managing the cohabitation of honey bees and wild bee communities. Acta Oecol. 105:103555. doi: 10.1016/j.actao.2020.103555
Henry, M., Béguin, M., Requier, F., Rollin, O., Odoux, J.-F., Aupinel, P., et al. (2012). A common pesticide decreases foraging success and survival in honey bees. Science 336, 348–350. doi: 10.1126/science.1215039
Herbertsson, L., Lindström, S. A. M., Rundlöf, M., Bommarco, R., and Smith, H. G. (2016). Competition between managed honeybees and wild bumblebees depends on landscape context. Basic Appl. Ecol. 17, 609–616. doi: 10.1016/j.baae.2016.05.001
Hoehn, P., Tscharntke, T., Tylianakis, J. M., and Steffan-Dewenter, I. (2008). Functional group diversity of bee pollinators increases crop yield. Proc. R. Soc. B Biol. Sci. 275, 2283–2291. doi: 10.1098/rspb.2008.0405
Hudewenz, A., and Klein, A.-M. (2015). Red mason bees cannot compete with honey bees for floral resources in a cage experiment. Ecol. Evol. 5, 5049–5056. doi: 10.1002/ece3.1762
Kleijn, D., Biesmeijer, K., Dupont, Y. L., Nielsen, A., Potts, S. G., and Settele, J. (2018). Bee conservation: inclusive solutions. Science 360, 389–390. doi: 10.1126/science.aat2054
Klein, A.-M., Vaissière, B. E., Cane, J. H., Steffan-Dewenter, I., Cunningham, S. A., Kremen, C., et al. (2007). Importance of pollinators in changing landscapes for world crops. Proc. R. Soc. B Biol. Sci. 274, 303–313. doi: 10.1098/rspb.2006.3721
Lindström, S. A. M., Herbertsson, L., Rundlöf, M., Bommarco, R., and Smith, H. G. (2016). Experimental evidence that honeybees depress wild insect densities in a flowering crop. Proc. R. Soc. B Biol. Sci. 283:20161641. doi: 10.1098/rspb.2016.1641
MacInnis, G., and Forrest, J. R. K. (2020). Field design can affect cross-pollination and crop yield in strawberry (Fragaria x ananassa D.). Agric. Ecosyst. Environ. 289:106738. doi: 10.1016/j.agee.2019.106738
Magrach, A., González-Varo, J. P., Boiffier, M., Vilà, M., and Bartomeus, I. (2017). Honeybee spillover reshuffles pollinator diets and affects plant reproductive success. Nat. Ecol. Evol. 1, 1299–1307. doi: 10.1038/s41559-017-0249-9
Mallinger, R. E., Gaines-Day, H. R., and Gratton, C. (2017). Do managed bees have negative effects on wild bees?: a systematic review of the literature. PLoS One 12:e0189268. doi: 10.1371/journal.pone.0189268
Müller, A., Prosi, R., Praz, C., and Richter, H. (2019). Nesting in bark – the peculiar life history of the rare boreoalpine osmiine bee Osmia (Melanosmia) nigriventris (Hymenoptera, Megachilidae). Alp. Entomol. 3, 105–119. doi: 10.3897/alpento.3.34409
Nieto, A., Roberts, S., Kemp, J., Rasmont, P., Kuhlmann, M., García Criado, M., et al. (2014). European Red List of Bees. Luxembourg: Publication Office of the European Union, doi: 10.2779/77003
Odoux, J.-F., Aupinel, P., Gateff, S., Requier, F., Henry, M., and Bretagnolle, V. (2014). ECOBEE: a tool for long-term honey bee colony monitoring at the landscape scale in West European intensive agroecosystems. J. Apic. Res. 53, 57–66. doi: 10.3896/IBRA.1.53.1.05
Paini, D. (2004). Impact of the introduced honey bee (Apis mellifera) (Hymenoptera: Apidae) on native bees: a review. Austral Ecol. 29, 399–407. doi: 10.1111/j.1442-9993.2004.01376.x
Potts, S. G., Biesmeijer, J. C., Kremen, C., Neumann, P., Schweiger, O., and Kunin, W. E. (2010). Global pollinator declines: trends, impacts and drivers. Trends Ecol. Evol. 25, 345–353. doi: 10.1016/j.tree.2010.01.007
Potts, S. G., Imperatriz-Fonseca, V., Ngo, H. T., Aizen, M. A., Biesmeijer, J. C., Breeze, T. D., et al. (2016). Safeguarding pollinators and their values to human well-being. Nature 540, 220–229. doi: 10.1038/nature20588
R Core Team (2013). A Language and Environment for Statistical Computing. Vienna: R Foundation for Statistical Computing.
Ranta, E., and Lundberg, H. (1980). Resource partitioning in bumblebees: the significance of differences in proboscis length. Oikos 35, 298–302. doi: 10.2307/3544643
Requier, F., Odoux, J.-F., Henry, M., and Bretagnolle, V. (2017). The carry-over effects of pollen shortage decrease the survival of honeybee colonies in farmlands. J. Appl. Ecol. 54, 1161–1170. doi: 10.1111/1365-2664.12836
Rogers, S., Cajamarca, P., Tarpy, D., and Burrack, H. (2013). Honey bees and bumble bees respond differently to inter- and intra-specific encounters. Apidologie 44, 621–629. doi: 10.1007/s13592-013-0210-0
Saunders, M. E., Smith, T. J., and Rader, R. (2018). Bee conservation: key role of managed bees. Science 360, 389–389. doi: 10.1126/science.aat1535
Schaffer, W. M., Zeh, D. W., Buchmann, S. L., Kleinhans, S., Schaffer, M. V., and Antrim, J. (1983). Competition for nectar between Introduced honey bees and native North American bees and ants. Ecology 64, 564–577. doi: 10.2307/1939976
Seidelmann, K. (2006). Open-cell parasitism shapes maternal investment patterns in the Red Mason bee Osmia rufa. Behav. Ecol. 17, 839–848. doi: 10.1093/beheco/arl017
Steffan-Dewenter, I., and Kuhn, A. (2003). Honeybee foraging in differentially structured landscapes. Proc. Biol. Sci. 270, 569–575. doi: 10.1098/rspb.2002.2292
Steffan-Dewenter, I., and Tscharntke, T. (2000). Resource overlap and possible competition between honey bees and wild bees in central Europe. Oecologia 122, 288–296. doi: 10.1007/s004420050034
Thomson, D. (2004). Competitive interactions between the invasive european honey bee and native bumble bees. Ecology 85, 458–470.
Thomson, D. M. (2006). Detecting the effects of introduced species: a case study of competition between Apis and Bombus. Oikos 114, 407–418. doi: 10.1111/j.2006.0030-1299.14604.x
Thomson, D. M. (2016). Local bumble bee decline linked to recovery of honey bees, drought effects on floral resources. Ecol. Lett. 19, 1247–1255. doi: 10.1111/ele.12659
Torné-Noguera, A., Rodrigo, A., Osorio, S., and Bosch, J. (2016). Collateral effects of beekeeping: Impacts on pollen-nectar resources and wild bee communities. Basic Appl. Ecol. 17, 199–209. doi: 10.1016/j.baae.2015.11.004
Tóthmérész, B. (1995). Comparison of different methods for diversity ordering. J. Veg. Sci. 6, 283–290. doi: 10.2307/3236223
Walther-Hellwig, K., Fokul, G., Frankl, R., Büchler, R., Ekschmitt, K., and Wolters, V. (2006). Increased density of honeybee colonies affects foraging bumblebees. Apidologie 37, 517–532. doi: 10.1051/apido:2006035
Wojcik, V. A., Morandin, L. A., Davies Adams, L., and Rourke, K. E. (2018). Floral resource competition between honey bees and wild bees: is there clear evidence and can we guide management and conservation? Environ. Entomol. 47, 822–833. doi: 10.1093/ee/nvy077
Keywords: Apis mellifera, small bees, large bees, diversity, change in community structure, high natural value habitats
Citation: Demeter I, Balog A and Sárospataki M (2021) Variation of Small and Large Wild Bee Communities Under Honeybee Pressure in Highly Diverse Natural Habitats. Front. Ecol. Evol. 9:750236. doi: 10.3389/fevo.2021.750236
Received: 30 July 2021; Accepted: 03 November 2021;
Published: 02 December 2021.
Edited by:
Michael Hrncir, University of São Paulo, BrazilReviewed by:
Victoria Wojcik, Pollinator Partnership Canada, CanadaSándor Keszthelyi, University of Kaposvár, Hungary
Copyright © 2021 Demeter, Balog and Sárospataki. This is an open-access article distributed under the terms of the Creative Commons Attribution License (CC BY). The use, distribution or reproduction in other forums is permitted, provided the original author(s) and the copyright owner(s) are credited and that the original publication in this journal is cited, in accordance with accepted academic practice. No use, distribution or reproduction is permitted which does not comply with these terms.
*Correspondence: Adalbert Balog, YWRhbGJlcnQuYmFsb2dAbXMuc2FwaWVudGlhLnJv; Miklós Sárospataki, U2Fyb3NwYXRha2kuTWlrbG9zQHVuaS1tYXRlLmh1