 Carolina Sousa de Sá Leitão1*
 Érica M. S. Souza2
 Carlos H. A. Santos1,3
 Pedro Val4
 Adalberto L. Val1
 Vera M. F. Almeida-Val1
- 1Laboratório de Ecofisiologia e Evolução Molecular, Instituto Nacional de Pesquisas da Amazônia, Manaus, Brazil
- 2Centro de Biologia Molecular and Engenharia Genética, Universidade Estadual de Campinas, Campinas, Brazil
- 3Universidade Federal Rural de Pernambuco, Unidade Acadêmica de Serra Talhada, Serra Talhada, Brazil
- 4Departamento de Geologia, Universidade Federal de Ouro Preto, Ouro Preto, Brazil
Alterations, such as drainage network reorganization, in the landscape in the Amazon basin influence the distribution range and connectivity of aquatic biota and, therefore, their evolution. River capture is a geomorphic mechanism of network reorganization by which a basin captures large portions of the network of a neighboring basin, thus creating a barrier against species dispersal. In this study, the influence of river capture on the genetic differentiation and structuring of two dwarf cichlids species (Apistogramma pertensis and Apistogramma gephyra) is investigated in two tributaries of the lower Negro River. The analysis of 11 loci microsatellite and three mitochondrial DNA genes (Cytochrome b, Citochrome c Oxidase subunit I and 16S ribosomal RNA) confirmed the populational isolation of two dwarf cichlids species, suggesting that they represent evolutionary significant units (ESU) that have been isolated—probably due to the river capture event. The paleovalley that resulted from the river capture is therefore an important physical barrier that separates the populations of the Cuieiras and Tarumã-Mirim Rivers. The findings herein provide evidence of a mechanistic link between the isolation and differentiation of fish populations and the drainage evolution of the Amazon basin, and indicate that the dynamic geological history of the region has promoted species diversification. The process described here partially explains the high diversity in the genus Apistogramma and the information obtained is beneficial to conservation programs.
Introduction
The Amazon region has gone through many landscape changes, such as the Andes uplift, marine incursions, and river shift (Rossetti and Toledo, 2007; Hoorn et al., 2010), since the Palaeogene period. These large-scale climatic and geologic events share important roles in the making of today’s Amazonian biogeography and biodiversity (Hoorn et al., 2010; Rull, 2011). However, the biotic consequences of local landscape changes in the Central and Eastern Amazon that ensued in response to regional landscape changes, such as the formation of the transcontinental Amazon River, remain poorly understood.
Large rivers, such as the Negro River, constitute local barriers that prevent gene flow within many terrestrial species (Naka et al., 2012; Ribas et al., 2012; Boubli et al., 2015). As the position of large rivers changed during the geologic past, new barriers emerged, resulting in the isolation of populations (i.e., vicariant events) and, consequently, in speciation (Ribas et al., 2012; Alfaro et al., 2015; Boubli et al., 2015; Fernandes et al., 2015). Therefore, spatial patterns of aquatic biodiversity in the Amazon region are particularly promising for the investigation of the barrier-induced interruption of gene flow. These geological processes continue to reconfigure the drainage network over many areas of the Amazon River basin possibly due to its paleogeographic evolution (e.g., Hoorn et al., 2010; Stokes et al., 2018).
Endemic fish populations may have become isolated from widely distributed ones through landscape changes (Wise, 2011a,b; Albert et al., 2017), which makes them an ideal subject with which to study speciation related to geologic drivers of landscape change. The dwarf cichlids from the genus Apistogramma have over a hundred described species, which are well known to have either allopatric or sympatric geographic distributions (Kullander and Ferreira, 2005; Römer, 2006; Costa et al., 2019). It is estimated that many Apistogramma species still need to be described and thus species richness is probably underestimated (Estivals et al., 2020). The dwarf cichlids occur in all types of river waters (clear, black, and white) found in the Brazilian Amazon, though are rarely found in the main channels of the major rivers, which is a reflection of their ecology and restricted habitat requirements (Kullander, 2003). Nonetheless, most of them present a high endemic level (Estivals et al., 2020). The life history of cichlids includes parental care and territorialism, which explains their high rates of endemism. Their color patterns and morphological diversity are associated to the sexual dimorphism between males and females (López-Fernández et al., 2005; Maruska, 2014). Although little is known about the conservation status of this group of cichlids, many authors affirm that some species are sensitive to sudden changes in the environment. As such, these dwarf cichlids from the Apistogramma genus are an excellent model group for evolutionary studies related to landscape changes (Quérouil et al., 2015).
Herein, we studied the species Apistogramma gephyra and Apistogramma pertensis, which present insufficient data regarding their population status and conservation. These two species have been separated by a river capture event involving the Cuieiras and Tarumã-Mirim rivers (former lower reach of the pre-capture Cuieiras basin). Erosive processes across an active fault scarp (i.e., topographic step) led to stream capture and separation of what was once an integrated drainage basin (proto-Cuieiras River basin). The Cuieiras and Tarumã-Mirim Rivers formed a single south-flowing channel as evidenced by the continuous paleovalley that is now the drainage divide between these two basins (i.e., physical barrier) (Figure 1; Val et al., 2014). The proto-Cuieiras River basin was captured by a west-flowing tributary of the Rio Negro which had its headwaters at the topographic escarpment that still forms a drainage divide in other locations along-strike. The basins now form two separate drainage basins with a paleovalley containing paleochannel deposits in between. At this time, there is no geochronological constraint on the age of these paleochannel deposits which would provide a direct dating of the river capture event. Numerical modeling of knickpoint migration suggests a Pleistocene age (Val et al., 2014), however, we emphasize that such model uses underconstrained calibration parameters. Genetic ages of ground-birds in the lower Negro River valley suggest a Plio-Pleistocene age of landscape change in the region, also a plausible timeframe for river capture to have occurred (Ribas et al., 2012).
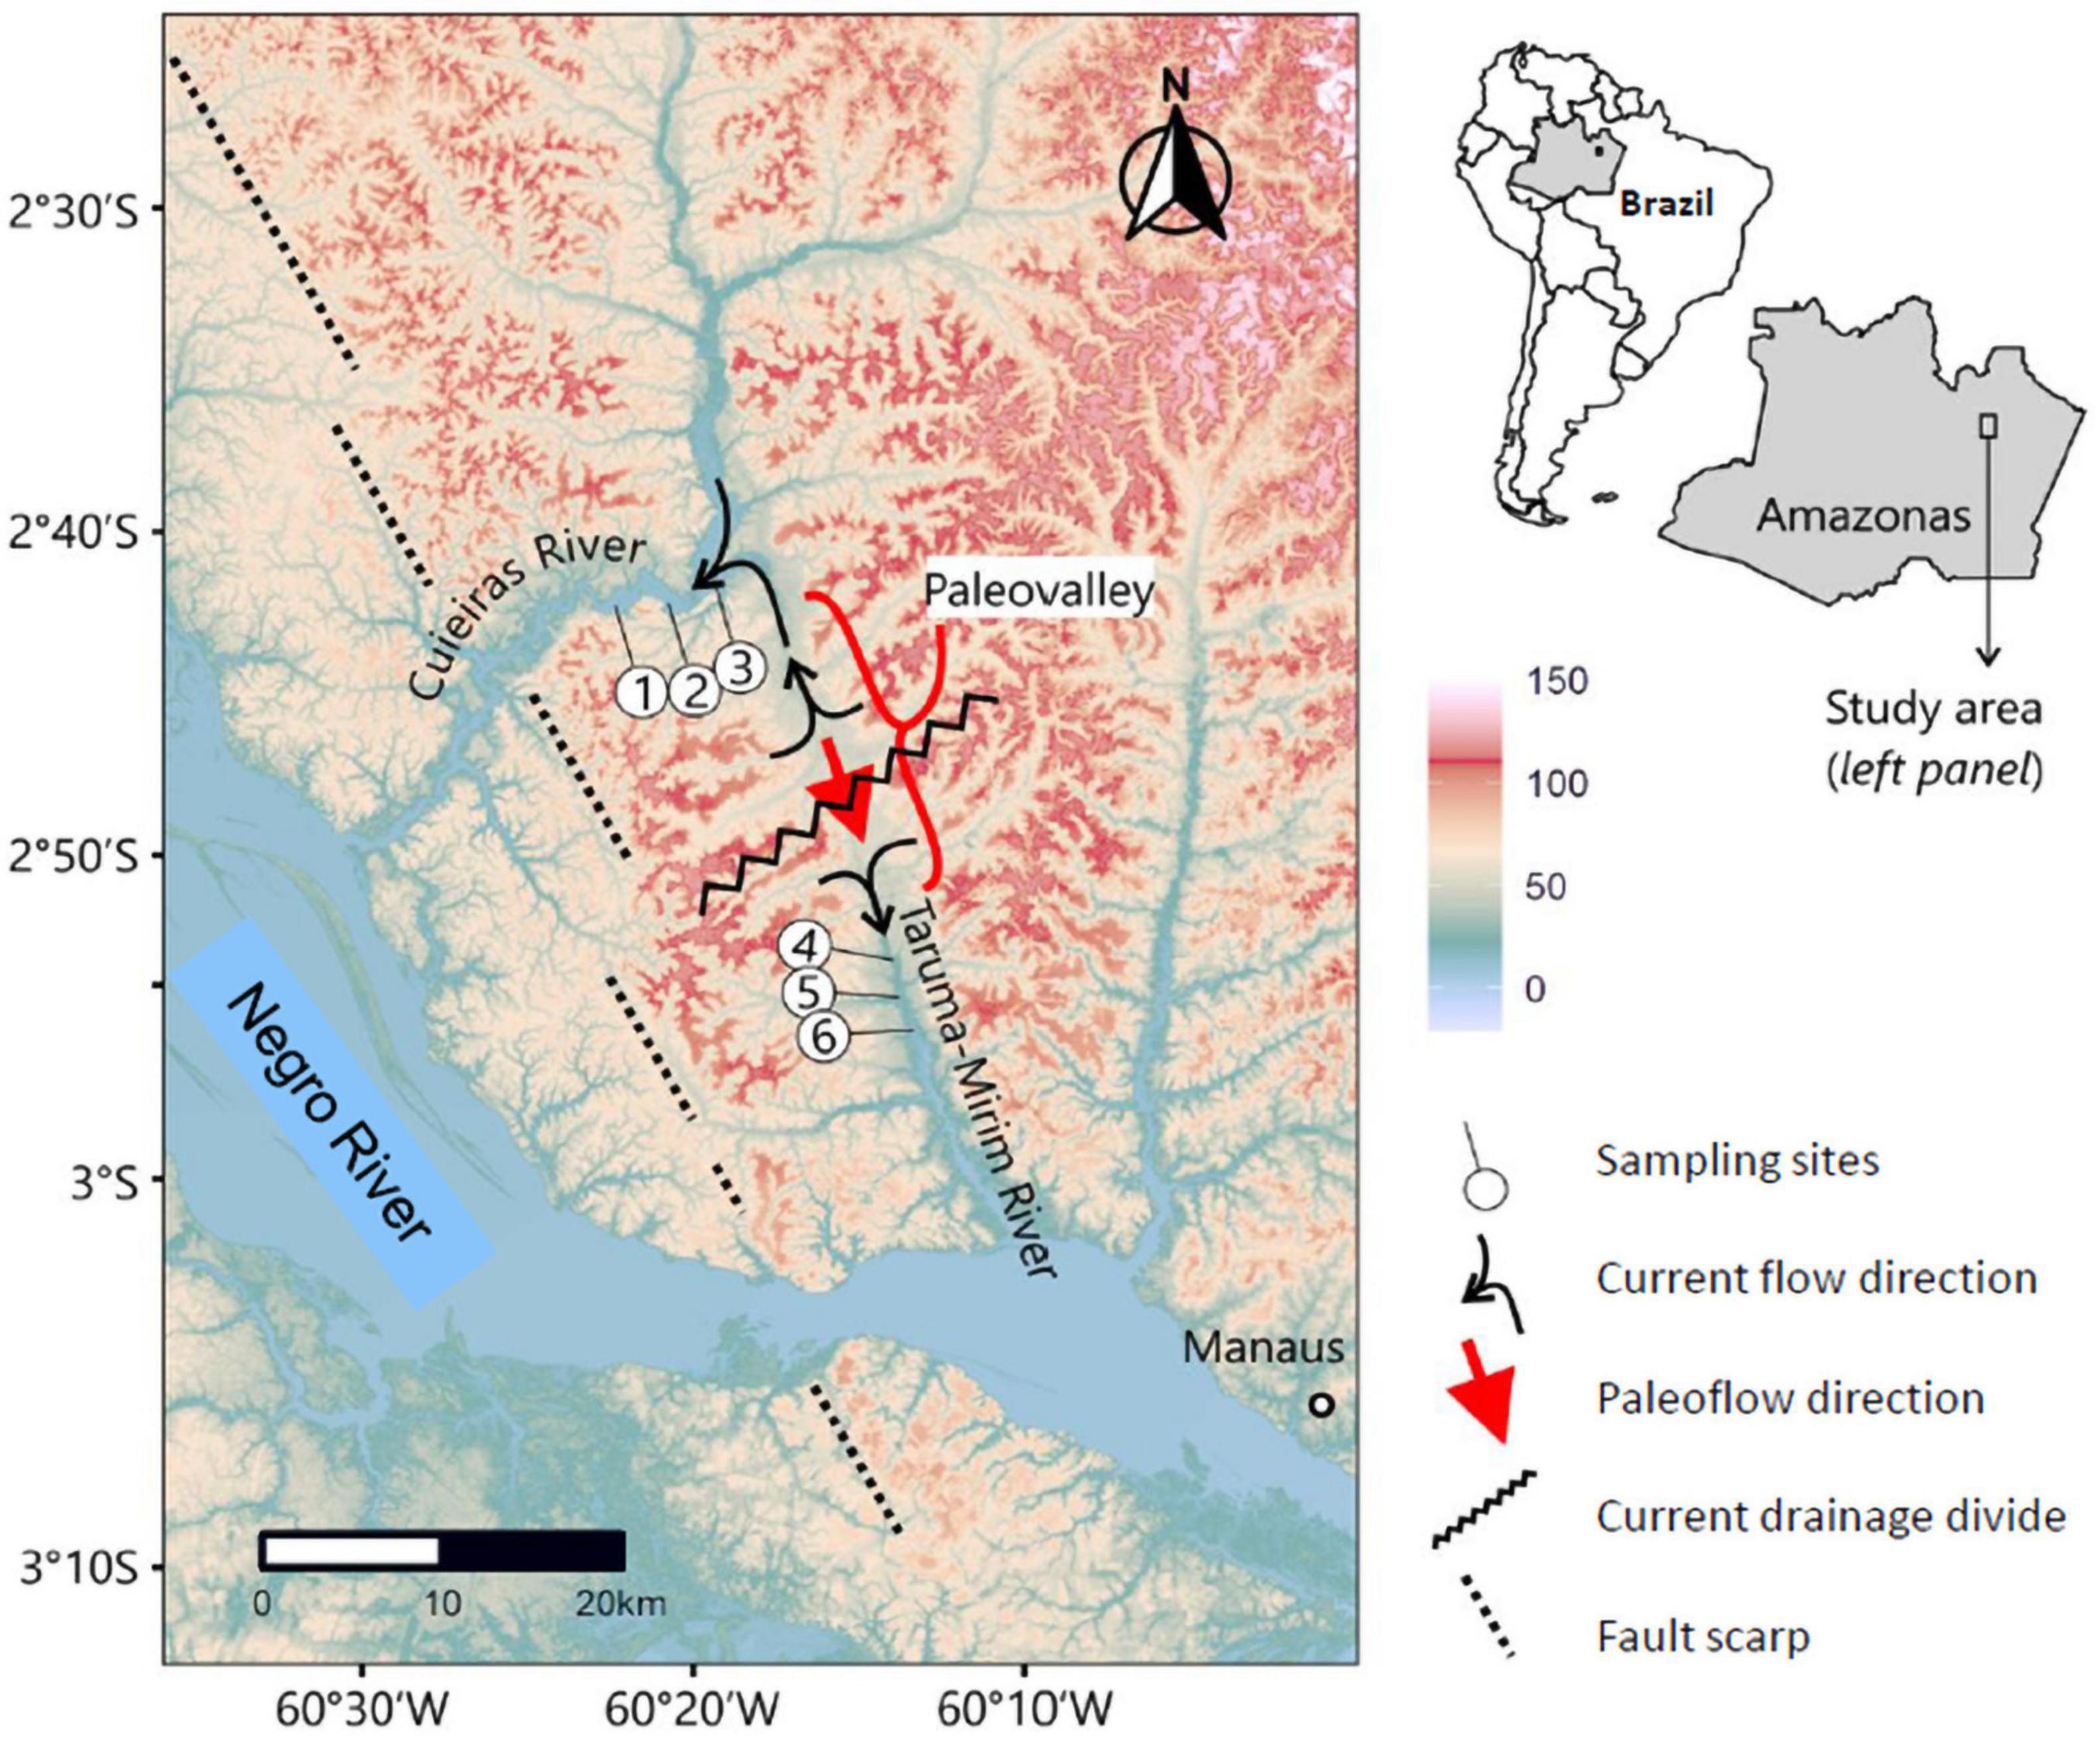
Figure 1. Location and topography of the study site. Color scheme denotes elevations above mean sea level and was obtained from a digital elevation model (Shuttle Radar Toporaphic Misson—SRTM, http://earthexplorer.usgs.gov). Map produced by Rodrigo Nahum, 2020. Locations of sampling sites, rivers, and other features of the landscape are labeled. Current and past directions of river flow are highlighted by arrows (see key).
The Tarumã-Mirim River that was left behind retains the original populations that are probably under more pressure than the populations of the Cuieiras River. Both are threatened species affected by habitat degradation and anthropic presence, as well as overfishing due to their ornamental value (Römer, 2006; Junk et al., 2007; Ramos et al., 2015; Tougard et al., 2017). This study links a specific geologic process with biological diversification in the Amazon, and has implications for understanding the mechanisms that have generated the current high diversity patterns and species endemism (Albert et al., 2017), which may help to support management and government conservation policies.
Materials and Methods
Sampling
We collected 74 individuals of A. gephyra (30 from the Cuieiras River and 44 from the Tarumã-Mirim River), and 39 individuals of A. pertensis (27 from the Cuieiras River and 12 from Tarumã-Mirim River) (Table 1), thus a total of 113 specimens. The fishing efforts were similar in both rivers (Figure 1). The taxonomic identification of both species was carefully performed by two taxonomists from INPA’s ichthyology group. The spinal cord of all animals was severed and the whole animal was placed in microtubes with 70% alcohol and transported to the Laboratory of Ecophysiology and Molecular Evolution (LEEM/INPA), where they were stored in a freezer at −80°C for posterior DNA extraction. The collection permits were provided by the Instituto Chico Mendes de Conservação da Biodiversidade (ICMBio permit #34130-1). Sampling was carried out according to the Brazilian guidelines for animal care and authorized by the Committee on the Ethics of Animal Use and Care—CEUA of the Brazilian National Institute for Amazonian Research—INPA (approval number 048/2012).
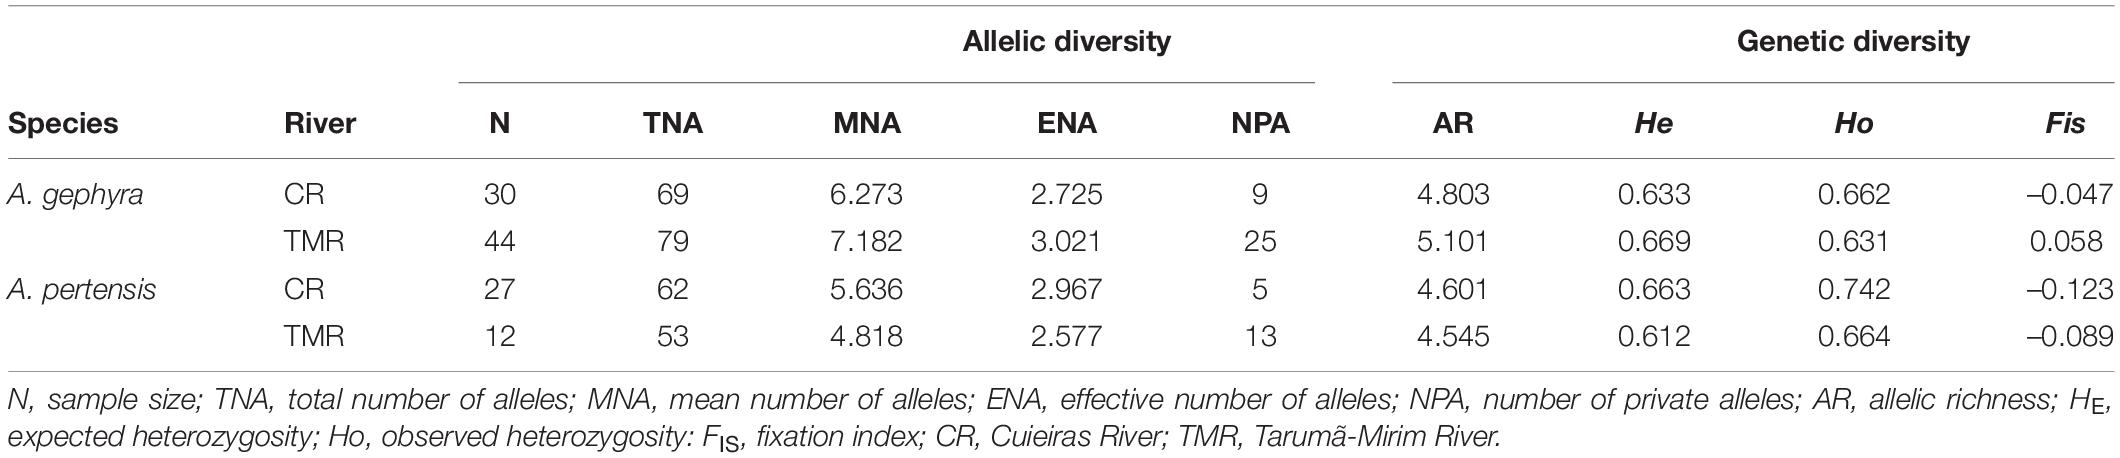
Table 1. Allelic and genetic diversity within populations of Apistogramma gephyra and Apistogramma pertensis from the Cuieira River (CR) and the Tarumã-Mirim River (TMR), based on microsatellite data.
Microsatellite Genotyping and Mitochondrial DNA (mtDNA) Sequencing
The total DNA was extracted of muscle tissue using the phenol-chloroform-isoamyl alcohol protocol described by Sambrook et al. (1989). For amplification, we used 11 microsatellite primers for A. gephyra and A. pertensis (Leitão et al., 2017). To sequence the partial mitochondrial genes, we developed two sets of primers for the genes 16S rRNA and cytochrome oxidase subunit I (COI), based on the partial sequences of these mitochondrial genes for the Apistogramma species available at GenBank—National Center for Biotechnology Information (NCBI). For the cytochrome b gene (Cyt-b), We used the primers developed by Taberlet et al. (1992) and Lydeard and Roe (1997), as suggested by Farias et al., 2001 (Supplementary Table 1). The polymerase chain reactions (PCR) conditions were as follows: for a 25 μL total volume, we used 4.0 μL of total DNA (50 ng μL–1), 1.5 μL of forward primer (5 μM), 1.5 μL of reverse primer (5 μM), 5.5 μL of H2O, and 12.5 μL PCR Master Mix 2X [Taq DNA polymerase (0.05 U), MgCl2 (1.5 mM), and dNTPs (0.4 mM)] (Fermentas, Waltham, MA, United States). Amplifications were performed with the following PCR profile: initial denaturation at 94°C for 2 min, followed by 35 cycles with denaturation at 94°C for 1 min, annealing at 50–51°C for 1 min, polymerization at 72°C for 1 min, and a final extension at 72°C for 5 min. We confirmed the amplified PCR products by electrophoresis in a 1.5% agarose gel using GelRed® (Invitrogen, Waltham, MA, United States), and we visualized it using an L-PIX Molecular Image transilluminator (Loccus Biotecnologia, Cotia, Brazil).
The genotyping of the microsatellites and the sequencing of the mitochondrial genes were performed in a genetic analyzer (ABI 3130xl, Applied Biosystems, Waltham, MA, United States) using GeneScan Liz-500 (–250) size standard to determine the fragment length of the microsatellite, and the Big Dye Terminator v3.1 kit for sequencing (Applied Biosystems, Waltham, MA, United States. The microsatellite alleles were scored based on the consistent pattern of their stutter peaks and on the peak intensity corresponding to each individual at each locus using GeneMapper v4.0 (Applied Biosystems, Waltham, MA, United States). The quality of the sequencing was verified using the 3,130 series data collection software v4 and Sequencing Analysis software v6 (Applied Biosystems, Waltham, MA, United States), respectively.
Microsatellite DNA Analysis
Using the following allelic diversity parameters of A. gephyra and A. pertensis populations, we calculated the total number of alleles (TNA), mean number of alleles (MNA), number of private alleles (NPA) using GDA v1.1 software (Lewis and Zaykin, 2002). Allelic richness (AR) was acquired using FSTAT v2.9.3.2 software (Goudet, 2001), and the number of effective alleles (NEA) was calculated using the mathematical model: NEA = 1/(1–HE). We estimated the genetic diversity through the observed and expected heterozygosity (HO and HE, respectively) in Hardy–Weinberg equilibrium, fixation index (FIS) using GENETIX v4.05.2 software (Belkhir et al., 2009).
We applied the mixture model (Admixture) ancestor to analyze the structures of the populations, which correlates the gene frequency among the studied populations. This was performed using STRUCTURE v2.3.1 (Pritchard et al., 2000; Falush et al., 2003) with a burn-in of 50,000 followed by 200,000 steps using the Markov chain Monte Carlo method (MCMC). Each analysis was repeated 10,000 times from a different randomly selected starting point, and convergence between independent runs was assessed via examination of α values and profile of posterior probabilities. The Q values from each of the 10 independent runs for each K scenario were extracted using the program STRUCTURE HARVESTER 0.6.92 (Earl and von Holdt, 2012) and summarized in the program CLUMPP 1.1.2 (Jakobsson and Rosenberg, 2007). Results were visualized in the program DISTRUCT 1.1 (Rosenberg, 2003), and a run for each analysis was performed for K = 1 and K = number of population samples + 2, with ten replicates for each K. We applied the value of ΔK suggested by Evanno et al. (2005) to identify the highest level of genetic division hierarchy.
The levels of genetic differentiation were analyzed using Wright’s F-statistics FIS and FST (Weir and Cockerham, 1984) using ARLEQUIN v3.5 software (Excoffier and Lischer, 2010), and the genetic distance (GD) was calculated using GENETIX v4.05.2. We also calculated the number of migrants (Nm) between populations by applying the FST values and the molecular variance (AMOVA) using the ARLEQUIN v3.5 software at the significance level of 5%.
Mitochondrial DNA Analysis
The sequences were edited and aligned using Geneious R7.1.8 (Biomatters Ltd., Auckland, New Zealand) and the Clustal W algorithm (Larkin et al., 2007). The genetic diversity, the total number of haplotypes (NH), the haplotype diversity (h) and the nucleotide diversity (π) (Nei, 1987) was obtained using DnaSP v5.10.1 (Librado and Rozas, 2009). Tajima’s D test (Tajima, 1989) and Fu’s FS test (Fu, 1997) were used to verify the occurrence of recent population size changes.
An analysis of molecular variance (AMOVA) was performed in ARLEQUIN v3.5. Population structure analysis was performed using the Bayesian approach implemented by BAPS 4.14 (Corander et al., 2007), in which the number of clusters was defined using an algorithm that estimates the distribution of haplotype frequencies of all populations tested. For these analyses, we applied two approaches: (1) two groups according to the rivers, to verify the segregation of the two species populations; and (2) two groups according to the species identification, to identify whether their groups are distinct and disconnected, and whether they present differences as populations between the rivers.
Results
Microsatellite DNA Results
The analysis of allelic and genetic diversity between the populations of A. gephyra and A. pertensis from the Cuieiras River (CR) and Tarumã-Mirim River (TMR) revealed a similar mean number of alleles (MNA) (Table 1). The number of private alleles (NPA) ranged from 5 to 9 for A. pertensis and A. gephyra from the Cuieiras River, and 13–25 for A. pertensis and A. gephyra from the Tarumã-Mirim River, respectively.
The results of the structural analyses for the microsatellite data clearly show the separation of the two species within each studied river (K = 2) and that ΔK = 430 (Supplementary Figure 1) yield a clear separation between the species analyzed. The same result was observed with DNA mitochondrial data using BAPS. For K = 3 and K = 4, we observed the formation of two distinct populations for each species between the Cuieiras and Tarumã-Mirim Rivers, respectively (Figure 2). For K = 4, a possible sign of hybridization is suggested between the species A. gephyra and A. pertensis in the Cuieiras River, but in order to verify the actual existence of such hybridization process, it would be necessary to increase the number of samples, as well as increase the number of microsatellite markers.
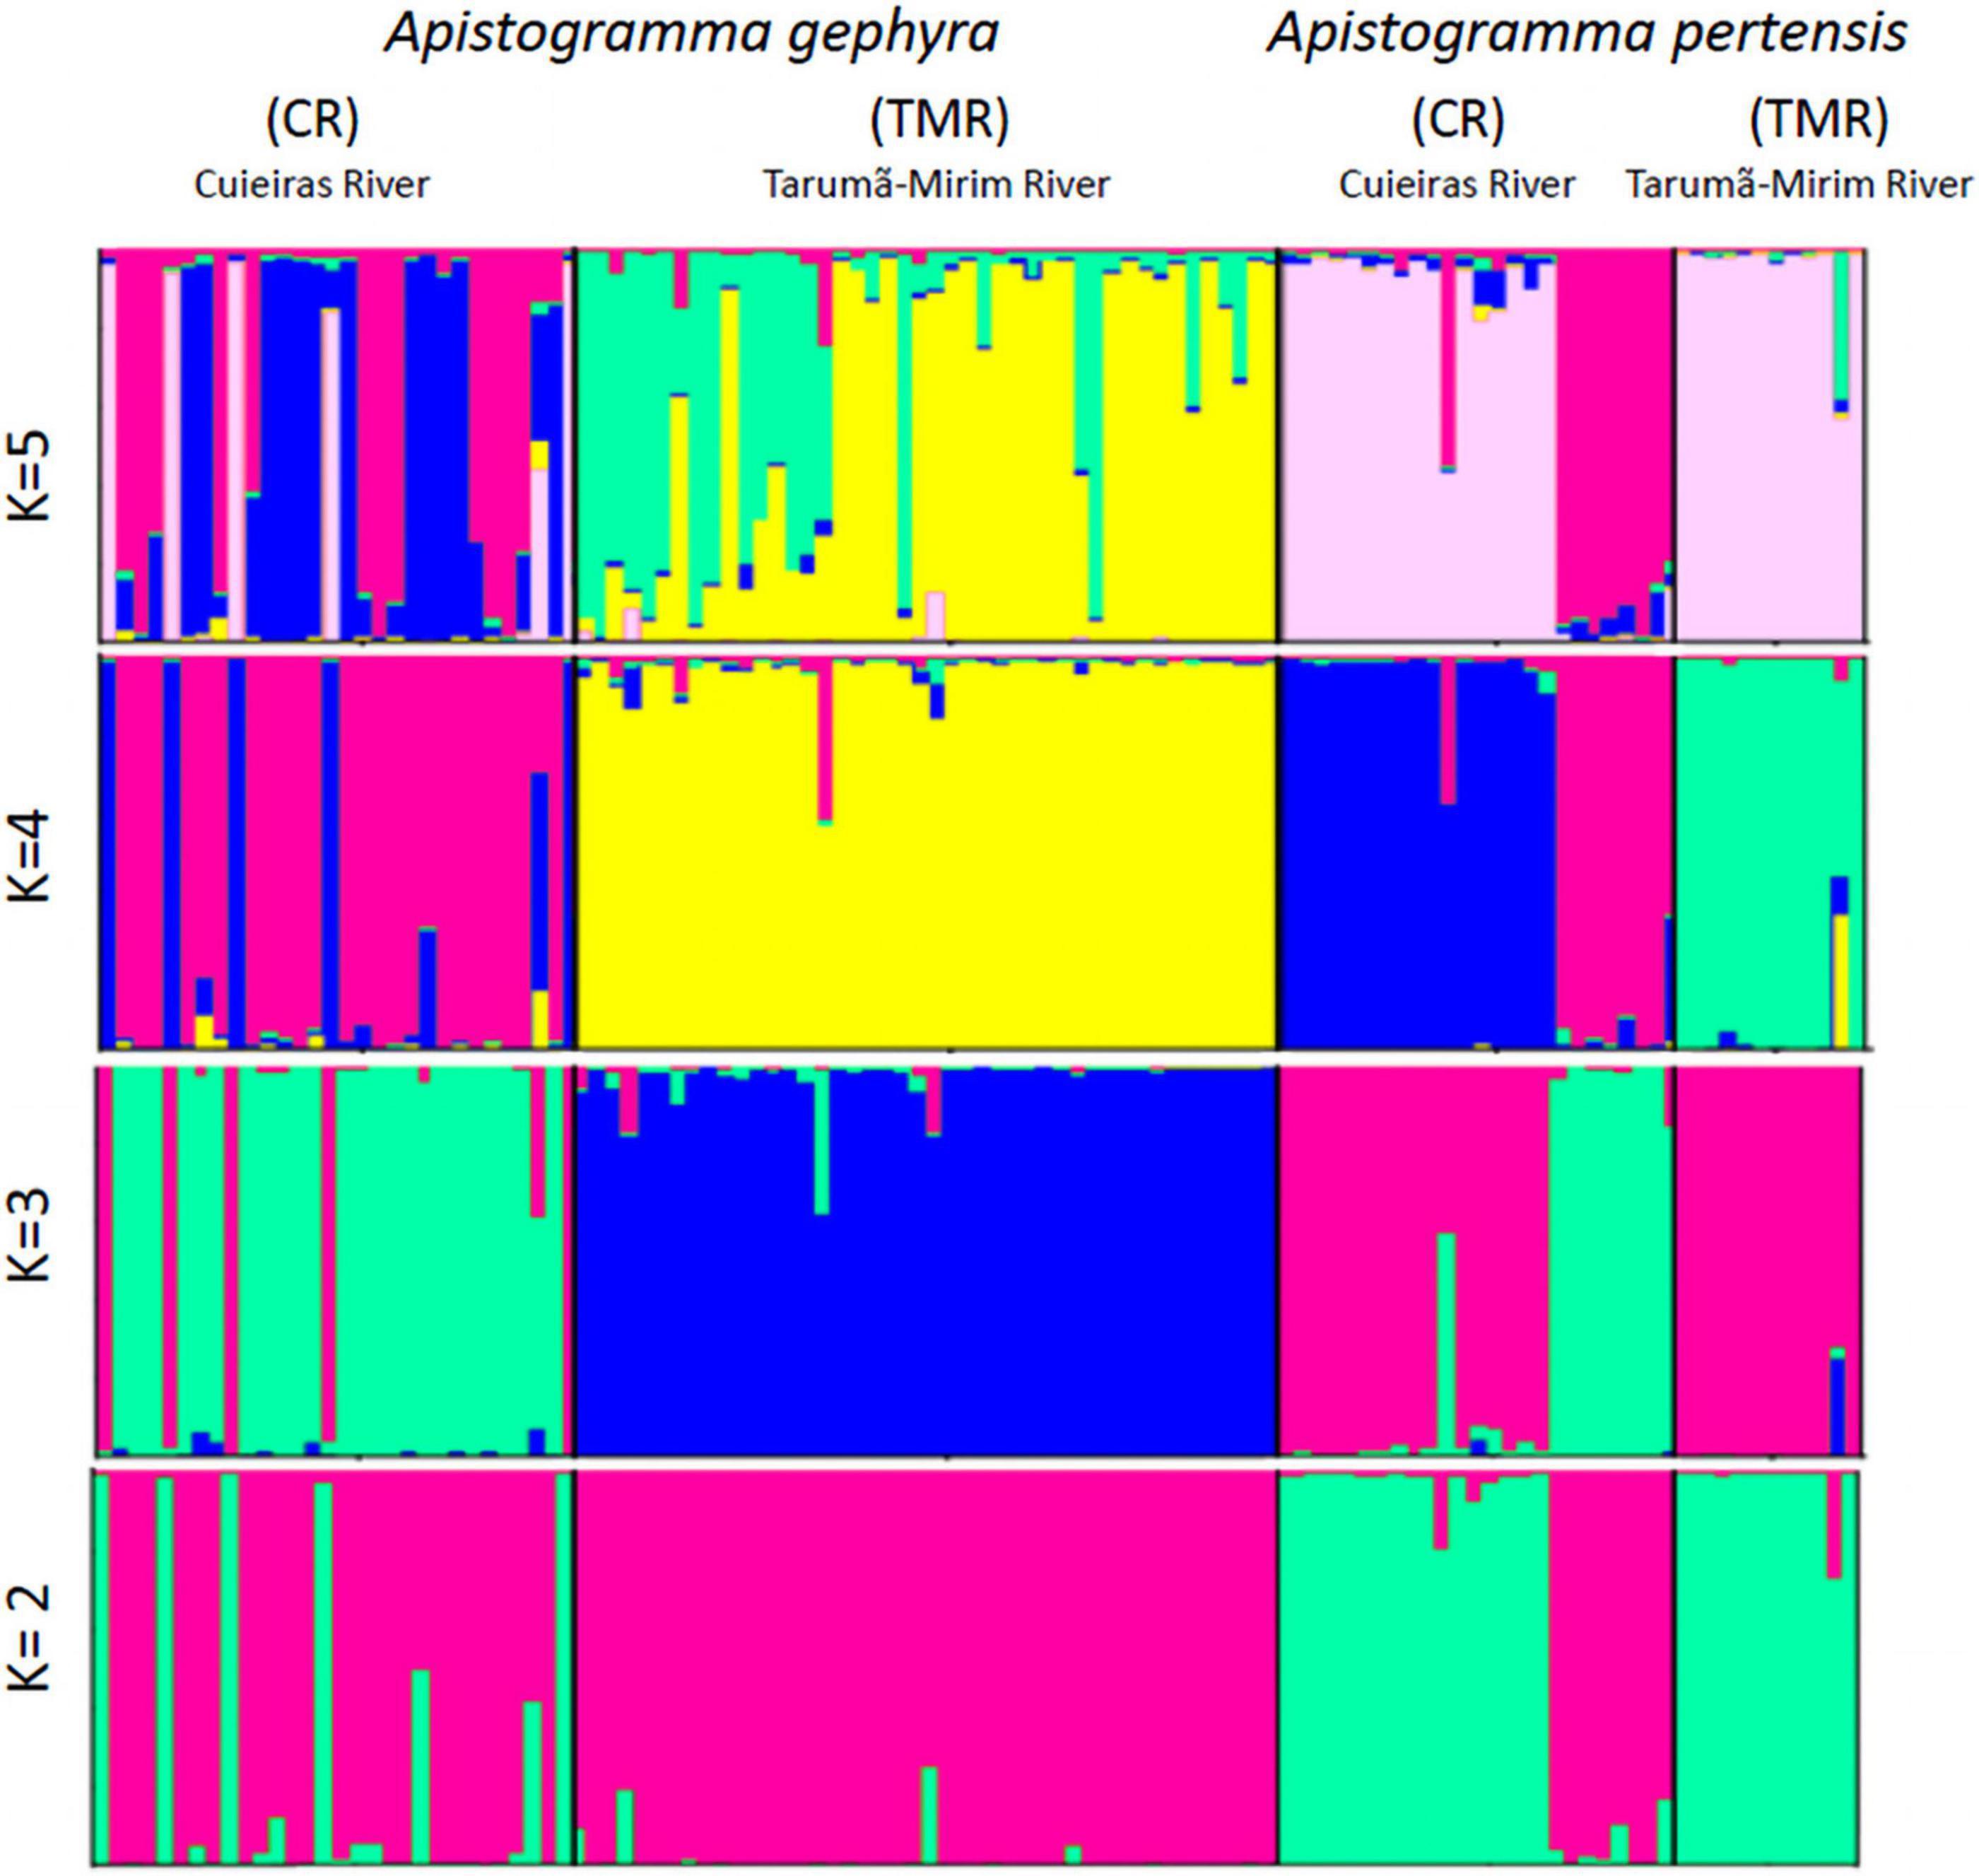
Figure 2. Structure analysis. Graphs obtained using STRUCTURE software. Analysis of all the populations for both species (a) based on 11 microsatellite loci shows K = 5.
The genetic distance (GD) between populations is compatible with the expected result for the genetic differentiation index (FST), and higher values are described between the populations of A. pertensis from the two rivers (0.228 GD and 0.285 FST) when compared to A. gephyra populations from the two rivers (0.120 GD and 0.128 FST), respectively (Table 2). The number of migrants (Nm) was 0.85 between A. pertensis from the Tarumã-Mirim River and Cuieiras River and, interestingly, 1.83 between the populations of A. gephyra from the two rivers.
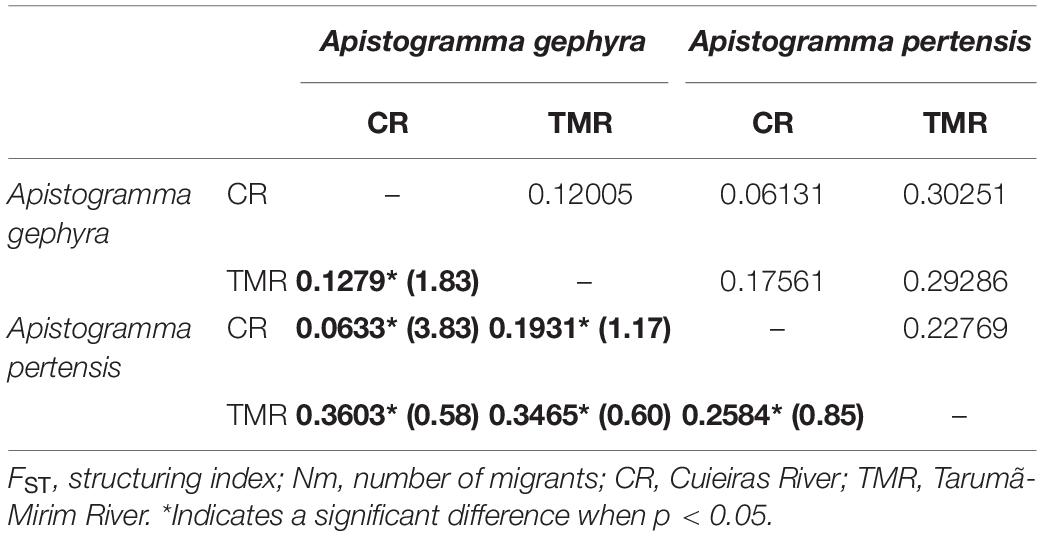
Table 2. Upper diagonal: genetic distance; bottom diagonal of the bold: FST and Nm (in parentheses), based on microsatellite data.
The AMOVA analysis (Table 3) indicates that there are significant differences among individuals of the same population and between different populations for both species. These results are consistent with the FST values (Table 2), which show structure among different populations, as corroborated by the significant genetic structure when all sampled individuals were analyzed using the STRUCTURE program (Figure 2).
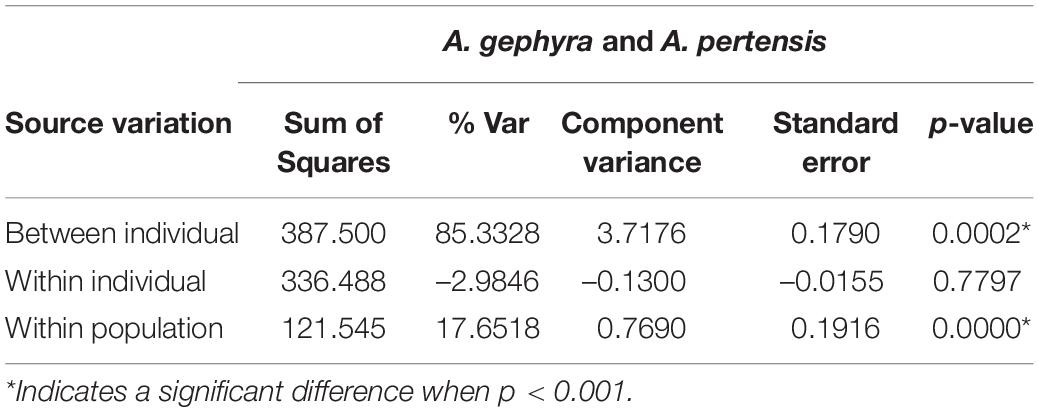
Table 3. Analysis of molecular variance (AMOVA) of Apistogramma gephyra and Apistogramma pertensis based on the 11 microsatellite loci.
Mitochondrial DNA Results
The number of sequences obtained for the three mitochondrial genes were unequal among populations: 69 sequences for 16S, 62 for COI, and 112 for Cyt-b (see Table 4). Despite this, the size of the amplicons and the quality of the DNA were acceptable for our main goal, which was to verify the structure of the two populations from the two species supposedly separated by the river capture. Due to this unequal sampling, we performed population analysis for each mitochondrial gene separately. The analysis of molecular variance (AMOVA, p < 0.001) for both species (A. gephyra and A. pertensis) indicates high variation within the species (Table 5), confirming that populations from both rivers are structured within each species for all genes.
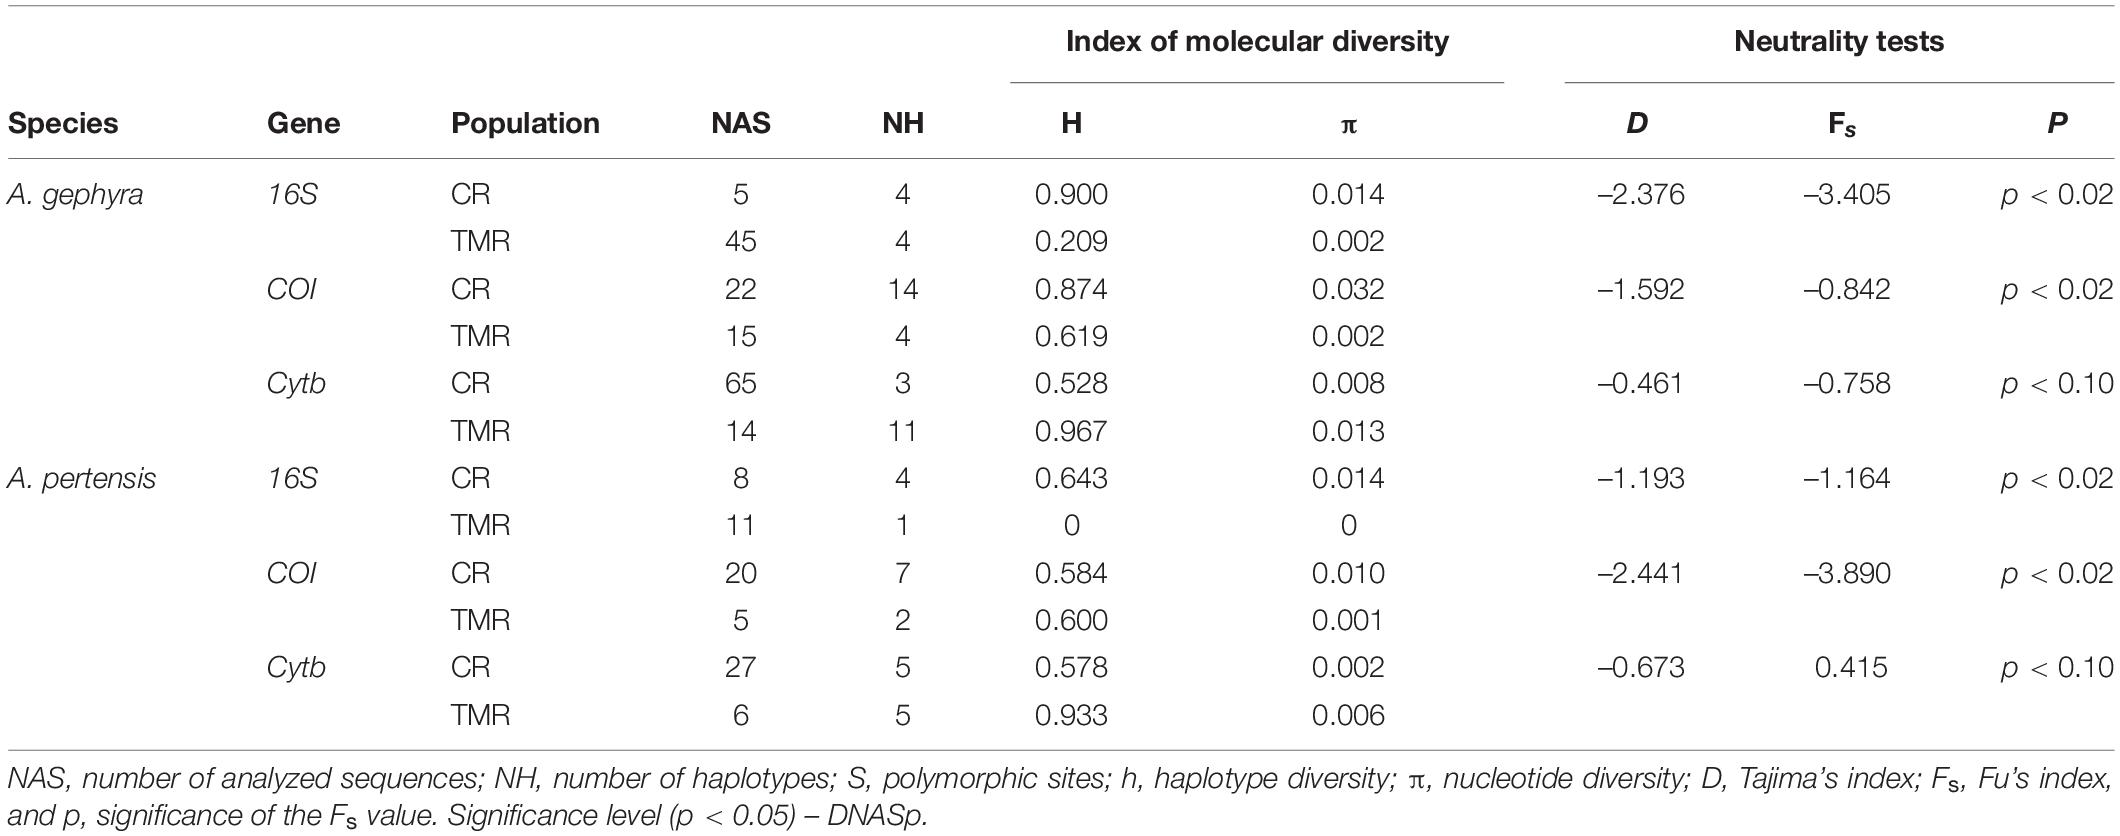
Table 4. DNA Polymorphism and neutrality tests for Apistogramma gephyra and Apistogramma pertensis populations from the Cuieiras River (CR) and Tarumã-Mirim River (TMR).
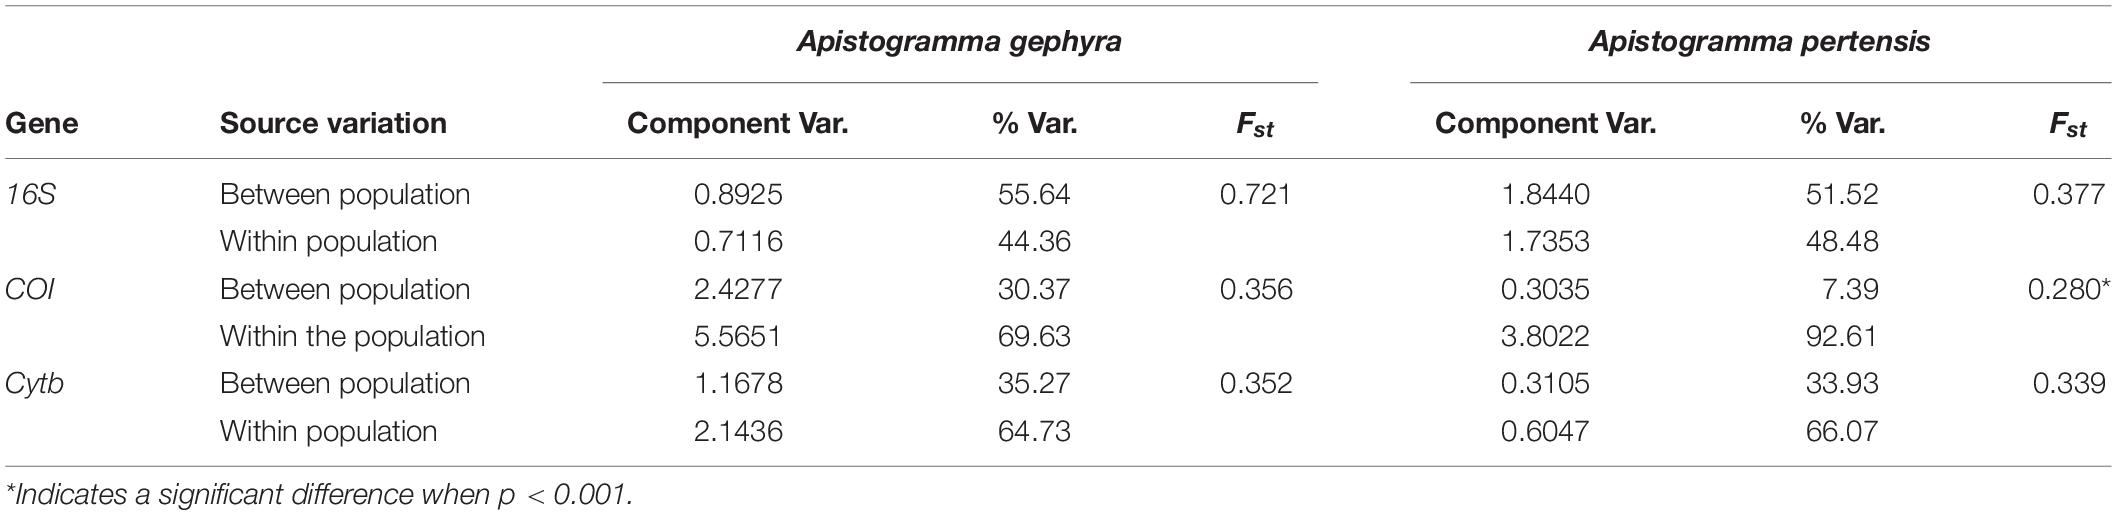
Table 5. Analysis of molecular variance (AMOVA) of Apistogramma gephyra and Apistogramma pertensis based on mtDNA genes.
Haplotype diversity (h) for Cyt b and COI genes was similar for A. gephyra and A. pertensis in the two rivers. For the 16S gene, lower values (0.209 and zero) were observed for the populations of A. gephyra and A. pertensis, respectively, in the Tarumã-Mirim River when compared to the Cuieiras River. The genes 16S and COI showed higher nucleotide diversity (π) in the Cuieiras River for both species when compared to the Tarumã-Mirim River. However, a low nucleotide diversity (π) was found in the Cyt-b gene in both A. gephyra and A. pertensis (Table 4).
The neutrality tests of Tajima (D) and Fu (Fs) showed negative values in the two populations of both rivers, and one positive value was observed in the Fu test for A. pertensis (Cyt-b gene). The neutrality tests were not significant for the Cyt-b gene in either species (Table 4). Therefore, the Tajima test indicates an excess of recent mutations in both populations of Apistogramma, while the Fu test did not suggest any recent population expansion in either of the A. pertensis populations based on the Cyt-b gene. The results obtained for the pairwise genetic differentiation index (FST) among the populations of dwarf cichlids showed significant statistical values (P < 0.001), with the only exception being detected for the COI gene in A. pertensis populations, which presented no difference in FST values (P > 0.05). The indexes for the genes 16S, COI, and Cyt-b were, respectively, 0.721, 0.356, and 0.352, for A. gephyra from the Cuieiras River and the Tarumã-Mirim River; and 0.377, 0.280 and 0.339 for A. pertensis from the Cuieiras and Tarumã-Mirim Rivers (Table 5). This analysis also indicates high levels of population genetic structure among them.
Analysis of population structure in BAPS based on 16S rRNA and COI genes clearly shows the separation of the two species between the Cuieiras and Tarumã-Mirim Rivers (Figures 3A,C). From the Cyt-b data, we observed a separation of all A. pertensis specimens, though we observed several clusters for A. gephyra (Figure 3E). When we analyzed the species separately, the results showed a clear differentiation between the rivers for both species. On the other hand, when we observed the Apistogramma populations for the Cuieiras River, we verified two or three clusters formed for the mitochondrial genes, and only one cluster in the Tarumã-Mirim River (A. gephrya—16S rRNA, COI, and Cyt-b; and A. pertensis—16S rRNA and COI, respectively) (Figures 3B,D,F). A similar result was observed for the microsatellite data after the analysis using the STRUCTURE program, by which we verified a higher gene flow between both species occurring in the Cuieiras River. In regards, the BAPS analysis corroborates the STRUCTURE analysis for microsatellite data (Figure 2).
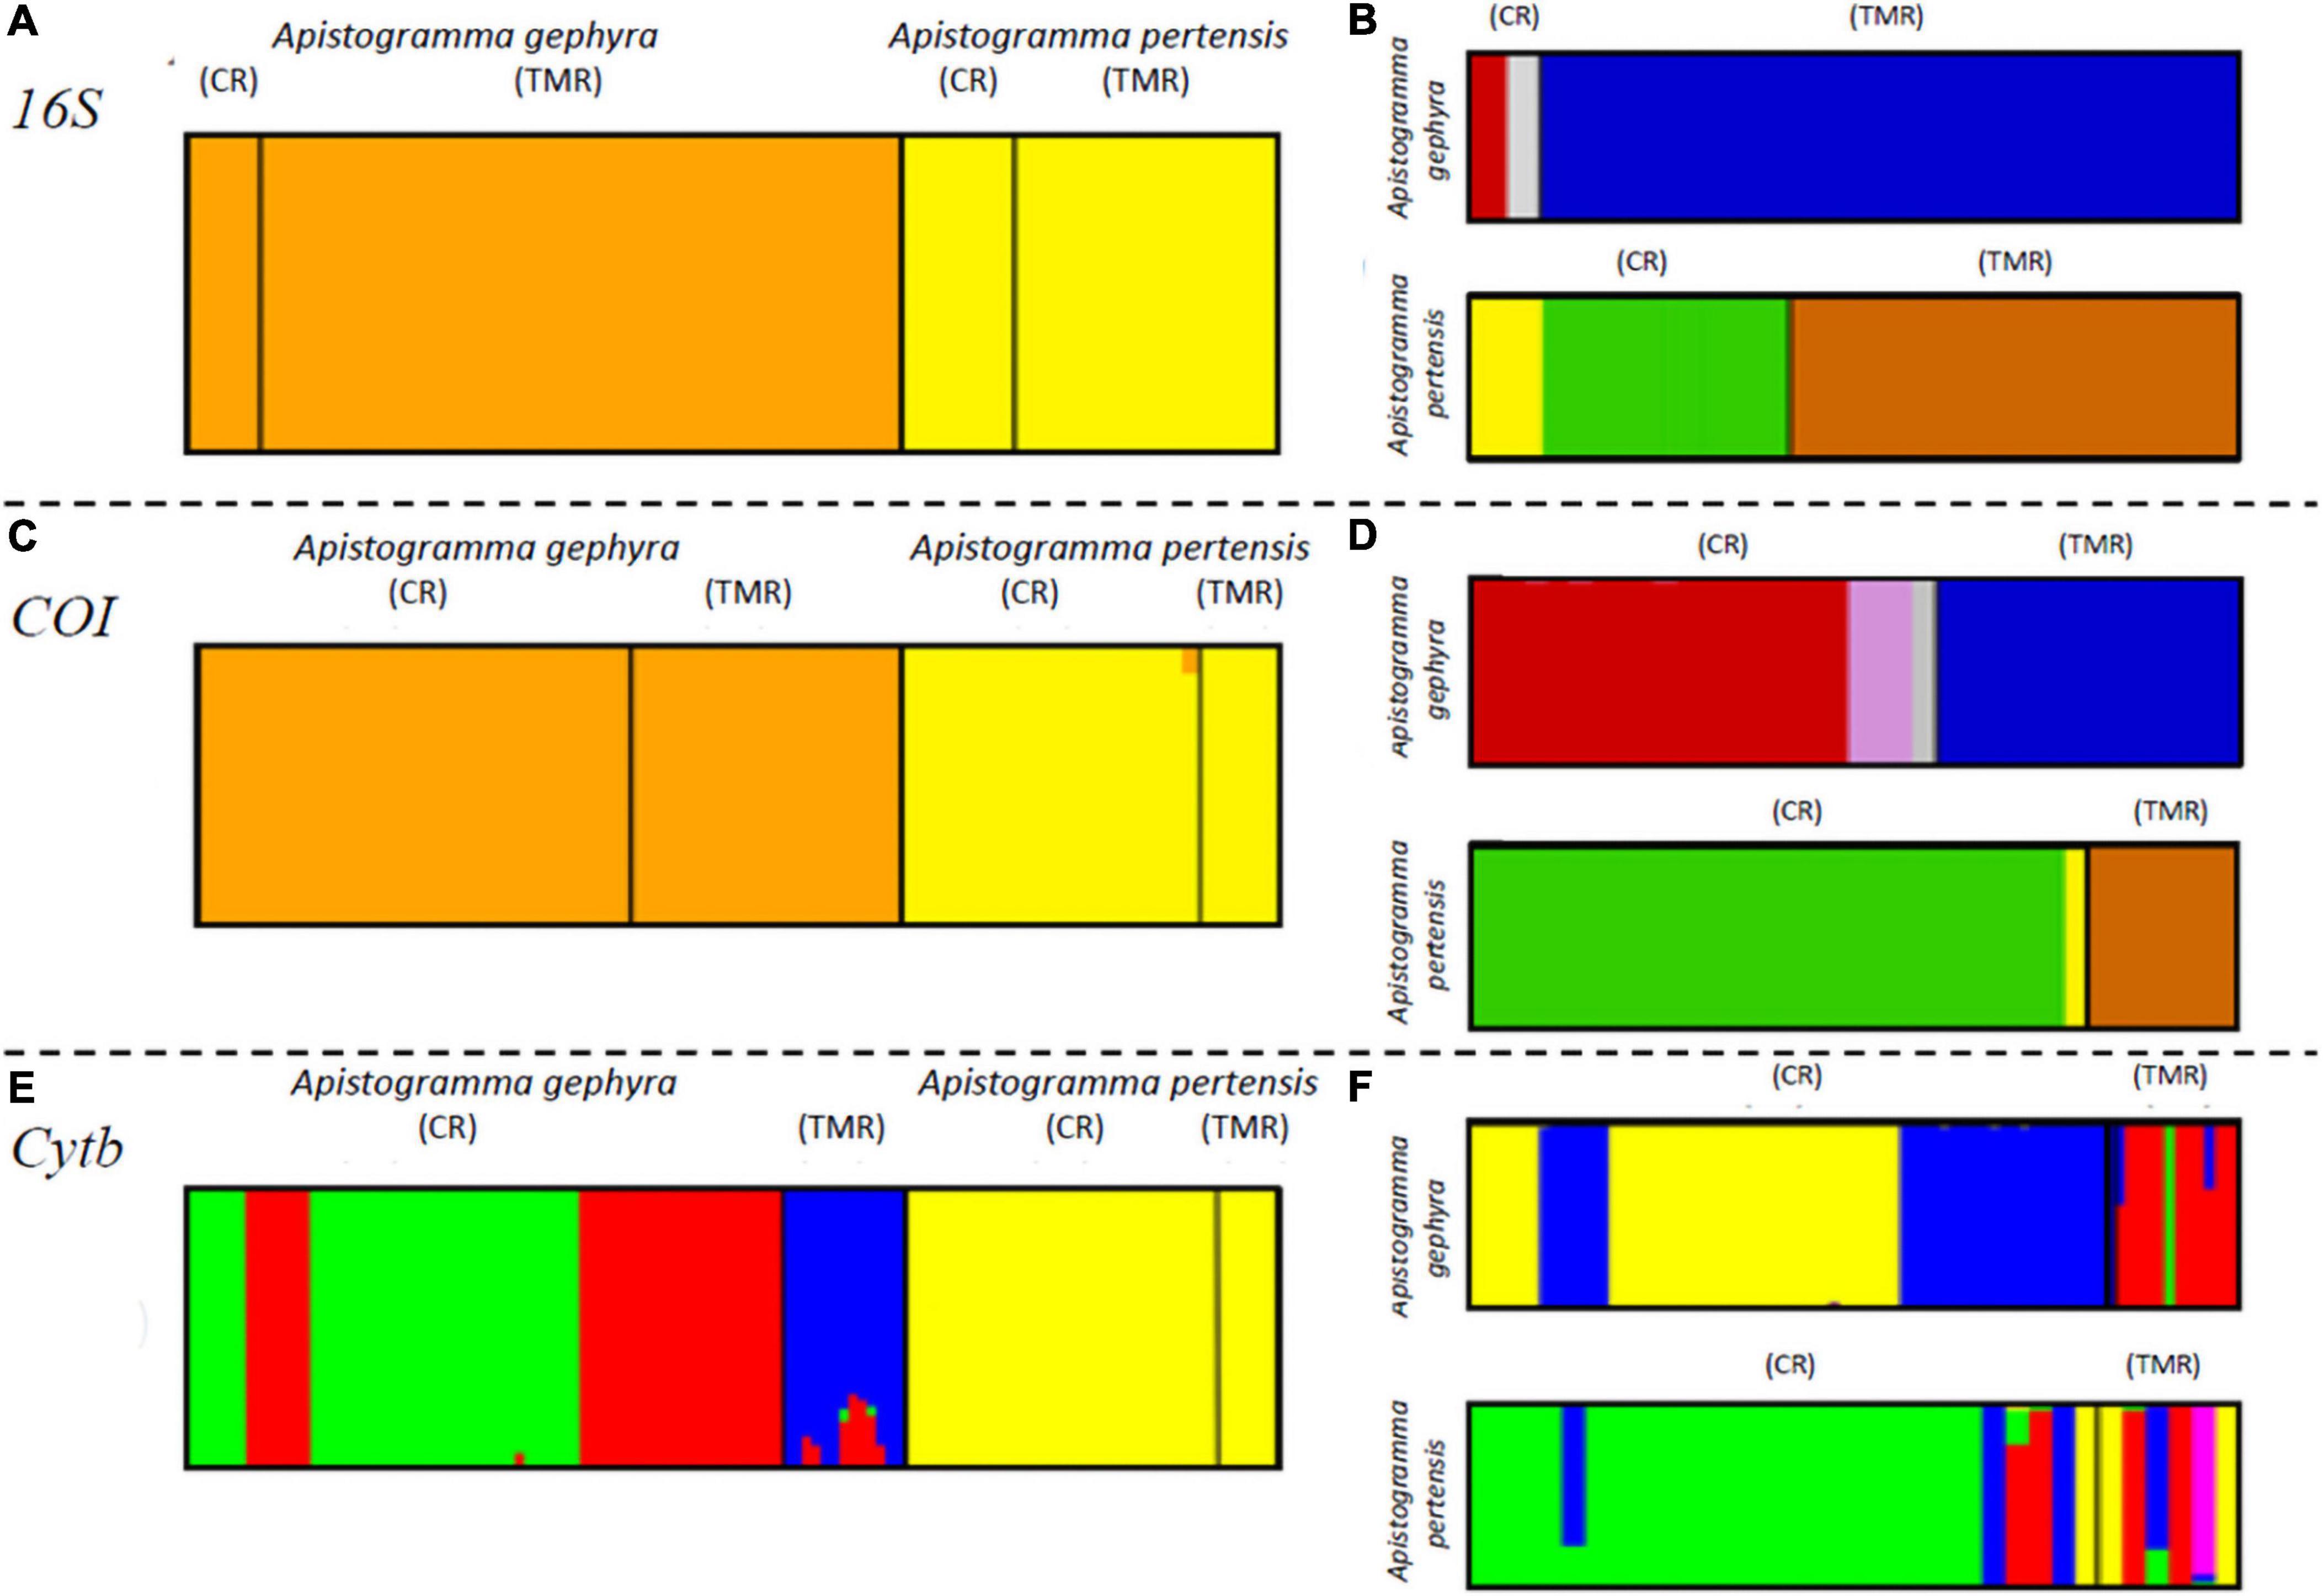
Figure 3. Bayesian analysis of population structure (BAPS). (A,C,E) Refer to Apistogramma gephyra and Apistogramma pertensis from the Cuieiras River (CR) and Tarumã-mirim River (TMR) Rivers presenting, respectively, 16S, COI and Cytb mitochondrial genes; (B,D,F) refer to both species analyzed separately between rivers using, respectively, the genes 16S, COI, and Cytb.
Discussion
Population Structure Is Affected by Landscape Changes
Geological events may have been important in the diversification of the genus Apistogramma (Römer, 2006), as well as the biology of this genus, and the habitat characteristics influence the genetic structure of their populations (see Figures 4A–C). Thus, understanding genetic structure is critical in evolutionary and conservation biology, and discriminating fish sub-populations is essential for detecting possible reproductive isolation (Santos et al., 2016).
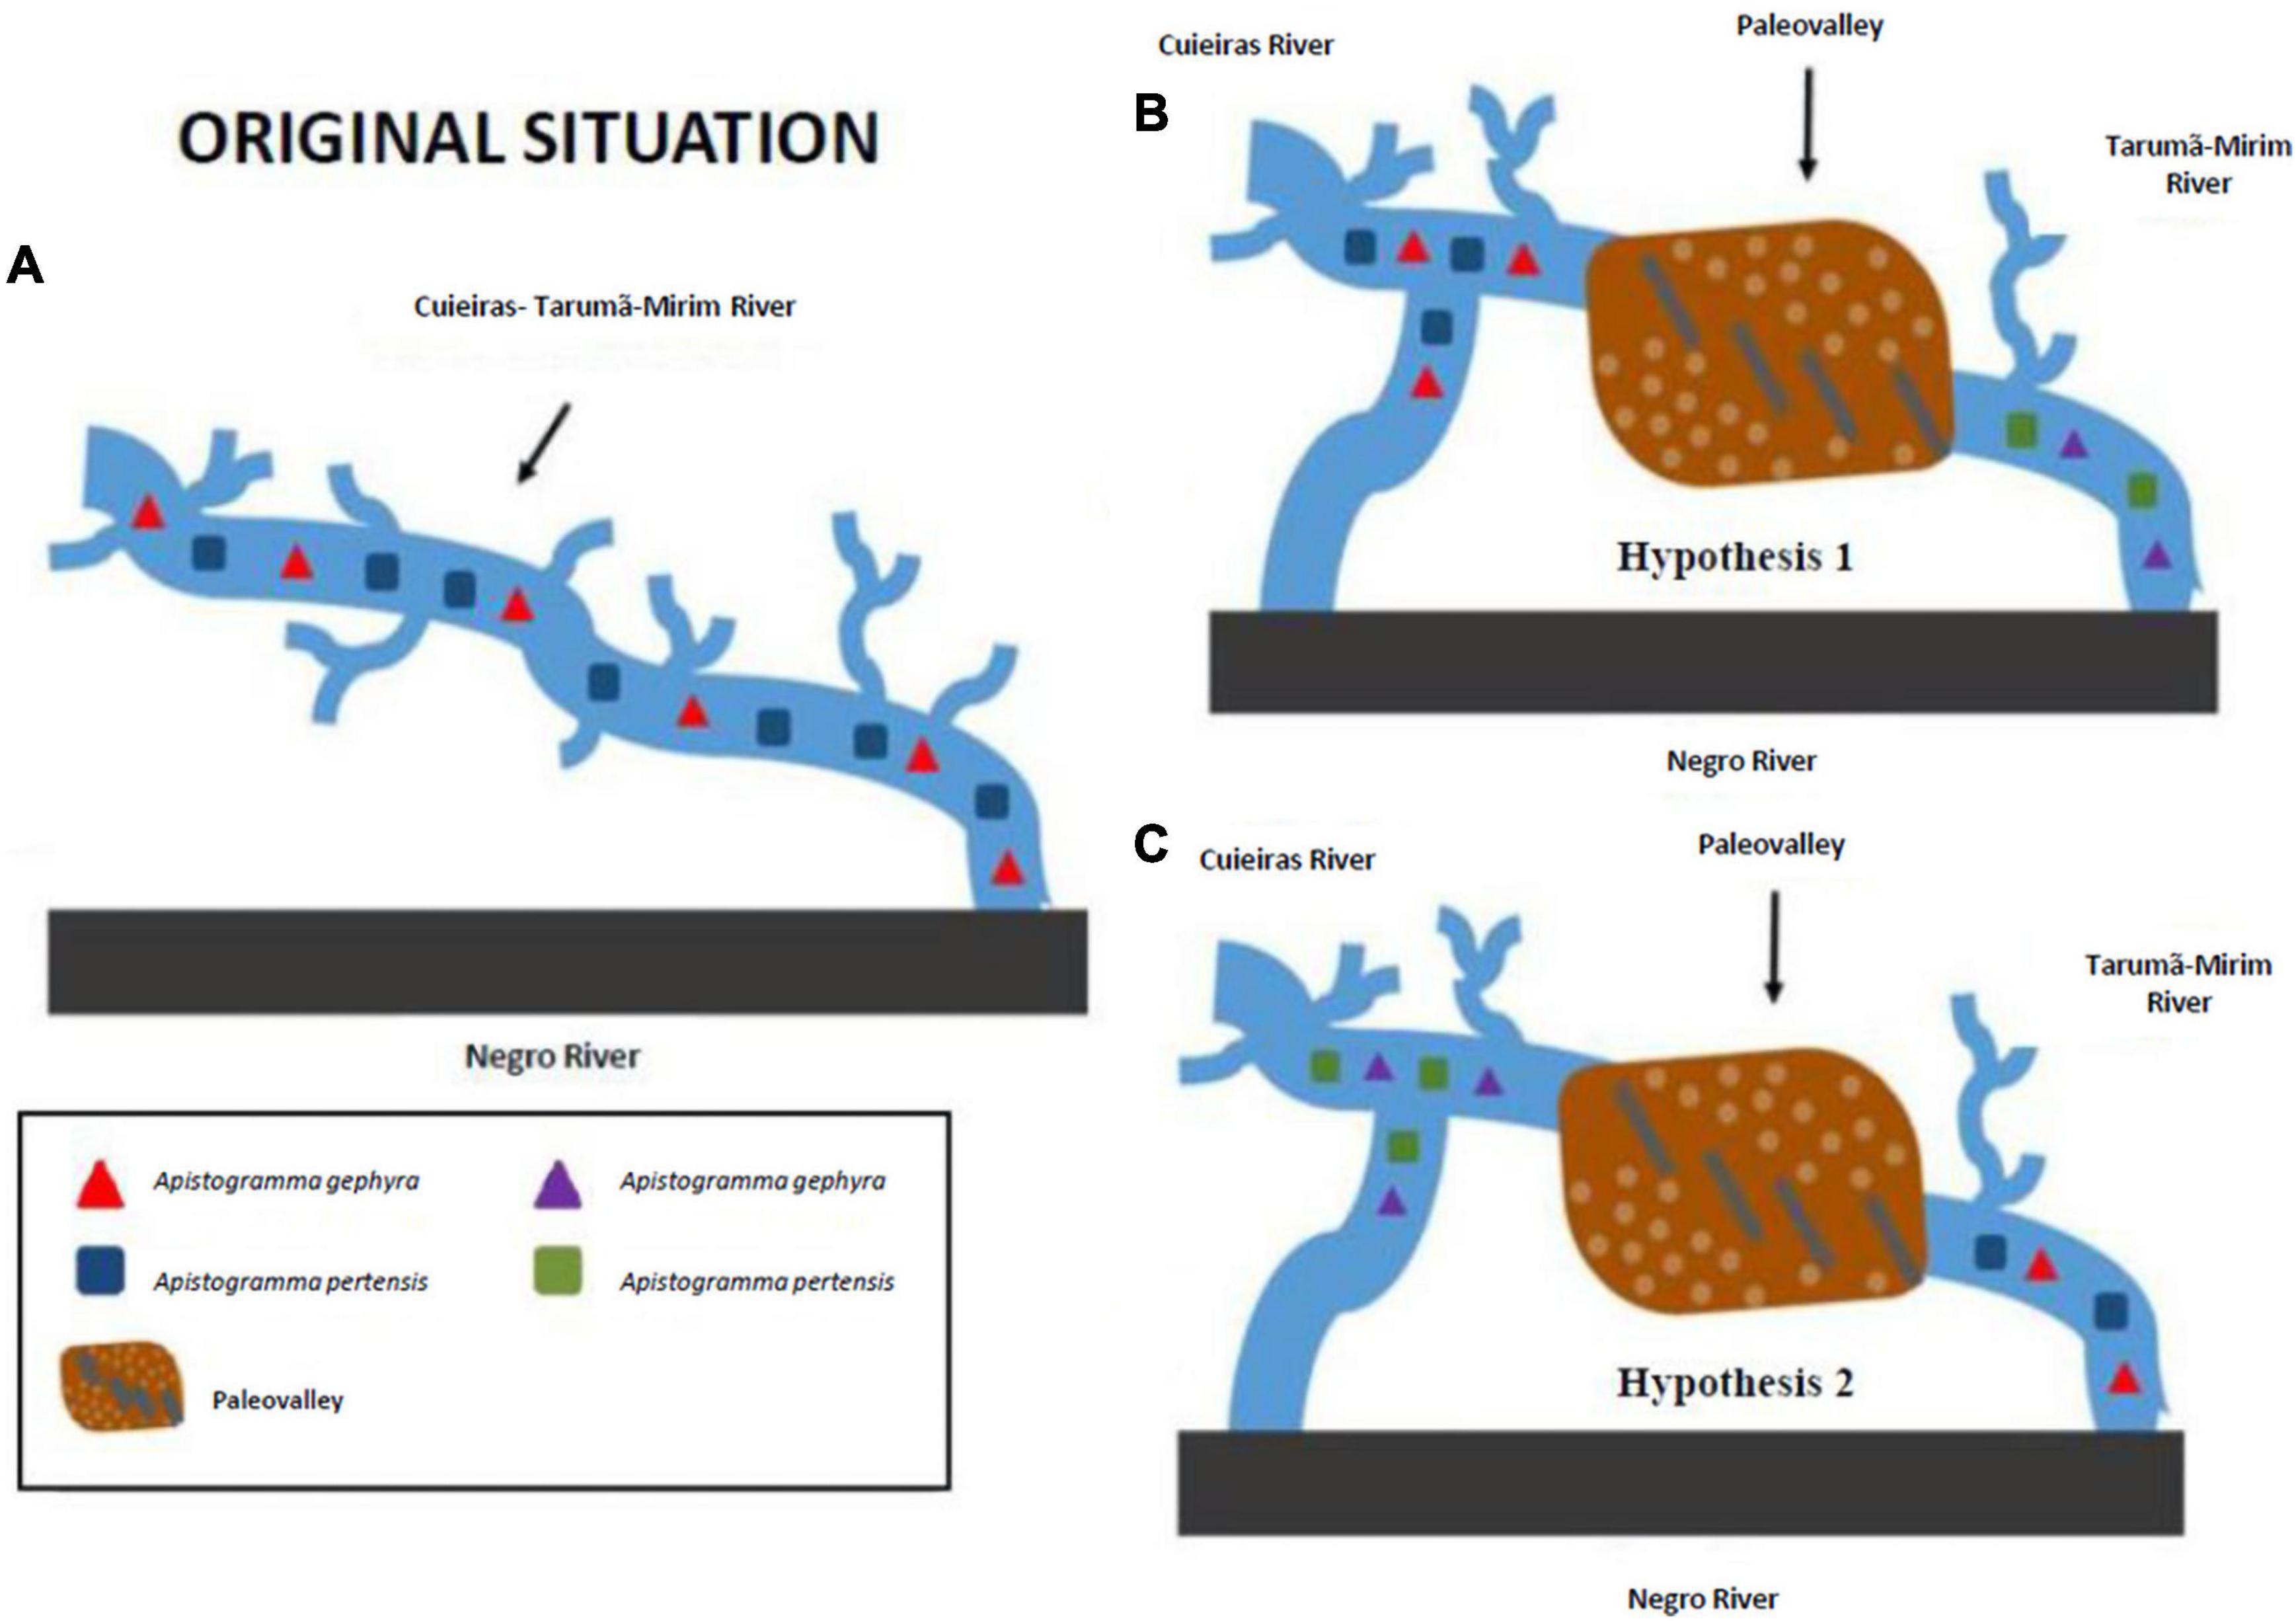
Figure 4. Hypothetical scenarios. The hypothetical scenarios are delineated to propose an explanation for the strong genetic structure observed between the populations of Apistogramma gephyra and Apistogramma pertensis in the two rivers (Cuieiras and Tarumã-Mirim): (A) A. gephyra and A. pertensis populations from the Tarumã-Mirim River differentiated after the geographic isolation, with the lower Tarumã-Mirim River region being influenced by populations from the lower Negro River; and/or (B,C) the landscape changes in the course of the Cuieiras River and provided a wide area of distribution and allowed some gene flow between the species, thus adding more complexity to the differentiation between populations, with potential influences from individuals of the Anavilhanas populations just west of the mouth of the Cuieiras River.
The results from the microsatellite data indicate low levels of gene flow between populations of the same species from the different rivers (Table 2). These results suggest diversification among populations within each species and the possibility that a local adaptive process is occurring. On the other hand, we cannot discard the possibility that genetic drift caused allele fixation. In fact, the occurrence of local adaptation and random allele fixation by genetic drift leads to a reduced number of genotypes (Blanquart et al., 2012). Moreover, local adaptation is also sensitive in small populations and to the balance between gene flow and local selection.
When gene flow is limited, specialized genotypes can be maintained in isolated populations and support local adaptation, thus providing important insight into evolutionary processes and adaptive divergence of populations (Blanquart et al., 2012, 2013). A key prerequisite for the emergence of local adaptation is the existence of a spatially heterogeneous environment, which generates a heterogeneous selective pressure (Blanquart et al., 2013). The region where the Cuieiras and Tarumã-Mirim Rivers are located is constantly changing, which involve this type of study. In addition, the drainage network of the Amazon is not static but is, in fact, constantly changing over time (Albert et al., 2018). All those factors induce allele fixation in these populations, genetic drift and local adaptation to habitat heterogeneity, thus making this a perfect ecosystem for evolutionary studies.
Interestingly, the nuclear data indicates genetic similarity between the two species of the Cuieiras River. However, this pattern is not seen in the mtDNA data and the two species form a well-supported high differentiation. We considered that these findings indicate that gene flow occurs in the Cuieiras River, which affects only the nuclear genome, though not the maternally inherited mtDNA. To have greater certainty regarding these processes, further studies must explore a higher and more variable number of markers (e.g., SNPs) and use more rapidly evolving mitochondrial genes (e.g., mtDNA control region).
Thus, the lack of support for intraspecific clades in mtDNA may be due to the slow evolutionary rate of the markers utilized in this study, while the nuclear microsatellites clearly show an intraspecific differentiation in the different drainage systems. Another explanation would be periodic connectivity or delayed disconnection between the Tarumã-Mirim and Cuieiras Rivers, as observed in ongoing drainage captures elsewhere in the Amazon (Stokes et al., 2018). This would allow eventual gene flow among sub-populations (or evolutionary significant units—ESU). Although the sample size was unequal for the populations of Tarumã-Mirim and Cuieiras Rivers, the level of polymorphism for both the microsatellites (Leitão et al., 2017) and the number of mitochondrial genes was substantial enough to reach these conclusions.
Tajima’s D test results in negative values after a recent bottleneck, which indicates population expansion (Fu. 1997). The statistical values for Fs are also very sensitive to deviations from neutrality that are promoted by demographic changes. Herein, they resulted in negative values under most conditions and were positive only for A. pertensis (Cyt b).
The distribution of Apistogramma species is higher in Cuieiras River than the drainage basin of the Tarumã-Mirim River (Figure 1). This is consistent with an increase in species range as the Cuieiras River has gained drainage area due to river capture. Thus, a larger gene flow has been detected between species of dwarf cichlids from the Cuieiras River, possibly due to mating occurring at higher levels, though with production of infertile offspring. We suggest that the mating observed between the two dwarf cichlids species in the Cuieiras River occur because these two species have not differed enough to prevent reproductive mating after the river capture event, which means they might still maintain a correlation with the original populations (Hypothesis 1, Figure 4B). In addition, both species from Tarumã-Mirim River have been genetically disconnected because they inhabit a fragmented and smaller area, and this may have caused higher environmental pressure on these populations. In addition, we must emphasize that these genetic studies are contemporary, and that the current landscapes may have a strong influence on our results. Thus, river captures may be considered a mechanism that promotes fish biodiversity, particularly in non-migratory fish species, and contributes to the genetic diversity at the population level, as in the present case (Albert et al., 2017).
An alternative explanation for the gene flow in the Cuieiras River is presented in Hypothesis 2 (Figure 4C): for the same reason as above, i.e., the populations in the Tarumã-Mirim River after river capture are the original populations prior to river capture (Figure 4C). Thus, our preferred explanation, prior to capture, is that these two species remained there, though with no gene flow.
The current pressure that affects the Tarumã-Mirim River is due to the urban expansion of Manaus, which probably affect these populations. The conservation approach over these populations must be taken to avoid disappearance in the future. In addition, the population of the Cuieiras River has evolved in a larger population with more landscape changes over time, which means that the river capture induced all the changes in this river and left the Tarumã-Mirim River behind. The latter remained a short (Figure 1) river and is the final part of the original river.
Based on the results, we are able to affirm that, based on the structured populations of both species in both rivers, these two species have given rise to four populations, and that these four populations will most probably generate new species through interruption of gene flow.
The current literature is of the consensus that a mosaic of events must have occurred at different times and spatial scales and that this created a complex scenario of spatial and temporal landscape changes that have influenced the biodiversity in the Amazon we see today (Hoorn et al., 2010, 2017; Rull, 2011, 2013; Gorini et al., 2014; van Soelen et al., 2017). Our study suggests that the populations of Apistogramma were affected by landscape changes that contributed to speciation and, eventually, species enrichment. Thus, even at smaller spatial scales, local landscape changes are important in creating biodiversity.
Conservation Implications
The cichlids are extremely interesting fish not only for adaptive radiation studies, but also for studies of behavior and reproductive characteristics (Turner, 2007). About 112 dwarf cichlids species are described as being part of the Apistogramma genus, and wide distribution throughout South America (Costa et al., 2019), particularly in the Amazon basin. This extraordinary diversity and high endemism rate found for dwarf cichlids has been explained by the geological, paleoclimatic, and water-level history that has played an important role in speciation events by isolating populations and favoring the establishment of reproductive barriers (Römer, 2006). Thus, new conservation strategies for these species and ecosystems should be rethought; mainly in relation to the vulnerability of the population structure of Apistogramma species that live in small basins and tributaries of large rivers to extreme anthropic changes.
Thus, for conservation measures to be effective, they must be based on the information between environment and organism, in order to avoid local extinction of threatened species. The integration of some types of analyses, such as species distribution, phenotypic variation, landscape change, and population genetics, can contribute to management and conservation strategies (Santos et al., 2011, 2016; Escobar et al., 2015; Gravena et al., 2015). In addition, knowledge of the biology of the species is vital for defining a conservation strategy, particularly in areas under environmental pressure. Most species of the genus Apistogramma are restricted to a single river or adjacent floodplains and nearly never found in the main river channel (Kullander, 2003; Römer, 2006).
Genetic population studies have constantly revolutionized our theories regarding evolutionary processes (De la Ossa-Guerra et al., 2020), and genetic variability in this case is considered an important factor for understanding these evolutionary processes and for planning conservation programs (International Union for Conservation of Nature [IUCN], 2020). Thus, understanding population structure is crucial for management actions for evolutionary significant units (ESU); however, developing conservation strategies for establishing priority units has historically been difficult. The low migration rate and the high population structure imply that A. gephyra and A. pertensis populations from Cuieiras and Tarumã-Mirim Rivers should be managed separately at the moment, each as an independent ESU (Avise, 2000; Baker et al., 2002) and, therefore, taxonomic units have to be conserved considering these aspects (De la Ossa-Guerra et al., 2020). This operational concept is often used to guide short-term management strategies, as it refers to current population structures and allele frequencies (Moritz, 1994).
The two dwarf cichlid species analyzed in this study (A. gephyra and A. pertensis) belong to two drainage networks that were separated by a river capture event. Based on our results, the paleovalley that now separates the Cuieiras and Tarumã-Mirim River basins is seen to have contributed to the local interruption of gene flow, and led to the development of structured populations of both species. According to De la Ossa-Guerra et al. (2020), in order to preserve evolutionary processes, species management must preserve natural networks of genetic connections among populations, rather than just the isolated populations within that network. On the other hand, our results support that geological changes induce new river courses that may cause genetic diversification in aquatic fauna, thus increasing its biodiversity. Moreover, given that events resulting in landscape changes, such as the one studied here, have been common throughout the Amazon basin during and after the Miocene (Rossetti et al., 2005, 2016; Almeida-Filho and Miranda, 2007; Hayakawa et al., 2010; Hoorn et al., 2010; Hayakawa and Rossetti, 2015), we may theorize that small geological processes are capable of producing vicariant events and should be considered within the complex framework of biodiversity drivers in the Amazon Basin. Further studies will clarify the ongoing population structure of A. gephyra in the Cuieiras River to better explain the influence of other surrounding geological events, such as the formation of the Anavilhanas Archipelago and the influence of the main channel (Negro River), on the emergence of new genetic information in this species.
Data Availability Statement
The datasets presented in this study can be found in online repositories. The names of the repository/repositories and accession number(s) can be found below: NCBI (accession: OK625450–OK625526 and OL310106–OL310174).
Ethics Statement
The animal study was reviewed and approved by Committee on the Ethics of Animal Use and Care—CEUA of the Brazilian National Institute for Amazonian Research—INPA (approval number 048/2012).
Author Contributions
CL, PV, AV, and VA-V conceived the study. CL, CS, and ÉS conducted analyses, collected samples, obtained permits, and conducted laboratory procedures. CL and ÉS wrote the manuscript with input from all authors. VA-V supervised all study steps. All authors read and approved the present version.
Funding
This work was part of INCT ADAPTA (CNPQ, 573976/2008-2 and FAPEAM, 3159/08) coordinated by AV, and project UNIVERSAL/FAPEAM (#021/2011), coordinated by VA-V. This study was funded by Coordenação de Aperfeiçoamento de Pessoal de Nível Superior (CAPES), Fundação de Amparo à Pesquisa do Estado do Amazonas (FAPEAM), and Conselho Nacional de Desenvolvimento Científico e Tecnológico (CNPq). CL was the recipient of a Ph.D. fellowship from CNPq and also thanks the Centro Universitário de Ensino Superior do Amazonas (CIESA) for support during the study. CS was the recipient of a research fellowship from PCI-INPA/CNPq. PV was the recipient of a Doctoral Fellowship from CAPES/Science without Borders (Project #0515-12-4). ÉS was the recipient of a Technical Development Level (DTI) fellowship from FAPEAM. AV and VA-V were the recipients of research fellowships from CNPQ.
Conflict of Interest
The authors declare that the research was conducted in the absence of any commercial or financial relationships that could be construed as a potential conflict of interest.
Publisher’s Note
All claims expressed in this article are solely those of the authors and do not necessarily represent those of their affiliated organizations, or those of the publisher, the editors and the reviewers. Any product that may be evaluated in this article, or claim that may be made by its manufacturer, is not guaranteed or endorsed by the publisher.
Acknowledgments
We would like to thank Maria de Nazaré Paula da Silva from INPA-LEEM for her valuable help with logistics. We also thank Jansen Sampaio Zuanon, Efrem Ferreira, from INPA (Brazilian National Institute for Research of the Amazon), Ricardo Britzke from Univerdad Técnica de Machala and Rodrigo Nahum from Pontifícia Universidade Paulista Campus Sorocaba (PUC-Sorocaba) for their advices in taxonomy of the genus and ecological information.
Supplementary Material
The Supplementary Material for this article can be found online at: https://www.frontiersin.org/articles/10.3389/fevo.2021.760287/full#supplementary-material
References
Albert, J. S., Schoolmaster-Junior, D. R., Tagliacollo, V., and Duke-Sylvester, S. M. (2017). Barrier displacement on a neutral landscape: towards a theory of continental biogeography. Syst. Biol. 66, 167–182. doi: 10.1093/sysbio/syw080
Albert, J. S., Val, P., and Hoorn, C. (2018). The changing course of the Amazon River in the Neogene: center stage for Neotropical diversification. Neotrop. Ichthyol. 16:e180033. doi: 10.1590/1982-0224-20180033
Alfaro, J. W. L., Boubli, J. P., Paim, F. P., Ribas, C. C., Silva, M. N. F., Messias, M. R., et al. (2015). Biogeography of squirrel monkeys (genus Saimiri): South-central Amazon origin and rapid pan-Amazonian diversification of a lowland primate. Mol. Phylogenet. Evol. 82, 436–454. doi: 10.1016/j.ympev.2014.09.004
Almeida-Filho, R., and Miranda, F. P. (2007). Mega capture of the Rio Negro and formation of the Anavilhanas Archipelago, Central Amazônia, Brazil: evidences in SRTM digital elevation model. Remote Sens. Environ. 110, 387–392. doi: 10.1016/j.rse.2007.03.005
Avise, J. C. (2000). Phylogeography: The History and Formation of Species. Cambridge: Harvard University Press.
Baker, A. N., Smith, A. N. H., and Pichler, F. B. (2002). Geographical variation in Hector’s dolphin: recognition of new subspecies of Cephalorhynchushectori. J. R. Soc. New Zeal. 32, 713–727. doi: 10.1080/03014223.2002.9517717
Belkhir, K., Borsa, P., Chikhi, L., Raufaste, N., and Bonhomme, F. (2009). GENETIX Version 4.05.2, logiciel sous Windows TM pour la génétique des populations, LaboratoireGénome, Populations, Interactions CNRS UMR 5000. France: Université de Montpellier II.
Blanquart, F., Gandon, S., and Nuismer, S. (2012). The effects of migration and drift on local adaptation to a heterogeneous environment. J. Evol. Biol. 25, 1351–1363. doi: 10.1111/j.1420-9101.2012.02524.x
Blanquart, F., Kaltz, O., Nuismer, S. L., and Gandon, S. (2013). A practical guide to measuring local adaptation. Ecol. Lett. 16, 1195–1205. doi: 10.1111/ele.12150
Boubli, J. P., Ribas, C. C., Alfaro, J. W. L., Alfaro, M. E., Silva, M. N. F., Pinho, G. M., et al. (2015). Spatial and temporal patterns of diversification on the Amazon: a test of the Riverine hypothesis for all diurnal primates of Rio Negro and Rio Branco in Brazil. Mol. Phylogenet. Evol. 82, 400–412. doi: 10.1016/j.ympev.2014.09.005
Corander, J., Gyllenberg, M., and Koski, T. (2007). Random partition models and exchangeability for Bayesian identification of population structure. Bull. Math. Biol. 69, 797–815. doi: 10.1007/s11538-006-9161-1
Costa, G. W. W. F., Cioffi, M. B., Liehr, T., Feldberg, E., Bertollo, L. A. C., and Molina, W. F. (2019). Extensive chromosomal reorganization in Apistogramma fishes (Cichlidae, Cichlinae) fits the complex evolutionary diversification of the genus. Int. J. Mol. Sci. 20:4077. doi: 10.3390/ijms20174077
De la Ossa-Guerra, L. E., Santos, M. H., and Artoni, R. F. (2020). Genetic diversity of the cichlid Andinoacara latifrons (Steindachner, 1878) as a conservation strategy in different Colombian Basins. Front. Genet. 11:815. doi: 10.3389/fgene.2020.00815
Earl, D. A., and von Holdt, B. M. (2012). STRUCTURE HARVESTER: a website and program for visualizing STRUCTURE output and implementing the Evanno method. Conserv. Genet Res. 4, 359–361. doi: 10.1007/s12686-011-9548-7
Escobar, M. D. L., Andrade-López, J., Farias, I. P., and Hrbek, T. (2015). Delimiting evolutionarily significant units of the fish, Piaractusbranchypomus (Characiformes: serrasalmidae), from the Orinoco and Amazon River basins with insight on routes of historical connectivity. J. Hered. 106, 428–438. doi: 10.1093/jhered/esv047
Estivals, G., Duponchelle, F., Römer, U., García-Dávila, C., Airola, E., Deléglise, M., et al. (2020). The Amazonian dwarf cichlid Apistogramma agassizii (Steindachner, 1875) is a geographic mosaic of potentially tens of species: conservation implications. Aquat. Conserv. 30, 1521–1539. doi: 10.1002/aqc.3373
Evanno, G., Regnaut, S., and Goudet, J. (2005). Detecting the number of clusters of individuals using the software structure: a simulation study. Mol. Ecol. 14, 2611–2620. doi: 10.1111/j.1365-294X.2005.02553.x
Excoffier, L., and Lischer, H. (2010). Arlequin suite ver 3.5: a new series of programs to perform population genetics analyses under Linux and Windows. Mol. Ecol. Res. 10, 564–567. doi: 10.1111/j.1755-0998.2010.02847.x
Falush, D., Stephens, M., and Pritchard, J. K. (2003). Inference of population structure using multilocus genotype data: linked loci and correlated allele frequencies. Genetics 164, 1567–1587. doi: 10.1093/genetics/164.4.1567
Farias, I. P., Ortí, G., Sampaio, I., Schneider, H., and Meyer, A. (2001). The cytochrome b gene as a phylogenetic marker: the limits of resolution for analyzing relationships among cichlid fishes. J. Mol. Evol. 53, 89–103. doi: 10.1007/s002390010197
Fernandes, A., Cohn-Haft, M., Hrbek, T., and Farias, I. P. (2015). Rivers acting as barriers for bird dispersal in the Amazon. Rev. Bras. Ornitol. 22, 363–373. doi: 10.1111/mec.14142
Fu, Y. X. (1997). Statistical tests of neutrality of mutations against population growth, hitchhiking and background selection. Genetics 147, 915–925. doi: 10.1093/genetics/147.2.915
Gorini, C., Haq, B. U., Reis, A. T., Silva, C. G., Cruz, A., Soares, E., et al. (2014). Late Neogene sequence stratigraphic evolution of the Foz do Amazonas Basin. Brazil. Terra Nova 26, 179–185. doi: 10.1111/ter.12083
Goudet, J. (2001). FSTAT, A Program to Estimate and Test Gene Diversities and Fixation Indices, Version 2.9. 3. Available online at: http://www2.unil.ch/popgen/softwares/fstat.htm
Gravena, W., Silva, V. M. F., Silva, M. N. F., Farias, I. P., and Hrbek, T. (2015). Living between rapids: genetic structure and hybridization in botos (Cetacea: Iniidae: Inia spp.) of the Madeira River, Brazil. Biol. J. Linn Soc. 114, 764–777. doi: 10.1111/bij.12463
Hayakawa, E. H., and Rossetti, D. F. (2015). Late quaternary dynamics in the Madeira River basin, southern Amazonia (Brazil), as revealed by paleomorphological analysis. An. Acad. Bras. Ciênc. 87, 29–49. doi: 10.1590/0001-3765201520130506
Hayakawa, E. H., Rossetti, D. F., and Valeriano, M. M. (2010). Applying DEM-SRTM for reconstructing a late Quaternary paleodrainage in Amazonia. Earth Planet Sci. Lett. 297, 262–270. doi: 10.1016/j.epsl.2010.06.028
Hoorn, C., Bogotá, A. G. R., Romero-Baez, M., Lammertsma, E. I., Flantua, S. G., Dantas, E. L., et al. (2017). The Amazon at sea: onset and stages of the Amazon River from a marine record, with special reference to Neogene plant turnover in the drainage basin. Global Planet Change 153, 51–65. doi: 10.1016/j.gloplacha.2017.02.005
Hoorn, C., Wesselingh, F. P., Steege, H. T., Bermudez, M. A., Mora, A., Sevink, J., et al. (2010). Amazonia through time: andean uplift, climate change, landscape evolution, and biodiversity. Science 330, 927–931. doi: 10.1126/science.1194585
International Union for Conservation of Nature [IUCN] (2020). The IUCN Red List of Threatened Species. Version 2020-1. Available online at: https://www.iucnredlist.org [accessed Aug 06, 2020].
Jakobsson, M., and Rosenberg, N. A. (2007). CLUMPP: a cluster matching and permutation program for dealing with label switching and multimodality in analysis of population structure. Bioinformatics 23, 1801–1806. doi: 10.1093/bioinformatics/btm233
Junk, W. J., Soares, M. G. M., and Bayley, P. B. (2007). Freshwater fishes of the Amazon River basin: their biodiversity, fisheries, and habitats. Aquat. Ecosyst. Health Manag. 10, 153–173.
Kullander, S. O. (2003). “Family Cichlidae,” in Check List of the Freshwater Fishes of South and Central America, eds R. E. Reis, S. O. Kullander, and C. J. Ferraris-Junior (Porto Alegre: Editora da PUC do Rio Grande do Sul), 605–654.
Kullander, S. O., and Ferreira, E. J. G. (2005). Two new species of Apistogrammaregan (Teleostei: cichlidae) from the rioTrombetas, Pará State, Brazil. Neotrop. Ichthyol. 3, 361–371. doi: 10.1590/S1679-62252005000300003
Larkin, M. A., Blackshields, G., Brown, N. P., Chenna, R., McGettigan, P. A., and McWilliam, H. (2007). ClustalversãoW eClustal X version 2.0. Bioinformatics 23, 2947–2948. doi: 10.1093/bioinformatics/btm404
Leitão, C. S. S., Santos, C. H. A., Souza, E. M. S., Vilarinho, G. C. C., Paula-Silva, M. N., Val, P., et al. (2017). Development and characterization of microsatellite loci in Amazonian dwarf cichlids Apistogramma spp. (Perciformes: cichlidae): uncovering geological influences on amazonian fish population. J. Appl. Ichthyol. 33, 1196–1199. doi: 10.1111/jai.13490
Lewis, P. O., and Zaykin, D. (2001). GDA (Genetic Data Analysis): Computer Program for the Analysis of Allelic Data. Versión 1.1. Storrs, CT: University of Connecticut.
Librado, P., and Rozas, J. (2009). DnaSP v5: a software for comprehensive analysis of DNA polimorphism data. Bioinformatics 25, 1451–1452. doi: 10.1093/bioinformatics/btp187
Lydeard, C., and Roe, K. J. (1997). The phylogenetic utility of the mitochondrial cytochrome b gene for inferring relationships among actinopterygian fishes. Mol. Syst. Fishes 1, 285–303.
López-Fernández, H., Honeycutt, R. L., Stiassny, M. L., and Winemiller, K. O. (2005). Morphology, molecules, and character congruence in the phylogeny of South American geophagine cichlids (Perciformes: cichlidae). Zool. Scripta 34, 627–651. doi: 10.1111/j.1463-6409.2005.00209.x
Maruska, K. P. (2014). Social regulation of reproduction in male cichlid fishes. Gen. Comp. Endocr. 207, 2–12. doi: 10.1016/j.ygcen.2014.04.038
Moritz, C. (1994). Defining ‘Evolutionarily Significant Units’ for conservation. Trends Ecol. Evol. 9, 373–375. doi: 10.1016/01695347.1994.900574
Naka, L. N., Bechtoldt, C. L., Henriques, L. M. P., and Brumfield, R. T. (2012). The role of physical barriers in the location of avian suture zones in the Guiana Shield. Northern Amazonia. Am. Nat. 179, 115–132. doi: 10.1086/664627
Pritchard, J. K., Stephens, M., and Donnelly, P. (2000). Inference of population structure using multilocus genotype data. Genetics 155, 945–959. doi: 10.1093/genetics/155.2.945
Quérouil, S., Diaz, A. V., García-Dávila, C., Römer, U., and Renno, J.-F. (2015). Development and characterization of polymorphic microsatellite markers in neotropical fish of the genus Apistogramma (Perciformes: labroidei: cichlidae). J. Appl. Ichthyol. 31, 52–56. doi: 10.1111/jai.12975
Ramos, F. M., Araújo, M. L. G., Prang, G., and Fujimoto, R. Y. (2015). Ornamental fish of economic and biological importance to the Xingu River. Brazil. J. Biol. 75, 95–98. doi: 10.1590/1519-6984.02614BM
Ribas, C. C., Aleixo, A., Nogueira, A. C. R., Miyaki, C. Y., and Cracraft, J. (2012). A paleobiogeographic model for biotic diversification within Amazonia over the past three million years. Proc. R. Soc. Biol. Sci. 279, 681–689. doi: 10.1098/rspb.2011.1120
Römer, U. (2006). Cichlid atlas: Natural History of South American dwarf Cichlids. Melle: Mergus Verlag.
Rosenberg, N. A. (2003). DISTRUCT: a program for the graphical display of population structure. Mol. Ecol. Notes 4, 137–138. doi: 10.1046/j.1471-8286.2003.00566.x
Rossetti, D. F., Molina, E. C., and Cremon, E. H. (2016). Genesis of the largest Amazonian wetland in northern Brazil inferred by morphology and gravity anomalies. J. S. Am. Earth Sci. 69, 1–10. doi: 10.1016/j.jsames.2016.03.006
Rossetti, D. F., and Toledo, P. M. (2007). Environmental changes in Amazonia as evidenced by geological and paleontological data. Rev. Bras. Ornitol. 15, 251–264.
Rossetti, D. F., Toledo, P. M., and Góes, A. M. (2005). New geological framework for Western Amazonia (Brazil) and implications for biogeography and evolution. Quat. Res. 63, 78–89. doi: 10.1016/j.yqres.2004.10.001
Rull, V. (2011). Neotropical biodiversity: timing and potential dRivers. Trends Ecol. Evol. 26, 508–513. doi: 10.1016/j.tree.2011.05.011
Rull, V. (2013). Palaeoclimates and Amazon biodiversity. J. Biogeog. 40, 1413–1414. doi: 10.1111/jbi.12141
Sambrook, J., Fritsch, E. F., and Maniatis, T. (1989). Molecular Cloning: a Laboratory Manual. New York: Cold Spring Harbor Laboratory Press.
Santos, C. H. A., Leitão, C. S. S., Paula-Silva, M. N., and Almeida-Val, V. M. F. (2016). Genetic differentiation in red-bellied piranha populations (Pygocentrus nattereri, Kner, 1858) from the Solimões-Amazonas River. Ecol. Evol. 6, 4203–4213. doi: 10.1002/ece3.2195
Santos, C. H. A., Sousa, C. F. S., Paula-Silva, M. N., Val, A. L., and Almeida-Val, V. M. F. (2011). Genetic diversity in Cichla monoculus (Spix and Agassiz, 1931) populations: implications for management and conservation. Am. J. Environ. Sci. 8, 35–41. doi: 10.3844/ajessp.2012.35.41
Stokes, M. F., Goldberg, S. L., and Perron, J. T. (2018). Ongoing River capture in the Amazon. Geophys. Res. Lett. 45, 5545–5552. doi: 10.1029/2018GL078129
Taberlet, P., Meyer, A., and Bouvetv, J. (1992). Unusual mitochondrial DNA polymorphism in two local populations of blue tit Parus caeruleus. Mol. Ecol. 1, 27–36. doi: 10.1111/j.1365-294X.1992.tb00152.x
Tajima, F. (1989). Statistical method for testing the neutral mutation hypothesis by DNA polymorphism. Genetics 123, 585–595.
Tougard, C., Garcia Davila, C. R., Römer, U., Duponchelle, F., Cerqueira, F., Paradis, E., et al. (2017). Tempo and rates of diversification in the South American cichlid genus Apistogramma (Teleostei: perciformes: cichlidae). PLoS One 12:e0182618. doi: 10.1371/journal.pone.0182618
Turner, G. F. (2007). Adaptive radiation of cichlid fish. Curr. Biol. 17, R827–R831. doi: 10.1016/j.cub.2007.07.026
Val, P., Silva, C. L., Harbor, D., Morales, N., Amaral, F. R., and Maia, T. F. A. (2014). Erosion of an acive fault scarp leads to drainage capture in the Amazon region. Brazil. Earth Surf. Proc. Land. 39, 1062–1074. doi: 10.1002/esp.3507
van Soelen, E. E., Kim, H., Santos, R. V., Dantas, E. L., Almeida, F. V., Pires, J. P., et al. (2017). A 30 Ma history of the Amazon River inferred from terrigenous sediments and organic matter on the Ceará Rise. Earth Planet Sci. Lett. 474, 40–48. doi: 10.1016/j.epsl.2017.06.025
Weir, B. S., and Cockerham, C. C. (1984). Estimating F statistics for the analysis of population structure. Evolution 38, 1358–1370. doi: 10.2307/2408641
Wise, M. (2011a). Apistogramma Species List by Species-Groups/Complexes. Available online at: https://www.tomc.no/page.aspx?PageId=116
Wise, M. (2011b). Apistogramma Species List by Species-Groups/Complexes. Available online at: https://www.tomc.no/page.aspx?PageId=118
Keywords: Apistogramma, microsatellite, mtDNA genes, fish, Amazon, paleovalley, river formation
Citation: Leitão CSS, Souza ÉMS, Santos CHA, Val P, Val AL and Almeida-Val VMF (2021) River Reorganization Affects Populations of Dwarf Cichlid Species (Apistogramma Genus) in the Lower Negro River, Brazil. Front. Ecol. Evol. 9:760287. doi: 10.3389/fevo.2021.760287
Received: 17 August 2021; Accepted: 16 November 2021;
Published: 09 December 2021.
Edited by:
Jean Boubli, University of Salford, United KingdomReviewed by:
Ricardo Britzke, National University of San Marcos, PeruJosiane Ribolli, Federal University of Santa Catarina, Brazil
Copyright © 2021 Leitão, Souza, Santos, Val, Val and Almeida-Val. This is an open-access article distributed under the terms of the Creative Commons Attribution License (CC BY). The use, distribution or reproduction in other forums is permitted, provided the original author(s) and the copyright owner(s) are credited and that the original publication in this journal is cited, in accordance with accepted academic practice. No use, distribution or reproduction is permitted which does not comply with these terms.
*Correspondence: Carolina Sousa de Sá Leitão, a2NhdWZzQGdtYWlsLmNvbQ==