 Xinyue Gao
 Qing Zhao
 Jiufeng Wei
 Hufang Zhang2*†
- 1College of Plant Protection, Shanxi Agricultural University, Jinzhong, China
- 2Department of Biology, Xinzhou Teachers University, Xinzhou, China
The Colorado potato beetle (CPB), scientifically known as Leptinotarsa decemlineata, is a destructive quarantine pest that has invaded more than 40 countries and regions worldwide. It causes a 20–100% reduction in plant production, leading to severe economic losses. Picromerus bidens L. is a predatory insect that preys on CPB. This study used the MaxEnt model to predict the current and future potential distribution areas of CPB and P. bidens under different climatic scenarios to determine the possibility of using P. bidens as a natural enemy to control CPB. The possible introduction routes of CPB and P. bidens were subsequently predicted by combining their potential distribution with the current distribution of airports and ports. Notably, the potential distribution area of P. bidens was similar to that of CPB, suggesting that P. bidens could be used as a natural enemy to control CPB. Future changes in the suitable growth areas of CPB under different climate scenarios increased and decreased but were insignificant, while those of P. bidens decreased. Consequently, a reduction of the suitable habitats of P. bidens may cause a decrease in its population density, leading to a lack of adequate and timely prevention and control of invasive pests. Active measures should thus be enacted to minimize global warming and protect biodiversity. This study provides a theoretical basis and data support for early warning, monitoring, and control of the CPB spread.
Introduction
Global warming has become a major climate change issue during the last century (Stocker et al., 2013). These changes have affected the distribution patterns of organisms, leading to changes in the suitable areas of species and biodiversity reduction. The impact of climate change on insects is particularly important, and climate change can directly or indirectly affect the distribution and number of insects (for example, by changing the emergence of species and hosts), so simulating how climate change affects invasive pests and their natural enemies can provide important information for controlling and managing the spread of these pests and introducing natural enemies (Wei et al., 2020). Economic globalization has also accelerated the spread of invasive species, resulting in serious economic losses. The Colorado potato beetle (CPB), scientifically known as Leptinotarsa decemlineata Say, is a destructive quarantine pest whose main hosts are the Solanaceae species such as potato (Solanum tuberosum L.) (Guo et al., 2010).
CPB has strong autonomous diffusion (Casagrande, 1985, 2014) and adaptability abilities (Weber, 2003, Jiao, 2016). It was first identified in the Rocky Mountains of North America while feeding on the wild plant Solanum rostratum D. CPB mostly spreads out with potato as its host plant because it is widely planted as an important economic crop (Jacques, 1985; Casagrande, 2014). CPB has gradually spread from North America to more than 40 countries across Europe, Asia, and Africa in the past century. CPB can have 1–4 generations in 1 year depending on the geographic distribution (Hare, 1990). The adults overwintered at 10–60 cm below the soil and mostly at 10–30 cm. The overwintering depth was related to the soil texture and deeper in sandy loam (Tuerxun et al., 2010). After overwintering, adults feed, mate and lay eggs on the back of host plant leaves. The egg period is 5 for 7 days, and then the larvae and the overwintering adults feed heavily on the leaves of the host crops (mainly potato), which can cause great harm to the crop hosts in spring (Pulatov et al., 2016). CPB can reduce potato yield by 20–100%, resulting in serious economic losses (Caprio, 1987; Casagrande, 2014). CPB control includes plant quarantine, agricultural, physical, biological, and chemical control, though chemical control remains the main method (Wang, 2017). However, the effect of chemicals has been significantly reduced by the over-dependence on chemicals and the strong adaptability of CPB (Cutler et al., 2005; Malekmohammadi et al., 2012; Rinkevich et al., 2012; Szendrei et al., 2012). Numerous studies postulate that CPB has developed resistance to most registered insecticides (Li, 2014). It is thus necessary to actively develop new technologies that can partially replace chemical control or complement chemical control technologies in CPB control (Li, 2014). Numerous studies focusing on biological control technologies have been carried out in China and abroad, mainly on utilizing natural enemy resources. This study explored the biological prevention of CPB using a modeling approach to assess the distribution of CPB and its natural enemy, Picromerus bidens (P. bidens).
Picromerus bidens L. is a predatory insect belonging to the family Pentatomidae in the order Hemiptera. It mainly preys on the larvae of insects in the order Lepidoptera, Hymenoptera, and Coleoptera, and sometimes on their pupae and adults. It is widely distributed in the western parts of the Palearctic, including Europe, China, and North Africa (Ahmad and Önder, 1990; Legaspi et al., 1996; De Clercq, 2000). It likes fresh, cool and humid areas (Larivière and Larochelle, 1989), mainly growing in moist bushes and forests more than 2 m above the ground (Čokl et al., 2011). Adjacent fresh vegetation is important for the successful development of nymphs and adults, as well as for reproductive activities (Mahdian et al., 2008). The P. bidens has univoltine (one brood per year) life cycle with obligate embryonic diapause and overwinters primarily at the egg stage (Ganyukova et al., 2020). Nymphs hatch in spring. During the I-age, the nymphs live closely together and gather together, and the size varies with the number of eggs in each batch. Ii-instar nymphs also tend to live in groups, living in groups of 3–56 individuals, and the activity and mobility of nymphs increase from iii to v-age (Cianferoni and Dioli, 2019). The I-instar nymph does not eat, but only absorbs water (De Clercq, 2000) or absorbs liquids from plant diversity. Second or third instar nymphs begin to prey (Cianferoni and Dioli, 2019). P. bidens is long known as an active predator for caterpillars and other insects with soft cover (Mayné and Breny, 1948). The P. bidens has been studied as suitable as agents of biological control of CPB since 1997 (Volkov et al., 2013). Volkov et al. (2013) in laboratory and field researches the ability of P. bidens to reduce the number of CPB larvae on potato plants was established.
Species Distribution Models (SDMs), also called Ecological Niche Models (ENMs use species distribution data and related environmental variables to infer the current ecological needs of the species through differential algorithms. These models are projected to the research area set at different times and spaces to obtain the species’ potential distribution area in the study area (Elith et al., 2006). Currently, SDMs are widely used in various disciplines, such as ecology, biological invasion, and conservation biology. The MaxEnt software has become more popular because of its stable performance and user-friendly interface (Liu et al., 2020) compared to other models. It has been widely used in predicting the potential distribution areas of plants, animals, and microorganisms.
This study predicted the potential distribution areas of CPB and P. bidens using the distribution data and environmental variables to explore the possibility of P. bidens being a natural enemy of CPB. It also comparatively analyzed the diffusion dynamics in the suitable zone of CPB and P. bidens under different climatic scenarios (SSP1-2.6, SSP2-4.5, SSP3-7.0, SSP5-8.5) for the future (2021–2100 years). This study provides a theoretical basis and data support for early warning, monitoring, and control of the CPB spread.
Materials and Methods
Occurrence Data
The CPB and P. bidens distribution data were obtained from the Global Biodiversity Information Facility database (GBIF, 2020) and the existing relevant literature in China and abroad. The packet “dismo” was employed to filter out the distribution points where the coordinates were duplicated, missing, and inaccurate to reduce the influence of acquisition preference on the model. Spatial autocorrelation was avoided using the SDM Toolbox v2.4 of ArcGIS10.7 to spatially rarefy the occurrence data and set the minimum distance between each record as 10 km to improve the quality of the model. The final data was subsequently saved in the CSV format as required by the model. The final data were then imported into ArcGIS 10.7 to obtain the global distribution records of CPB and P. bidens (Figure 1). The records included 2,093 CPB and 1,623 P. bidens distribution sites.
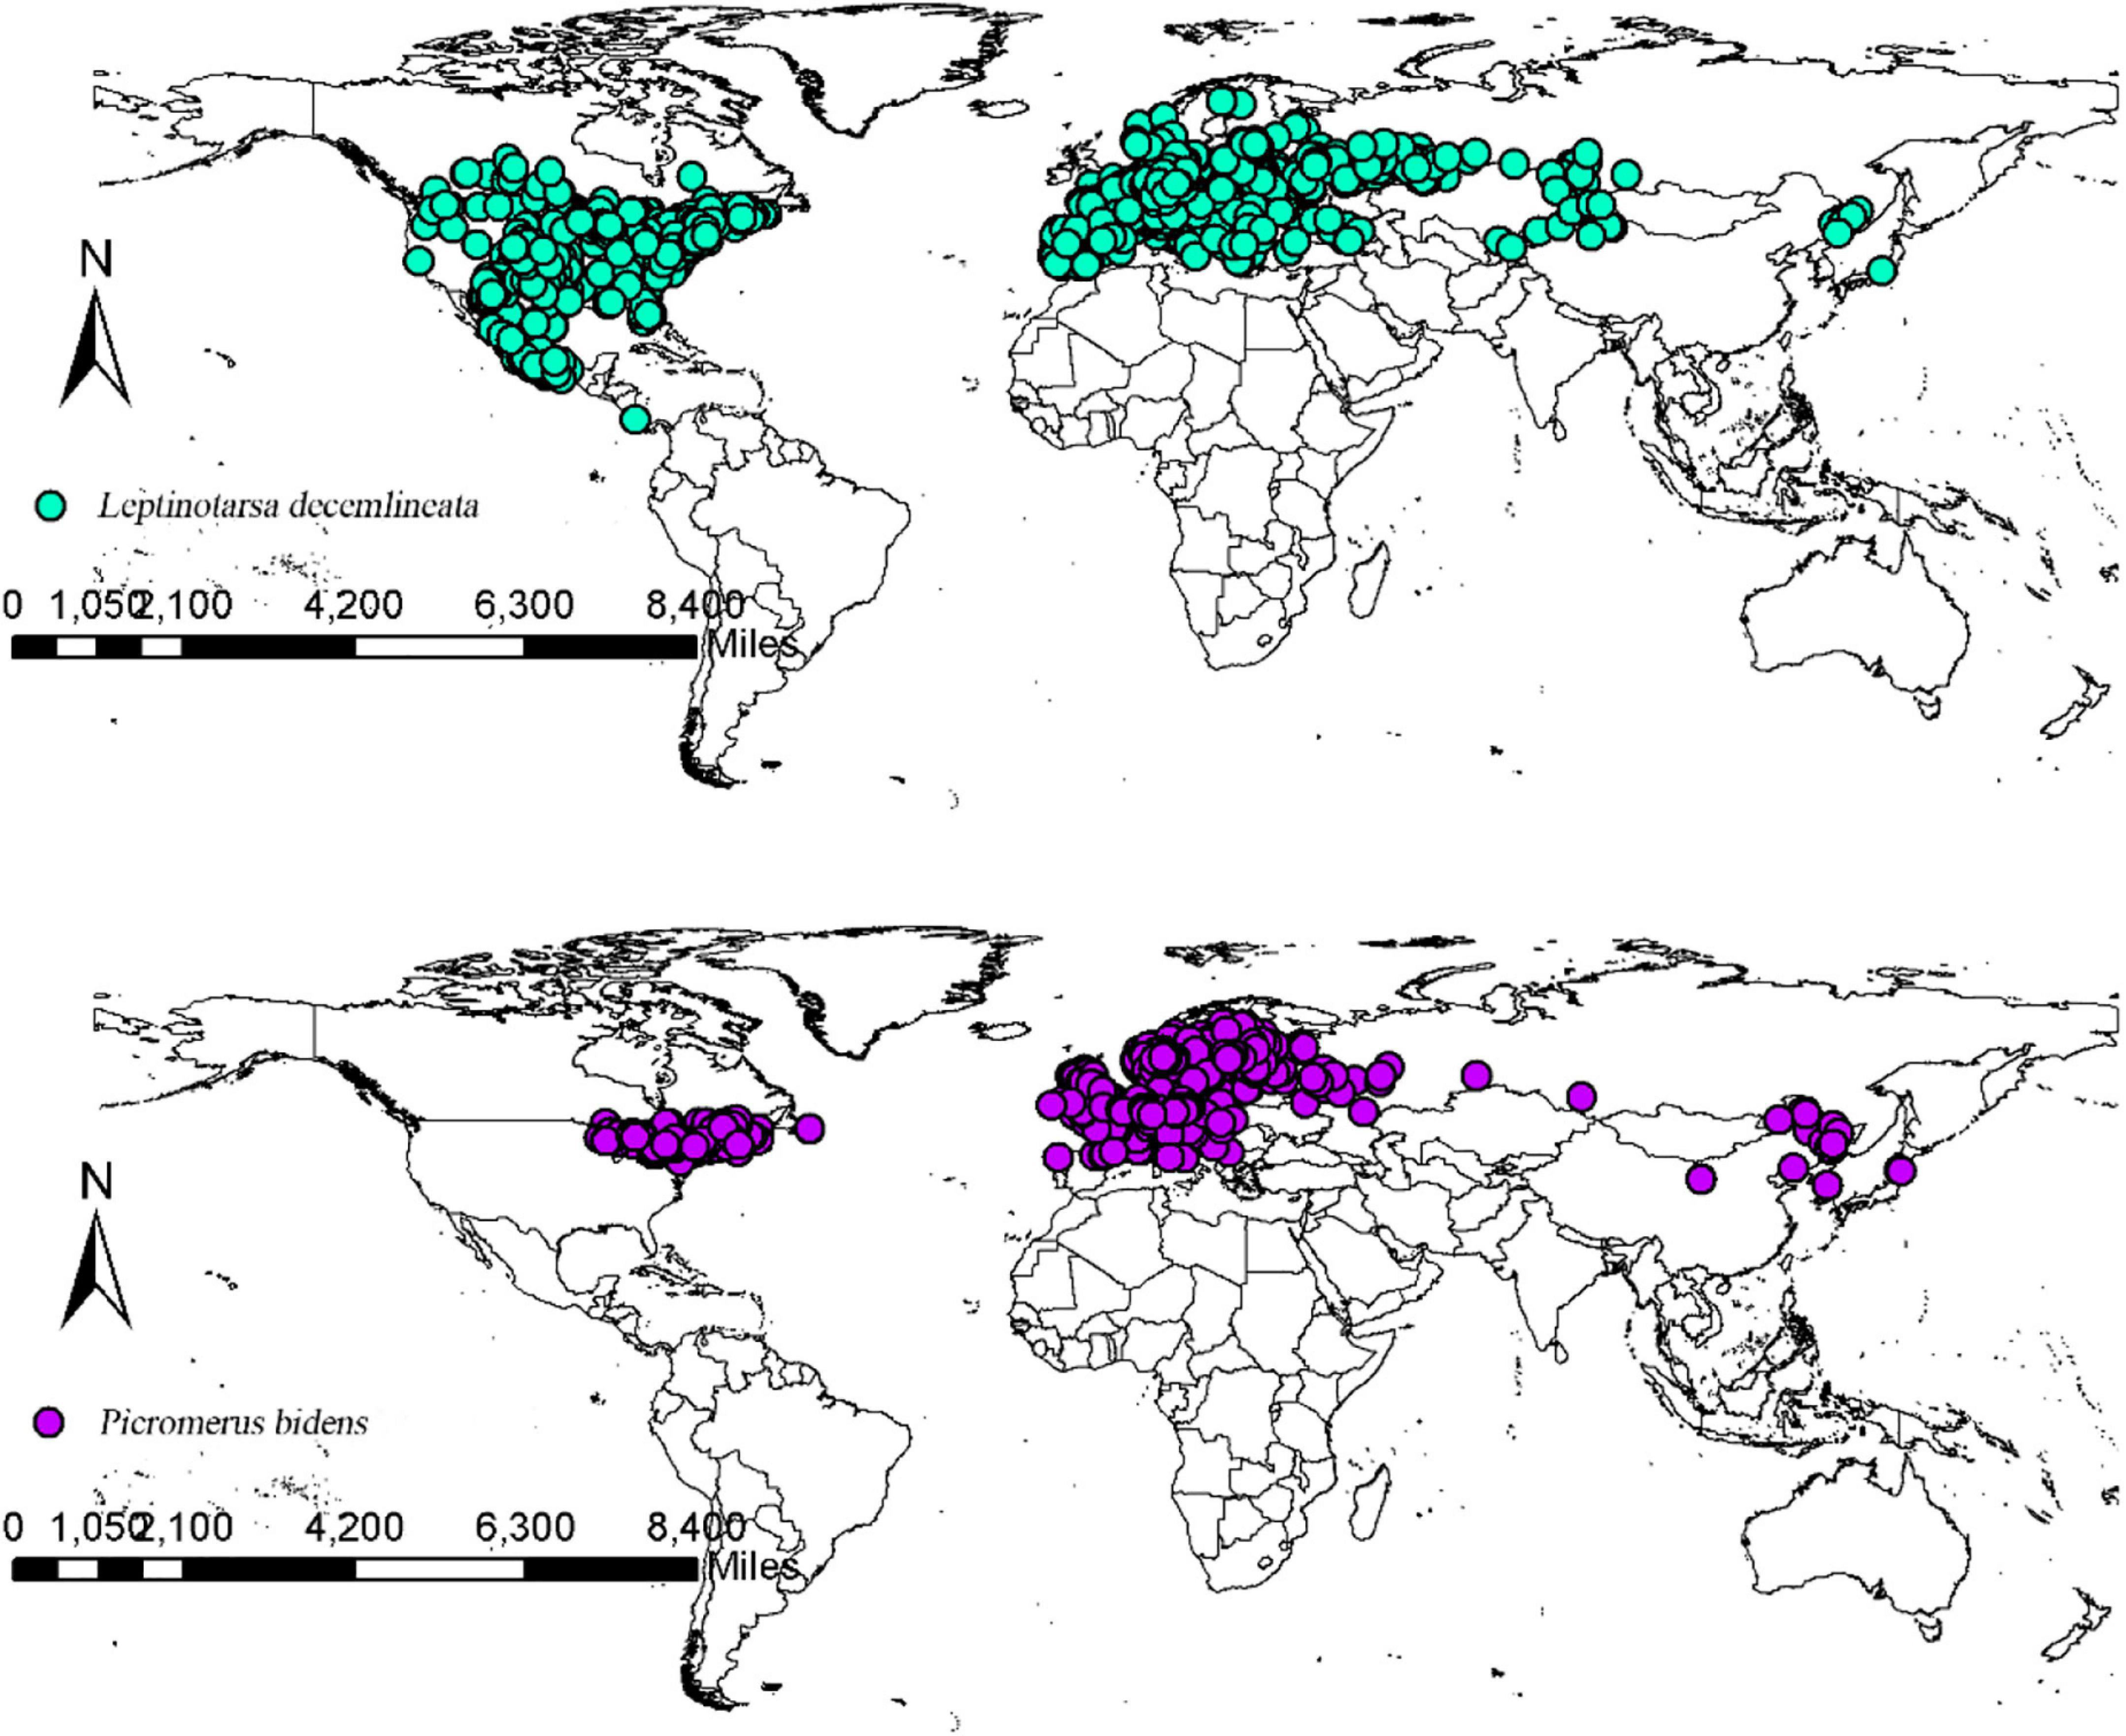
Figure 1. Worldwide geographic distribution records of CPB and P. bidens.
The global airport geo-reference list was obtained from Nature Earth (2009). Small and medium-sized airports were excluded in the analysis leaving only the large airports. The list of the geographical locations of the ports was obtained from the WFP GeoNode database (WFP GeoNode, 2017). The binary map was subsequently intersected with the airports and ports information to determine the possible CPB and P. bidens introduction routes (Marchioro and Krechemer, 2021).
Environmental Variables
The environmental variables used in this study were mainly divided into three parts:
(i) Climate variables which were obtained from the WorldClim database (WorldClim, 2020). They included 19 bioclimatic variables (BIO1- BIO19) and one elevation dataset for current and future climatic scenarios, with a spatial resolution of 2.5 arc-minute (about 5 km at the equator). The future climatic conditions datasets were obtained from the CMIP6 global climate model, BCC- CSM2- MR dataset, with a spatial resolution of 2.5 arc-minute (about 5 km at the equator). The datasets included the biomass climate variables of 2021–2100 under four climatic scenarios: SSP1- 2.6, SSP2-4.5, SSP3-7.0, and SSP5-8.5.
(ii) Two topographic factors: slope and aspect, extracted from the QGIS3.12.2 version based on the altitude of the sites.
(iii) Soil data derived from the Harmonized World Soil Database (HWSD, 2008). The soil’s available water content (AWC_CLASS) and five upper soil attributes, including T_ TEXTURE, T_PH_H2O, T_SAND, T_ OC, and T_CLAY) were selected from the soil variables and used for further modeling based on the physiological and biochemical characteristics of CPB. Raster data with a spatial resolution of 30 s (about 1 km at the equator) were downloaded and were subsequently resampled to a resolution of 2.5 arc-minute in ArcGIS 10.7. Previous studies postulate that the overwintering adult mortality of CPB is closely related to soil type (Liang et al., 1999; Tuerxun et al., 2010). However, the growth and development process of P. bidens is not significantly influenced by the soil characteristics. This study, therefore, only applied the soil variables for modeling purposes.
Principal component analysis using IBM SPSS Statistics 24 was employed to screen the environmental variables with a low correlation but a high significance to avoid over-fitting of the model (Fan et al., 2020). Seven environmental variables, including Mean temperature of coldest quarter (bio11), Precipitation of dnest quarter (bio17), Precipitation of Warmest Quarter (bio18), elve, slope, T_SAND, and T_OC, were selected from 28 environmental factors for CPB modeling (Table 1). Similarly, five environmental variables, including Mean temperature of driest quarter (bio9), Mean temperature of warmest quarter (bio10), Precipitation Seasonality (bio15), Precipitation of Warmest Quarter (bio18), and elve, were selected from 22 environmental factors for P. bidens modeling (Table 2).
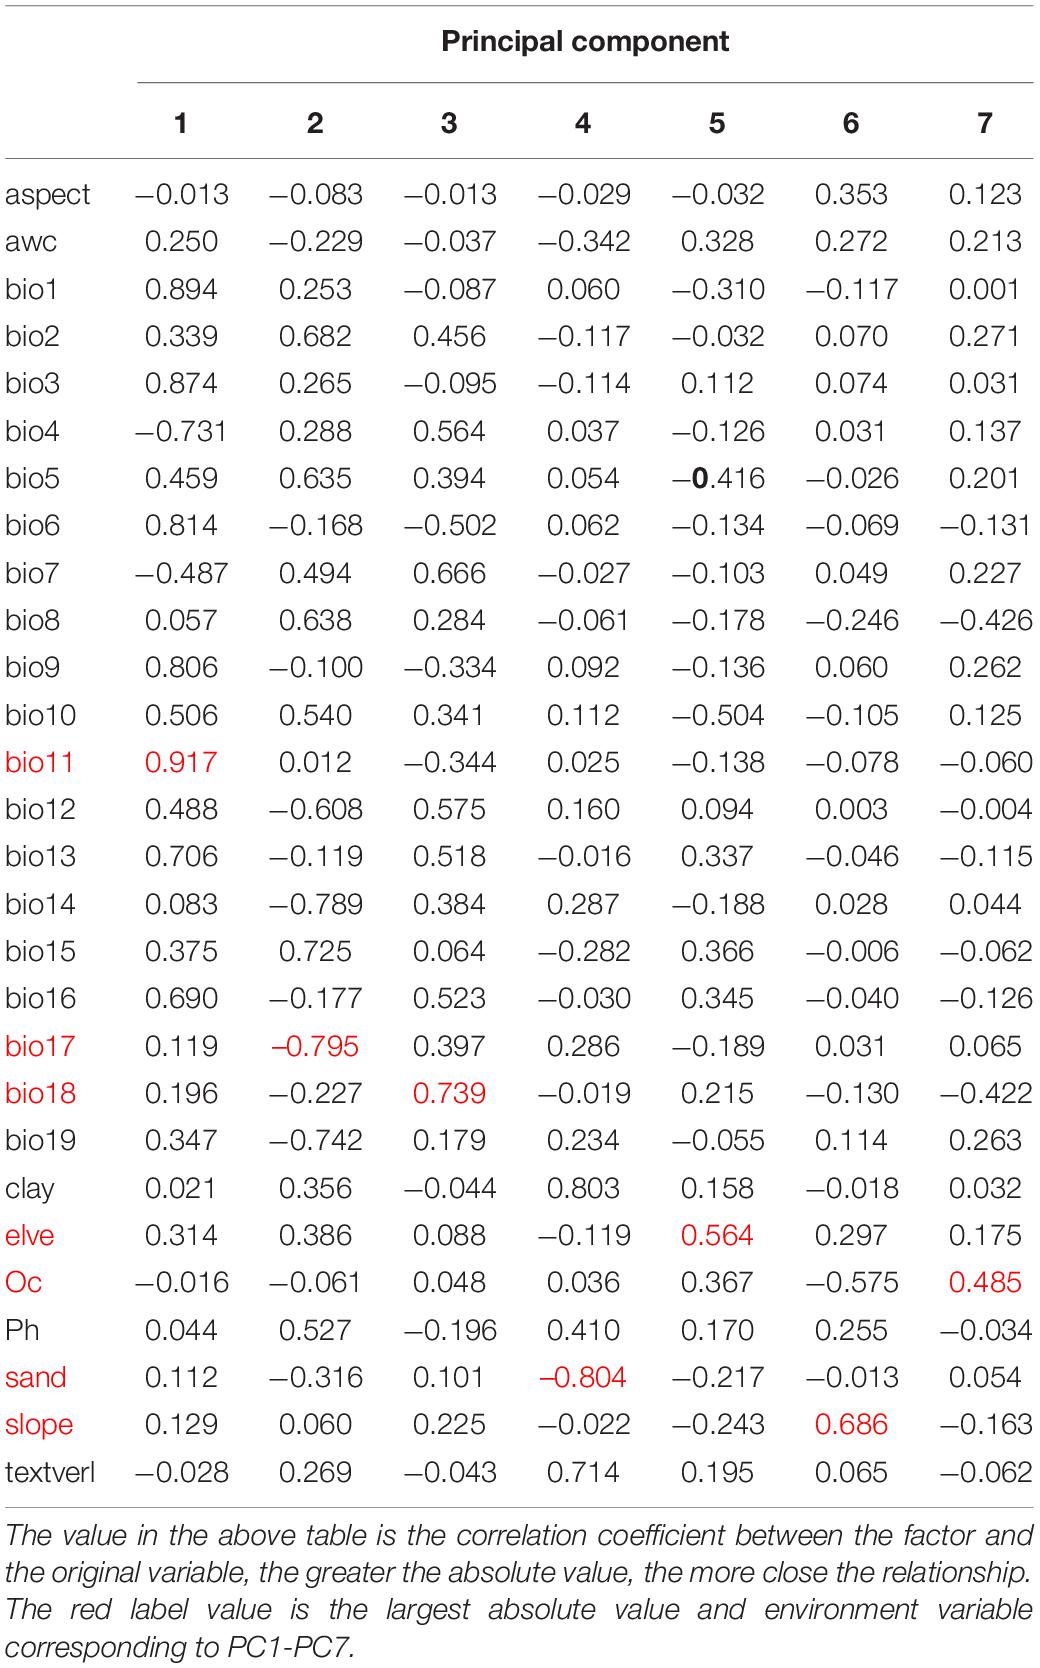
Table 1. Component matrix of CPB.
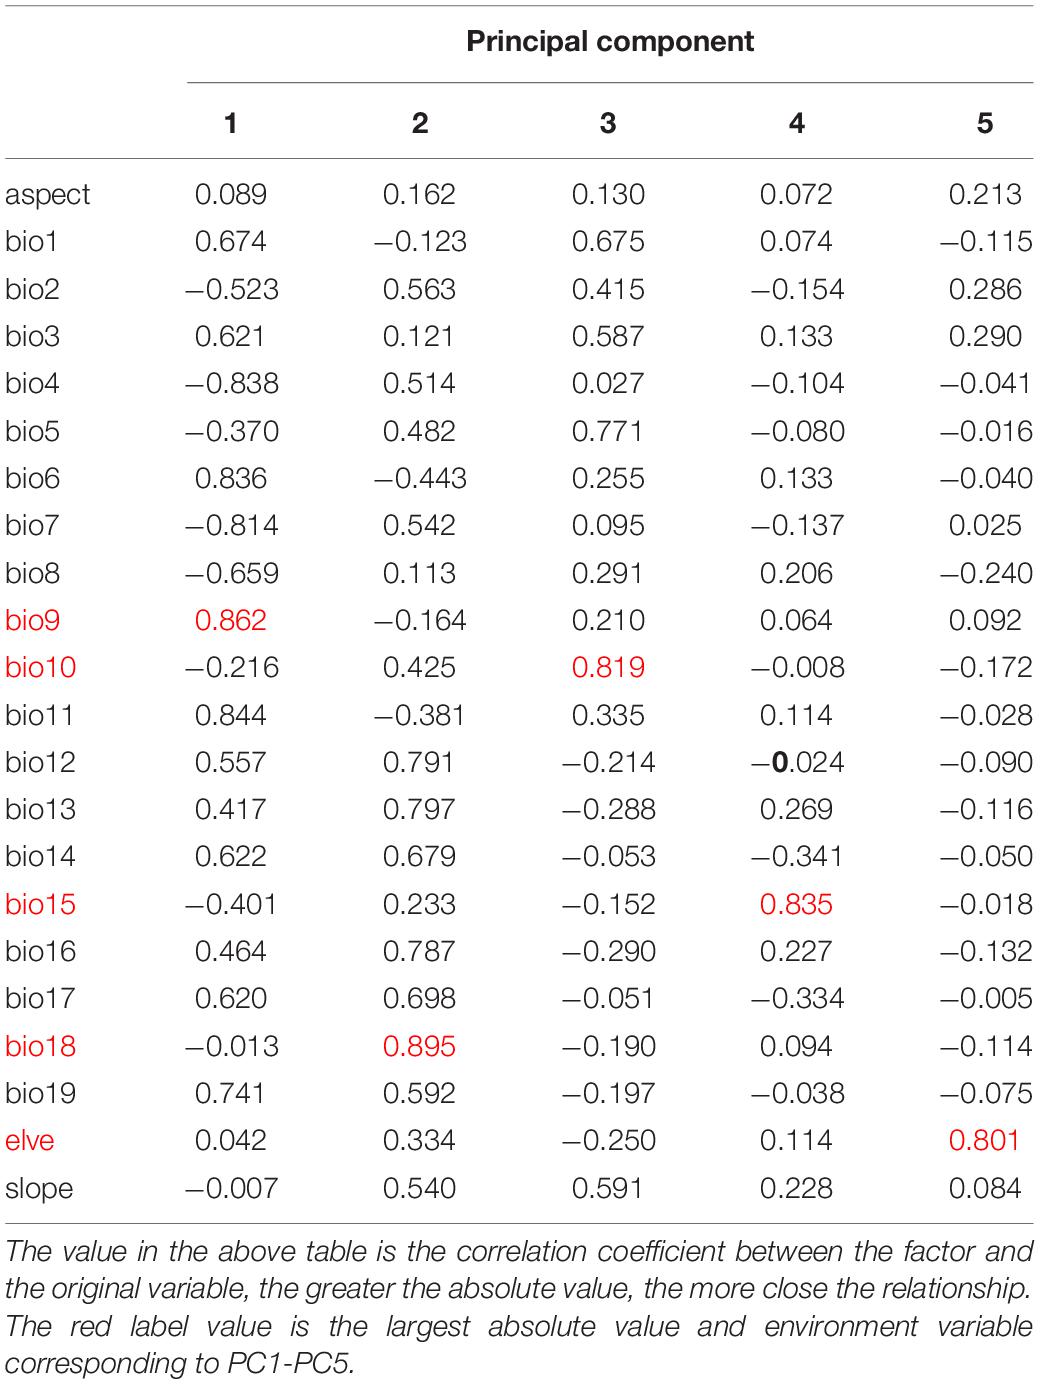
Table 2. Component matrix of P. bidens.
Modeling Procedure
The MaxEnt version 3.4.1 software built the niche models because of its stable performance and easy operation (Liu et al., 2020). Generally, the default settings of the MaxEnt software produce an overfitted model. The Feature Class (FC) and Regular Multiplier (RM) were thus used to optimize the model. The FC represents different transformations of covariables (Lu et al., 2020), including Linear (L), Product (P), Quadratic (Q), Threshold (T), and Hinge (H) (Elith et al., 2011; Kong et al., 2019). Adjusting the RM reduces the over-fitting of the model, making it smoother. The R package “ENMeval” was thus used to test whether the parameters were over-fitted, followed by choosing the combination of multipliers and feature classes based on these results (Qin et al., 2015). The Rm values ranged between 0.5 and 4.0 (increments of 0.5), while the FCs had eight combinations (L, LQ, LQP, QHP, LQH, LQHP, QHPT, and LQHPT). The “Checkerboard 2” method was subsequently used to calculate the Akaike information criterion coefficient (AICc) and select the lowest delta AICc score to run the final MaxEnt model (Wei et al., 2020). The best parameters of FC in the CPB and P. bidens models were LQHPT and QHPT (Figure 2). And the best parameters of RM in the CPB and P. bidens models were 1 and 4. Random testing of the model’s dataset employed 25% of the dataset and utilized a ten times cross-validation method in the MaxEnt test to prevent random errors (Liu et al., 2019). The logistic threshold of repeated training in the 10th percentile was used to determine the suitable and unsuitable habitats of CPB and P. bidens. This threshold is widely used to model species distribution, especially when the datasets are collected over time by different observers and methods (Wang et al., 2019).
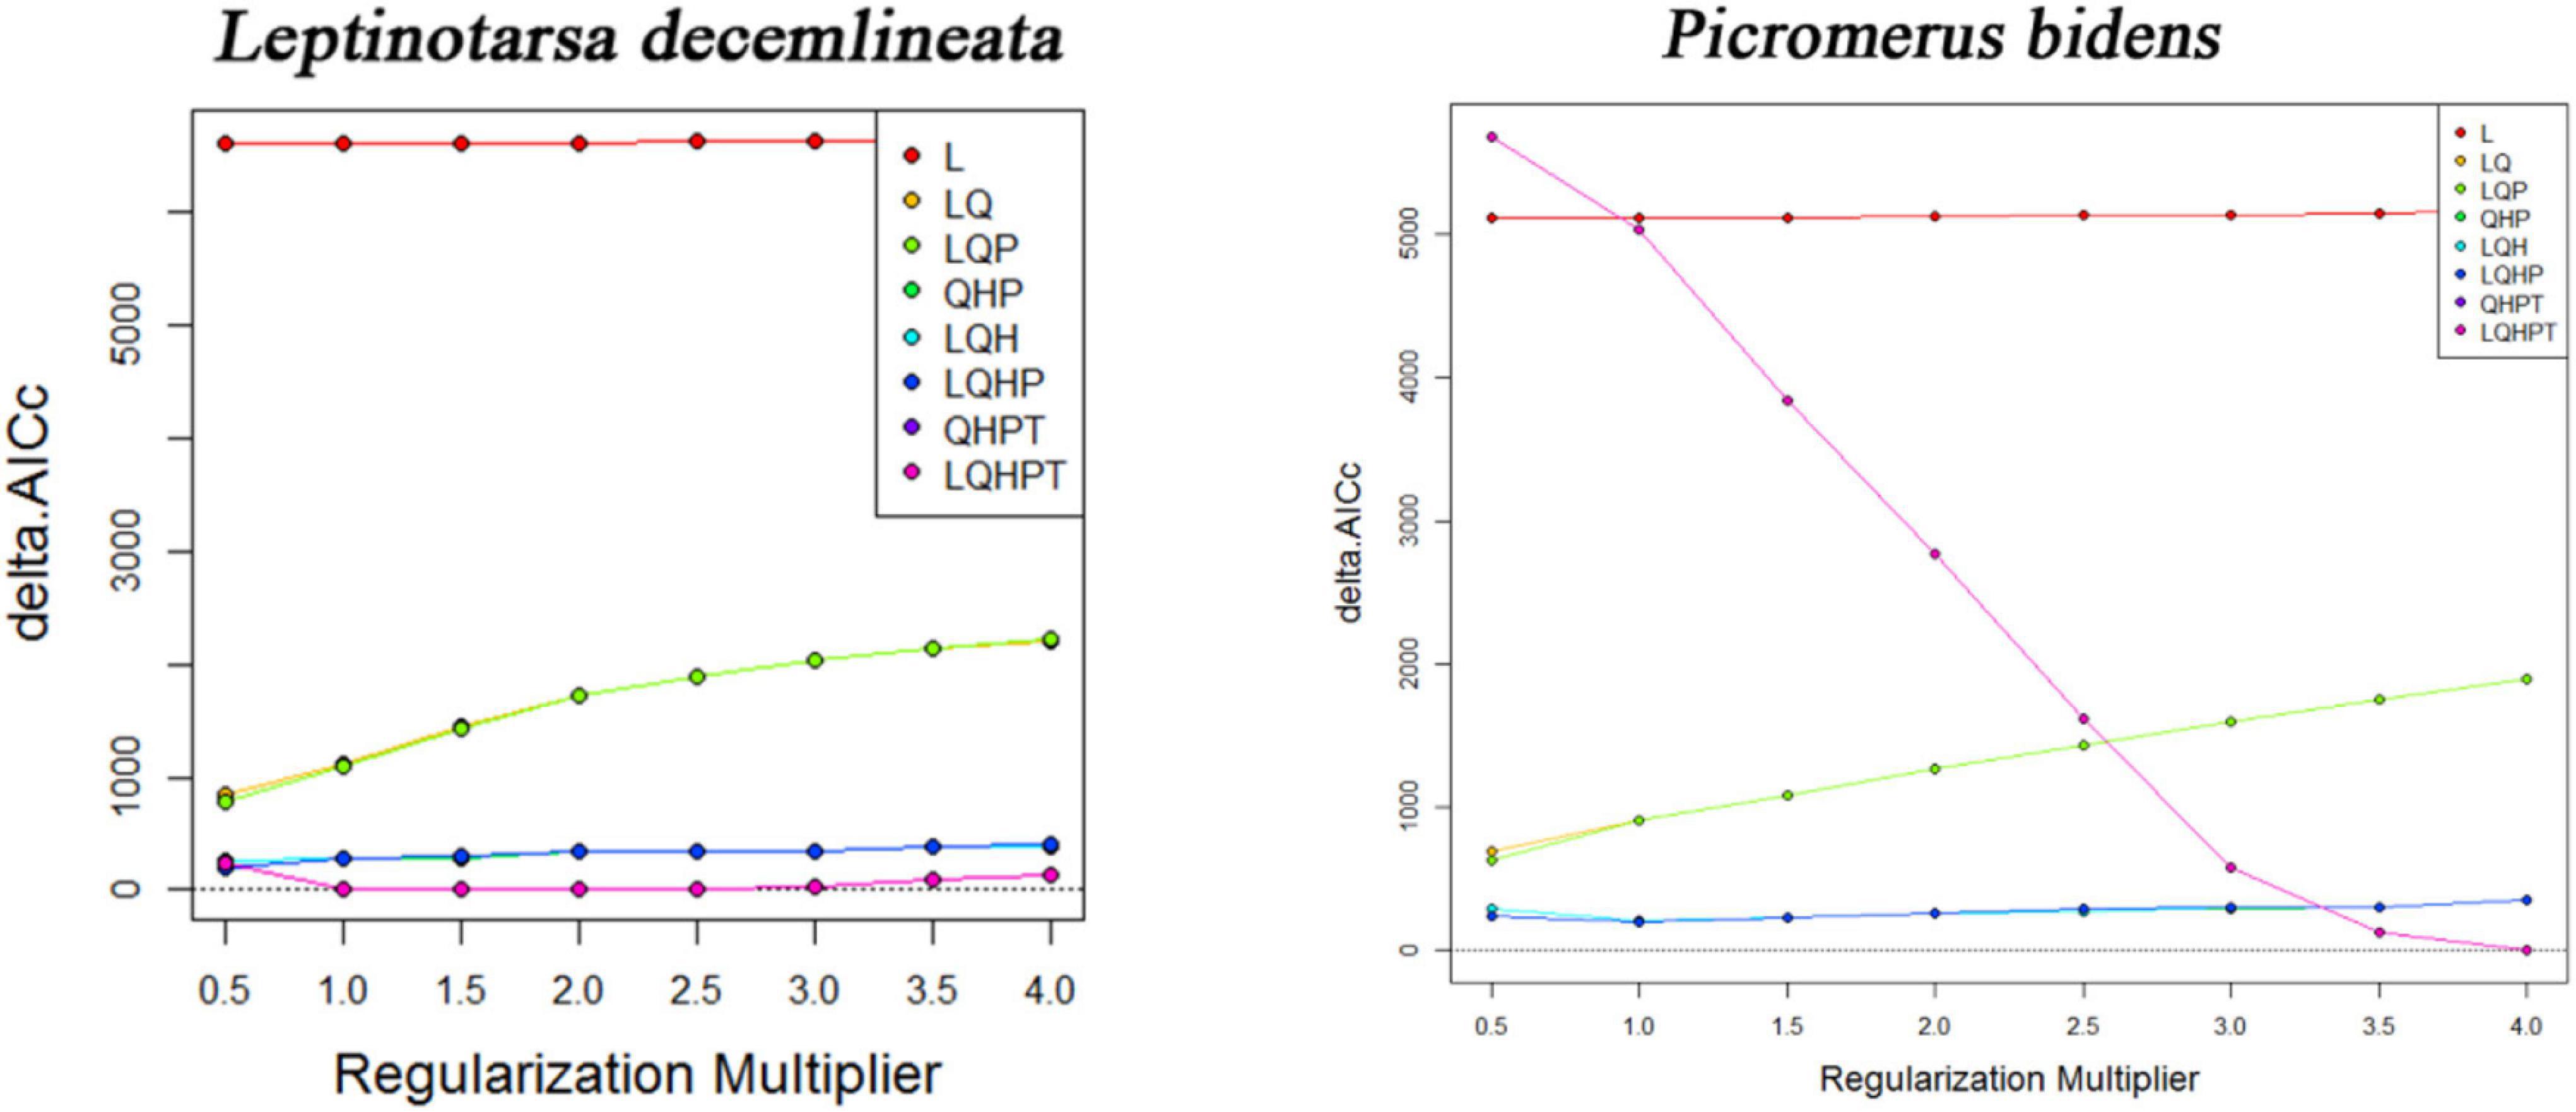
Figure 2. The AIC value of the parameter combination (FC, RM) calculated based on ENMeval.
Model Evaluation
The area under the receiver operating characteristic curve (ROC) is usually used to evaluate the performance of a model (Phillips et al., 2006). In this study, the average area under ROC (AUC) based on ten calculation results was used as the criterion to evaluate the model’s performance. Generally, the AUC should range between 0.5 and 1. An AUC equal to 0.5 suggests a pure guess, 0.5–0.6 is rated as unqualified, 0.6–0.7 is poor, 0.7–0.8 is average, 0.8–0.9 is good, and 0.9–1 is excellent (Phillips et al., 2006).
Results
Model Performance
Figure 3 shows the ROC curve obtained after running the MaxEnt model 10 times. The mean AUC of CPB and P. bidens was 0.867 and 0.921, respectively, indicating the good performance of the MaxEnt model in predicting the potential distribution areas of CPB and P. bidens.
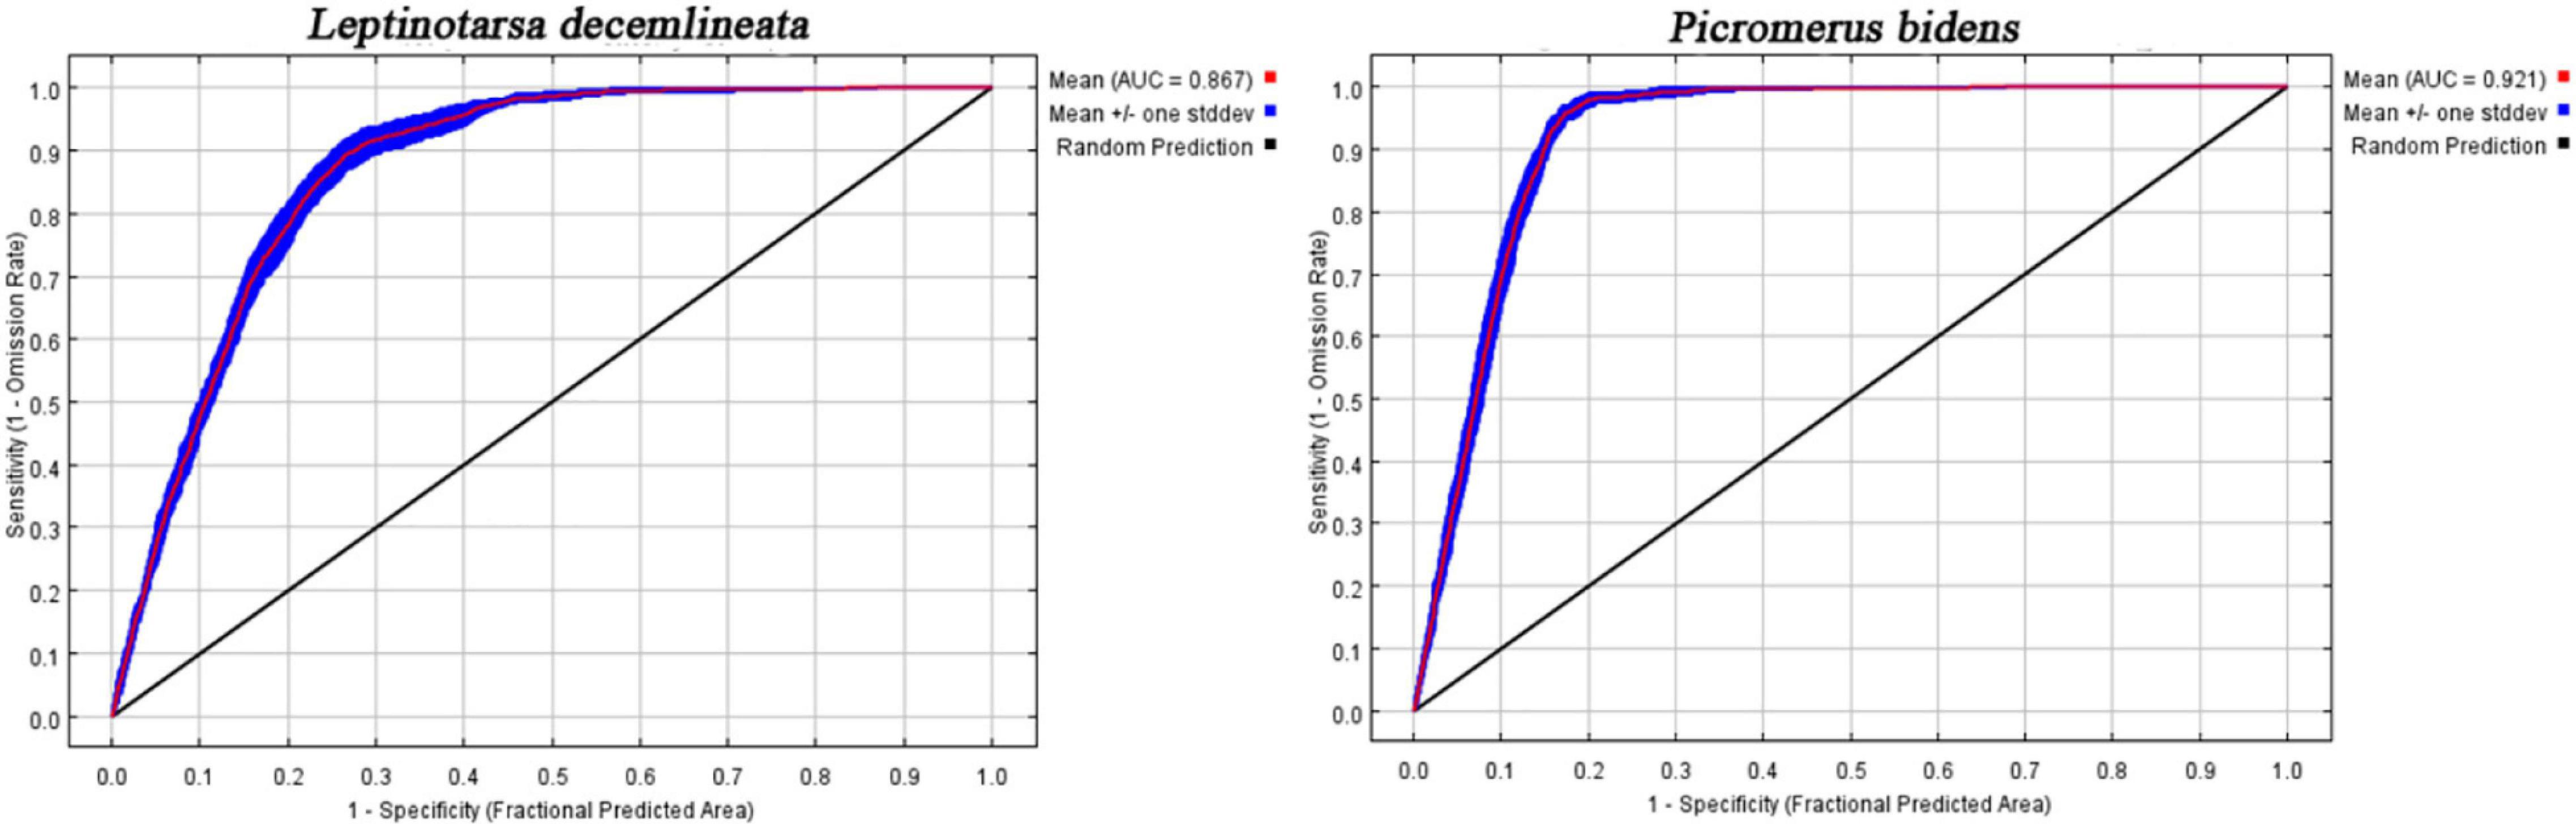
Figure 3. The AUC curves in the developing CPB and P. bidens distribution model.
Current Potential Distribution
The potential distribution map of CPB and P. bidens was based on the current species occurrence data and climate variables. Notably, the adaptive distribution of CPB and P. bidens was divided into four grades using the Natural Breaks (Jenks) (Figure 4).
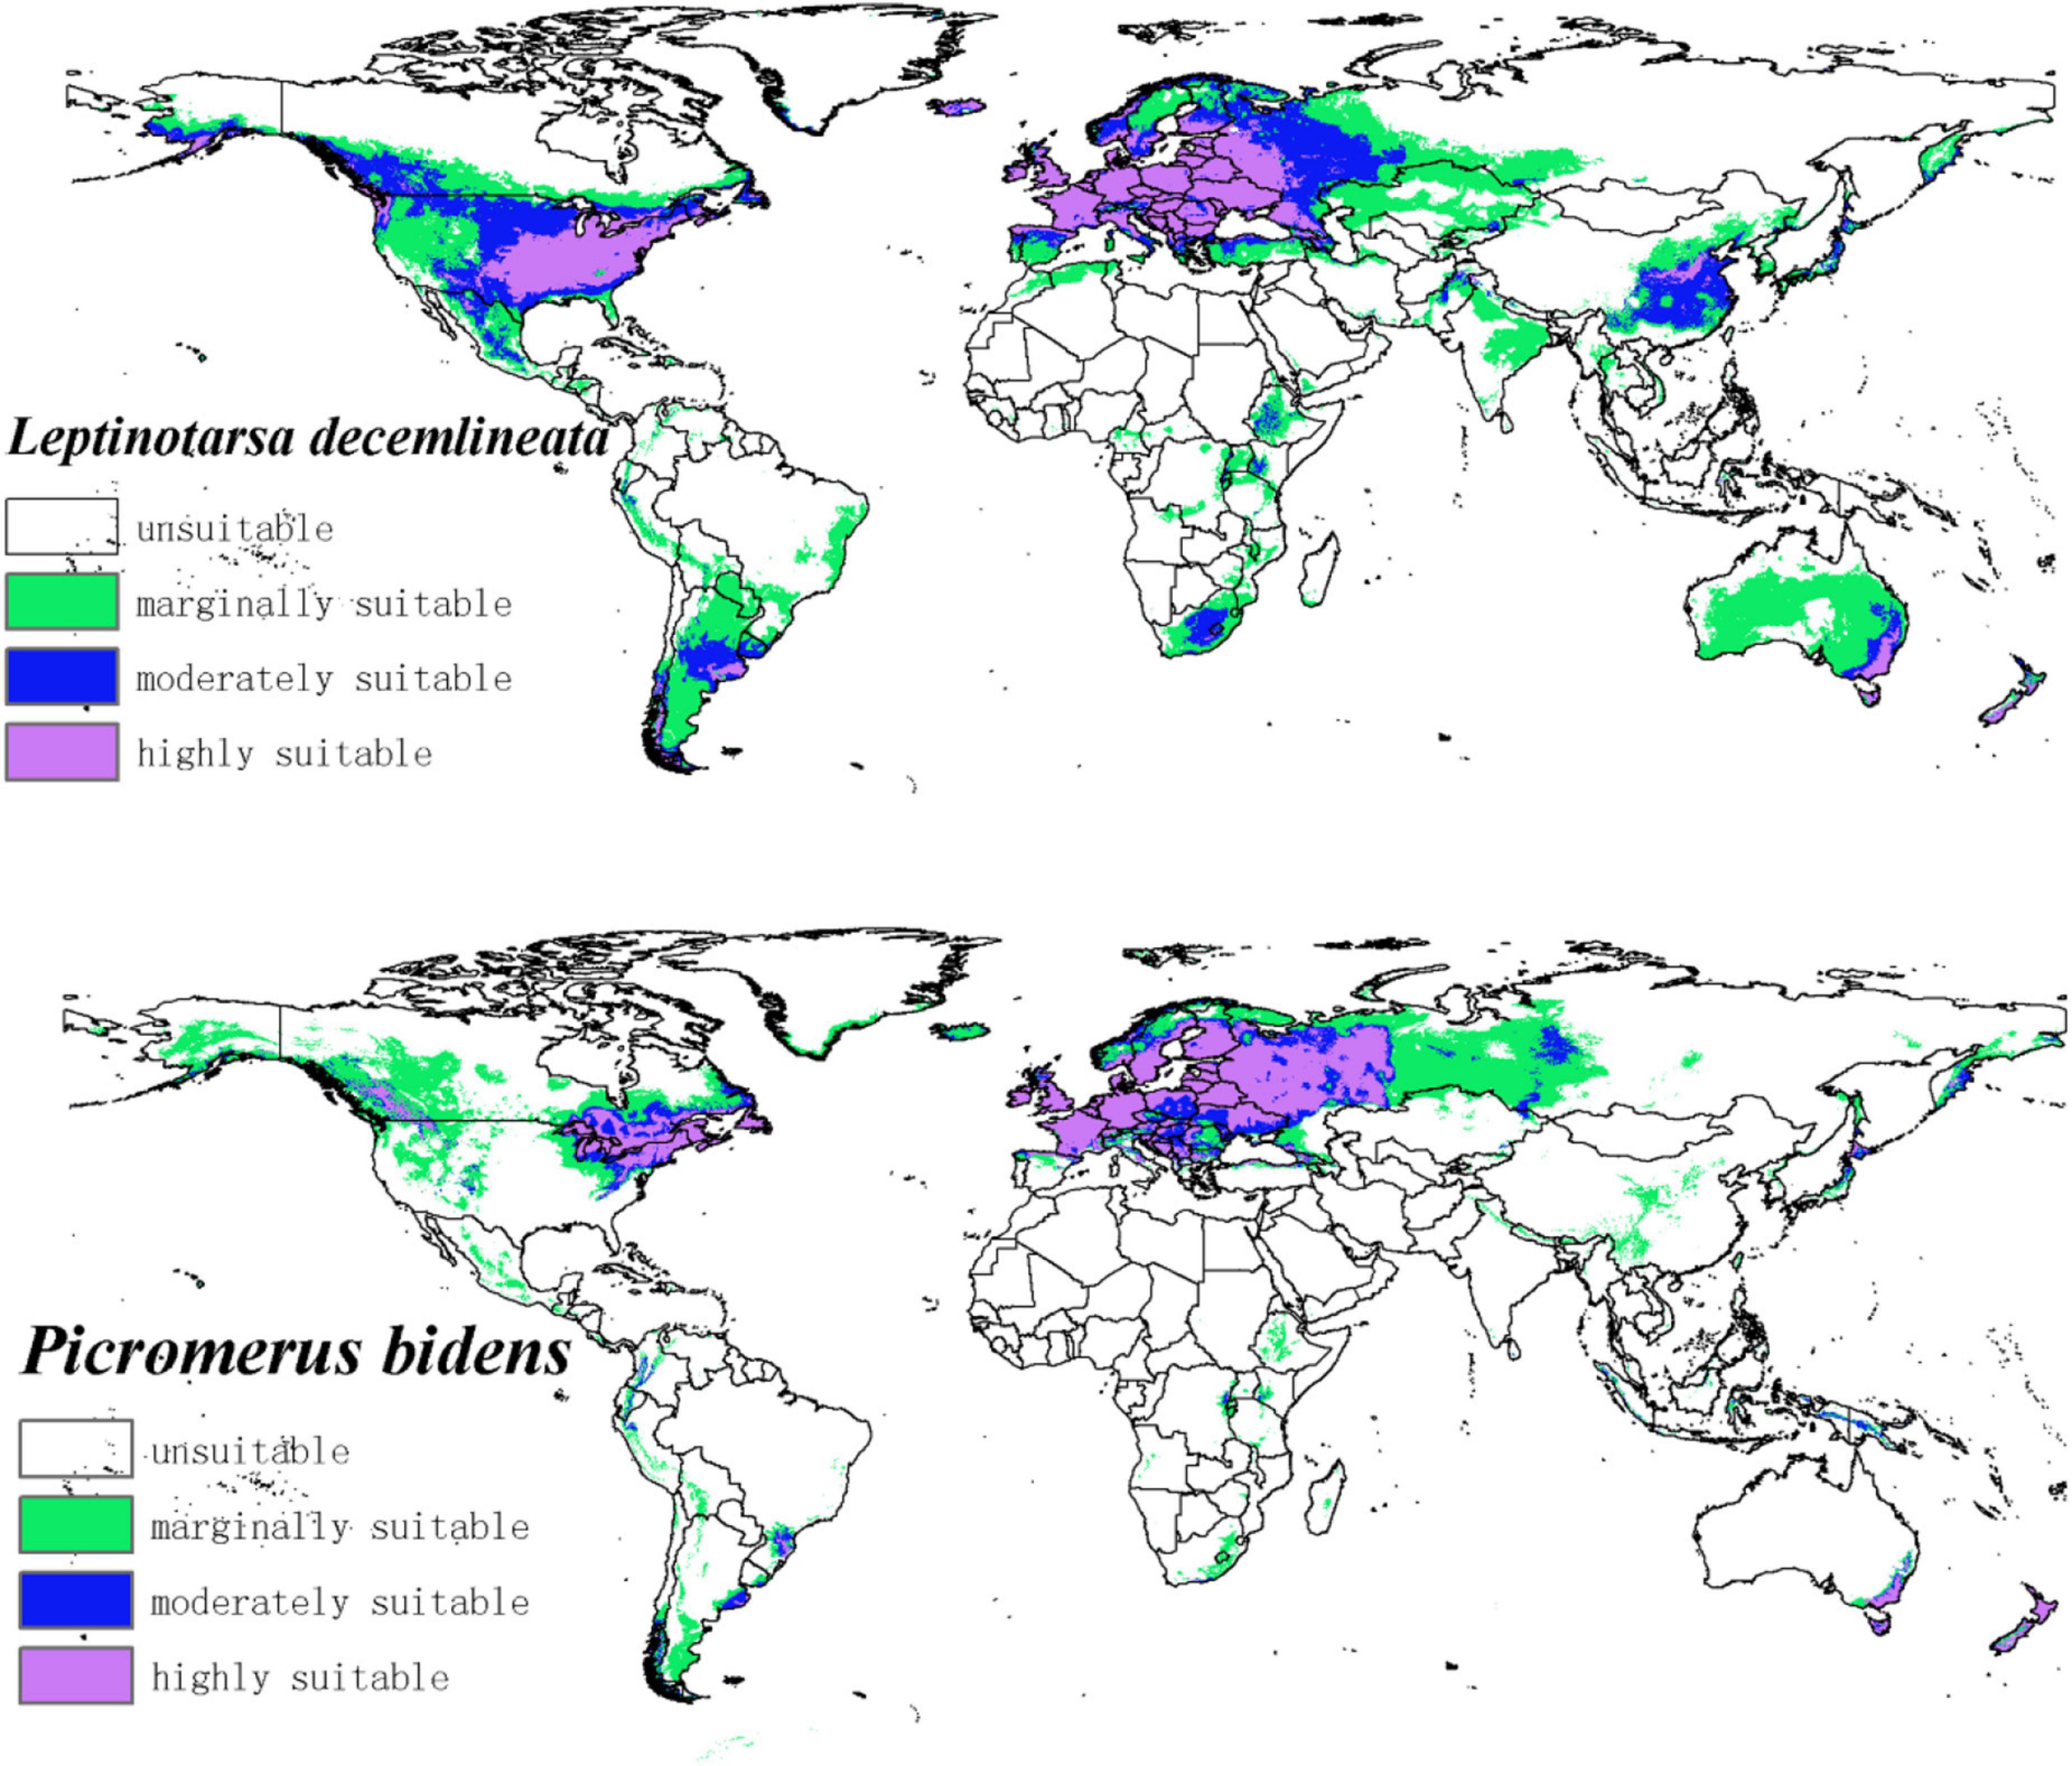
Figure 4. The potential distribution of CPB and P. bidens under current climate. The shade of color represents the level of suitability.
The suitable habitats of CPB were distributed on almost every continent in the world (Figure 4). However, the highly suitable habitats were mainly distributed in Europe, Asia, North America, and Oceania. Moderately and marginally suitable habitats were distributed across all six continents. Based on the area ratio of each suitable growth zone of CPB (Figure 5), the marginally suitable > moderately suitable > highly suitable. The areas of the marginally, moderately, and highly suitable habitats of CPB were 1,661,902, 851,519, and 729,973 km2, accounting for 18, 9, and 8%, of the study area, respectively. The suitable habitat area of CPB was thus 3,243,394 km2, accounting for 35% of the study area.

Figure 5. Area of habitats with different suitability for CPB and P. bidens under current climate.
The suitable habitats of P. bidens were mainly distributed in Eurasia and North America but scarcely in the other continents. The highly suitable habitats were primarily distributed in Europe, North America, and Oceania. Moderately suitable habitats are mainly distributed in Europe, Asia, North America, and Oceania, while the marginally suitable habitats were distributed across all the six continents. Based on the area ratio of each suitable area for P. bidens (Figure 5), the marginally suitable > highly suitable > moderately suitable. The areas of the marginally, moderately, and highly suitable habitats of P. bidens were 889,014, 304,966, 581,370 km2, accounting for 10, 3.6, and 6.8% of the study area, respectively. The suitable habitat area of P. bidens was thus 1,775,350 km2, accounting for 21% of the study area.
Changes in Future Potential Distribution
Compared to the current climate, the climate of the future suitable habitats of CPB and P. bidens will change variably in different periods (2021–2040, 2041–2060, 2061–2080, and 2081–2100) based on different climatic scenarios (SSP1-2.6, SSP2- 4.5, SSP3-7.0, and SSP5-8.5). Compared with the current suitable area, the total area of suitable growth area of CPB increased and decreased. Although the total area of the P. bidens is also increasing and decreasing, it is lower than the current suitable area (Figure 6). These changes were divided into three types: expansion, contraction, and stability (Figures 7, 8). In order to ensure the clarity of the picture, Figures 7, 8 only show the changes in the SSP126 scenario, and the changes in the rest of the scenarios are shown in Supplementary Figures 1–6. In addition, the suitable habitats areas of CPB and P. bidens were compared in this study, and the results in the current climate are shown in Figure 9. The comparison results in other scenarios are shown in Supplementary Figures 7–10.
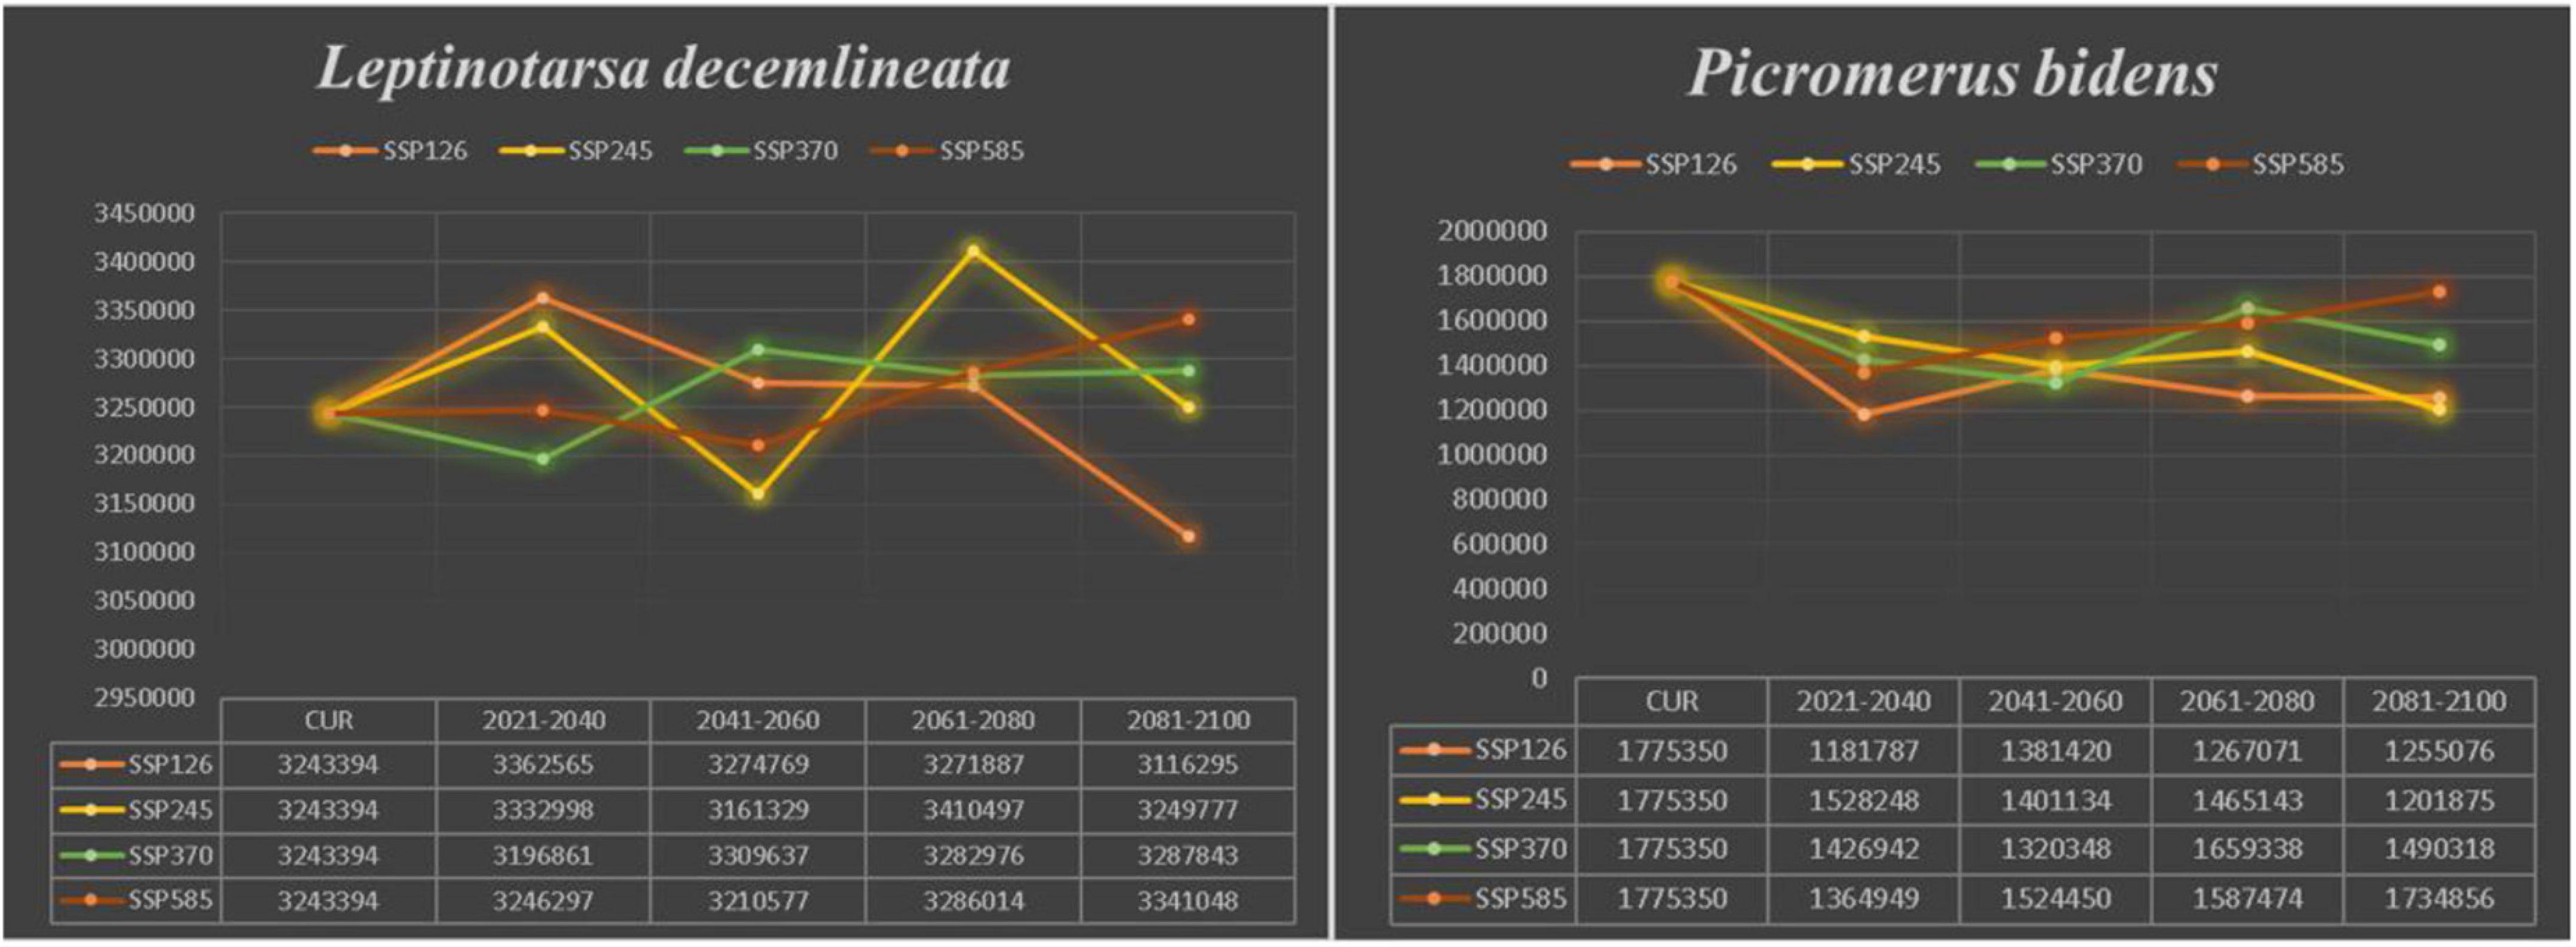
Figure 6. The trend of change in the suitable distribution area of CPB and P. bidens under future climate scenarios.
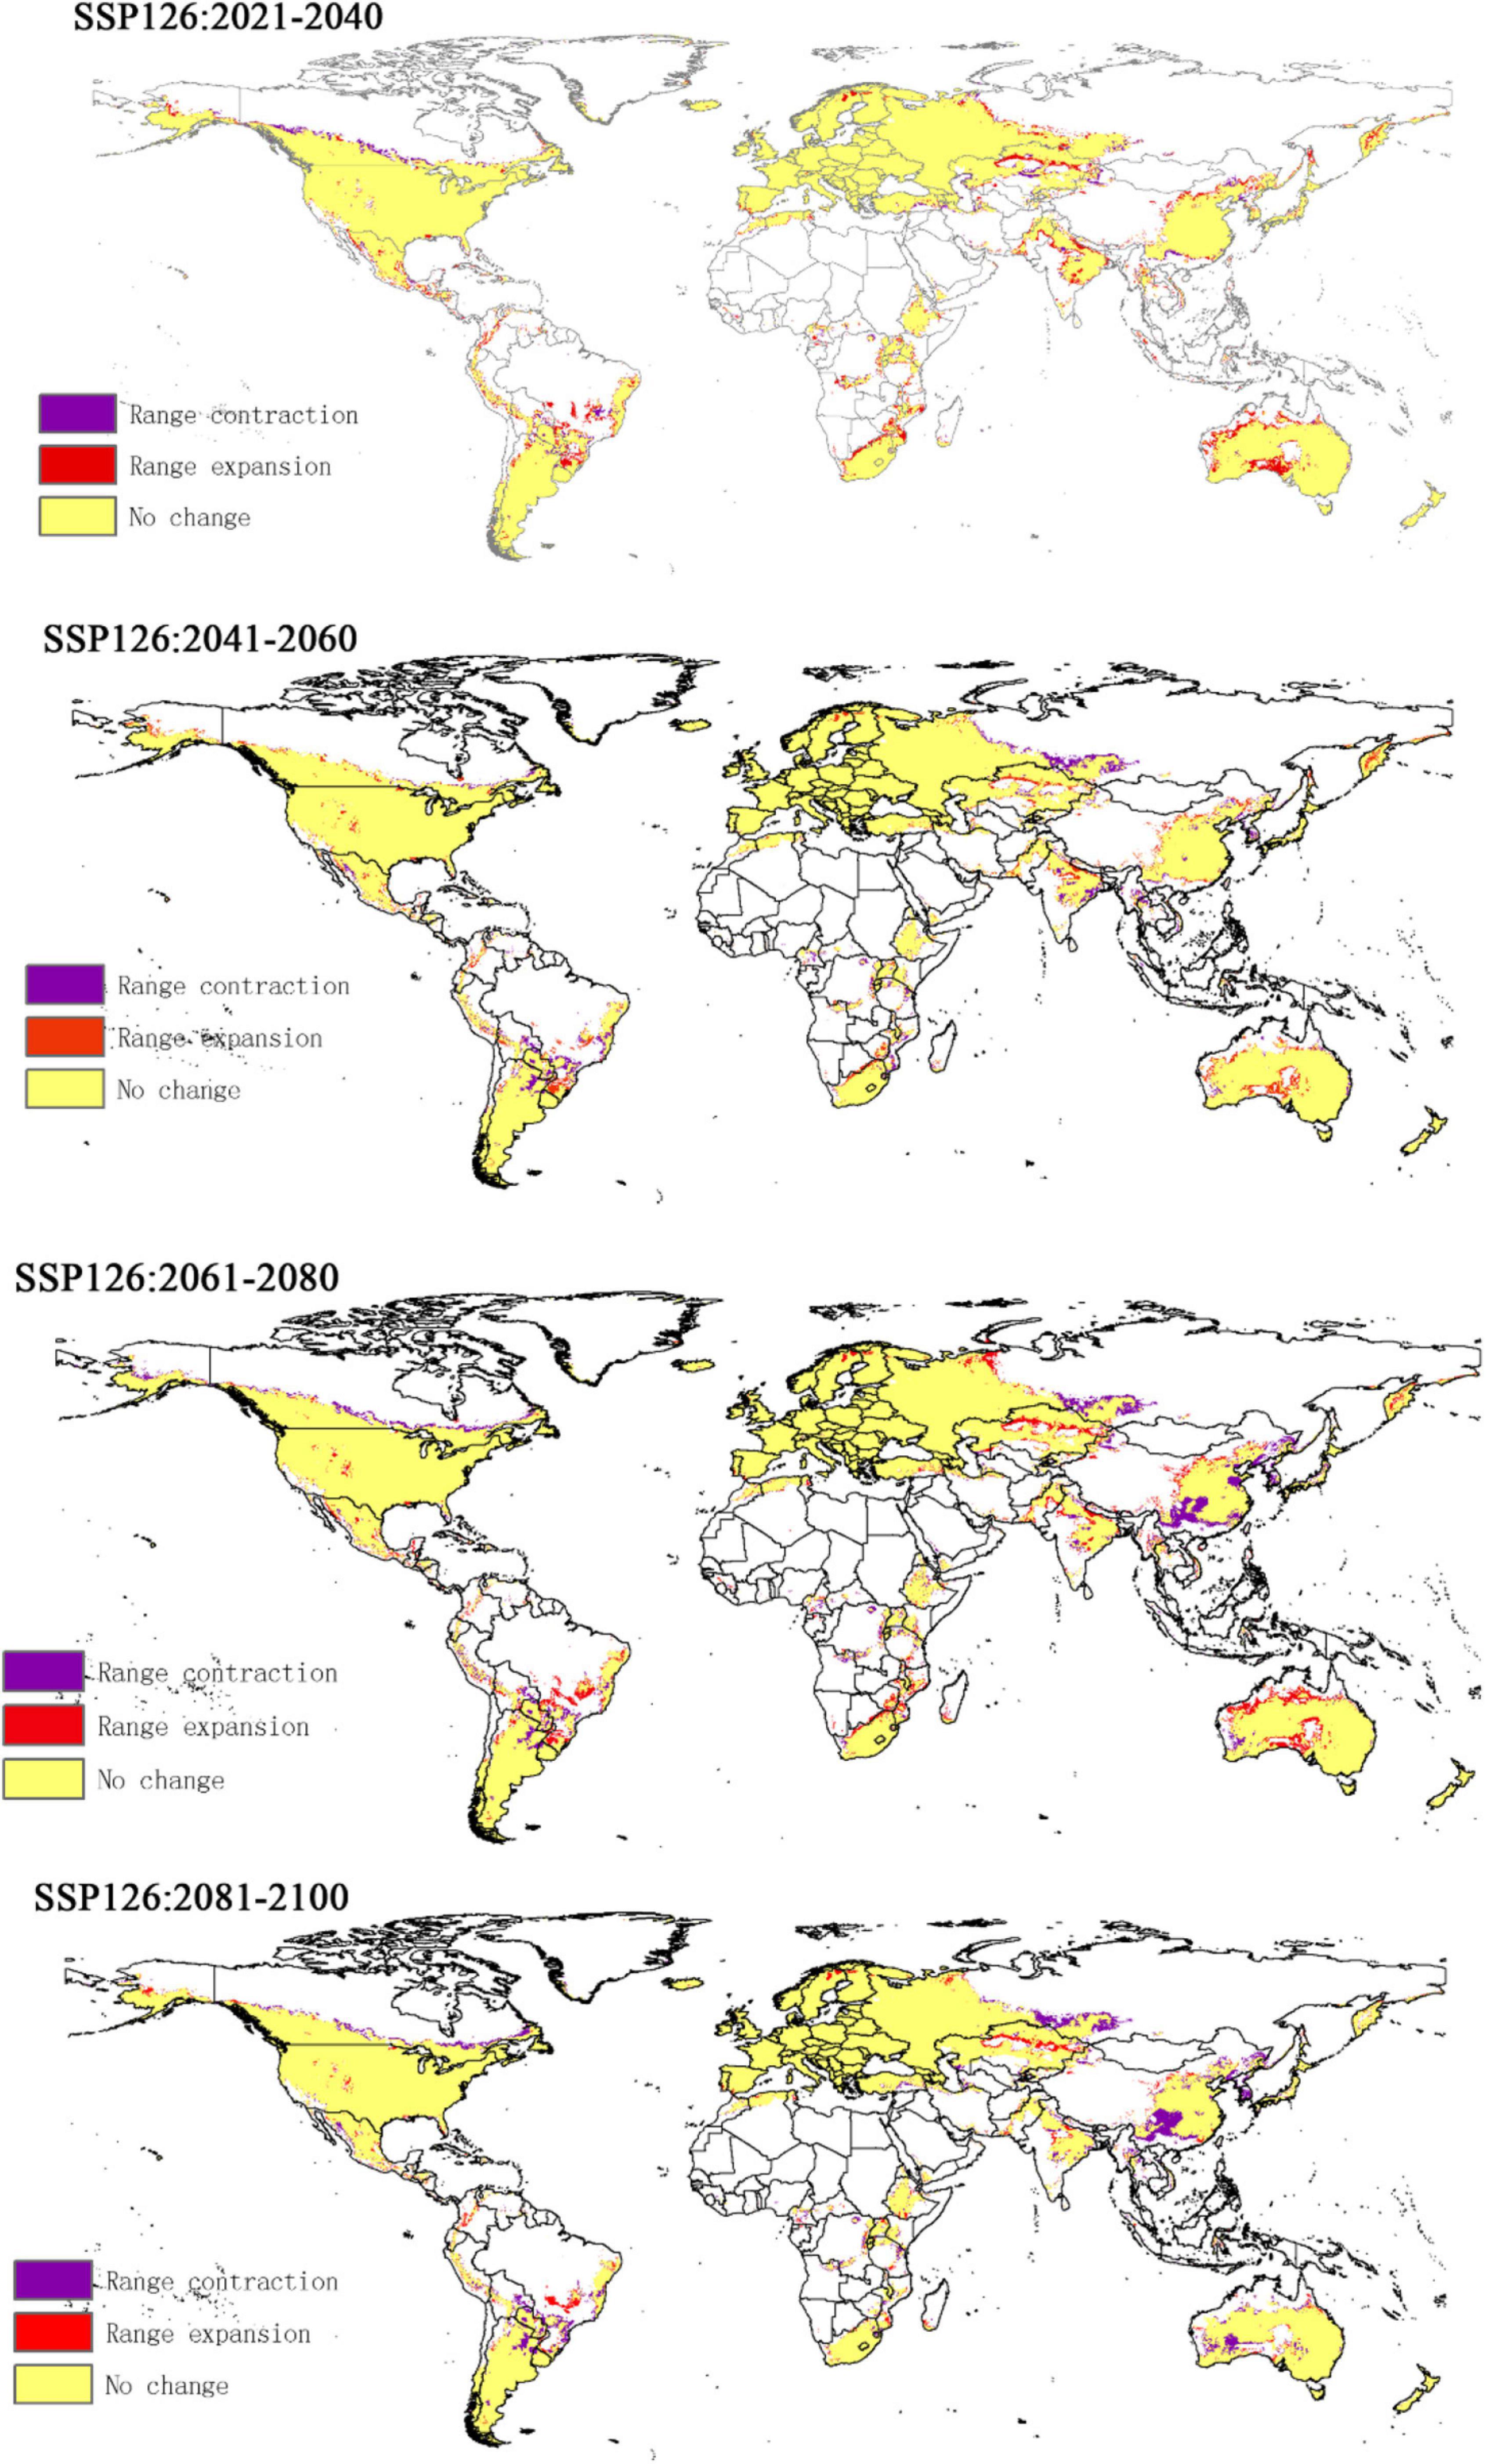
Figure 7. The change of suitable distribution area of CPB under SSP126 climate scenario.
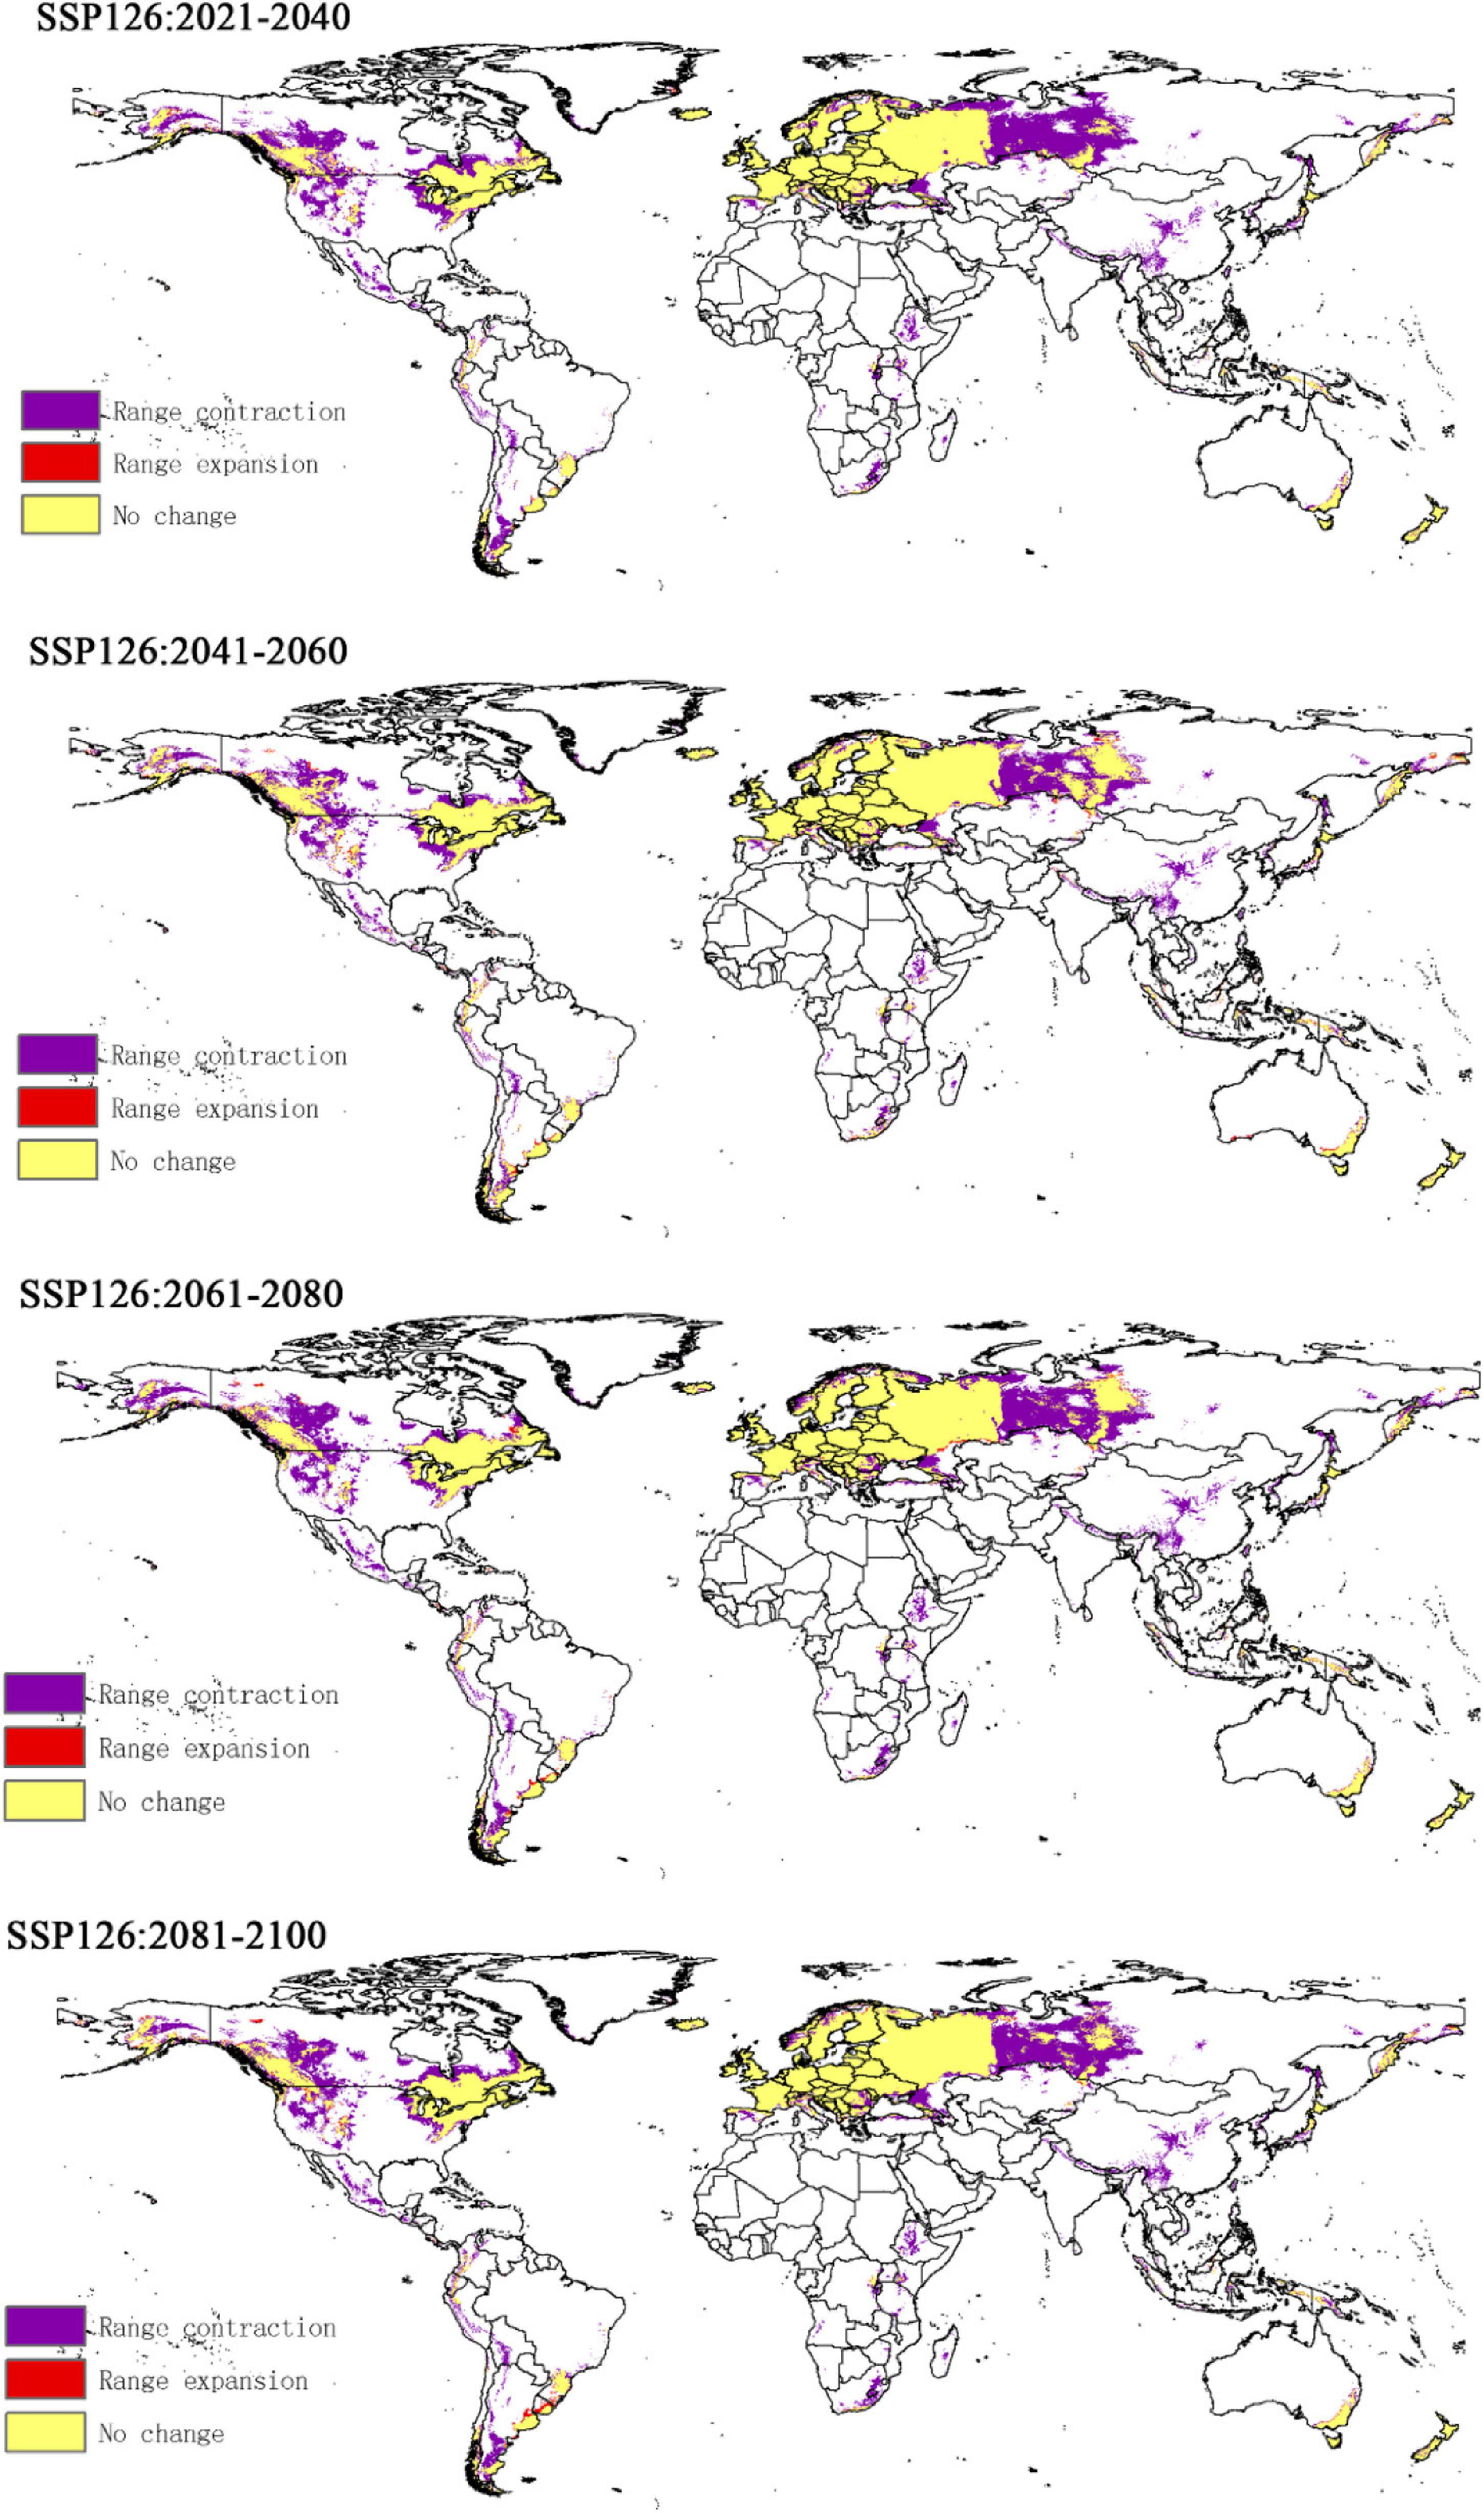
Figure 8. The change of suitable distribution area of P. bidens under SSP126 climate scenario.
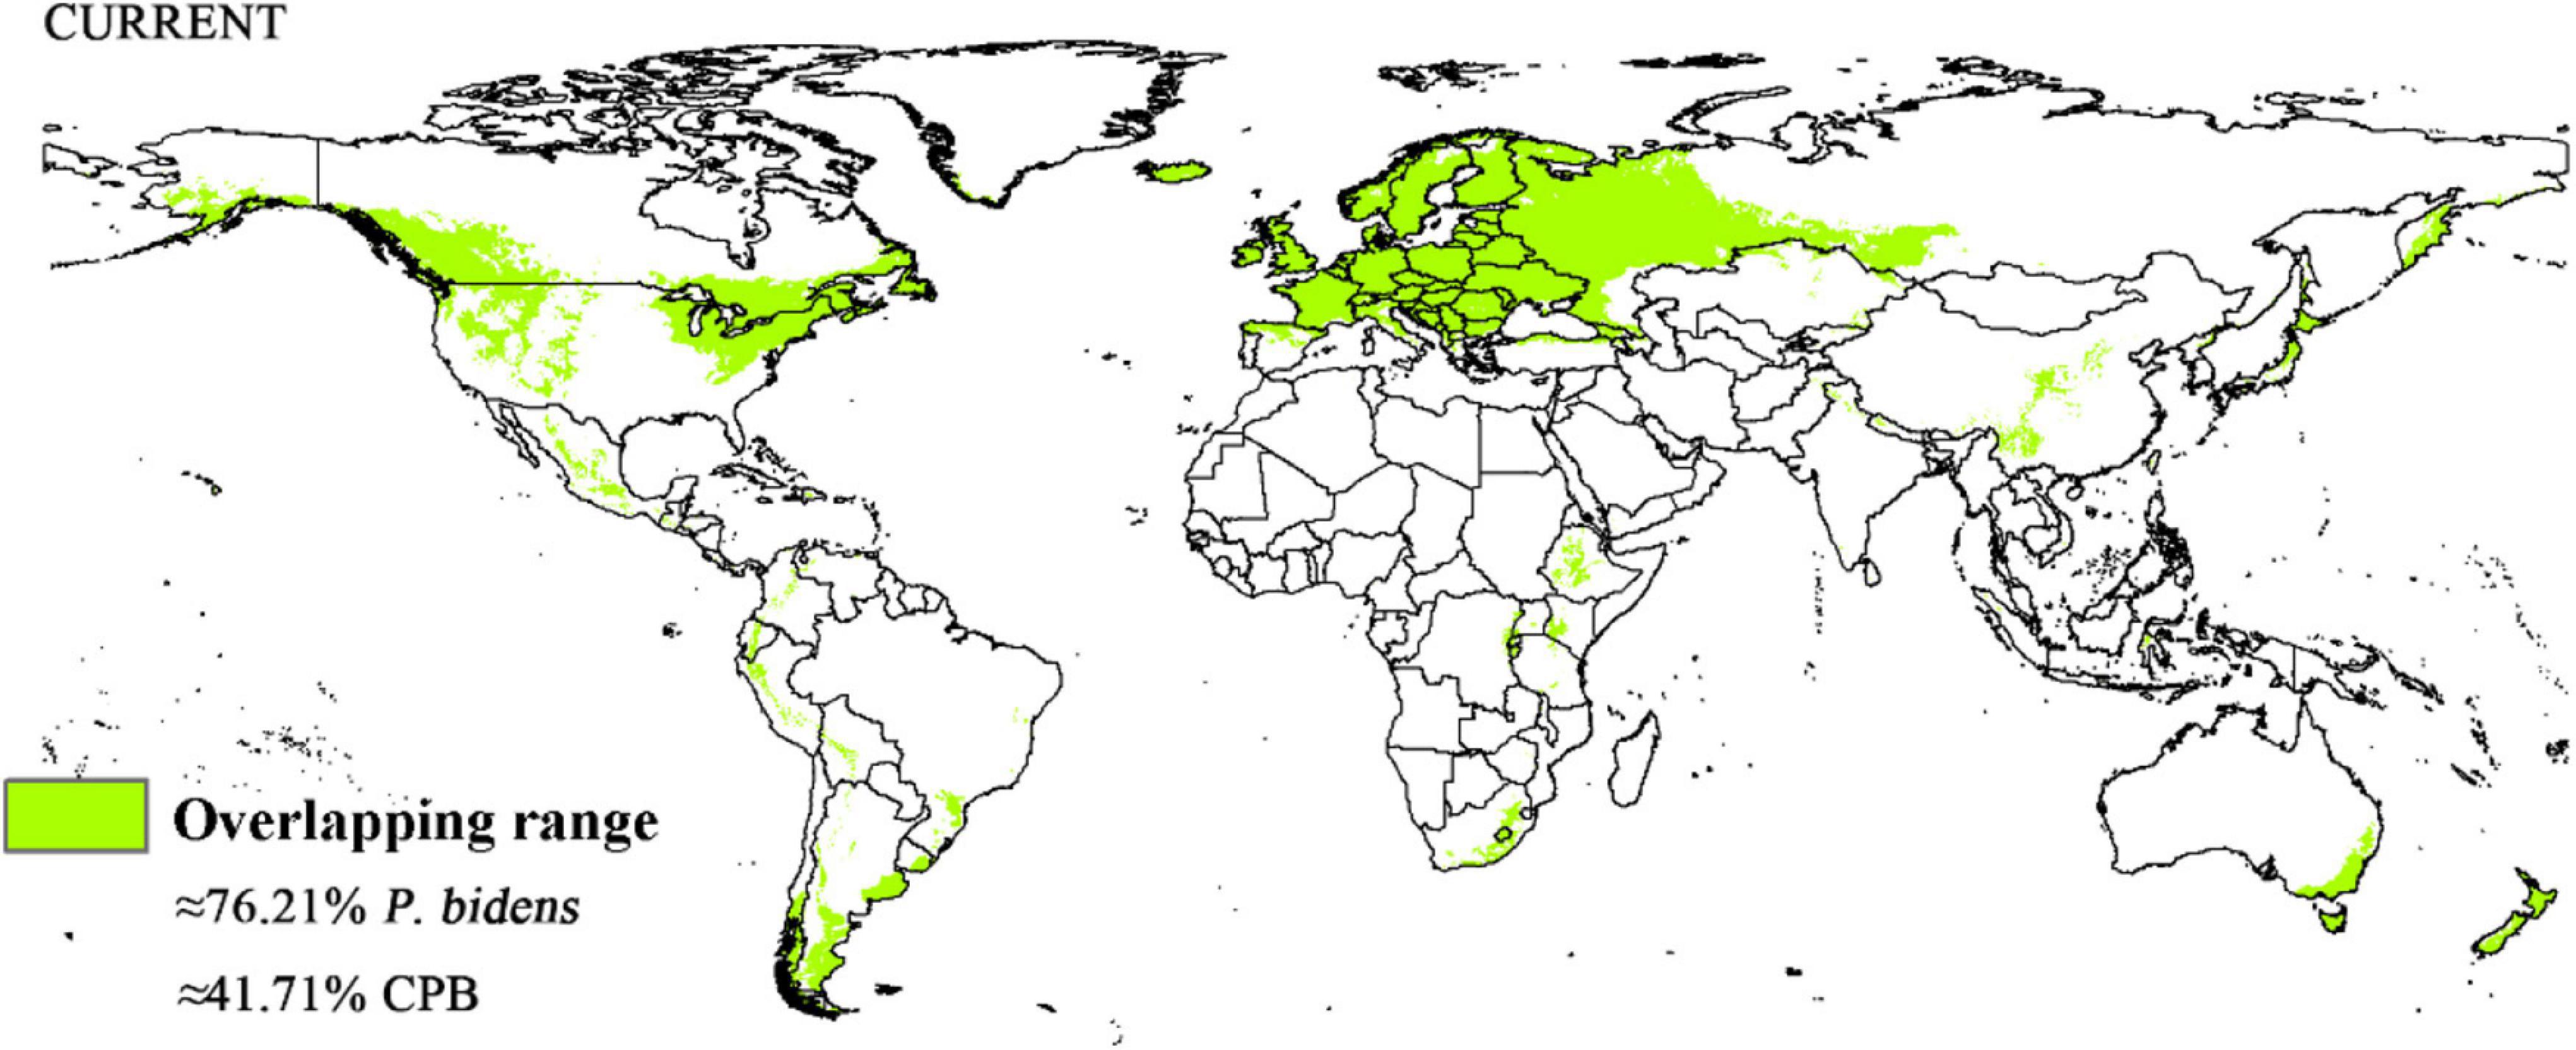
Figure 9. Overlapping range in the suitable distribution area of CPB and P. bidens in current climate.
Invasion Pathways
The intersection of the distribution points of large airports and ports with the current potential distribution map revealed the possible introduction routes of CPB and P. bidens. The current climate scenario comprised 237 large airports and 1,603 ports located in the suitable territory of CPB. There were 56 large airports and 403 ports in the marginally suitable, 47 large airports and 348 ports in the moderately suitable, and 1,603 large airports and 852 ports in the highly suitable areas (Figure 10). In the same line, there were 20 large airports and 1,025 ports in the marginally suitable, 25 large airports and 146 ports in the moderately suitable, and 65 large airports and 707 ports in the highly suitable areas for P. bidens (Figure 11).
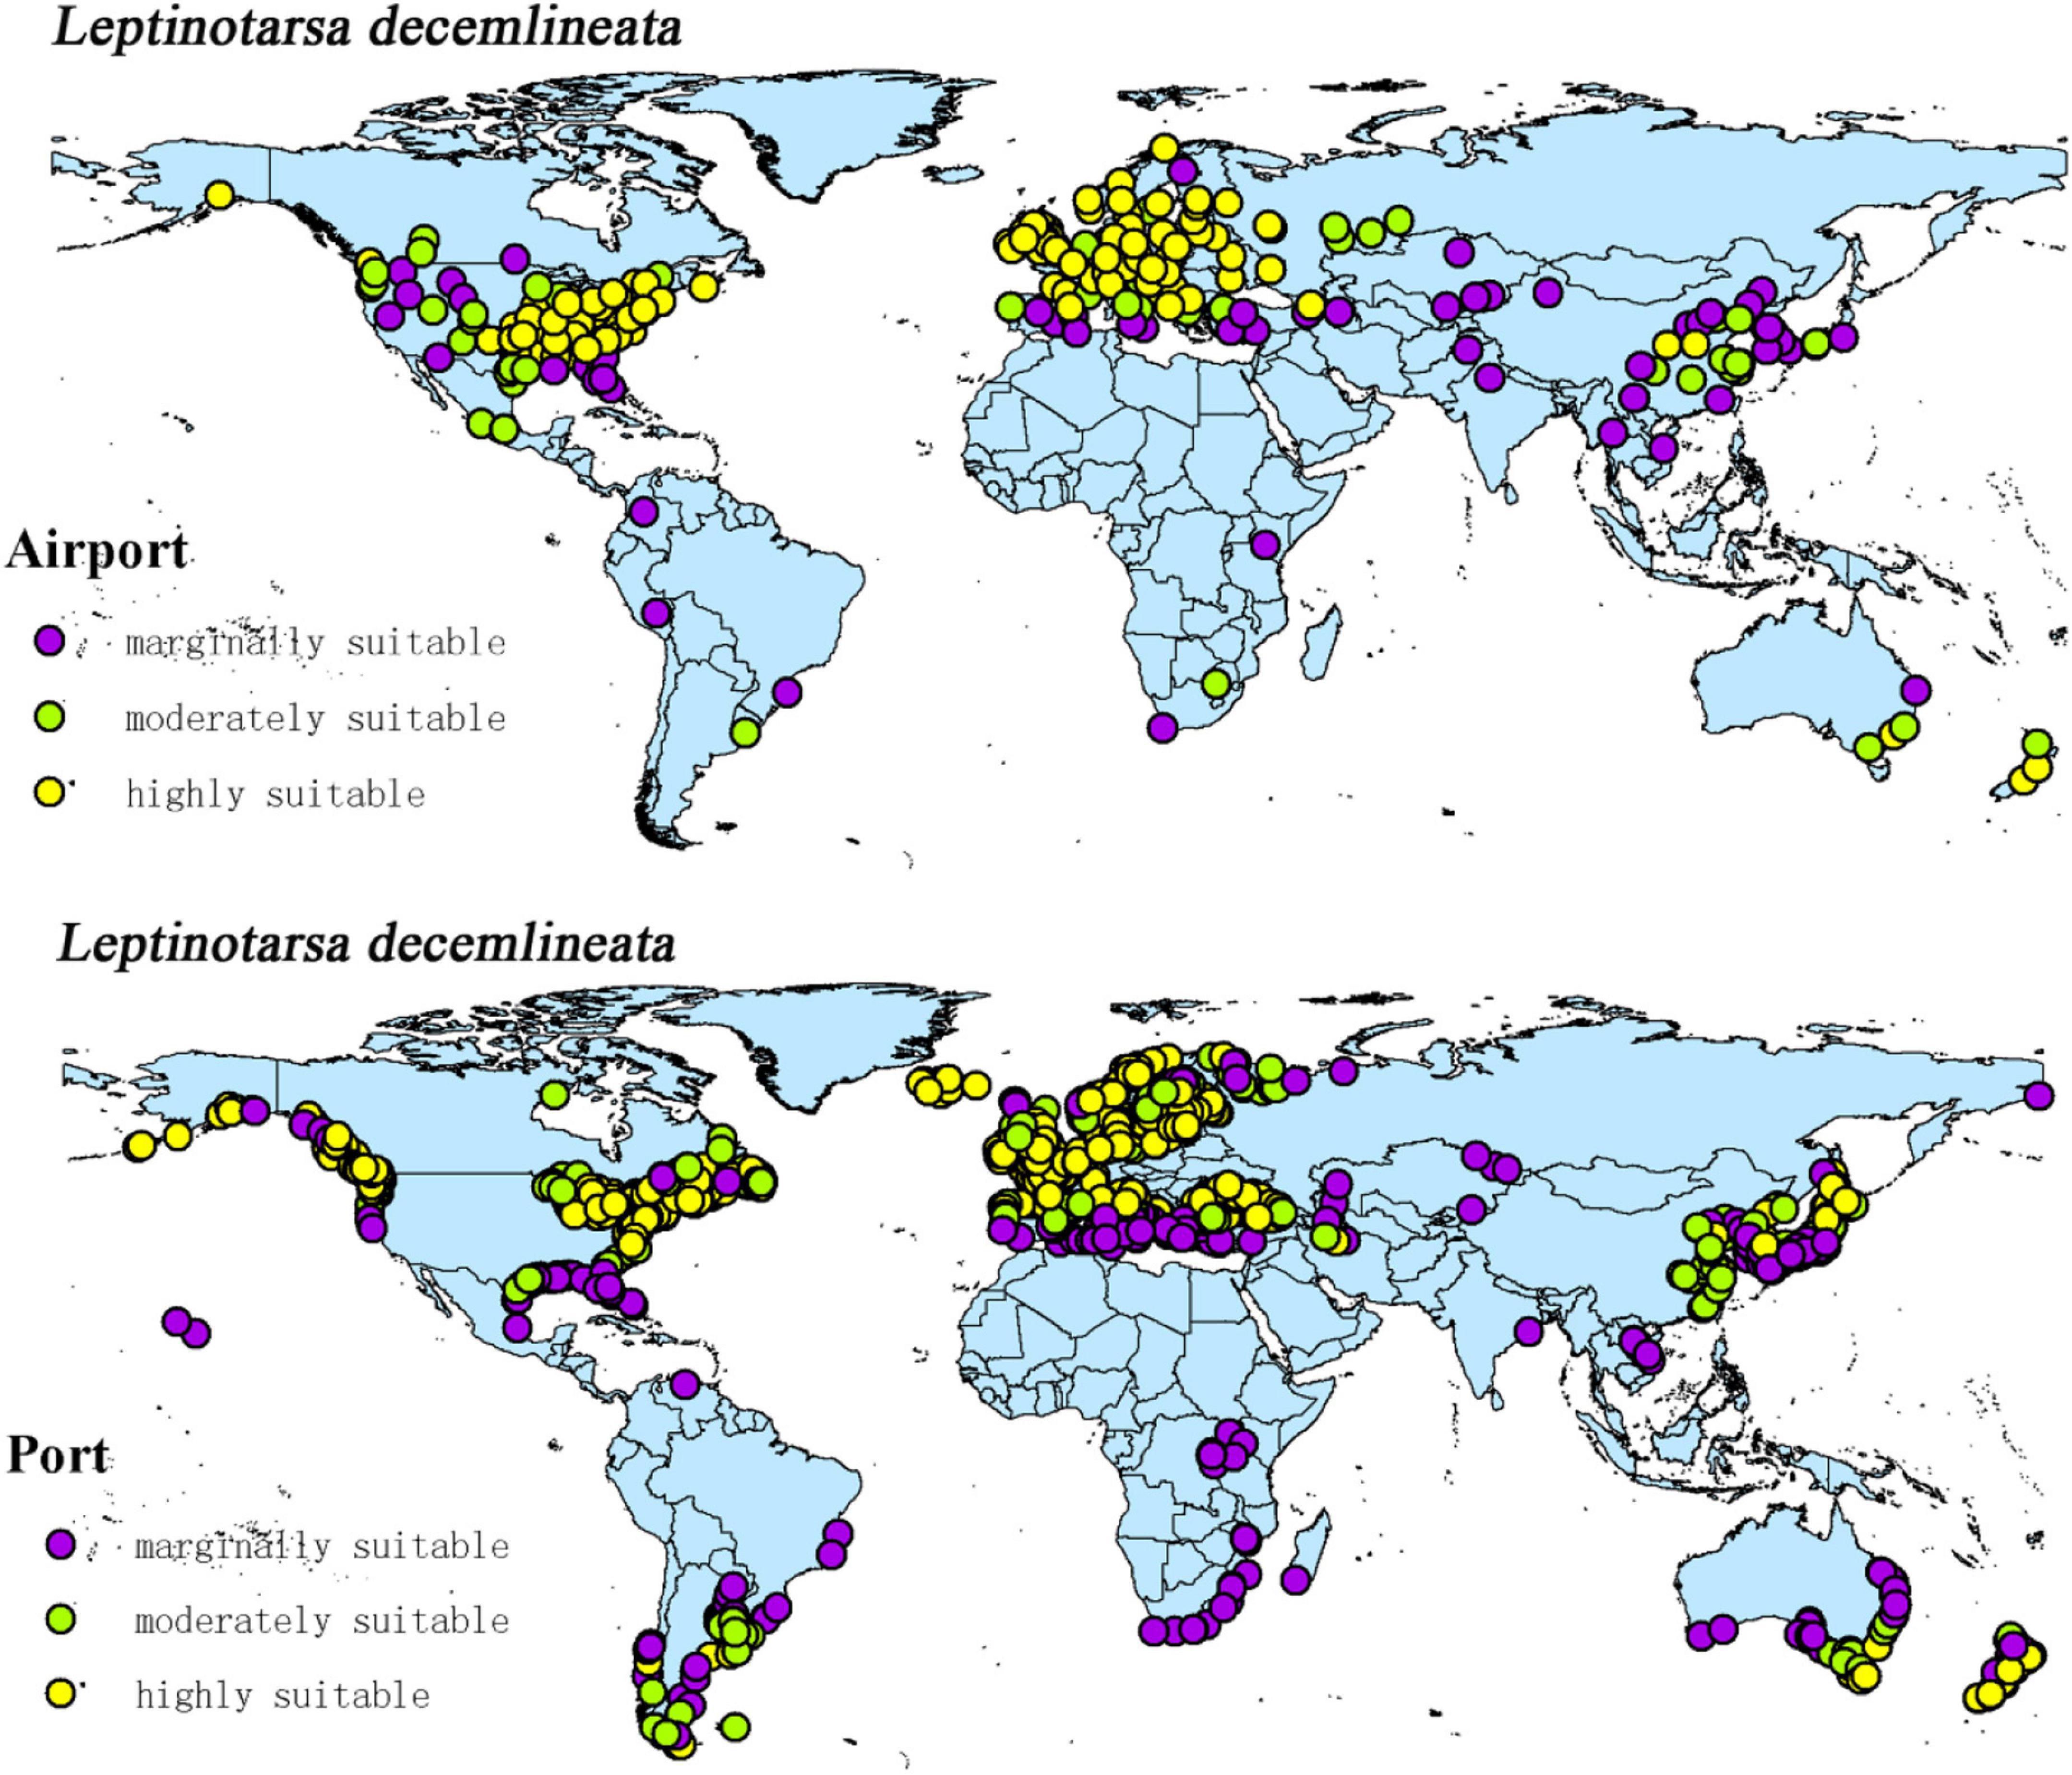
Figure 10. Global large airports and ports within the suitable of CPB.
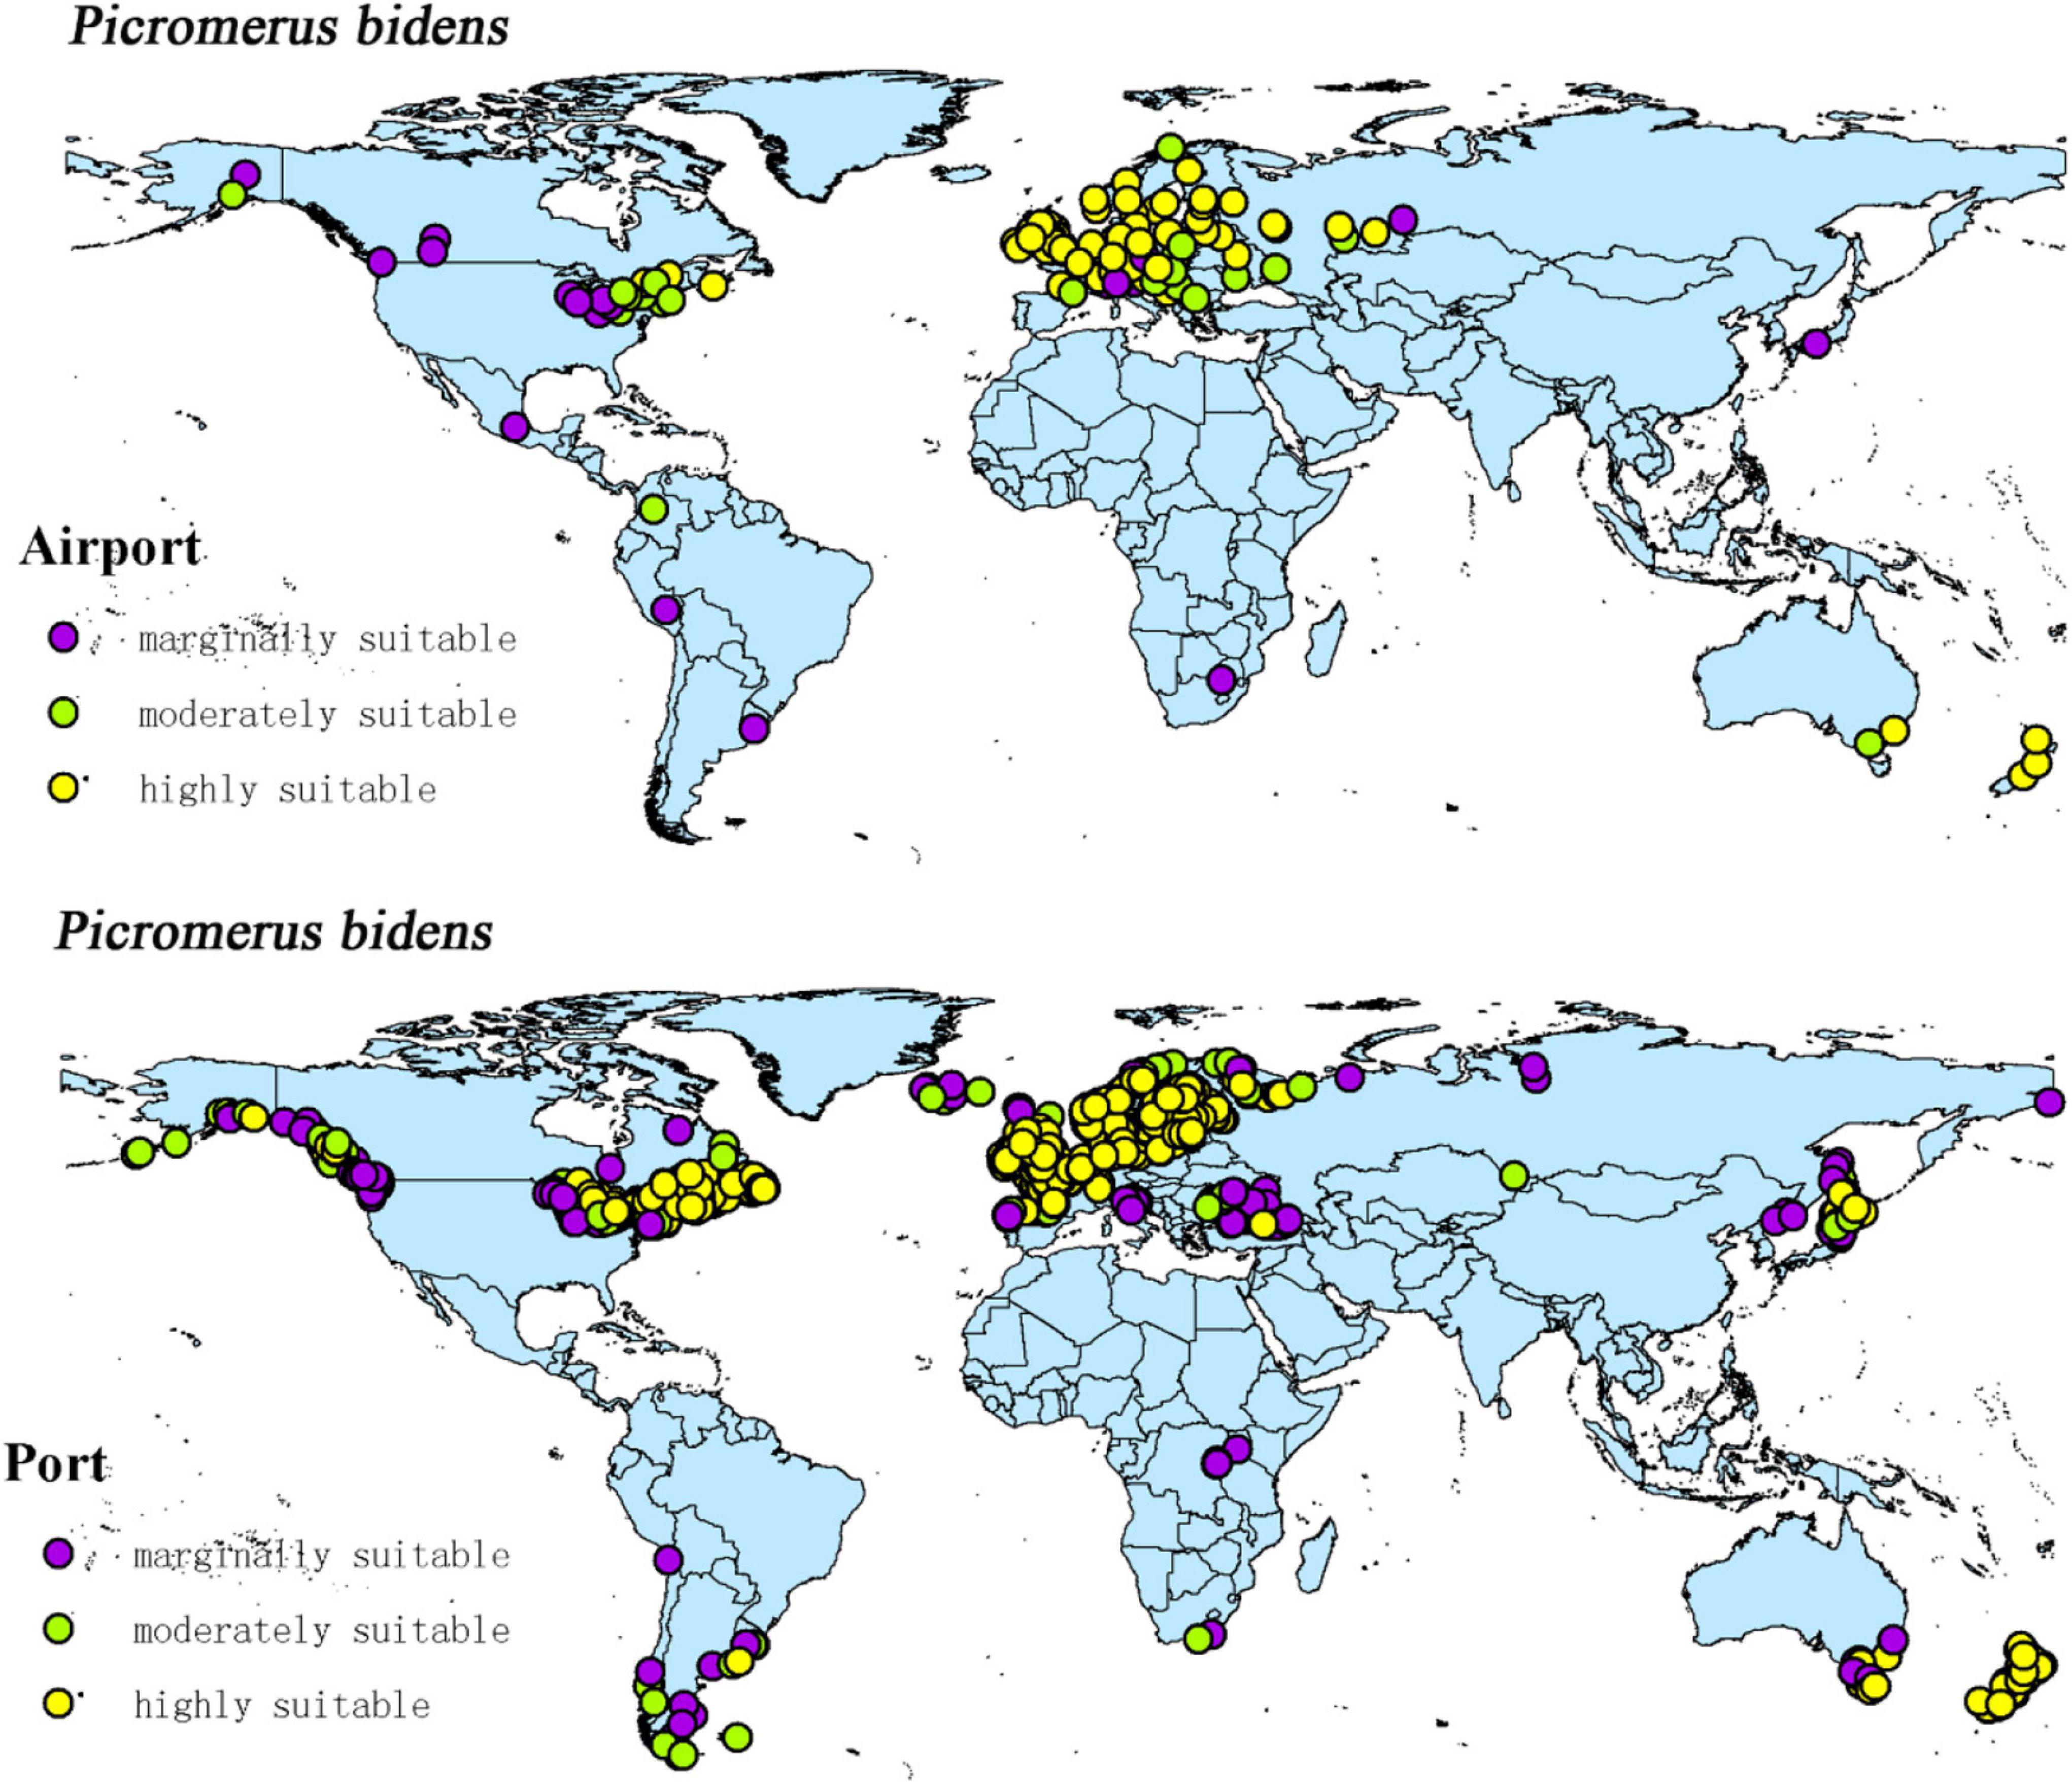
Figure 11. Global large airports and ports within the suitable of P. bidens.
Centroids Movement
Centroid is an important index that describes the spatial distribution of terrestrial classes. Centroid changes can reflect the accumulation, dispersion, and migration of terrestrial types in a historical stage (Warren and Seifert, 2011).
Figure 12 shows the centroid movements of CPB and P. bidens under different climatic backgrounds. The centroid of the current potential distribution area of CPB was 6.369°, 29.062°, while that of P. bidens was 0.97°, 45.038°. Notably, the centroid migration directions of CPB and P. bidens differed under different climatic backgrounds.
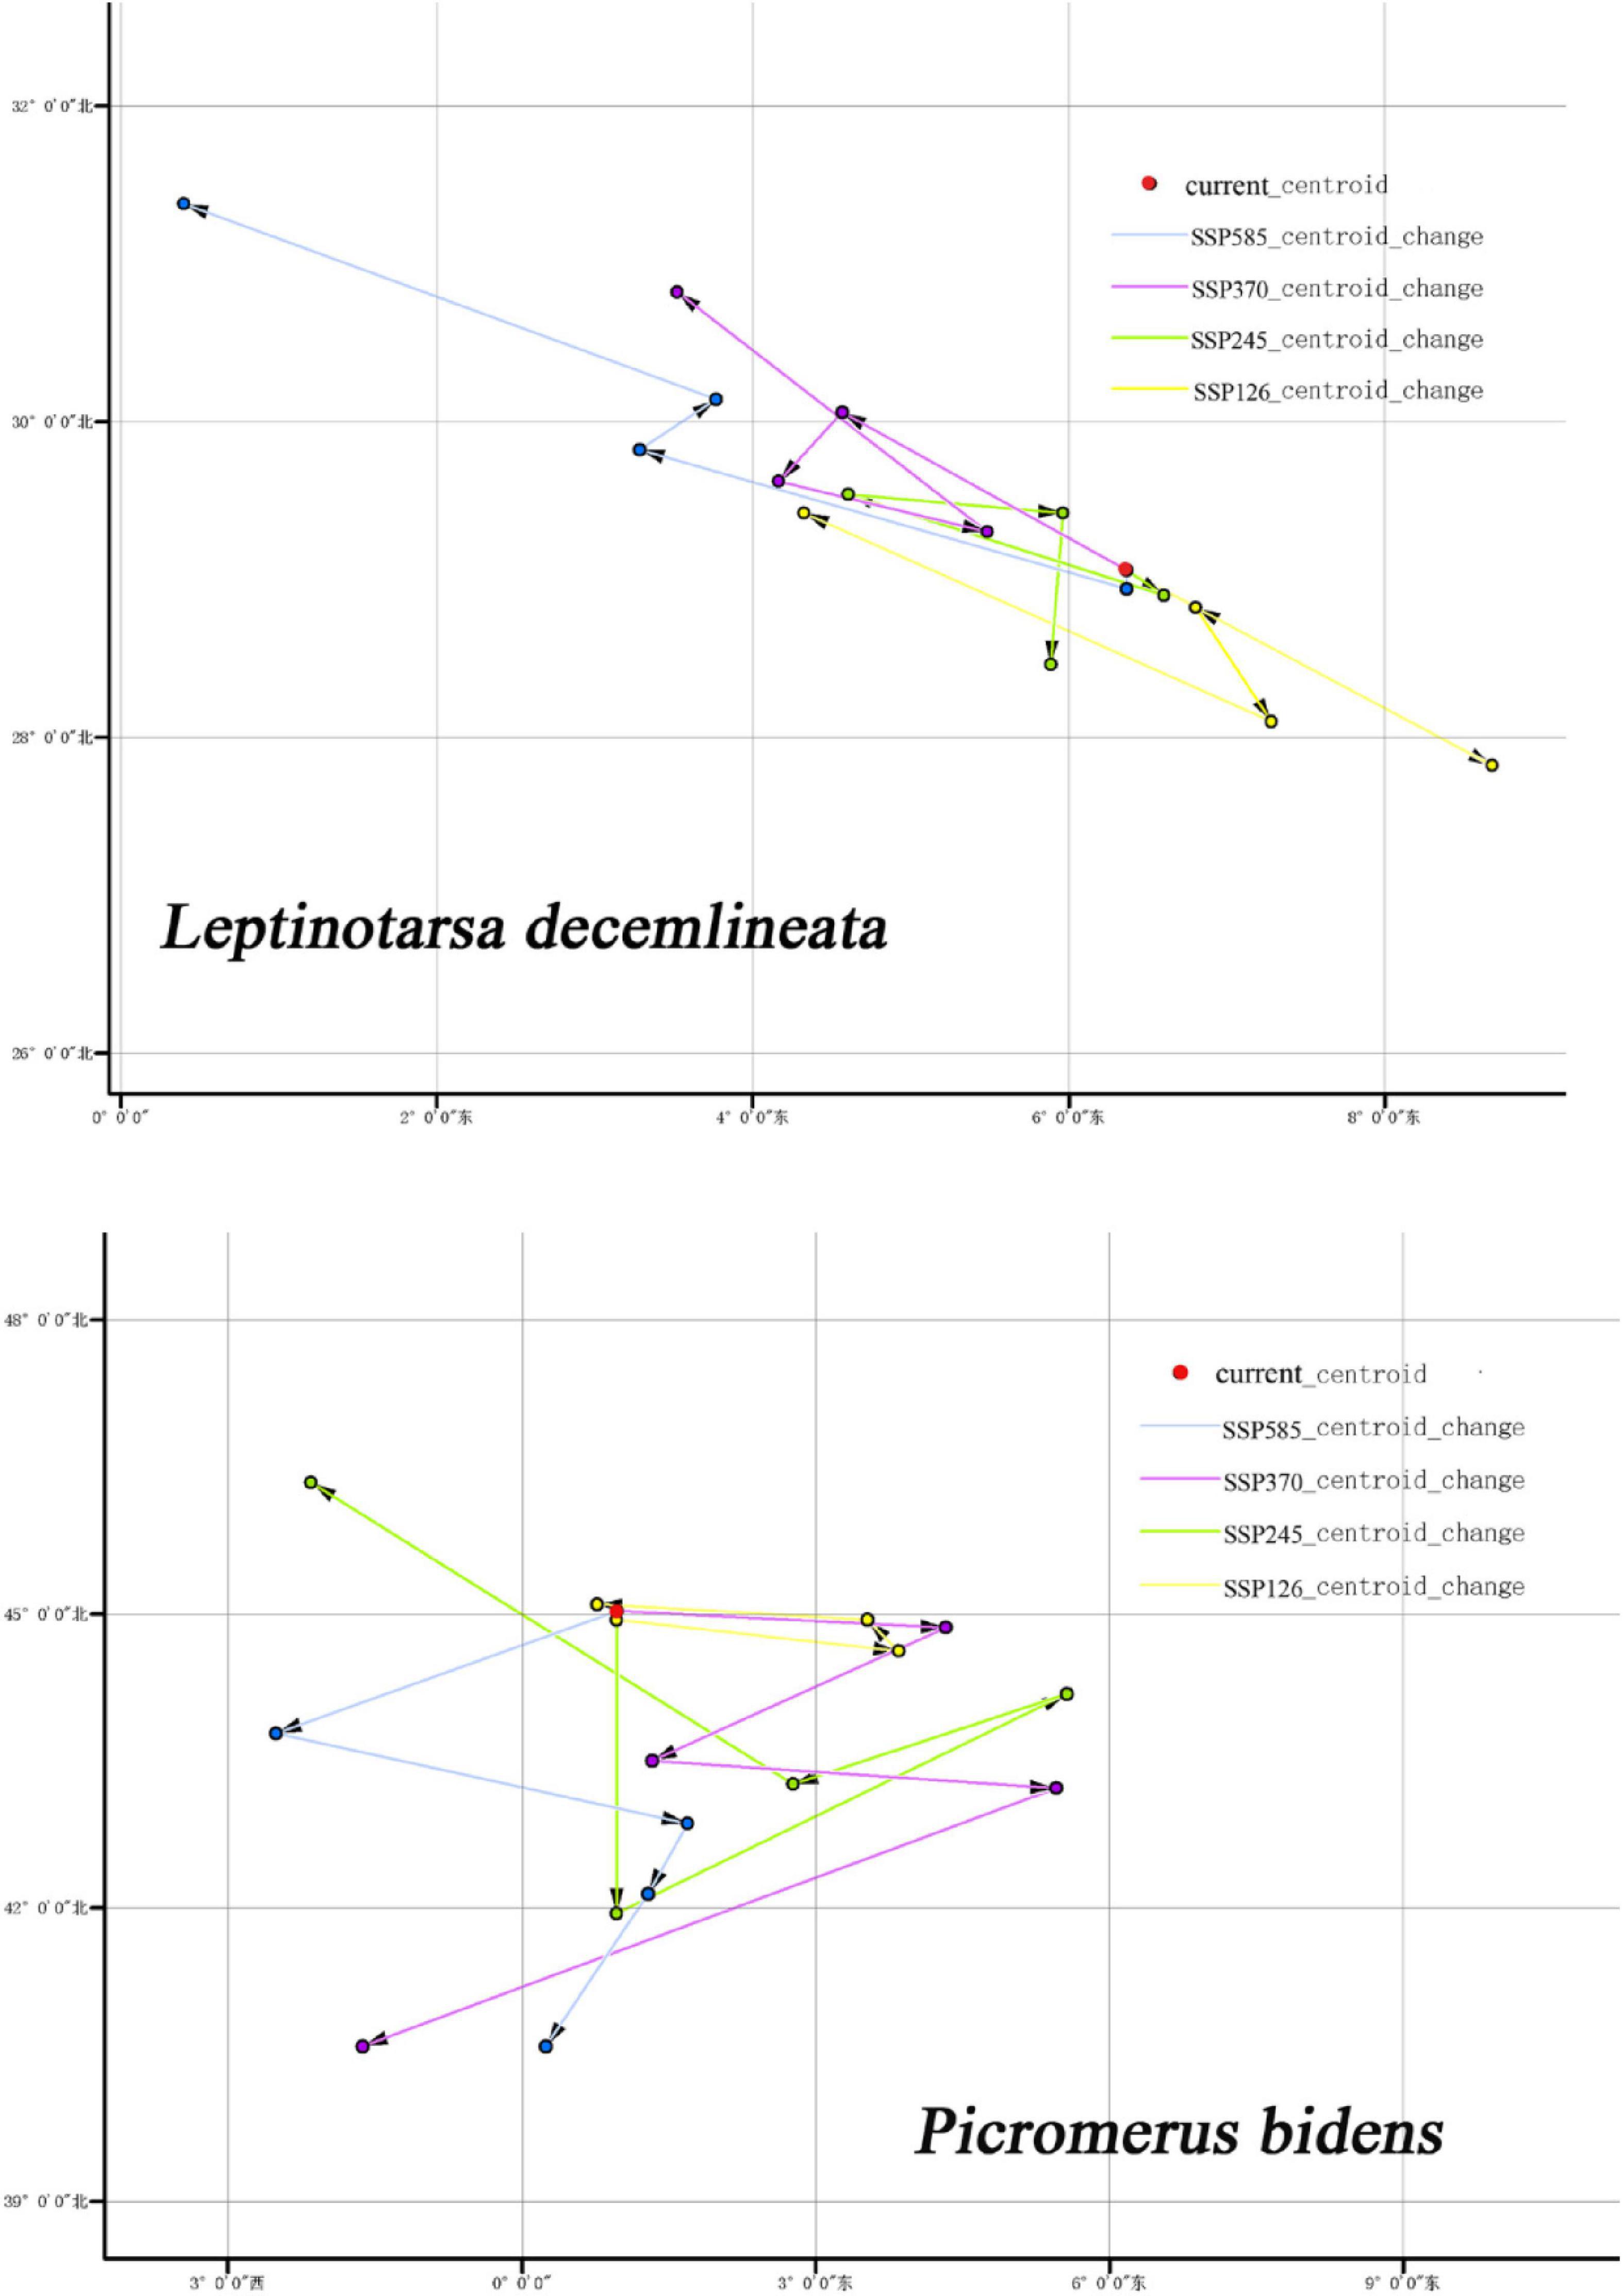
Figure 12. Centroids movement of CPB and P. bidens in suitable distribution area under future climate scenarios.
Discussion
Colorado potato beetle, a worldwide quarantine pest (Wang et al., 2011; Hou et al., 2020), has invaded many countries and regions (Wang, 2018). P. bidens is a kind of polyphagous insect, which can prey on many kinds of pests such as CPB and can be used to control CPB (Mahdian et al., 2006; Tang, 2020). Therefore, predicting the potential distribution areas of CPB and P. bidens can facilitate the monitoring, early warning and control of CPB all over the world. This study predicted the potential distribution areas of CPB and P. bidens and their changes under different climatic scenarios using the MaxEnt model based on their distribution data and environmental variables. Their possible introduction routes were subsequently predicted by combining the distribution points of the large airports and ports. The AUC of the MaxEnt model was more than 0.8 (Figure 3), demonstrating good performance in predicting the potential distribution area of CPB and P. bidens.
CPB was distributed in six continents except Antarctica based on the prediction of the current potential distribution of CPB. Europe, North America, the southeast coastal areas of Oceania, and Oakland as the primary highly suitable areas. The middle and low suitable growth areas are distributed in almost six continents, including South America and Oceania (Figure 4). According to the records so far, CPB is distributed in Europe, Asia, and North America between 15 and 55°N in the American continent and 33 and 60°N in Eurasia. It is also distributed in many regions in northern Africa (Guo et al., 2014; Wang, 2018). Notably, the modeling results are consistent with the actual distribution of CPB in Europe and North America. Although South America and Oceania have not found the distribution of CPB at present, as the suitable growth area of CPB, we should focus on preventing and controlling the invasion of CPB. Moreover, strict precautions should be taken in large airports and ports because they are the primary introduction routes (Figure 10). The current distribution prediction of P. bidens suggested that it is mainly distributed in the southeast coastal areas of Eurasia, North America and Oceania, and Oakland (Figure 4). After comparing the suitable growth areas of P. bidens and CPB, it was found that under the current climatic conditions, the overlap accounted for 76.21% of the suitable growing areas of P. bidens (Figure 9). In the future climate, the overlap reaches more than 80% of the suitable growth area of the P. bidens (Supplementary Figures 7–10). Therefore, according to the range of suitable growth area of P. bidens (Figure 9), we can judge whether P. bidens can be introduced into the area where CPB is seriously harmful. At the same time, combined with the predicted introduction path (Figure 11) and suitable growth area (Figure 9), the introduction path and release location of P. bidens can be determined to achieve the maximum effect of controlling CPB.
It has been reported that climate change will lead to the expansion, transfer or contraction of the distribution of species, which will greatly affect the distribution of species (Biber-Freudenberger et al., 2016; Wei et al., 2018, 2020). The results of this study show that the change in the suitable growth areas of CPB from 2021 to 2100 under different climate scenarios was very small and mostly insignificant, accounting for 0.31–0.34 of the study areas. The expansion area accounted for 0.01–0.05 of the study areas, while the contraction area accounted for 0.01–0.04. The area change of the total suitable growth area is shown in Figure 7. Under the climatic scenario of ssp126, the suitable habitat area of CPB showed a decreasing trend from 2021 to 2100, but it increased compared with the current suitable habitat area before 2080, and decreased only during the period of 2081–2100. Under the climatic scenario of ssp245, the suitable habitat area of potato beetle was only from 2041 to 2060, which decreased compared with the current suitable habitat, and increased at other times. Under the climatic scenario of ssp370, it showed an increasing trend from 2021 to 2100, but from 2021 to 2040, the suitable habitat area of potato beetle decreased compared with the current suitable habitat area, and increased compared with the current suitable habitat area after 2040. In the ssp585 climate scenario, there was little change in 2021–2040, only a slight increase, a small decrease in 2041–2060, and a growing trend in 2061–2100.
This phenomenon was attributed to the strong adaptability of CPB, which has made it a globally invasive pest (Wang, 2018). But that doesn’t mean the CPB has stopped its expansion. According to the forecast, most of the suitable areas of CPB have not been invaded by CPB, such as South America, Oceania and the Central Plains of China. These areas still need to focus on monitoring, prevention and control on possible path of introduction.
The predicted distribution areas of P. bidens showed a decrease under different climatic scenarios, with a significantly larger shrinking area (purple part) than that of CPB (Figures 7, 8). The expansion area accounted for 0.001–0.03, the contraction area accounted for 0.05–0.09, while the unchanged area accounted for 0.12–0.15 of the study areas. The area change of the total suitable growth area is shown in Figure 7. Under the climatic scenario of ssp126, the suitable habitat area decreased sharply from 2021 to 2040, increased from 2041 to 2060, and decreased slightly from 2061 to 2100. Under the climatic scenario of ssp245, it showed a downward trend from 2021 to 2060, and increased slightly from 2061 to 2080, but after 2081, it showed a downward trend. Under the climate scenario of ssp370, the trend is roughly the same as that of ssp245; under the climate scenario of ssp585, it shows an increasing trend from 2041 to 2100, but the area of suitable habitat is still decreasing compared with the current one.
These findings suggest that global warming will reduce the suitable areas of P. bidens. P. bidens is a predatory insect that can be used as a natural enemy to control pests belonging to the orders Coleoptera, Lepidoptera, and Hymenoptera (Mahdian et al., 2006; Tang, 2020). A reduction of its suitable habitats may cause a decrease in its population density, leading to a lack of effective and timely prevention and control of invasive pests. Active measures should thus be enacted to minimize global warming and protect biodiversity.
The centroid movement is drawn as a vector, which represents the size and direction of the movement in the predicted distribution range (Hannah et al., 2019). Centroid movement can reflect the spatial variation of the distribution of eco-environmental vulnerability index in the study area (Luck and Wu, 2002). In this study, the centroid of the potential distribution area of CPB migrated to the northwest and southeast between 2021 and 2100. However, the migration range was not large, indicating that climate change had insignificant effects on CPB during the period. In contrast, the centroid of the potential distribution area of P. bidens migrated westward under different climatic scenarios. The migration range was smallest in the SSP126 scenario between 2021 and 2040 and largest in the SSP370 scenario between 2081 and 2100. This phenomenon may be attributed to the decrease of forest area under the SSP370 climate scenario.
Conclusion
Invasive insect species, such as CPB, are a major threat to the ecosystem functions and indigenous biodiversity globally. Their invasion is strengthened by climate change and economic globalization. Notably, they have natural enemies, such as P. bidens, which can control them. This study provides a current prediction of the potential distribution areas of CPB and its natural enemy P. bidens. Further, it analyzes the diffusion dynamics of their suitable areas under different future climate change scenarios. It also highlights the airports and ports as the primary introduction routes of CPB and P. bidens by intersecting their positions with the binary potential distribution map. This study provides a theoretical basis and data support for early warning, monitoring, and control of the CPB spread.
Data Availability Statement
The original contributions presented in the study are included in the article/Supplementary Material, further inquiries can be directed to the corresponding author/s.
Author Contributions
JW, QZ, and HZ contributed conception and design of the study and funding. XG conducted analysis and wrote the first draft of the manuscript. All authors contributed to manuscript revision and read and approved the submitted version.
Funding
This study was supported by the National Natural Science Foundation of China (31872272) and Research Project Supported by Shanxi Scholarship Council of China (2020-064, 2020-065).
Conflict of Interest
The authors declare that the research was conducted in the absence of any commercial or financial relationships that could be construed as a potential conflict of interest.
Publisher’s Note
All claims expressed in this article are solely those of the authors and do not necessarily represent those of their affiliated organizations, or those of the publisher, the editors and the reviewers. Any product that may be evaluated in this article, or claim that may be made by its manufacturer, is not guaranteed or endorsed by the publisher.
Acknowledgments
We are grateful for the comments of the two reviewers that helped improve the manuscript.
Supplementary Material
The Supplementary Material for this article can be found online at: https://www.frontiersin.org/articles/10.3389/fevo.2021.786436/full#supplementary-material
References
Ahmad, I., and Önder, F. (1990). A revision of the genus Picromerus Amyot and Serville (Hemiptera: Pentatomidae: Pentatominae: Asopini) from western Palaearctic with description of two new species from Turkey. Türk. Entomol. Dergis. 14, 75–84.
Biber-Freudenberger, L., Ziemacki, J., Tonnang, H. E., and Borgemeister, C. (2016). Future risks of pest species under changing climatic conditions. PLoS One 11:e0153237. doi: 10.1371/journal.pone.0153237
Caprio, M. A. (1987). Flight Initiation Behavior and Host Plant Attraction in the Colorado Potato Beetle, Leptinotarsa decemlineata (Say) (Coleoptera: Chrysomelidae). Fargo, ND: Department of Entomology.
Casagrande, R. A. (1985). The “Iowa” potato beetle, its discovery and spread to potatoes. Bull. Entomol. Soc. Am. 31, 27–29. doi: 10.1093/besa/31.2.27
Casagrande, R. A. (2014). The Colorado potato beetle: 125 years of mismanagement. Bull. Entomol. Soc. Am. 33, 142–150. doi: 10.1093/besa/33.3.142
Cianferoni, M. P. F., and Dioli, A. F. P. (2019). Predation by nymphs of Picromerus bidens (Heteroptera Pentatomidae Asopinae) on caterpillars of Euphydryas aurinia provincialis (Lepidoptera Nymphalidae) in Italy. J. Zool. 102, 89–94. doi: 10.19263/redia-102.19.13
Čokl, A., Žunič, A., and Virant-Doberlet, M. (2011). Predatory bug Picromerus bidens communicates at different frequency levels. Open Life Sci. 6, 431–439. doi: 10.2478/s11535-011-0015-y
Cutler, G. C., Tolman, J. H., Scott-Dupree, C. D., and Harris, C. R. (2005). Resistance potential of Colorado potato beetle (Coleoptera: Chrysomelidae) to novaluron. J. Econ. Entomol. 98, 1685–1693. doi: 10.1093/jee/98.5.1685
De Clercq, P. (2000). “Predaceous stinkbugs (Pentatomidae: Asopinae),” in Heteroptera of Economic Importance, eds C. W. Schaefer and A. R. Panizzi (New York, NY: CRC Press), 759–812. doi: 10.1201/9781420041859-34
Elith, J., Graham, H. C., Anderson, P. R., Dudík, M., Ferrier, S., Guisan, A., et al. (2006). Novel methods improve prediction of species’ distributions from occurrence data. Ecography 29, 129–151. doi: 10.1111/j.2006.0906-7590.04596.x
Elith, J., Phillips, S. J., Hastie, T., Dudík, M., Chee, Y. E., and Yates, C. J. (2011). A statistical explanation of MaxEnt for ecologists. Divers. Distribut. 17, 43–57. doi: 10.1111/j.1472-4642.2010.00725.x
Fan, S., Chen, C., Zhao, Q., Wei, J., and Zhang, H. (2020). Identifying potentially climatic suitability areas for Arma custos (Hemiptera: Pentatomidae) in China under climate change. Insects 11:674. doi: 10.3390/insects11100674
Ganyukova, A. I., Frolov, A. O., Malysheva, M. N., Spodareva, V. V., Yurchenko, V., and Kostygov, A. Y. (2020). A novel endosymbiont-containing trypanosomatid Phytomonas borealis sp. n. from the predatory bug Picromerus bidens (Heteroptera: Pentatomidae). Folia Parasitol. 67, 1–8. doi: 10.14411/fp.2020.004
GBIF (2020). Free and Open Access to Biodiversity Data. Available online at: https://www.gbif.org/ (accessed October 25, 2020)
Guo, W., Xu, J., Liu, J., He, J., Li, J., Ma, D., et al. (2010). Research on the identification of Colorado potato beetle & its distribution dispersal and damage in Xinjiang. Xinjiang Agric. Sci. 47, 906–909.
Guo, W. C., Tuerxun, C. D., Tan, W. Z., Zhang, Z. K., Li, G. Q., Jiang, W. H., et al. (2014). Main progress on biology & ecology of Colorado potato beetle and countermeasures of its monitoring and controlling in China. Plant Protect. 40, 1–11. doi: 10.1016/s0079-6107(01)00005-0
Hannah, L., Aguilar, G., and Blanchon, D. (2019). Spatial distribution of the Mexican daisy, Erigeron karvinskianus, in New Zealand under climate change. Climate 7:24. doi: 10.3390/cli7020024
Hare, J. D. (1990). Ecology and management of the Colorado potato beetle. Annu. Rev. Entomol. 35, 81–100. doi: 10.1146/annurev.en.35.010190.000501
Hou, Q., Bai, H., Li, Y., and Yu, C. (2020). Suitable area of Leptinotarsa decemlineata (Coleoptera: Chrysomelidae) in China. Chin. J. Ecol. 39, 3311–3319.
HWSD (2008). Harmonized World Soil Database. Available online at: http://www.fao.org/soils (accessed January 10, 2021)
Jacques, R. L. J. (1985). The potato beetles of Florida (Coleoptera: Chrysomelidae). Entomol. Circ. 271, 1–2.
Kong, W. Y., Li, X. H., and Zou, H. F. (2019). Optimizing MaxEnt model in the prediction of species distribution. Ying yong sheng tai xue bao. J. Appl. Ecol. 30, 2116–2128.
Larivière, M. C., and Larochelle, A. (1989). Picromerus bidens (Heteroptera: Pentatomidae) in North America, with a world review of distribution and bionomics. Entomol. News 100, 133–146.
Legaspi, J. C., O’Neil, R. J., and Legaspi, B. C. Jr. (1996). Trade-offs in body weights, egg loads, and fat reserves of field-collected Podisus maculiventris (Heteroptera: Pentatomidae). Environ. Entomol. 25, 155–164. doi: 10.1093/ee/25.1.155
Li, X. (2014). The Applied Research of E. coli Expressing the dsRNA of S-adenosyl-L-Homocysteine Hydrolase (SAHase) Gene On The Potato Beetle. Ph.D. Thesis. Shihezi: University of Shihezi.
Liang, Y. B., Lin, W., Wang, Y. J., Xu, L., Zhai, T. N., Lu, P., et al. (1999). Determination of the geographical distribution of Colorado potato beetle, Leptinotarsa decemlineata, by ecological factors. Plant Q. 13, 257–262.
Liu, J. Y., Zhu, Y. J., Wu, Q. M., Li, Z. H., Rao, Y., and Hou, S. L. (2020). Predication of potential geographical distribution of wheat streak mosaic virus based on CLIMEX and MaxEnt. Plant Q. 34, 64–68.
Liu, Y., Huang, P., Lin, F., Yang, W., Gaisberger, H., Christopher, K., et al. (2019). MaxEnt modelling for predicting the potential distribution of a near threatened rosewood species (Dalbergia cultrata Graham ex Benth). Ecol. Eng. 141:105612. doi: 10.1016/j.ecoleng.2019.105612
Lu, Y., Zhao, Q., Cheng, L., Zhao, L., Zhang, H., and Wei, J. (2020). The potential global distribution of the white peach scale Pseudaulacaspis pentagona (Targioni Tozzetti) under climate change. Forests 11:192. doi: 10.3390/f11020192
Luck, M., and Wu, J. (2002). A gradient analysis of urban landscape pattern: a case study from the Phoenix metropolitan region, Arizona, USA. Landsc. Ecol. 17, 327–339. doi: 10.1023/A:1020512723753
Mahdian, K., Kerckhove, J., Tirry, L., and De Clerc, P. (2006). Effects of diet on development and reproduction of the predatory pentatomids Picromerus bidens and Podisus maculiventris. Biocontrol 51, 725–739. doi: 10.1007/s10526-005-5253-3
Mahdian, K., Tirry, L., and De Clercq, P. (2008). Development of the predatory pentatomid Picromerus bidens (L.) at various constant temperatures. Belg. J. Zool. 138, 135–139.
Malekmohammadi, M., Hejazi, M. J., Mossadegh, M. S., Galehdari, H., Khanjani, M., and Goodarzi, M. T. (2012). Molecular diagnostic for detecting the acetylcholinesterase mutations in insecticide-resistant populations of Colorado potato beetle, Leptinotarsa decemlineata (Say). Pest. Biochem. Physiol. 104, 150–156. doi: 10.1016/j.pestbp.2012.06.004
Marchioro, C. A., and Krechemer, F. S. (2021). Prevention is better than cure: integrating habitat suitability and invasion threat to assess global biological invasion risk by insect pests under climate change. Pest. Manag. Sci. 77, 4510–4520. doi: 10.1002/ps.6486
Mayné, R., and Breny, R. (1948). Picromerus bidens L.: morphologie. biologie. détermination de sa valeur d’utilisation dans la lutte biologique contre le doryphore de la pomme de terre–la valeur économique antidoryphorique des Asopines indigènes belges. Parasitica 4, 189–224.
Nature Earth. (2009). Nature Earth. Available online at: https://www.naturalearthdata.com/ (accessed January 15, 2021)
Phillips, S. J., Anderson, R. P., and Schapire, R. E. (2006). Maximum entropy modeling of species geographic distributions. Ecol. Modell. 190, 231–259. doi: 10.1016/j.ecolmodel.2005.03.026
Pulatov, B., Jönsson, A. M., Wilcke, R. A., Linderson, M. L., Hall, K., and Bärring, L. (2016). Evaluation of the phenological synchrony between potato crop and Colorado potato beetle under future climate in Europe. Agric. Ecosyst. Environ. 224, 39–49. doi: 10.1016/j.agee.2016.03.027
Qin, Z., Zhang, J. E., DiTommaso, A., Wang, R. L., and Wu, R. S. (2015). Predicting invasions of Wedelia trilobata (L.) Hitchc. with Maxent and GARP models. J. Plant Res. 128, 763–775. doi: 10.1007/s10265-015-0738-3
Rinkevich, F. D., Su, C., Lazo, T. A., Hawthorne, D. J., Tingey, W. M., Naimov, S., et al. (2012). Multiple evolutionary origins of knockdown resistance (kdr) in pyrethroid-resistant Colorado potato beetle, Leptinotarsa decemlineata. Pest. Biochem. Physiol. 104, 192–200. doi: 10.1016/j.pestbp.2012.08.001
Stocker, T. F., Qin, D., Plattner, G. K., Tignor, M. M., Allen, S. K., Boschung, J., et al. (2013). Climate change 2013: The Physical Science Basis: Working Group I Contribution to the Fifth Assessment Report of the Intergovernmental Panel on Climate Change. Cambridge: Cambridge university press.
Szendrei, Z., Grafius, E., Byrne, A., and Ziegler, A. (2012). Resistance to neonicotinoid insecticides in field populations of the Colorado potato beetle (Coleoptera: Chrysomelidae). Pest. Manag. Sci. 68, 941–946. doi: 10.1002/ps.3258
Tang, Y. T. (2020). Study on Potential of a Novel Natural Enemy Insect Picromerus lewisi Scott in Biological Control. Ph.D. Thesis. Beijing: Chinese Academy of Agricultural Sciences.
Tuerxun, A., Xu, J., Guo, W., Liu, J., He, J., Xia, Z., et al. (2010). Study on major biological characteristics and occurrence regulation of Colorado potato beetle. Xinjiang Agric. Sci. 47, 1147–1151.
Volkov, O. G., Meshkov, Y. I., and Yakovleva, I. N. (2013). Development and predation of Picromerus bidens (Hemiptera: Pentatomidae) on Leptinotarsa decemlineata (Coleoptera: Chrysomelidae). Russ. Entomol. J. 22, 43–50.
Wang, C. (2017). Global Dispersal Tendency of Colorado Potato Beetle, Leptinotarsa decemlineata (Say). Ph.D. Thesis. Beijing: China Agricultural University.
Wang, F., Wang, D., Guo, G., Hu, Y., Wei, J., and Liu, J. (2019). Species delimitation of the Dermacentor ticks based on phylogenetic clustering and niche modeling. PeerJ 7:e6911. doi: 10.7717/peerj.6911
Wang, J. J. (2018). Effect of Teflubenzuron Ingestion on Larval Performance and Chitin Content in Leptinotarsa decemlineata. Ph.D. Thesis. Nanjing: University of Nanjing□Agricultural.
Wang, L. J., Guo, W. C., Xu, J. J., Xiao, L. F., Han, Z. Z., and Zhang, J. P. (2011). The spatial distribution pattern and sampling techniques of the Colorado potato beetle, Leptinotarsa decemlineata (Say). J. Environ. Entomol. 33, 147–153.
Warren, D. L., and Seifert, S. N. (2011). Ecological niche modeling in Maxent: the importance of model complexity and the performance of model selection criteria. Ecol. Appl. 21, 335–342. doi: 10.1890/10-1171.1
Weber, D. (2003). Colorado beetle: pest on the move. Pest. Outlook 14, 256–259. doi: 10.1039/b314847p
Wei, J., Peng, L., He, Z., Lu, Y., and Wang, F. (2020). Potential distribution of two invasive pineapple pests under climate change. Pest. Manag. Sci. 76, 1652–1663. doi: 10.1002/ps.5684
Wei, J., Zhao, Q., Zhao, W., and Zhang, H. (2018). Predicting the potential distributions of the invasive cycad scale Aulacaspis yasumatsui (Hemiptera: Diaspididae) under different climate change scenarios and the implications for management. PeerJ 6:e4832. doi: 10.7717/peerj.4832
WFP GeoNode (2017). Geographical Data Repository Data with Coordinates. Available online at: http://geonode.wfp.org (accessed January 15, 2021)
WorldClim (2020). WorldClim-Global Climate Data Version 2.1. Available online at: https://www.worldclim.org (accessed September 10, 2020)
Keywords: MaxEnt, climate change, Ecological niche model, centroids movement, invasive species, biological control
Citation: Gao X, Zhao Q, Wei J and Zhang H (2022) Study on the Potential Distribution of Leptinotarsa decemlineata and Its Natural Enemy Picromerus bidens Under Climate Change. Front. Ecol. Evol. 9:786436. doi: 10.3389/fevo.2021.786436
Received: 30 September 2021; Accepted: 22 December 2021;
Published: 14 January 2022.
Edited by:
Paulo AV Borges, University of the Azores, PortugalReviewed by:
Divina Medina Amalin, De La Salle University, PhilippinesMarco Cabrera Brandt, University of Talca, Chile
Copyright © 2022 Gao, Zhao, Wei and Zhang. This is an open-access article distributed under the terms of the Creative Commons Attribution License (CC BY). The use, distribution or reproduction in other forums is permitted, provided the original author(s) and the copyright owner(s) are credited and that the original publication in this journal is cited, in accordance with accepted academic practice. No use, distribution or reproduction is permitted which does not comply with these terms.
*Correspondence: Jiufeng Wei, d2pmZW5nQG53c3VhZi5lZHUuY24=; Hufang Zhang, emhfaHVmYW5nQHNvaHUuY29t
†These authors have contributed equally to this work