 Yuxin Zhang
 Juying Sun2
- 1School of Management, Chengdu University of Information Technology, Chengdu, China
- 2State Key Laboratory of Hydraulics and Mountain River Engineering, College of Water Resource and Hydropower, Sichuan University, Chengdu, China
- 3Institute of Mountain Hazards and Environment, Chinese Academy of Sciences, Chengdu, China
In the context of climate change, revealing the causes of significant changes in ecosystems will help maintain ecosystem stability and achieve sustainability. However, the dominant influencing factors of different ecosystems in different months on a global scale are not clear. We used Ordinary Least Squares Model and Mann–Kendall test to detect the significant changes (p < 0.05) of ecosystem on a monthly scale from 1981 to 2015. And then multi-source data, residual analysis and partial correlation method was used to distinguish the impact of anthropogenic activities and dominant climate factors. The result showed that: (1) Not all significant green areas in all months were greater than the browning areas. Woodland had a larger greening area than farmland and grassland, except for January, May, and June, and a larger browning area except for September, November, and December. (2) Anthropogenic activities are the leading factors causing significant greening in ecosystems. However, their impact on significant ecosystem browning was not greater than that of climate change on significant ecosystem greening in all months. (3) The main cause of the ecosystem’s significant greening was temperature. Along with temperature, sunshine duration played a major role in the significant greening of the woodland. The main causes of significant farmland greening were precipitation and soil moisture. Temperature was the main factor that dominated the longest month of significant browning of grassland and woodland. Temperature and soil moisture were the main factors that dominated the longest month of significant browning of farmland. Our research reveals ecosystem changes and their dominant factors on a global scale, thereby supporting the sustainable ecosystem management.
1. Introduction
In the past decades, anthropogenic activities and climate change have put ecosystems at risk (Ojima et al., 1991; Giling et al., 2019; Williams et al., 2020) through rapid urbanization and population change, which have a dramatic impact on global biogeochemical cycles and ecosystems (Hong and Lee, 2006; Flombaum et al., 2017). Long-term monitoring and experimental research can help mitigate the impacts of these changes (Osmond et al., 2004; van Wijk et al., 2004). However, remote sensing is a more rapid method that can cover a wide range of regions (Wang et al., 2019).
At the global scale, temperature, precipitation, and anthropogenic activities are the most common leading factors affecting ecosystem change (Braswell et al., 1997). Ecosystems in humid temperate zones and arid areas are significantly affected by temperature, while ecosystems in arid areas are also positively affected by precipitation (Liu et al., 2015). Tropical ecosystems are very sensitive to the water balance driven by precipitation and temperature (Scholes and vanBreemen, 1997). Anthropogenic activities have had significant positive impacts by protection policy on vegetation in Asia, Africa, and Europe (Liu et al., 2015). In mountainous areas with high population pressure, the ecosystem functions of most mountain ranges decline (Gret-Regamey and Weibel, 2020). In Patagonia, the main factors influencing the ecosystem are precipitation, followed by grazing, and temperature (Flombaum et al., 2017). In China, with the increase of altitude and slope, the impact of anthropogenic activities on the ecosystem gradually weakens (Liu et al., 2021). Although previous studies have revealed the main factors influencing ecosystem change, grid-scale vegetation change may have several main influencing factors. Therefore, it is important to identify the most important factors.
Ecosystems respond differently to anthropogenic activities and climate change in different regions (Li et al., 2018a). Climate change is predicted to lead to a decrease in global net primary productivity (NPP) by 2050, but a slight increase in grassland NPP (Boone et al., 2018). In the Yangtze River basin, anthropogenic activities contributed more to forest restoration and degradation than did climate change (Wang et al., 2022). Human logging and the dry environment have an impact on the decline of fir forests in the southernmost region of Europe (Sanchez-Robles et al., 2022). Anthropogenic activities had a greater impact on the grassland of the Qinghai Tibet Plateau than any one climate variable, but not as much as the combined effects of all climate variables (Wu et al., 2021b). Northern China’s grassland overground net primary productivity has decreased due to climate change (Wu et al., 2021a). It was anticipated that climate change will make Mongolian grasslands more dry (Nandintsetseg et al., 2021). Anthropogenic activity and climate change both directly and indirectly influenced farmland. Farmland will be encroached upon by urbanization, and humans will also create some rules to safeguard it (Li et al., 1982). Drought or flooding that affected farming was a result of climate change’s indirect effects (Wen et al., 2017). In addition, different ecosystems have different sensitivity to climate change in different months (Piao et al., 2020a). Therefore, it is necessary to identify the dominant factors that affect different ecosystem changes.
This study examined the response of global ecosystems to anthropogenic activities and major climate factors from 1981 to 2015. This process was divided into three parts. (1) Identifying areas of significant change (p < 0.05) in the global ecosystem (woodland, grassland, and farmland); (2) analyzing the areas where anthropogenic activities and climate factors are leading factors that cause significant changes (p < 0.05) in the ecosystem; (3) determining the most important factors in regions where climate change is the dominant factor.
2. Data and methods
2.1. Data
The data we used include Normalized Difference Vegetation Index (NDVI), climate data and land use data from 1981 to 2015 (Table 1). We used linear interpolation to unify the data resolution to 0.5°.
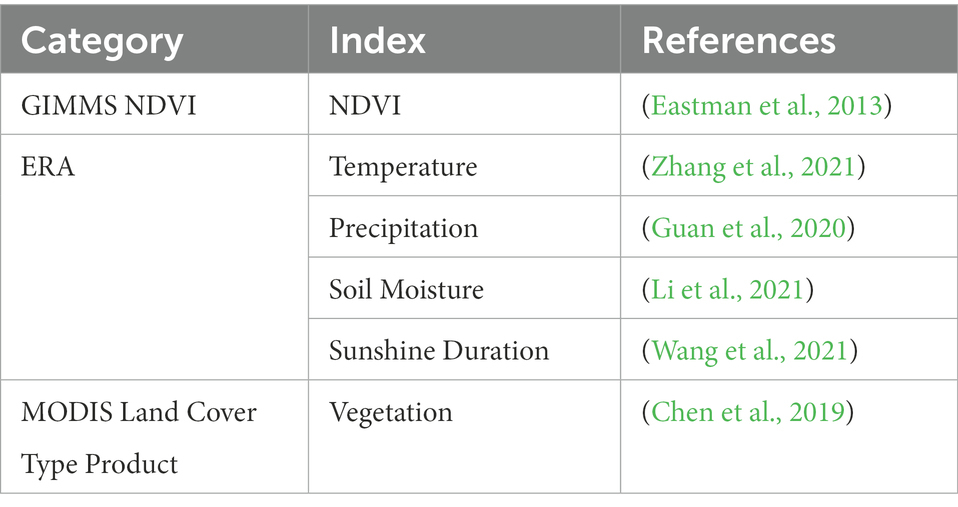
Table 1. Remote sensing vegetation data and climate factor data from 1981 to 2015.
2.1.1. NDVI
The NDVI data were adopted from the global GIMMS NDVI by the NOAA Advanced Very High Resolution Radiometer (AVHRR). The spatial resolution of the data was 1/12°, and the temporal resolution was 16 days. We used the maximum value synthesis method to obtain the monthly NDVI value. This data was downloaded and processed using the Google Earth Engine.1
2.1.2. Climate data
We used climate factors, which are often used to analyze factors affecting vegetation change, including temperature, precipitation, soil moisture, and sunshine duration (Guan et al., 2020; Wang et al., 2021). The source of these data was the ERA datasets.2 The spatial resolution of temperature, precipitation, and soil moisture was 0.25°. The spatial resolution of sunshine duration was 0.75°.
2.1.3. Land Use data
We used the Moderate Resolution Imaging Spectroradiometer (MODIS) land cover type product (MCD12C1) from 2000 to 2012,3 with a spatial resolution of 0.5°. This dataset divided land use types into 17 types. We considered woodland, grassland, and farmland that have not changed from 2000 to 2012 as the ecosystems area (Figure 1).
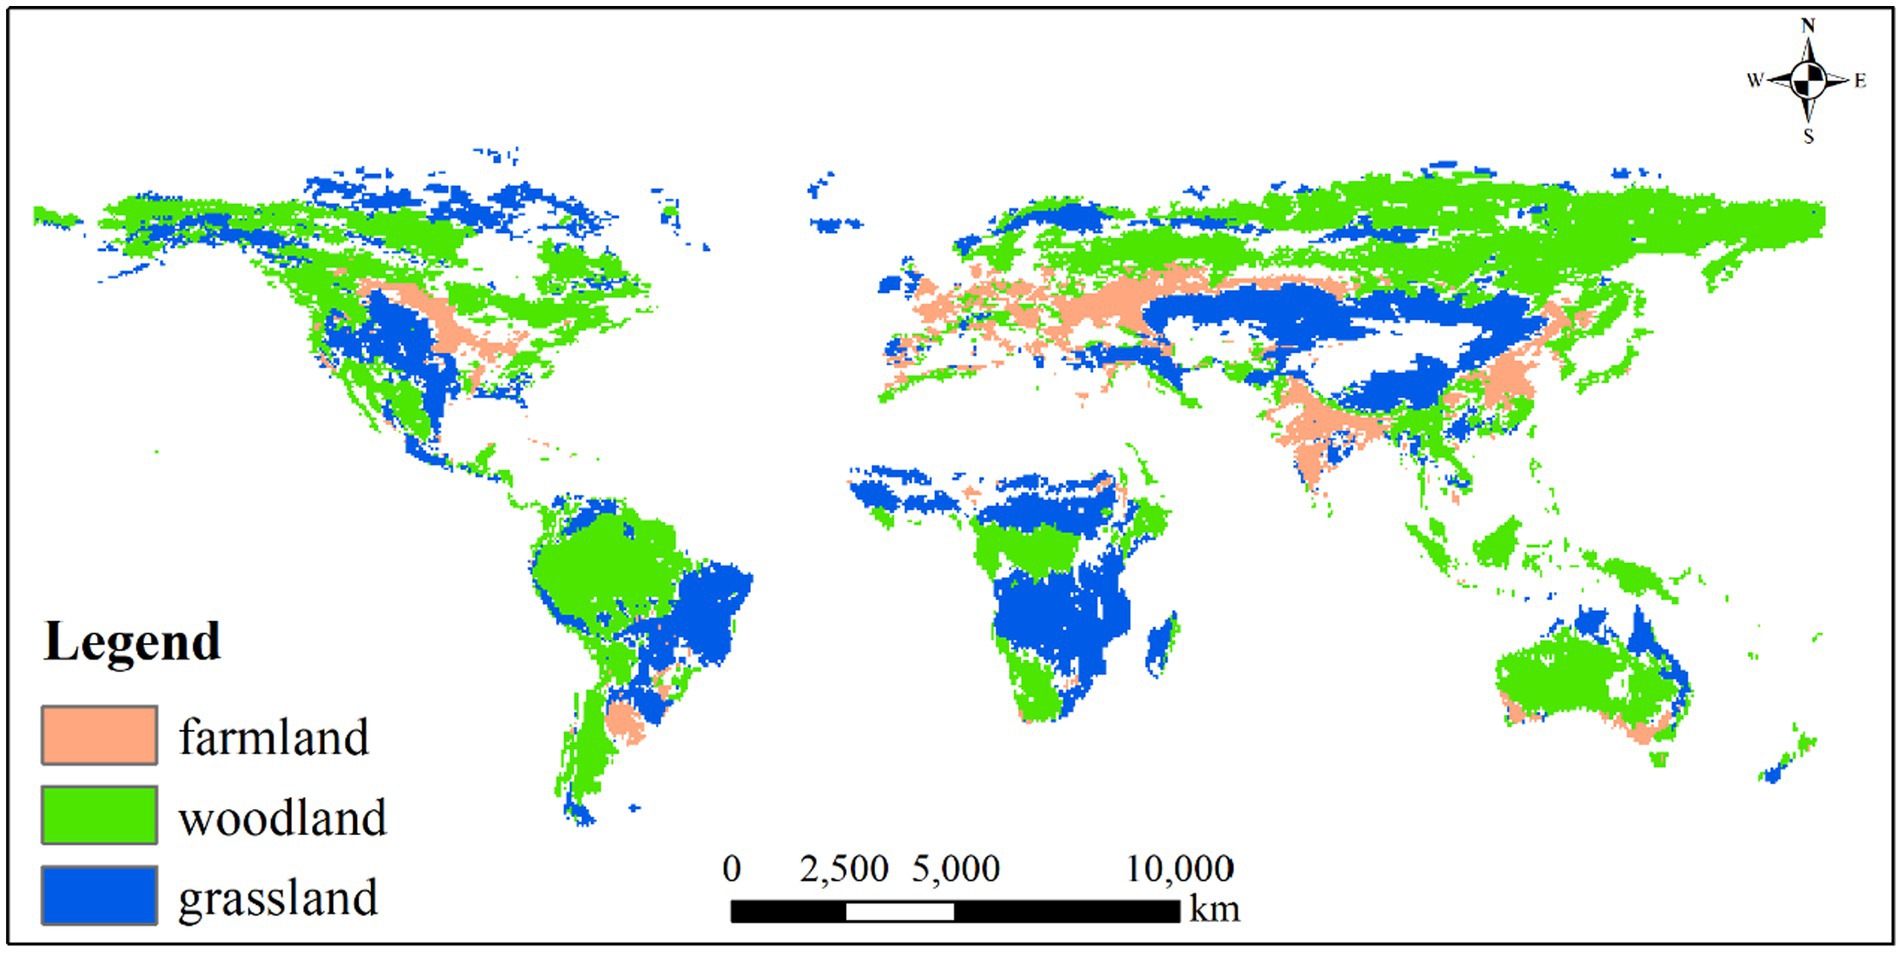
Figure 1. Woodland, grassland and farmland unchanged from 2000–2012.
2.2. Methods
2.2.1. Ordinary least squares (OLS) and Mann–Kendall (MK) test
The OLS analyzes the change trend of long-term data based on the least error sum of squares between the predicted value and the observed value (Hou et al., 2015). This method was often used to detect the variation trend of vegetation change (Pan et al., 2018). We used the OLS model to analyze the variation trend of ecosystem NDVI on a monthly scale from 1981 to 2015. And then we used the MK Test to assess significance. It is a non-parametric, rank-based method for evaluating trends in time-series data (Mann, 1945). It can accurately identify areas with significant changes in ecosystem (Nyamekye et al., 2021). The formula of OLS is as follows (Cahyono et al., 2020):
Where = dependent variable (NDVI), = intercept, = estimated coefficient, = independent variable (climate factors), = error.
2.2.2. Residual analysis
Residual analysis predicted the monthly variation trend of NDVI under the influence of climate change and determined the impact of anthropogenic activities by calculating the difference between the predicted and actual NDVI values (Pei et al., 2021). We used residual analysis to calculate the impact of anthropogenic activities and climate change on monthly variations in ecosystem NDVI. The dominant factors were judged according to the relative contributions of anthropogenic activities and climate factors (Table 2; Wanyama et al., 2020). The formula is as follows (Ibrahim et al., 2015):
Where is the residual values of NDVI, is the observed NDVI values, and is the predicted value of NDVI.
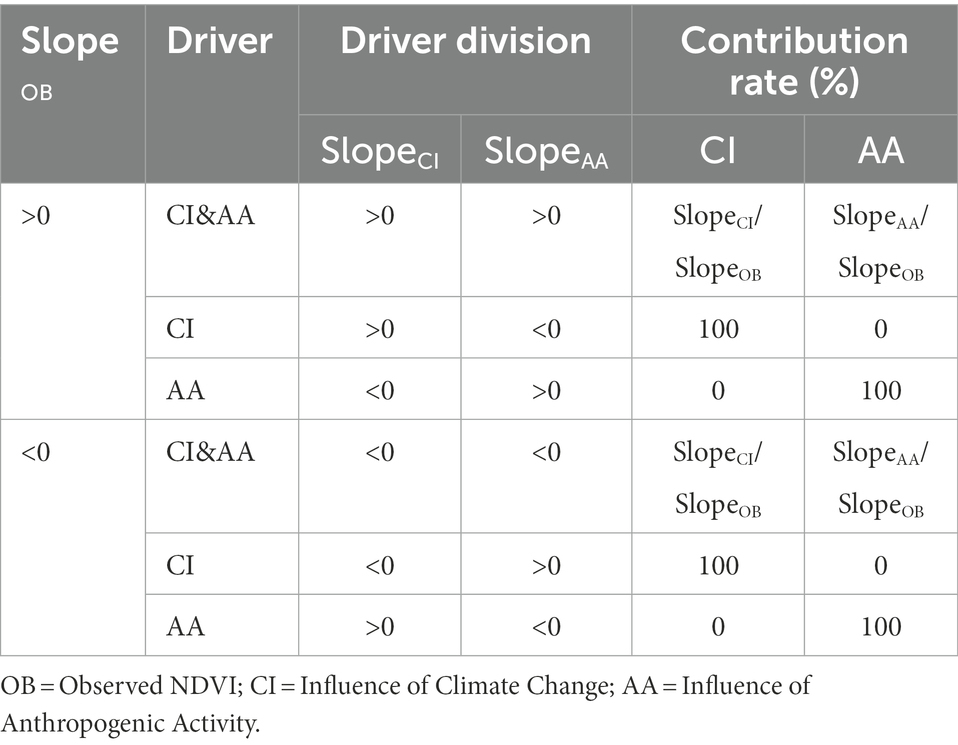
Table 2. Determination of dominant factors of anthropogenic activities and natural factors on vegetation.
2.2.3. Partial correlation analysis
Partial correlation analysis eliminates the complex interaction between multiple variables, and only calculates the correlation coefficient between two variables (Guo et al., 2021). We used a partial correlation analysis to determine the dominant factors affecting vegetation in the climate factors. This method can reveal the dominant climate factors that influence monthly NDVI variations (Xie et al., 2022). The formula is as follows (Pan et al., 2018):
where 1, 2, and 3 represent three factors. is the correlation between factors 1 and 2 after the interference associated with factor 3 is excluded. reflects the linear correlation coefficient between factors x and y, and and have similar meanings.
3. Results
3.1. Monthly variation trend of ecosystems
From 1981 to 2015, we calculated the change trend in woodland, grassland, and farmland using OLS. And we applied the MK test to identify the areas that had had significant changes. Among the unchanged ecosystem areas from 1981 to 2015, woodland was the largest and farmland was the smallest (Figures 2–4). The ranking of areas with significant changes in the different ecosystems was the same every month. Among them, the significant browning area of woodlands was the highest in June, accounting for 80% of the significant change area (Table 3). The area of significant greening was highest in September, accounting for 93% of the significant change area. The area of grassland with significant browning was highest in May, accounting for 64% of the significant change area, while the area of significant greening was highest in September, accounting for 83% of the significant change area. The area of farmland with significant browning was highest in May, accounting for 68% of the significant change area, while the area of significant greening was highest in November, accounting for 94% of the significant change area.
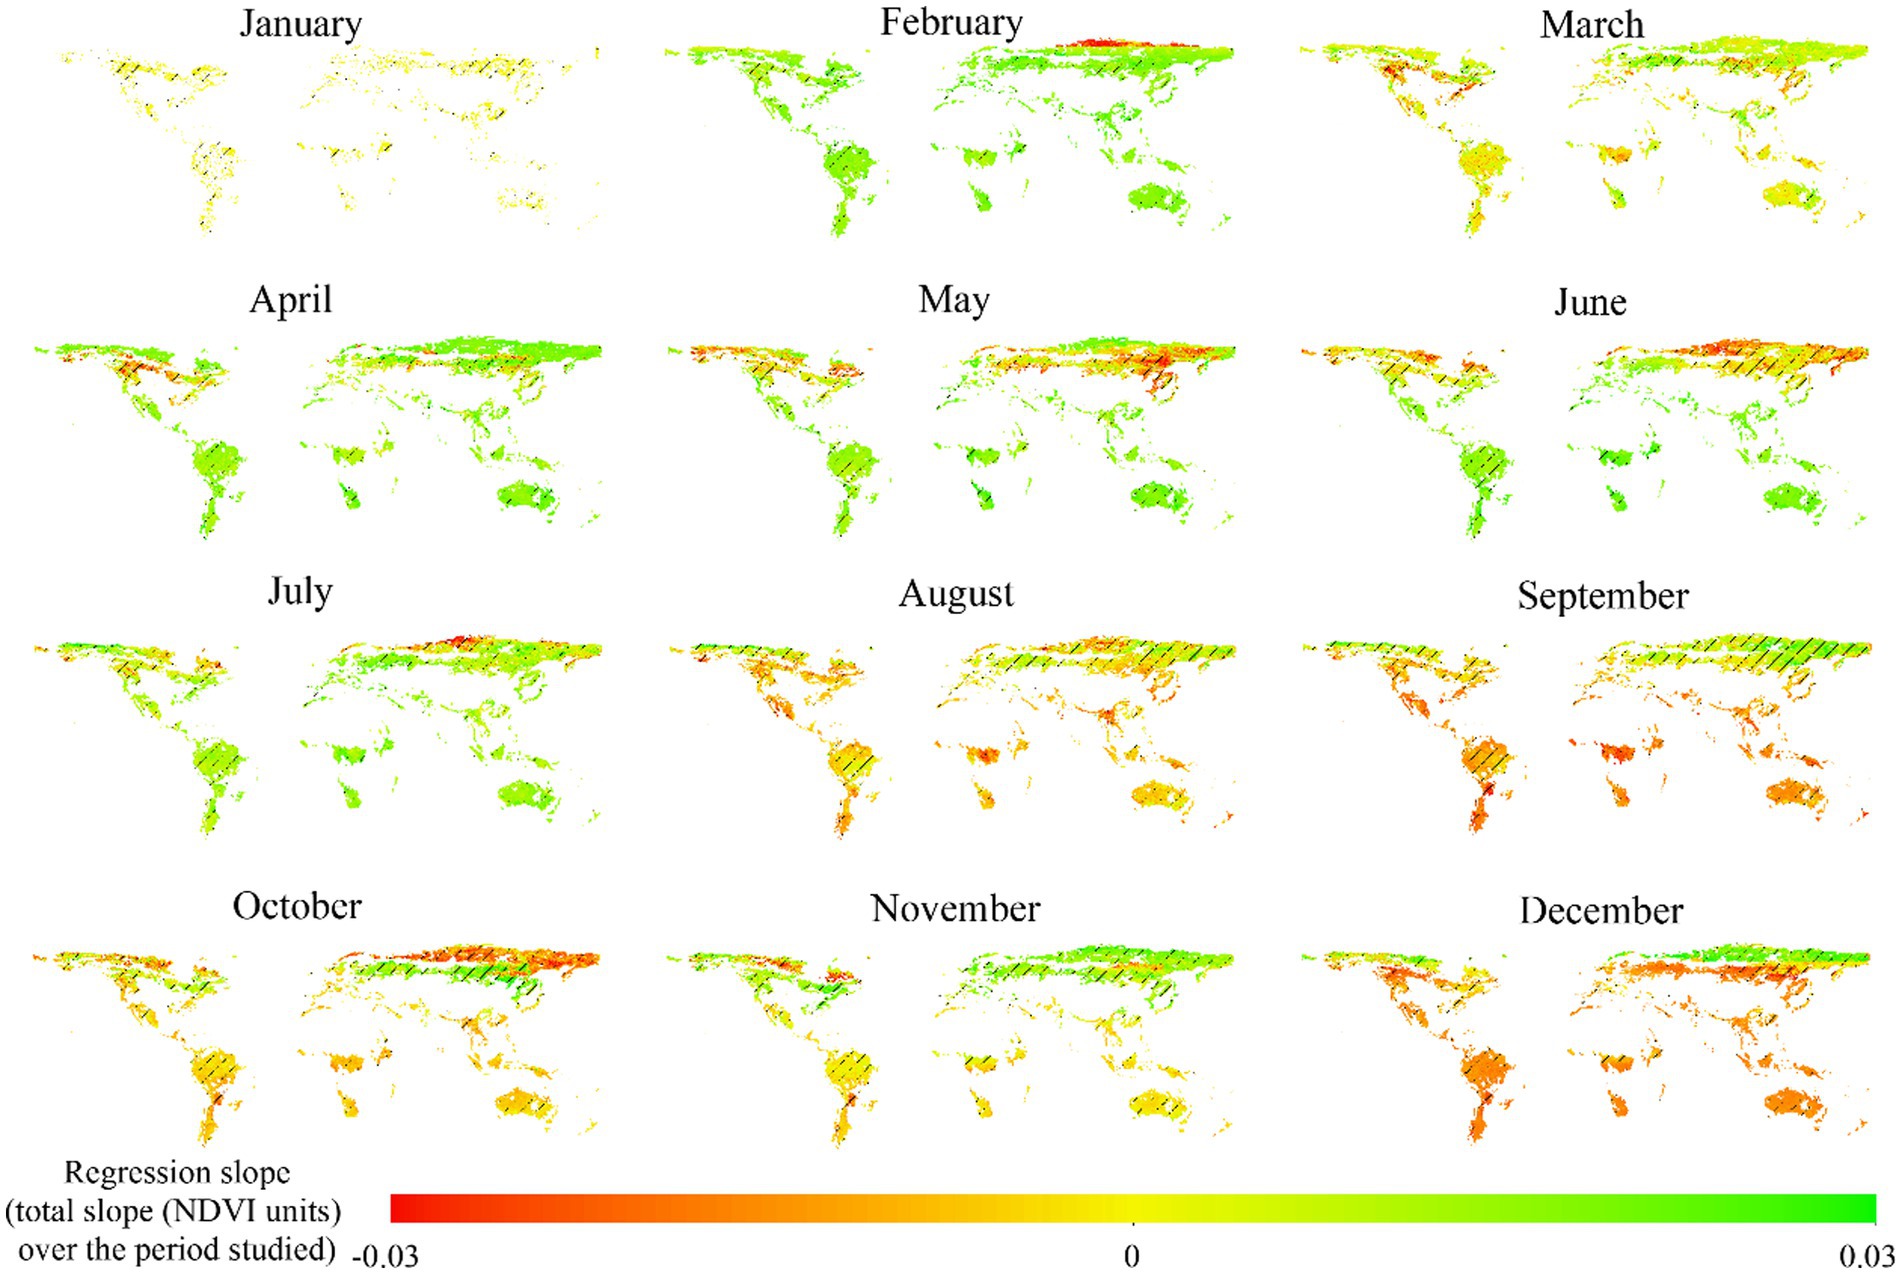
Figure 2. Variation of global woodland NDVI from 1981 to 2015 (slash represents the MK test passing 95% confidence interval).
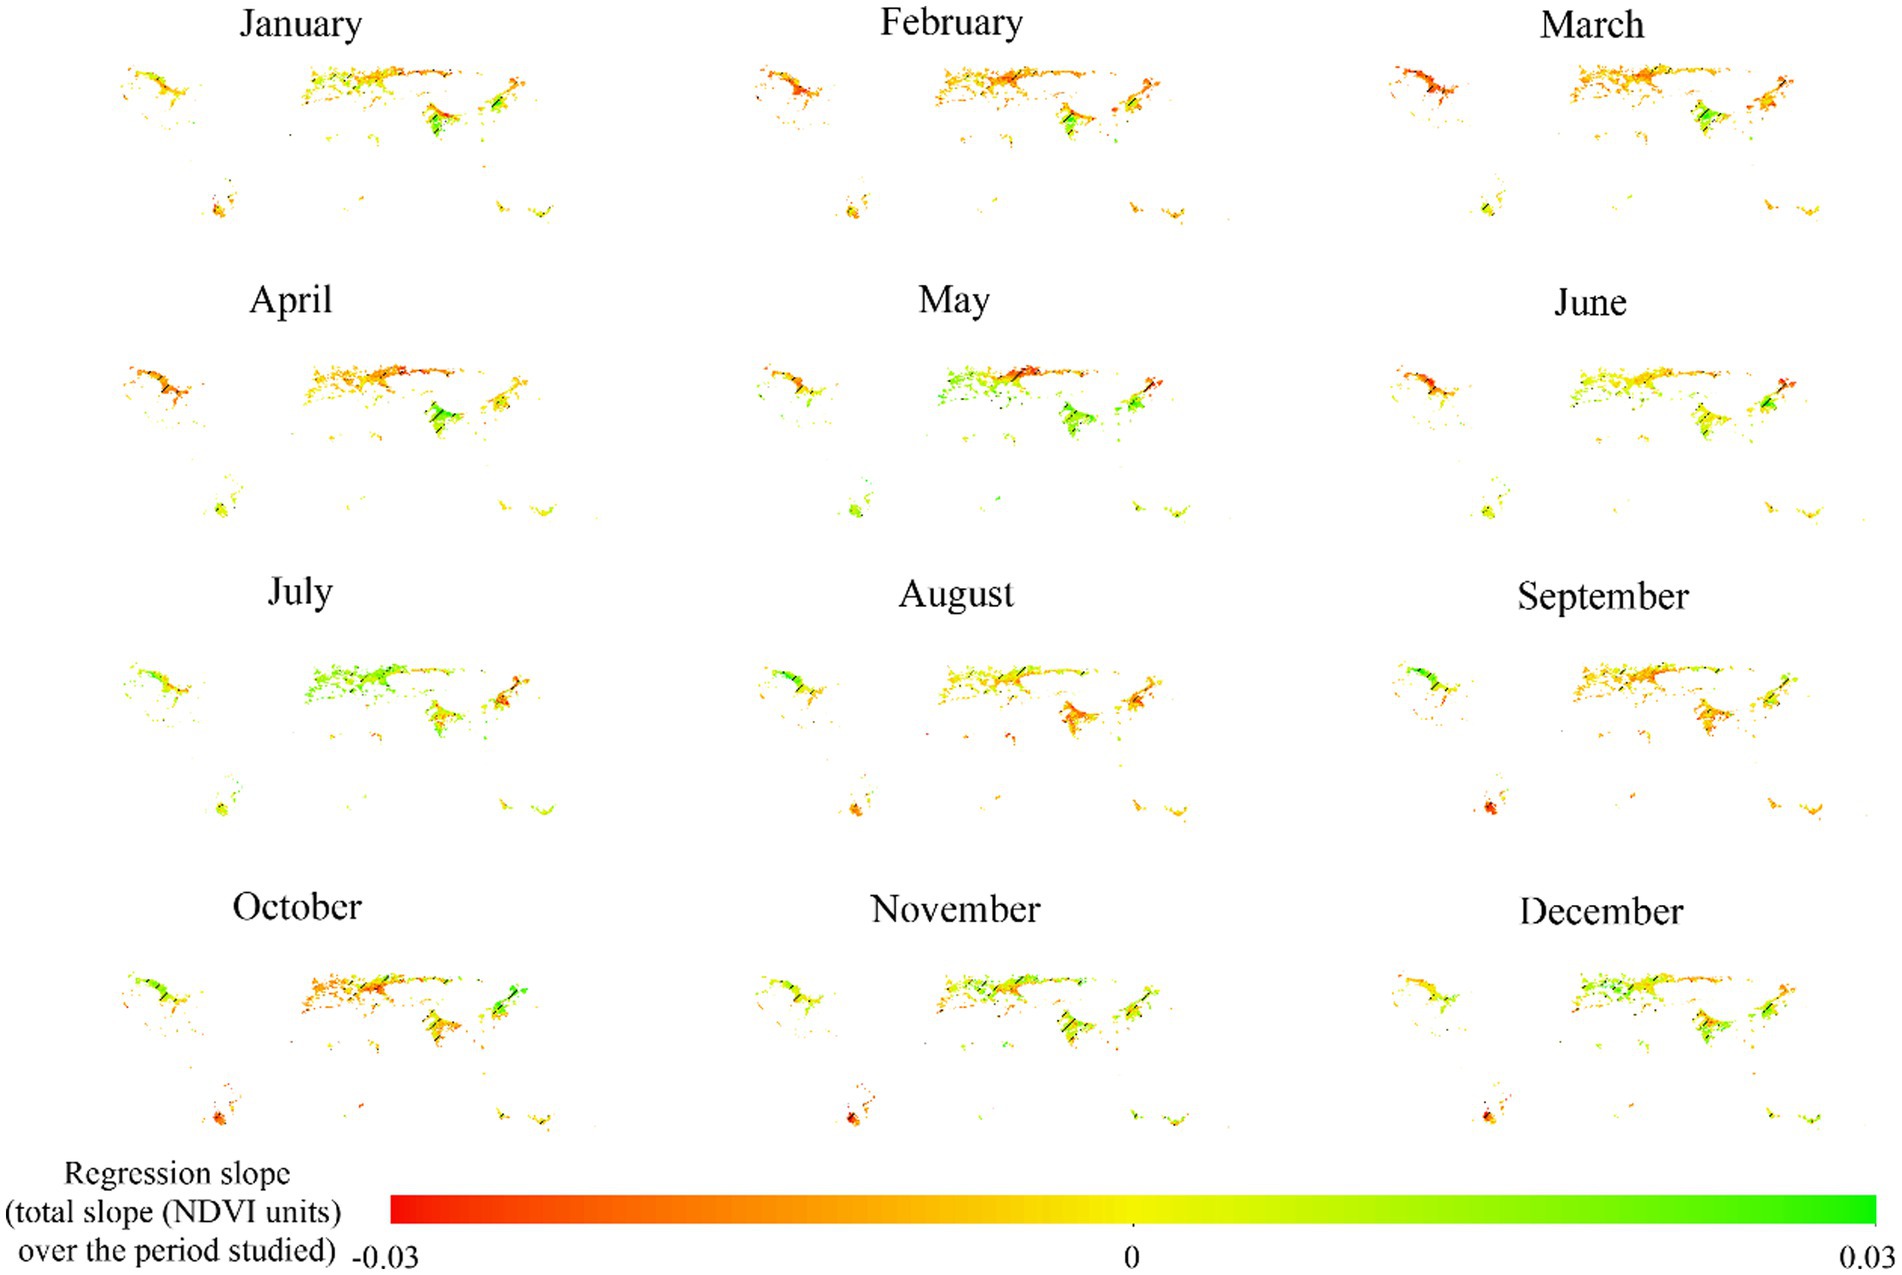
Figure 3. Variation of global grassland NDVI from 1981 to 2015 (slash represents the MK test passing 95% confidence interval).
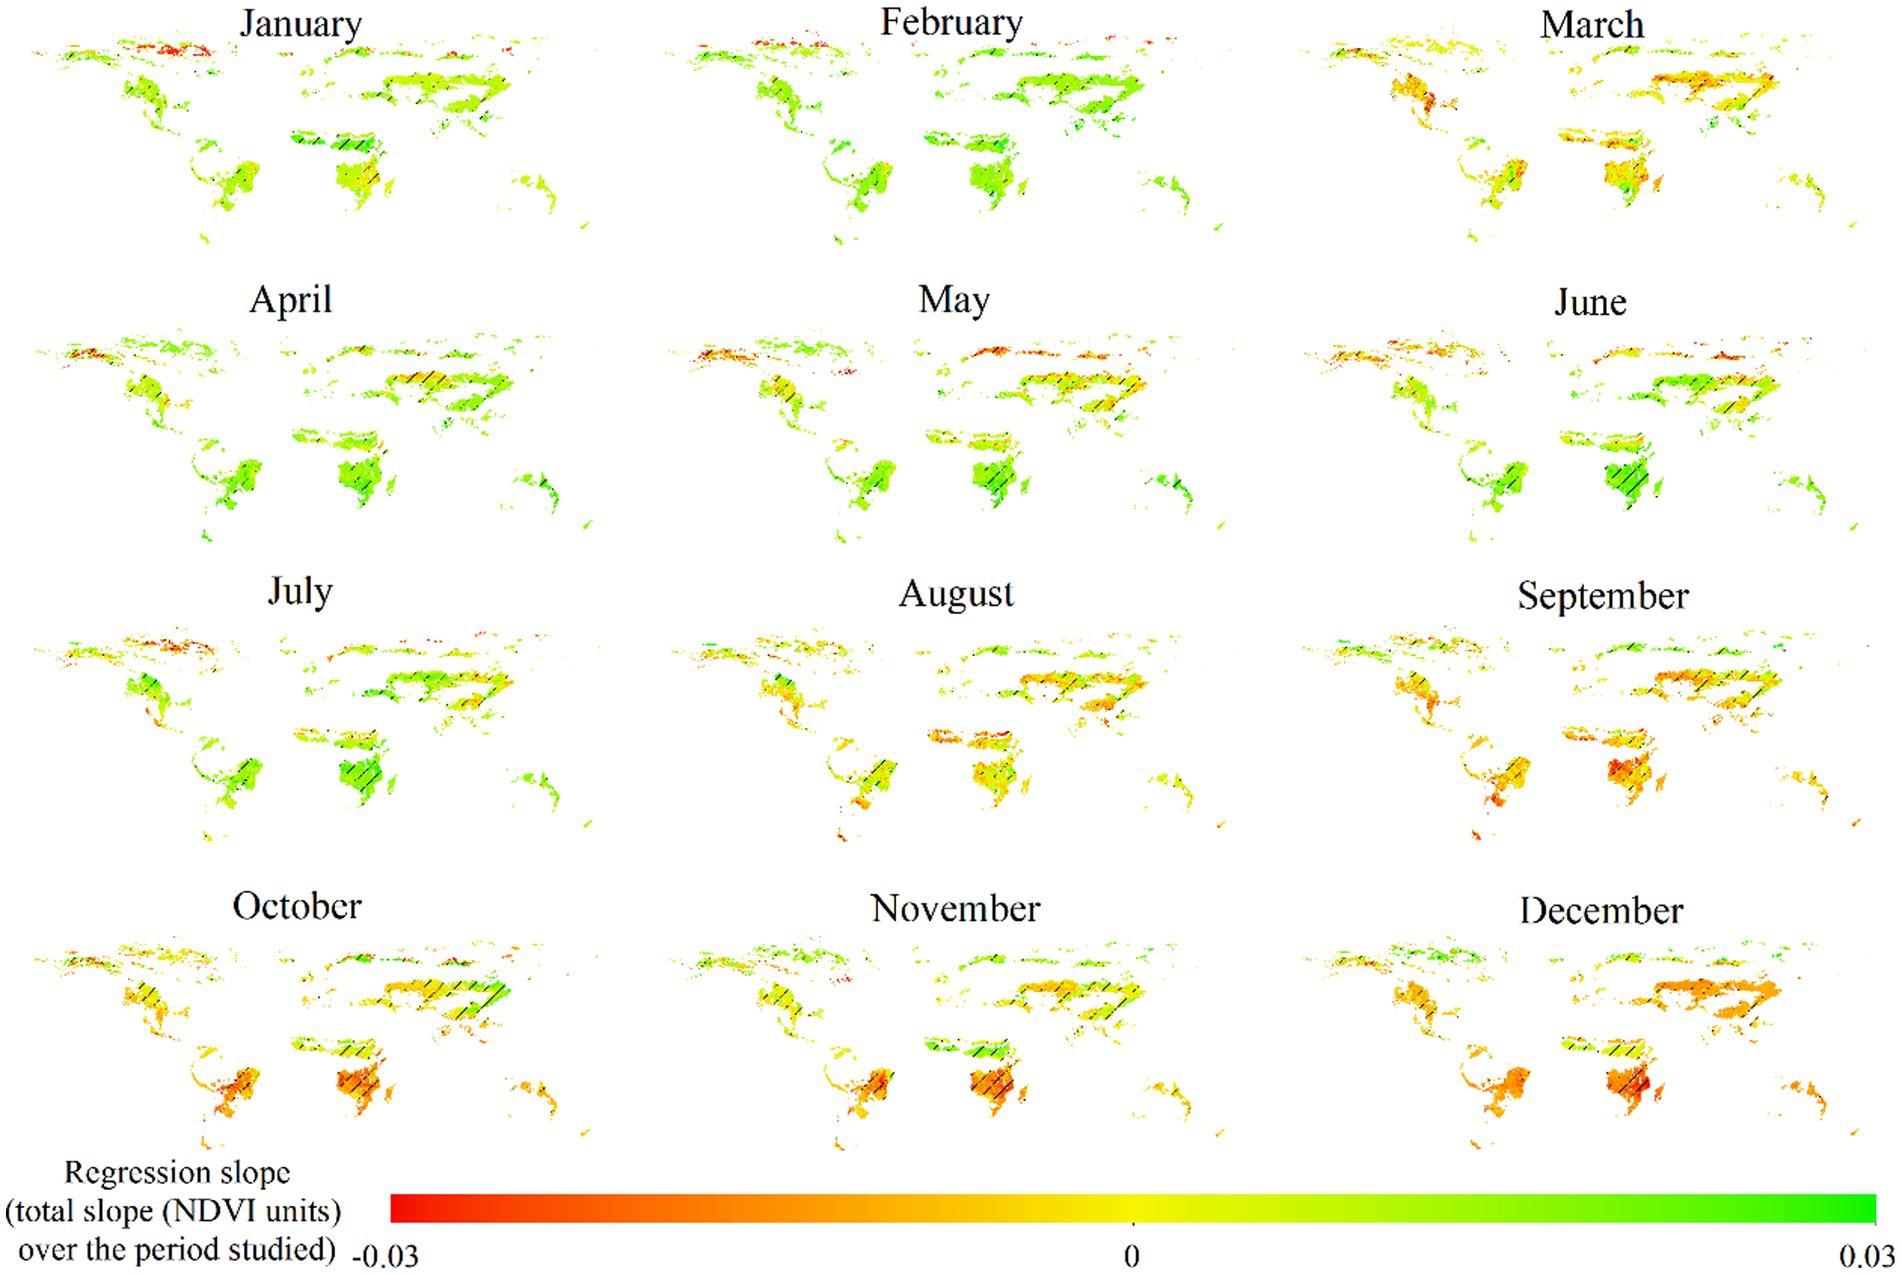
Figure 4. Variation of global farmland NDVI from 1981 to 2015 (slash represents the MK test passing 95% confidence interval).
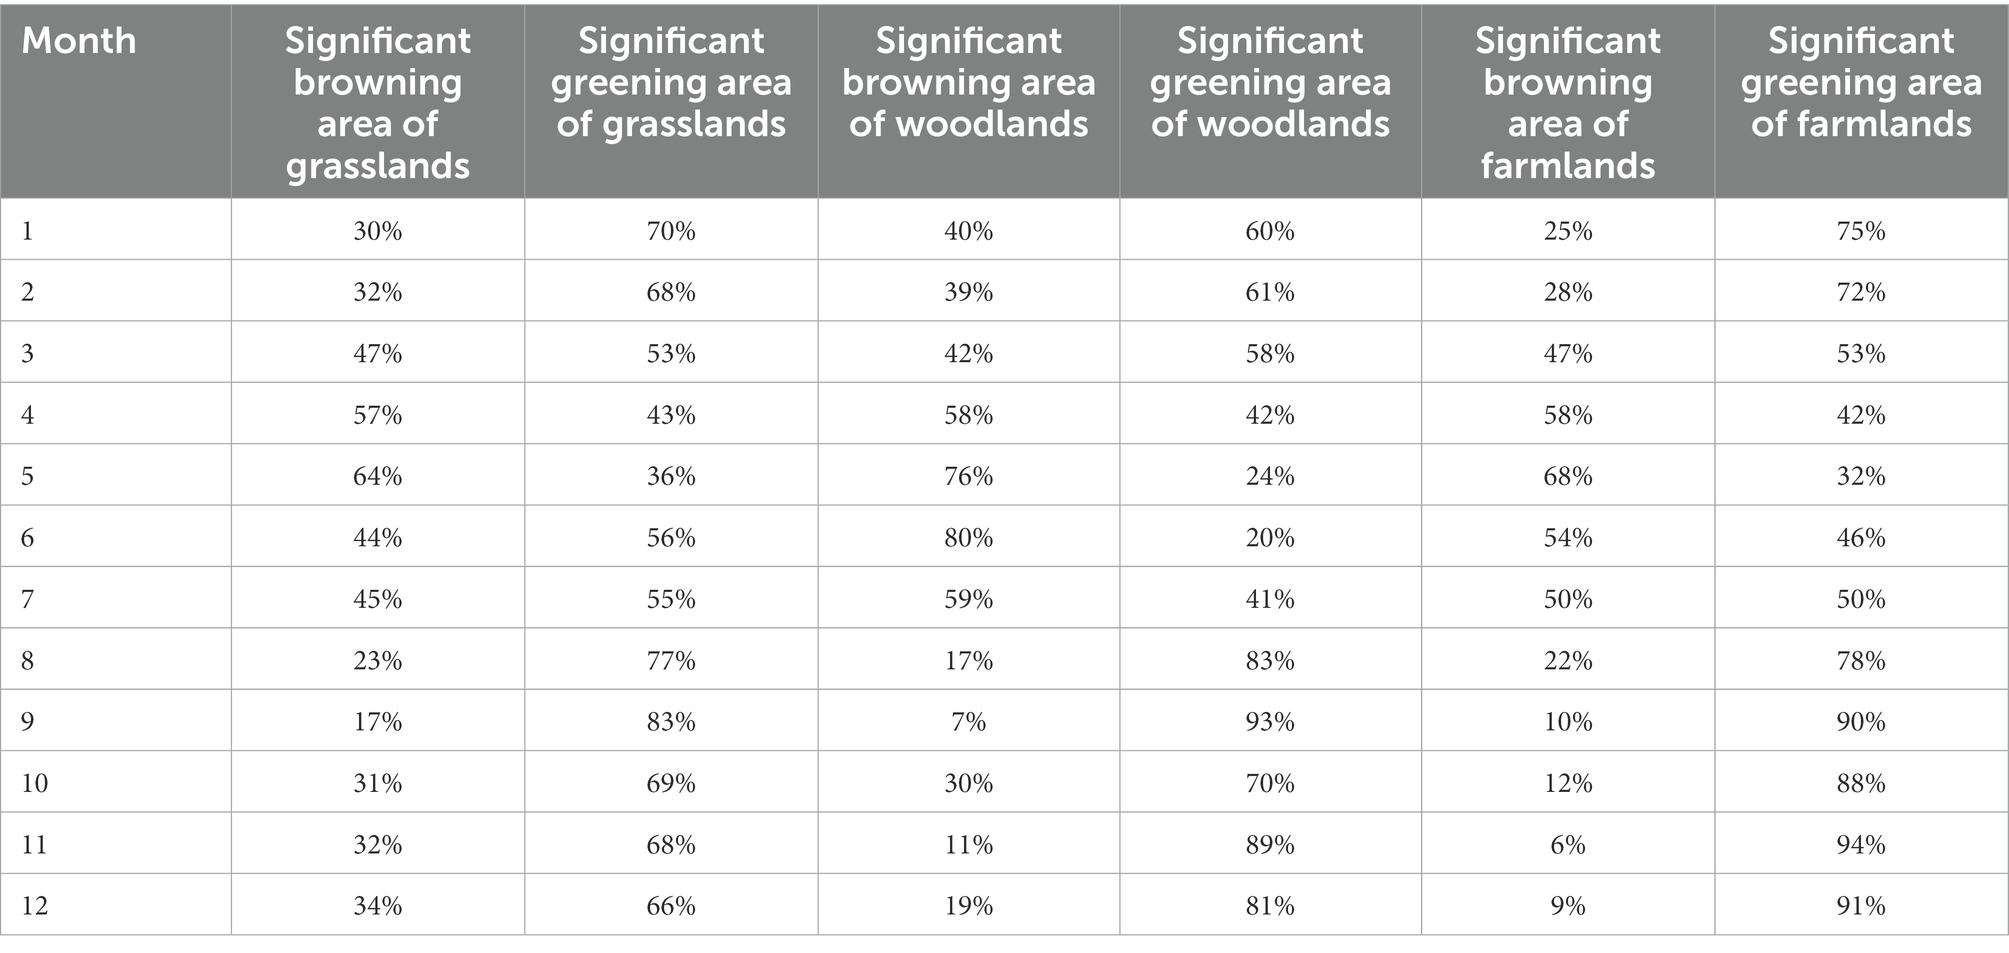
Table 3. Significant change of global ecosystems NDVI from 1981 to 2015.
Although not all significant greening areas in all months were larger than the browning areas, overall, woodland, grassland, and farmland showed a significant greening trend. The areas with significant changes in the ecosystem were, in decreasing order, woodland, grassland, and farmland in different months. However, the significant change area of woodland was not always larger than that of grassland and farmland after distinguishing between greening and browning. In the areas with significant greening, the area of woodland was larger than that of farmland and grassland, except for January, May, and June. In areas with significant browning, the area of woodland was larger than that of farmland and grassland, except for September, November, and December.
3.2. Impact anthropogenic activities and climate factors to areas with significant ecosystem changes
In areas with significant ecosystem changes, we used residual analysis to separate the relative impacts of human activity and climate change. The impact of anthropogenic activities on the significant greening of woodlands was greater than that of browning and the impact of climate change on the significant change in woodlands (Figure 5). The area of woodland with significant greening caused by anthropogenic activities was highest in September, accounting for 80% of the area of significant changes in woodland, and was lowest in May (39%). The impact of anthropogenic activities on the significant browning of woodlands was greater than that of climate change, except for March, and from July to September.
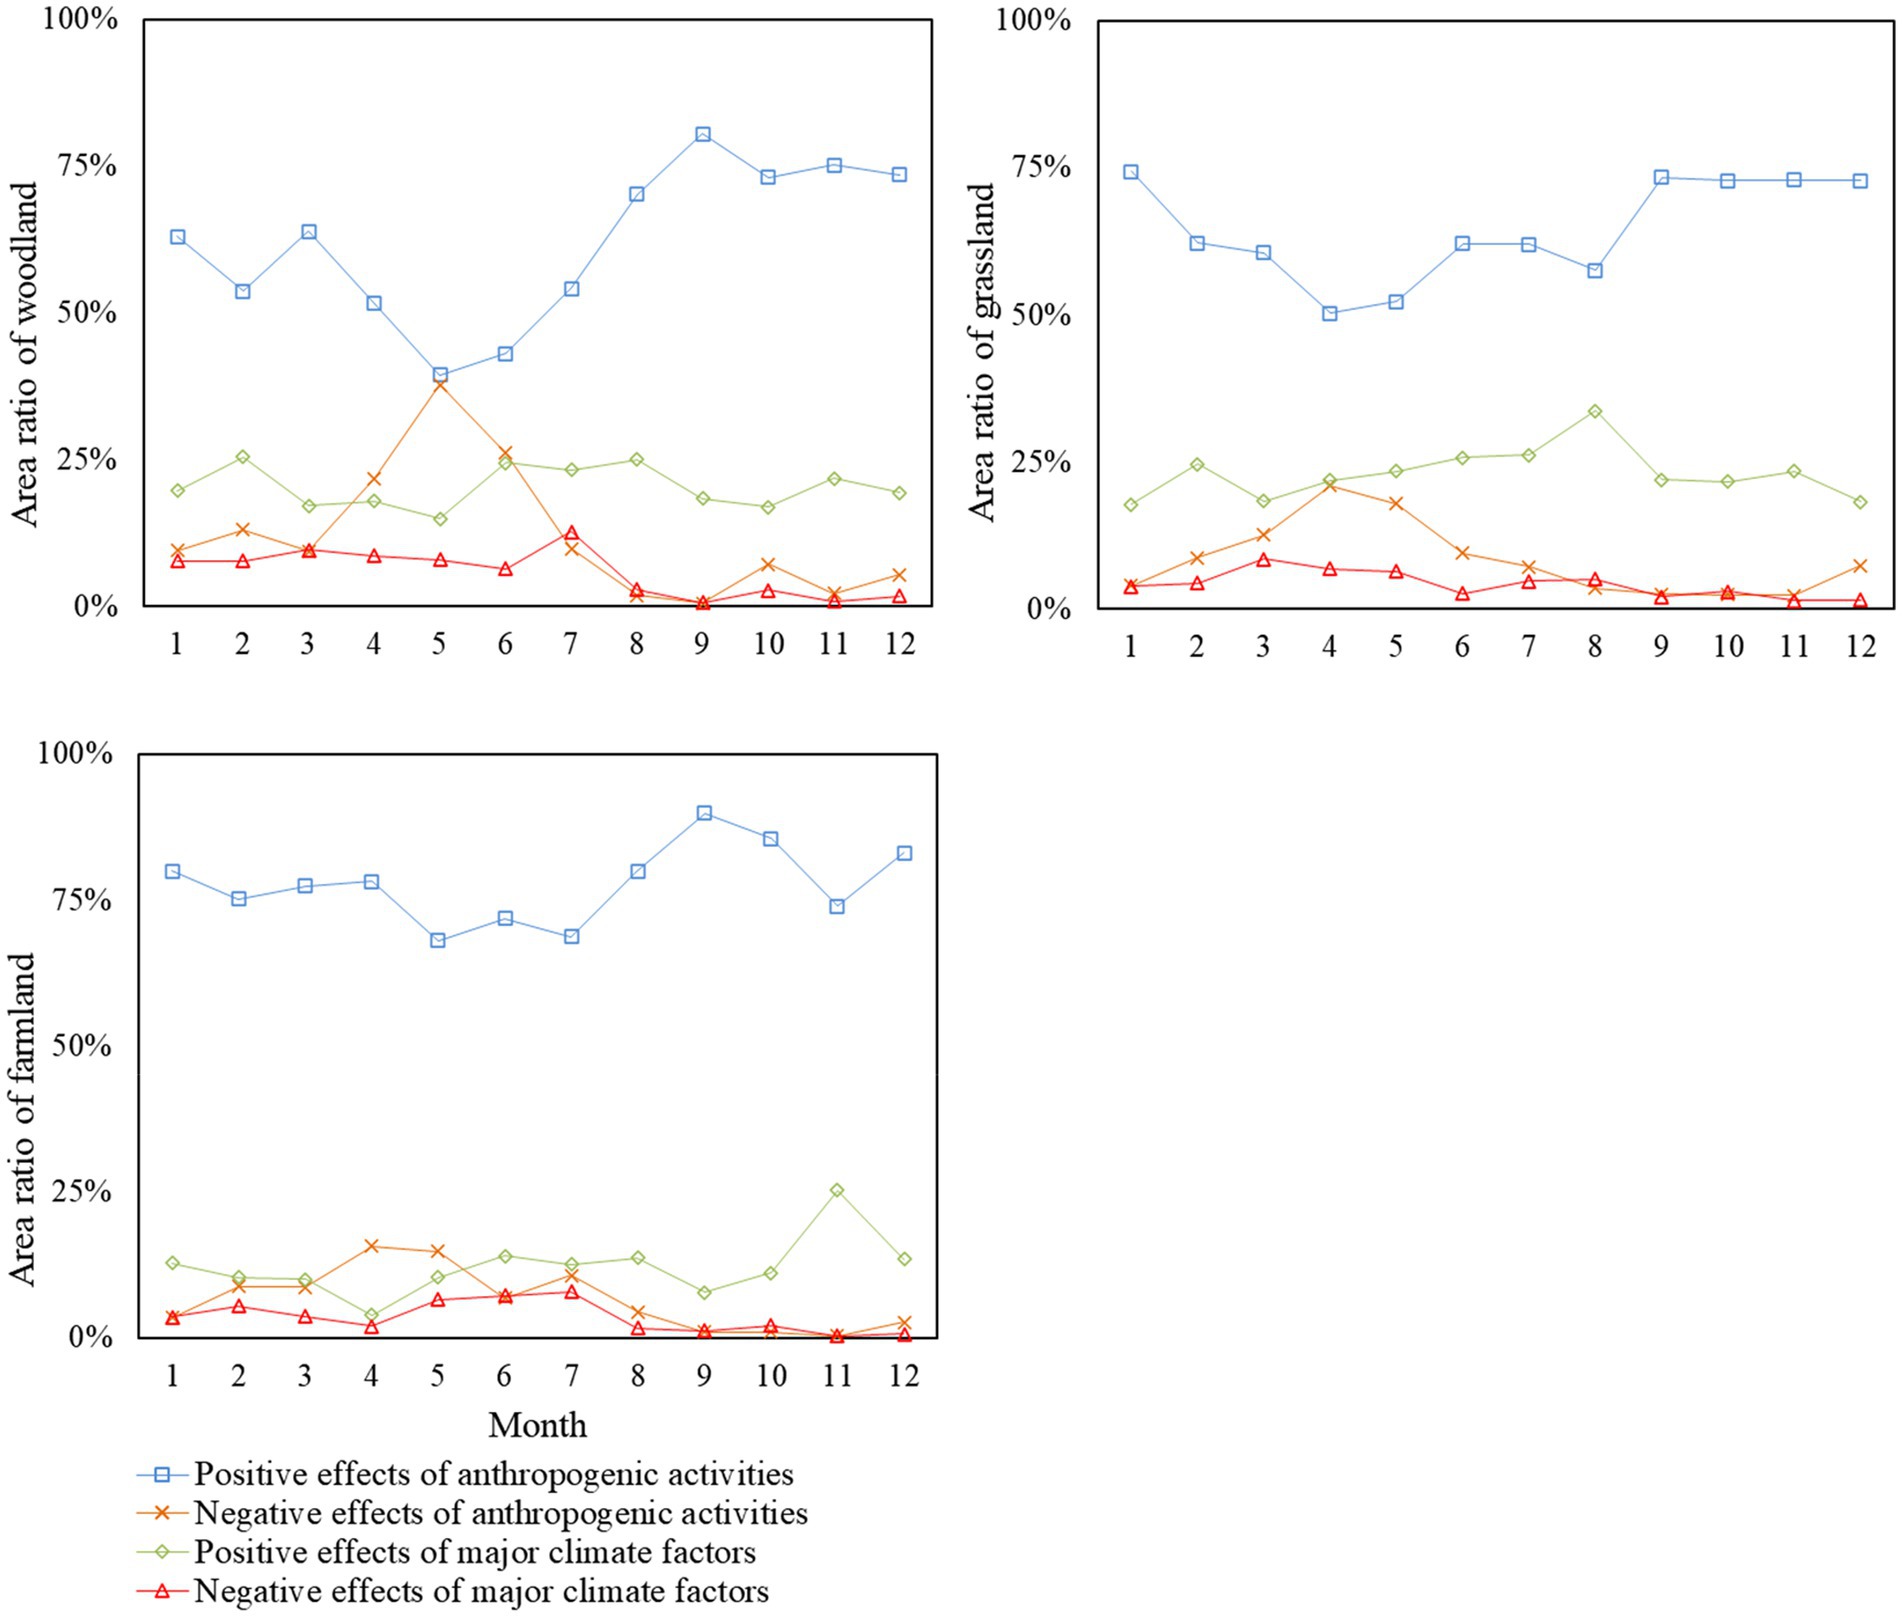
Figure 5. Area fraction with significant changes in ecosystems caused by anthropogenic activities and climate factors.
The impact of anthropogenic activities on the significant greening of grasslands was greater than that of browning and that of climate change on the significant change in grasslands (Figure 5). The area of significant grassland greening caused by anthropogenic activities was highest in January, accounting for 74% of the area of significant changes in grassland, and lowest in April (50%). The impact of anthropogenic activities on the significant browning of grasslands was greater than that of climate change, except in August and October.
The impact of anthropogenic activities on the significant greening of farmland was greater than that of browning and the impact of climate change on the significant greening of farmland (Figure 5). The area of significant greening of farmland caused by anthropogenic activities was highest in September, accounting for 90% of the area of significant changes in farmland, while the lowest value was recorded in May (68%). The impact of anthropogenic activities on the browning of farmland was greater than that of climate change, except in January, June, September, and November.
3.3. Dominant climate factors causing significant changes in ecosystems
We used partial correlation method to analyze the dominant factors in the regions with significant ecosystem changes caused by climate change. In regions where climate change was the dominant factor, we further analyzed and found that the main factor in regions where vegetation was significantly brown and green varied from month to month and from ecosystem to ecosystem (Figures 6–8).
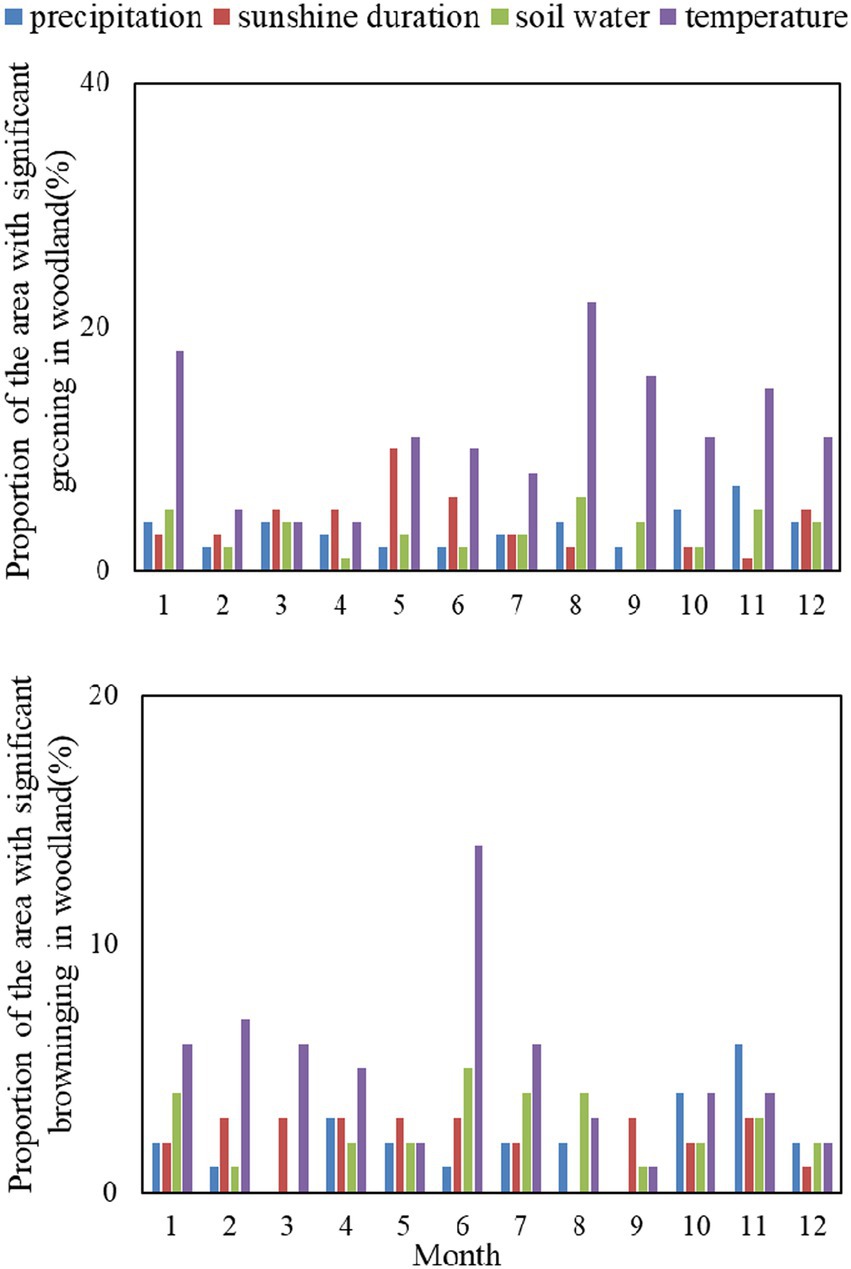
Figure 6. Area proportion of influencing factors in significant change area of woodland.
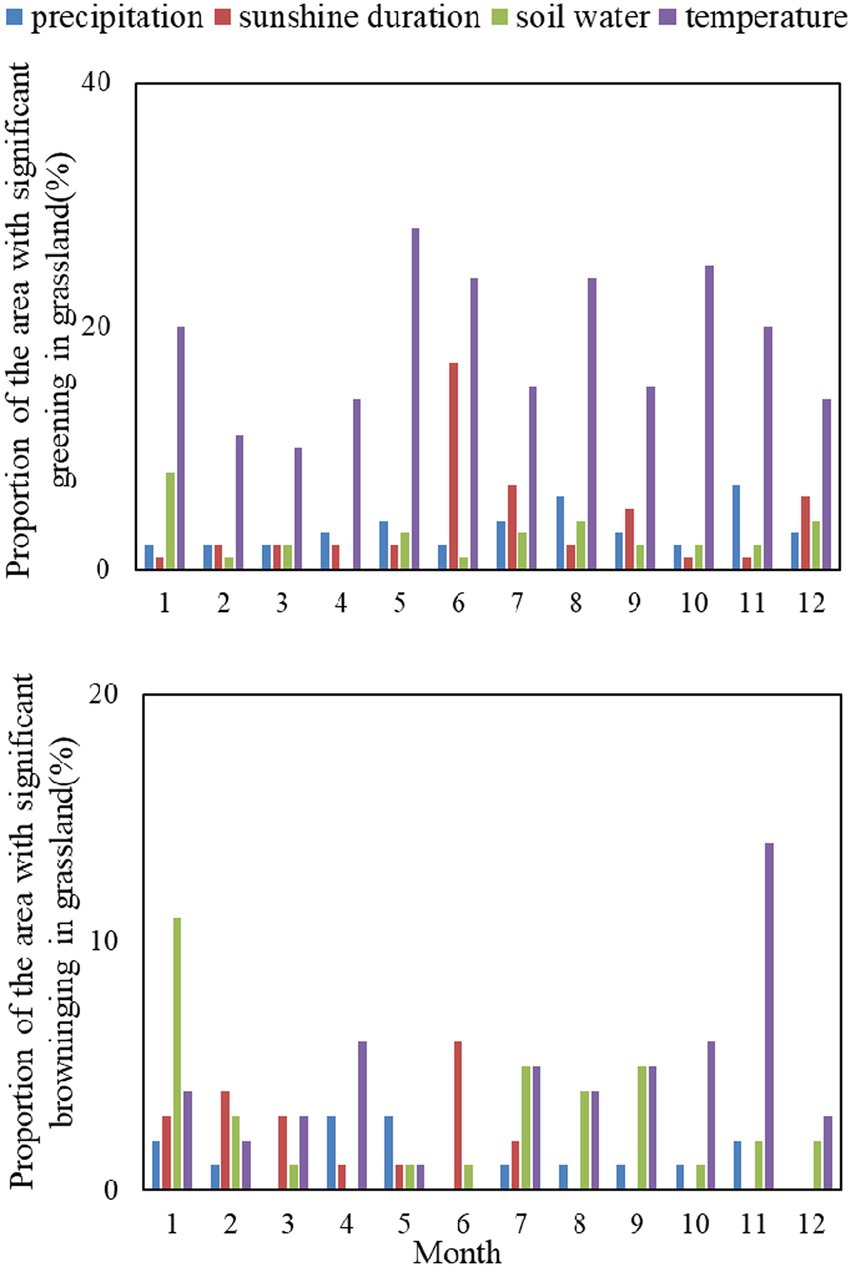
Figure 7. Area proportion of influencing factors in significant change area of grassland.
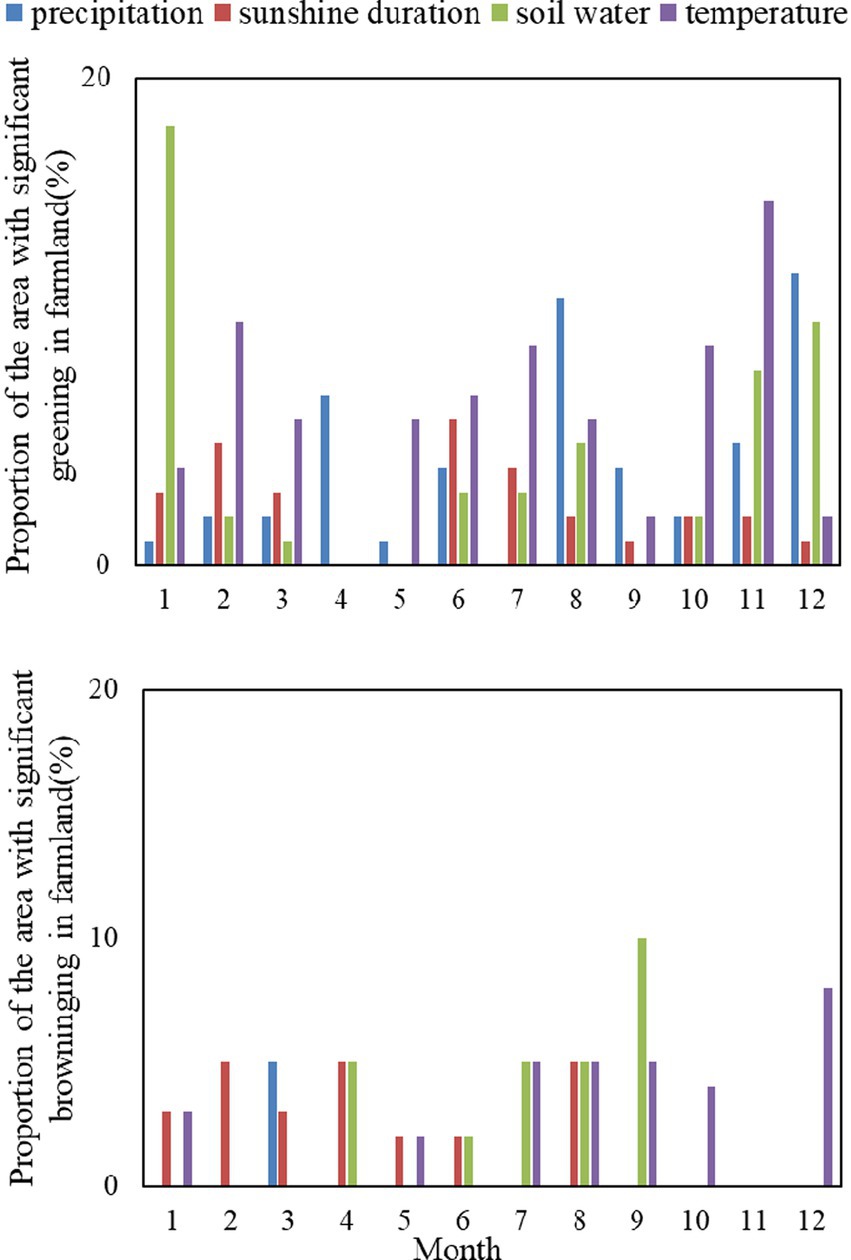
Figure 8. Area proportion of influencing factors in significant change area of farmland.
In areas with significant woodland greening, temperature and sunshine duration were the dominant factors (Figure 6). Temperature was the dominant factor except March, April. The dominant factor in March and April was sunshine duration. In areas with significant woodland browning, temperature was the dominant factor in January–April and June–August. The dominant factor in May, September was the sunshine duration. The dominant factors in October were precipitation and temperature. The dominant factor in November was precipitation. The dominant factors in December were precipitation, soil water, temperature.
In areas with significant grassland greening, temperature was the dominant factor. The dominant area in May was the largest (28%). In areas with significant grassland browning, temperature was the dominant factor in April, October–December. Soil moisture was the dominant factor in January. The dominant factor in February and June was sunshine duration. Sunshine duration and temperature were the dominant factor in March. Precipitation was the dominant factor in May. Soil moisture and temperature were the dominant factors in July–September.
In areas with significant farmland greening, temperature, precipitation and soil moisture were the dominant factors (Figure 7). Among them, temperature was the dominant factor in February, March, May–July, October, November. Precipitation was the dominant factor in April, August, September and December. Soil moisture was the dominant factor in January.
In areas with significant farmland browning, temperature and sunshine duration were the dominant factors in January. Sunshine duration was the dominant factors in February. The dominant factor in March was precipitation. Sunshine duration and soil moisture were the dominant factors in April and June. Soil moisture and temperature were the dominant factors in May and July. The dominant factors in August were sunshine duration, soil moisture and temperature. The dominant factor in September was soil moisture. Temperature was the dominant factor in October and December.
4. Discussion
4.1. The impact of anthropogenic activities was not always greater than that of climate
The overall impact of anthropogenic activities was greater than that of climate change. Zhang and Huang (2019) found that the impact of anthropogenic activities during 1982–2013 was much greater than that of climate change, and vegetation change caused by climate change occurred only in a few areas. More than 20% of the change in NDVI was explained by anthropogenic factors, such as land use, nitrogen fertilizer, and irrigation (Mueller et al., 2014). The same results were obtained in this study after distinguishing between ecosystem types (woodland, grassland, and farmland) and months of the year. However, after distinguishing between positive and negative impacts, the impact of anthropogenic activity was not always greater than that of climate change.
The significant greening of ecosystems was greatly influenced by anthropogenic activities (Piao et al., 2020b). This impact was even greater than the overall impact of climate change on ecosystems. During different months, anthropogenic activities had different effects on the greening of different ecosystem types. The areas with the highest amount of greening in woodland, grassland, and farmland caused by anthropogenic activity were in September, January, and September, respectively. However, the impact of anthropogenic activities on ecosystem browning was not greater than that of climate change in all months. The impact of climate change on significant woodland browning was greater in March, July, September than anthropogenic activities. The impact of climate change on significant grassland browning was greater in August, October than anthropogenic activities. The impact of climate change on significant farmland browning was greater than anthropogenic activities in January, June, September, November. This resulted from a variety of water shortages and droughts caused by the combined impacts of temperature, sunshine duration, precipitation, and other climatic conditions (Li et al., 2018b).
4.2. The dominant factors of ecosystems significant change were different
The dominant factors in different regions were different. Some studies have suggested that precipitation is the most important factor affecting vegetation change, followed by temperature (15%), land cover change (8.6%), population (6.5%), altitude (6.4%), and night lighting (0.4%; Yang et al., 2019). Chen et al. (2019) found that temperature has the greatest impact on significant changes in global vegetation. In the Northern Hemisphere, temperature is the most important factor controlling vegetation growth (Lamchin et al., 2020). This is especially true in the mid-and high latitudes of the Northern hemisphere (Liu et al., 2006). In most arid, semi-arid, tropical, and subtropical regions (outside the equatorial rain belt), vegetation growth is driven mainly by precipitation (Liu et al., 2006; Lamchin et al., 2020). However, at the global scale, temperature and precipitation are not always the most important influencing factors to distinguish vegetation greening and browning areas, ecosystem types, and months of the year.
In areas with significant ecosystems greening, temperature plays a greater role (Zhang et al., 2021). Global warming significantly increases ecosystems greenness by enhancing metabolism and prolonging the growing season (Richardson et al., 2010). However, the dominant factors of significant greening in different ecosystems were different. In addition to temperature, sunshine duration was the dominant factor in significant woodland greening. Sunshine duration affects the biophysical processes of woodlands, such as growth, flowering (Wang et al., 2015). In addition to temperature, precipitation and soil moisture were the dominant factors for significant greening of farmland. This was due to the fact that farmland were more susceptible and less climatically resistant (Ellis, 2015).
In areas with significant ecosystems browning, temperature, precipitation, soil moisture and sunshine duration all have the dominant effect on the three ecosystem types in different months. In the context of global warming, increases in temperature and decreases in precipitation were the main reasons for the significant browning of vegetation (Lamchin et al., 2020). Drying intensifies the browning of woody vegetation (Qiu et al., 2022). Drought in southwest North America has caused the death of regionally dominant tree species and its scope has been extended to humid areas (Breshears et al., 2005). This situation may become more serious and widespread under the effects of global warming in the future (Breshears et al., 2005). In addition, different factors have the dominant effect in different months. Temperature was the main factor that dominated the longest month of significant browning of grassland and woodland. Temperature and soil moisture were the main factors that dominated the longest month of significant browning of farmland. The vulnerability of crops results in a smaller suitable growth temperature range than grassland and woodland (Visser, 2021). And it depends on soil moisture (Arshad et al., 2017).
4.3. Research limitations
The analysis did not include other variables like the maximum or lowest temperature (Shen et al., 2022b). Ecosystems, meantime, have some influence over climate change (Shen et al., 2022a). Additionally, the reliability of the data from remote sensing was not examined in this study. Although MODIS’s land cover type product was used for land cover data, there is some ambiguity in the data creation process (Sevcikova and Nichols, 2021; Hussain et al., 2022).
5. Conclusion
This study first identified the areas of significant change in ecosystems in different months from 1981 to 2015. Among the significant change areas, the dominant areas affected by anthropogenic activities and climate change in different months were identified. Finally, the dominant factors were identified in regions dominated by climate change. The following three conclusions were drawn:
1. Woodland, grassland, and farmland showed a significant greening trend as a whole, but not all significant green areas in all months were greater than the browning areas. The areas with significant changes in the ecosystem were, in decreasing order, woodland, grassland, and farmland in different months. However, the significant vegetation change area of woodland was not always larger than that of grassland and farmland after distinguishing between greening and browning. In the areas with significant greening, the area of woodland was larger than that of farmland and grassland, except for January, May, and June. In areas with significant browning, the area of woodland was larger than that of farmland and grassland, except for September, November, and December.
2. Anthropogenic activities are the leading factors causing significant changes in the global ecosystem. After distinguishing the positive and negative impacts and months, the impact of anthropogenic activities on the significant greening of the ecosystem was greater than that of climate change on the overall significant ecosystem change. However, the impact of anthropogenic activities on significant ecosystem browning was not greater than that of climate change on significant ecosystem greening in all months.
3. The main cause of the ecosystem’s significant greening was temperature. Along with temperature, sunshine duration played a major role in the significant greening of the woodland. The main causes of significant farmland greening were precipitation and soil moisture. Temperature was the main factor that dominated the longest month of significant browning of grassland and woodland. Temperature and soil moisture were the main factors that dominated the longest month of significant browning of farmland.
Data availability statement
The original contributions presented in the study are included in the article/supplementary material, further inquiries can be directed to the corresponding author.
Author contributions
YZ: conceptualization, visualization, and validation. YZ and JS: methodology, formal analysis, and software. YL and YZ: resources. YL, YZ, and JS: data curation. YZ, YL, JS, and XS: writing—original draft preparation and writing—review and editing. YL: supervision. YL and XS: project administration and funding acquisition. All authors contributed to the article and approved the submitted version.
Funding
This study was supported by the National Science Fund for Distinguished Young Scholars of China (41925030), the Youth Innovation Promotion Association of Chinese Academy of Sciences (2020370), and the Applied Basic Research Project of the Science Technology Department of Sichuan Province (2020YJ0428).
Conflict of interest
The authors declare that the research was conducted in the absence of any commercial or financial relationships that could be construed as a potential conflict of interest.
Publisher’s note
All claims expressed in this article are solely those of the authors and do not necessarily represent those of their affiliated organizations, or those of the publisher, the editors and the reviewers. Any product that may be evaluated in this article, or claim that may be made by its manufacturer, is not guaranteed or endorsed by the publisher.
Footnotes
1. ^https://code.earthengine.google.com
2. ^https://cds.climate.copernicus.eu/cdsapp#!/dataset
3. ^https://ladsweb.modaps.eosdis.nasa.gov/search/order/1/MCD12C1--6
References
Arshad, M., Kachele, H., Krupnik, T. J., Amjath-Babu, T. S., Aravindakshan, S., Abbas, A., et al. (2017). Climate variability, farmland value, and farmers' perceptions of climate change: implications for adaptation in rural Pakistan. Int J Sust Dev World 24, 532–544. doi: 10.1080/13504509.2016.1254689
Boone, R. B., Conant, R. T., Sircely, J., Thornton, P. K., and Herrero, M. (2018). Climate change impacts on selected global rangeland ecosystem services. Glob. Chang. Biol. 24, 1382–1393. doi: 10.1111/gcb.13995
Braswell, B. H., Schimel, D. S., Linder, E., and Moore, B. (1997). The response of global terrestrial ecosystems to interannual temperature variability. Science 278, 870–872. doi: 10.1126/science.278.5339.870
Breshears, D. D., Cobb, N. S., Rich, P. M., Price, K. P., Allen, C. D., Balice, R. G., et al. (2005). Regional vegetation die-off in response to global-change-type drought. Proc. Natl. Acad. Sci. U. S. A. 102, 15144–15148. doi: 10.1073/pnas.0505734102
Cahyono, B. K., Aditya, T., and Istarno., (2020). The Least Square adjustment for estimating the tropical peat depth using LiDAR data. Remote Sens. 12:875. doi: 10.3390/rs12050875
Chen, C., He, B., Yuan, W. P., Guo, L. L., and Zhang, Y. F. (2019). Increasing interannual variability of global vegetation greenness. Environ. Res. Lett. 14:124005. doi: 10.1088/1748-9326/ab4ffc
Eastman, J. R., Sangermano, F., Machado, E. A., Rogan, J., and Anyamba, A. (2013). Global trends in seasonality of normalized difference vegetation index (NDVI), 1982-2011. Remote Sens. 5, 4799–4818. doi: 10.3390/rs5104799
Ellis, C. J. (2015). Ancient woodland indicators signal the climate change risk for dispersal-limited species. Ecol. Indic. 53, 106–114. doi: 10.1016/j.ecolind.2015.01.028
Flombaum, P., Yahdjian, L., and Sala, O. E. (2017). Global-change drivers of ecosystem functioning modulated by natural variability and saturating responses. Glob. Chang. Biol. 23, 503–511. doi: 10.1111/gcb.13441
Giling, D. P., Beaumelle, L., Phillips, H. R. P., Cesarz, S., Eisenhauer, N., Ferlian, O., et al. (2019). A niche for ecosystem multifunctionality in global change research. Glob. Chang. Biol. 25, 763–774. doi: 10.1111/gcb.14528
Gret-Regamey, A., and Weibel, B. (2020). Global assessment of mountain ecosystem services using earth observation data. Ecosyst. Serv. 46:213. doi: 10.1016/j.ecoser.2020.101213
Guan, Y. L., Lu, H. W., Yin, C., Xue, Y. X., Jiang, Y. L., Kang, Y., et al. (2020). Vegetation response to climate zone dynamics and its impacts on surface soil water content and albedo in China. Sci. Total Environ. 747:537. doi: 10.1016/j.scitotenv.2020.141537
Guo, E. L., Wang, Y. F., Wang, C. L., Sun, Z. Y., Bao, Y. L., Mandula, N., et al. (2021). NDVI indicates long-term dynamics of vegetation and its driving forces from climatic and anthropogenic factors in Mongolian plateau. Remote Sens. 13:688. doi: 10.3390/rs13040688
Hong, S. K., and Lee, J. A. (2006). Global environmental changes in terrestrial ecosystems. International issues and strategic solutions: introduction. Ecol. Res. 21, 783–787. doi: 10.1007/s11284-006-0032-x
Hou, W. J., Gao, J. B., Wu, S. H., and Dai, E. F. (2015). Interannual variations in growing-season NDVI and its correlation with climate variables in the southwestern karst region of China. Remote Sens. 7, 11105–11124. doi: 10.3390/rs70911105
Hussain, S., Lu, L., Mubeen, M., Nasim, W., Karuppannan, S., Fahad, S., et al. (2022). Spatiotemporal variation in land use land cover in the response to local climate change using multispectral remote sensing data. Land 11:595. doi: 10.3390/land11050595
Ibrahim, Y. Z., Balzter, H., Kaduk, J., and Tucker, C. J. (2015). Land degradation assessment using residual trend analysis of GIMMS NDVI3g, soil moisture and rainfall in sub-Saharan West Africa from 1982 to 2012. Remote Sens. 7, 5471–5494. doi: 10.3390/rs70505471
Lamchin, M., Wang, S. W., Lim, C. H., Ochir, A., Pavel, U., Gebru, B. M., et al. (2020). Understanding global spatio-temporal trends and the relationship between vegetation greenness and climate factors by land cover during 1982-2014. Global Ecology and Conservation 24:299. doi: 10.1016/j.gecco.2020.e01299
Li, W. T., Migliavacca, M., Forkel, M., Walther, S., Reichstein, M., and Orth, R. (2021). Revisiting global vegetation controls using multi-layer soil moisture. Geophys. Res. Lett. 48:856. doi: 10.1029/2021gl092856
Li, D. L., Wu, S. Y., Liu, L. B., Zhang, Y. T., and Li, S. C. (2018a). Vulnerability of the global terrestrial ecosystems to climate change. Glob. Chang. Biol. 24, 4095–4106. doi: 10.1111/gcb.14327
Li, J., Xi, M. F., Wang, L. J., Li, N., Wang, H. W., and Qin, F. (1982). Vegetation responses to climate change and anthropogenic activity in China, to 2018. Int. J. Environ. Res. Public Health 2022:19. doi: 10.3390/ijerph19127391
Li, L. H., Zhang, Y. L., Liu, L. S., Wu, J. S., Wang, Z. F., Li, S. C., et al. (2018b). Spatiotemporal patterns of vegetation greenness change and associated climatic and anthropogenic drivers on the Tibetan plateau during 2000-2015. Remote Sens. 10:525. doi: 10.3390/rs10101525
Liu, Y., Li, Y., Li, S. C., and Motesharrei, S. (2015). Spatial and temporal patterns of global NDVI trends: correlations with climate and human factors. Remote Sens. 7, 13233–13250. doi: 10.3390/rs71013233
Liu, Z. Y., Notaro, M., Kutzbach, J., and Liu, N. (2006). Assessing global vegetation-climate feedbacks from observations. J. Clim. 19, 787–814. doi: 10.1175/jcli3658.1
Liu, Y., Tian, J. Y., Liu, R. H., and Ding, L. Q. (2021). Influences of climate change and human activities on NDVI changes in China. Remote Sens. 13:326. doi: 10.3390/rs13214326
Mann, H. B. (1945). Nonparametric tests against trend. Econometrica 13, 245–259. doi: 10.2307/1907187
Mueller, T., Dressler, G., Tucker, C. J., Pinzon, J. E., Leimgruber, P., Dubayah, R. O., et al. (2014). Human land-use practices Lead to global long-term increases in photosynthetic capacity. Remote Sens. 6, 5717–5731. doi: 10.3390/rs6065717
Nandintsetseg, B., Boldgiv, B., Chang, J. F., Ciais, P., Davaanyam, E., Batbold, A., et al. (2021). Risk and vulnerability of Mongolian grasslands under climate change. Environ. Res. Lett. 16:034035. doi: 10.1088/1748-9326/abdb5b
Nyamekye, C., Schonbrodt-Stitt, S., Amekudzi, L. K., Zoungrana, B. J. B., and Thiel, M. (2021). Usage of MODIS NDVIto evaluate the effect of soil and water conservation measures on vegetation in Burkina Faso. Land Degrad. Dev. 32, 7–19. doi: 10.1002/ldr.3654
Ojima, D. S., Kittel, T. G. F., and Rosswall, T. (1991). Critical issues for UNDERSTANDING global change effects on terrestrial ecosystems. Ecol. Appl. 1, 316–325. doi: 10.2307/1941760
Osmond, B., Ananyev, G., Berry, J., Langdon, C., Kolber, Z., Lin, G. H., et al. (2004). Changing the way we think about global change research: scaling up in experimental ecosystem science. Glob. Chang. Biol. 10, 393–407. doi: 10.1111/j.1529-8817.2003.00747.x
Pan, N. Q., Feng, X. M., Fu, B. J., Wang, S., Ji, F., and Pan, S. F. (2018). Increasing global vegetation browning hidden in overall vegetation greening: insights from time-varying trends. Remote Sens. Environ. 214, 59–72. doi: 10.1016/j.rse.2018.05.018
Pei, H. W., Liu, M. Z., Jia, Y. G., Zhang, H. J., Li, Y. L., and Xiao, Y. X. (2021). The trend of vegetation greening and its drivers in the agro-pastoral ecotone of northern China, 2000-2020. Ecol. Indic. 129:004. doi: 10.1016/j.ecolind.2021.108004
Piao, S., Wang, X., Park, T., Chen, C., Lian, X., He, Y., et al. (2020a). Characteristics, drivers and feedbacks of global greening. Nature Reviews Earth & Environment 1, 14–27. doi: 10.1038/s43017-019-0001-x
Piao, S. L., Wang, X. H., Park, T., Chen, C., Lian, X., He, Y., et al. (2020b). Characteristics, drivers and feedbacks of global greening. Nature Reviews Earth & Environment 1, 14–27. doi: 10.1038/s43017-019-0001-x
Qiu, B. W., Ye, Z. Y., Chen, C. C., Tang, Z. H., Chen, Z. Q., Huang, H. Y., et al. (2022). Dense canopies browning overshadowed by global greening dominant in sparse canopies. Sci. Total Environ. 826:222. doi: 10.1016/j.scitotenv.2022.154222
Richardson, A. D., Black, T. A., Ciais, P., Delbart, N., Friedl, M. A., Gobron, N., et al. (2010). Influence of spring and autumn phenological transitions on forest ecosystem productivity. Philosophical Transactions of the Royal Society B-Biological Sciences 365, 3227–3246. doi: 10.1098/rstb.2010.0102
Sanchez-Robles, J. M., Garcia-Castano, J. L., Balao, F., Garcia, C., Terrab, A., and Talavera, S. (2022). Anthropogenic deforestation and climate dryness as drivers of demographic decline and genetic erosion in the southernmost European fir forests. Eur. J. For. Res. 141, 649–663. doi: 10.1007/s10342-022-01467-3
Scholes, R. J., and vanBreemen, N. (1997). The effects of global change on tropical ecosystems. Geoderma 79, 9–24. doi: 10.1016/s0016-7061(97)00036-0
Sevcikova, H., and Nichols, B. (2021). Land use uncertainty in transportation forecast. J. Transp. Land Use 14. doi: 10.5198/jtlu.2021.1853
Shen, X. J., Liu, B. H., Henderson, M., Wang, L., Jiang, M., and Lu, X. G. (2022a). Vegetation greening, extended growing seasons, and temperature feedbacks in warming temperate grasslands of China. J. Clim. 35, 5103–5117. doi: 10.1175/jcli-d-21-0325.1
Shen, X. J., Liu, Y. W., Zhang, J. Q., Wang, Y. J., Ma, R., Liu, B. H., et al. (2022b). Asymmetric impacts of diurnal warming on vegetation carbon sequestration of marshes in the Qinghai Tibet plateau. Glob. Biogeochem. Cycles 36:396. doi: 10.1029/2022gb007396
van Wijk, M. T., Clemmensen, K. E., Shaver, G. R., Williams, M., Callaghan, T. V., Chapin, F. S., et al. (2004). Long-term ecosystem level experiments at Toolik Lake, Alaska, and at Abisko, northern Sweden: generalizations and differences in ecosystem and plant type responses to global change. Glob. Chang. Biol. 10, 105–123. doi: 10.1111/j.1365-2486.2003.00719.x
Visser, O. (2021). Persistent farmland imaginaries: celebration of fertile soil and the recurrent ignorance of climate. Agric. Hum. Values 38, 313–326. doi: 10.1007/s10460-020-10154-1
Wang, M. J., Fan, L., Frappart, F., Ciais, P., Sun, R., Liu, Y., et al. (2021). An alternative AMSR2 vegetation optical depth for monitoring vegetation at large scales. Remote Sens. Environ. 263:556. doi: 10.1016/j.rse.2021.112556
Wang, H. S., Liu, D. S., Lin, H., Montenegro, A., and Zhu, X. L. (2015). NDVI and vegetation phenology dynamics under the influence of sunshine duration on the Tibetan plateau. Int. J. Climatol. 35, 687–698. doi: 10.1002/joc.4013
Wang, S. H., Yang, D., Li, Z., Liu, L. Y., Huang, C. P., and Zhang, L. F. (2019). A global sensitivity analysis of commonly used satellite-derived vegetation indices for homogeneous canopies based on model simulation and random Forest learning. Remote Sens. 11:547. doi: 10.3390/rs11212547
Wang, Y. M., Zhang, Z. X., and Chen, X. The dominant driving force of Forest change in the Yangtze River basin, China: Climate Variation or Anthropogenic Activities? Forests. (2022). 13.
Wanyama, D., Moore, N. J., and Dahlin, K. M. (2020). Persistent vegetation greening and Browning trends related to natural and human activities in the mount Elgon ecosystem. Remote Sens. 12:113. doi: 10.3390/rs12132113
Wen, Z. F., Wu, S. J., Chen, J. L., and Lu, M. Q. (2017). NDVI indicated long-term interannual changes in vegetation activities and their responses to climatic and anthropogenic factors in the three gorges reservoir region. China. Science of the Total Environment 574, 947–959. doi: 10.1016/j.scitotenv.2016.09.049
Williams, S. E., Hobday, A. J., Falconi, L., Hero, J. M., Holbrook, N. J., Capon, S., et al. (2020). Research priorities for natural ecosystems in a changing global climate. Glob. Chang. Biol. 26, 410–416. doi: 10.1111/gcb.14856
Wu, G. L., Cheng, Z., Alatalo, J. M., Zhao, J. X., and Liu, Y. (2021a). Climate warming consistently reduces grassland ecosystem productivity. Earths. Future 9:837. doi: 10.1029/2020ef001837
Wu, J. S., Li, M., Zhang, X. Z., Fiedler, S., Gao, Q. Z., Zhou, Y. T., et al. (2021b). Disentangling climatic and anthropogenic contributions to nonlinear dynamics of alpine grassland productivity on the Qinghai-Tibetan plateau. J. Environ. Manag. 281:875. doi: 10.1016/j.jenvman.2020.111875
Xie, X. M., He, B., Guo, L. L., Huang, L., Hao, X. M., Zhang, Y. F., et al. (2022). Revisiting dry season vegetation dynamics in the Amazon rainforest using different satellite vegetation datasets. Agric. For. Meteorol. 312:704. doi: 10.1016/j.agrformet.2021.108704
Yang, Y. J., Wang, S. J., Bai, X. Y., Tan, Q., Li, Q., Wu, L. H., et al. (2019). Factors affecting long-term trends in global NDVI. Forests 10:372. doi: 10.3390/f10050372
Zhang, D., Geng, X. L., Chen, W. X., Fang, L., Yao, R., Wang, X. R., et al. (2021). Inconsistency of global vegetation dynamics driven by climate change: evidences from spatial regression. Remote Sens. 13:442. doi: 10.3390/rs13173442
Keywords: global change, ecosystem, NDVI, vegetation, climate change, anthropogenic activity
Citation: Zhang Y, Sun J, Lu Y and Song X (2022) Revealing the dominant factors of vegetation change in global ecosystems. Front. Ecol. Evol. 10:1000602. doi: 10.3389/fevo.2022.1000602
Edited by:
Jorge Capelo, University of Porto, PortugalReviewed by:
Daniele Peano, Ca' Foscari University of Venice, ItalyXiangjin Shen, Chinese Academy of Sciences, China
Copyright © 2022 Zhang, Sun, Lu and Song. This is an open-access article distributed under the terms of the Creative Commons Attribution License (CC BY). The use, distribution or reproduction in other forums is permitted, provided the original author(s) and the copyright owner(s) are credited and that the original publication in this journal is cited, in accordance with accepted academic practice. No use, distribution or reproduction is permitted which does not comply with these terms.
*Correspondence: Xueqian Song, c3hxQGN1aXQuZWR1LmNu