In the published article, there was an error in the legend for Table 3 as published. All the negative signs are not marked. The corrected legend appears below.
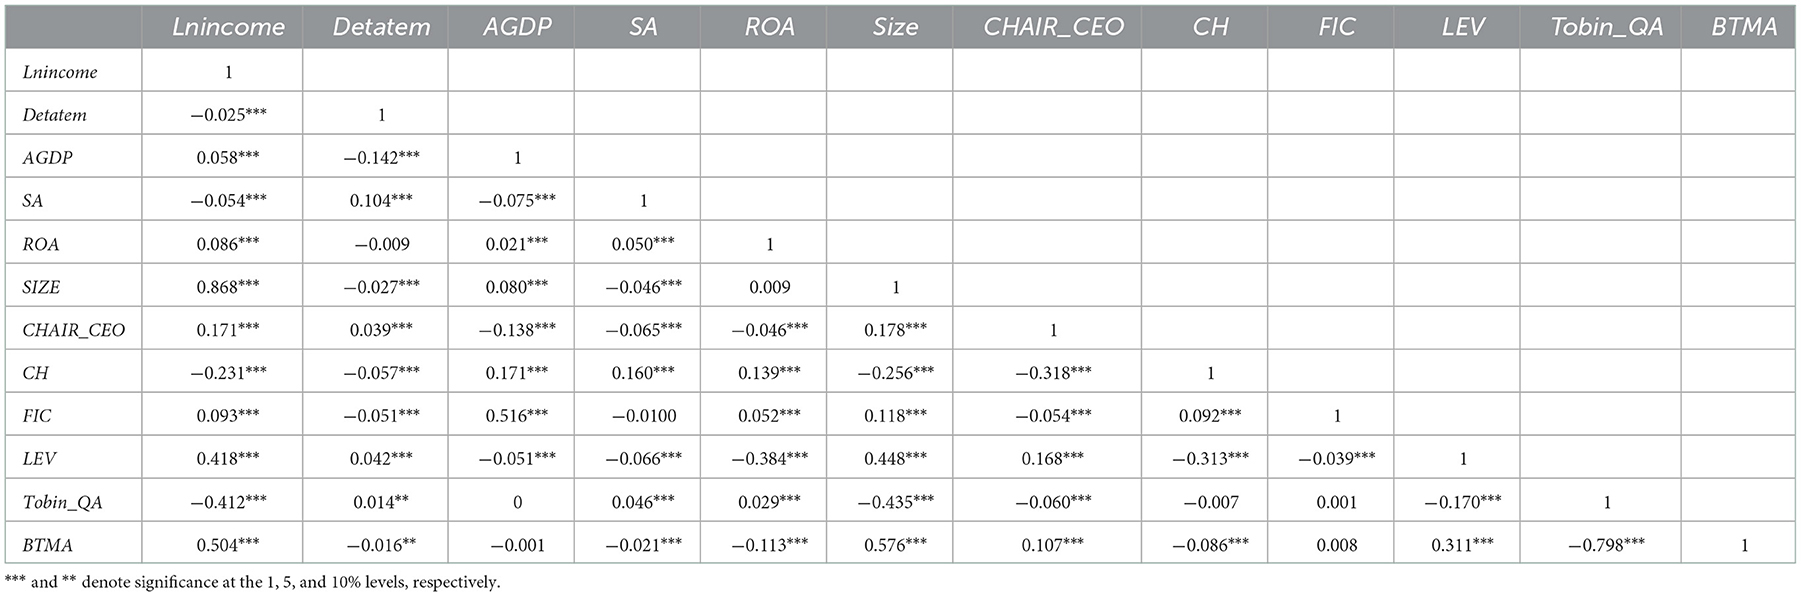
Table 3
| Lnincome | Detatem | AGDP | SA | ROA | Size | CHAIR_CEO | CH | FIC | LEV | Tobin_QA | BTMA | |
|---|---|---|---|---|---|---|---|---|---|---|---|---|
| Lnincome | 1 | |||||||||||
| Detatem | −0.025*** | 1 | ||||||||||
| AGDP | 0.058*** | −0.142*** | 1 | |||||||||
| SA | −0.054*** | 0.104*** | −0.075*** | 1 | ||||||||
| ROA | 0.086*** | −0.009 | 0.021*** | 0.050*** | 1 | |||||||
| SIZE | 0.868*** | −0.027*** | 0.080*** | −0.046*** | 0.009 | 1 | ||||||
| CHAIR_CEO | 0.171*** | 0.039*** | −0.138*** | −0.065*** | −0.046*** | 0.178*** | 1 | |||||
| CH | −0.231*** | −0.057*** | 0.171*** | 0.160*** | 0.139*** | −0.256*** | −0.318*** | 1 | ||||
| FIC | 0.093*** | −0.051*** | 0.516*** | −0.0100 | 0.052*** | 0.118*** | −0.054*** | 0.092*** | 1 | |||
| LEV | 0.418*** | 0.042*** | −0.051*** | −0.066*** | −0.384*** | 0.448*** | 0.168*** | −0.313*** | −0.039*** | 1 | ||
| Tobin_QA | −0.412*** | 0.014** | 0 | 0.046*** | 0.029*** | −0.435*** | −0.060*** | −0.007 | 0.001 | −0.170*** | 1 | |
| BTMA | 0.504*** | −0.016** | −0.001 | −0.021*** | −0.113*** | 0.576*** | 0.107*** | −0.086*** | 0.008 | 0.311*** | −0.798*** | 1 |
Correlation coefficients.
*** and ** denote significance at the 1, 5, and 10% levels, respectively.
In the published article, there was an error in the legend for Table 4 as published. All the negative signs are not marked. The corrected legend appears below.
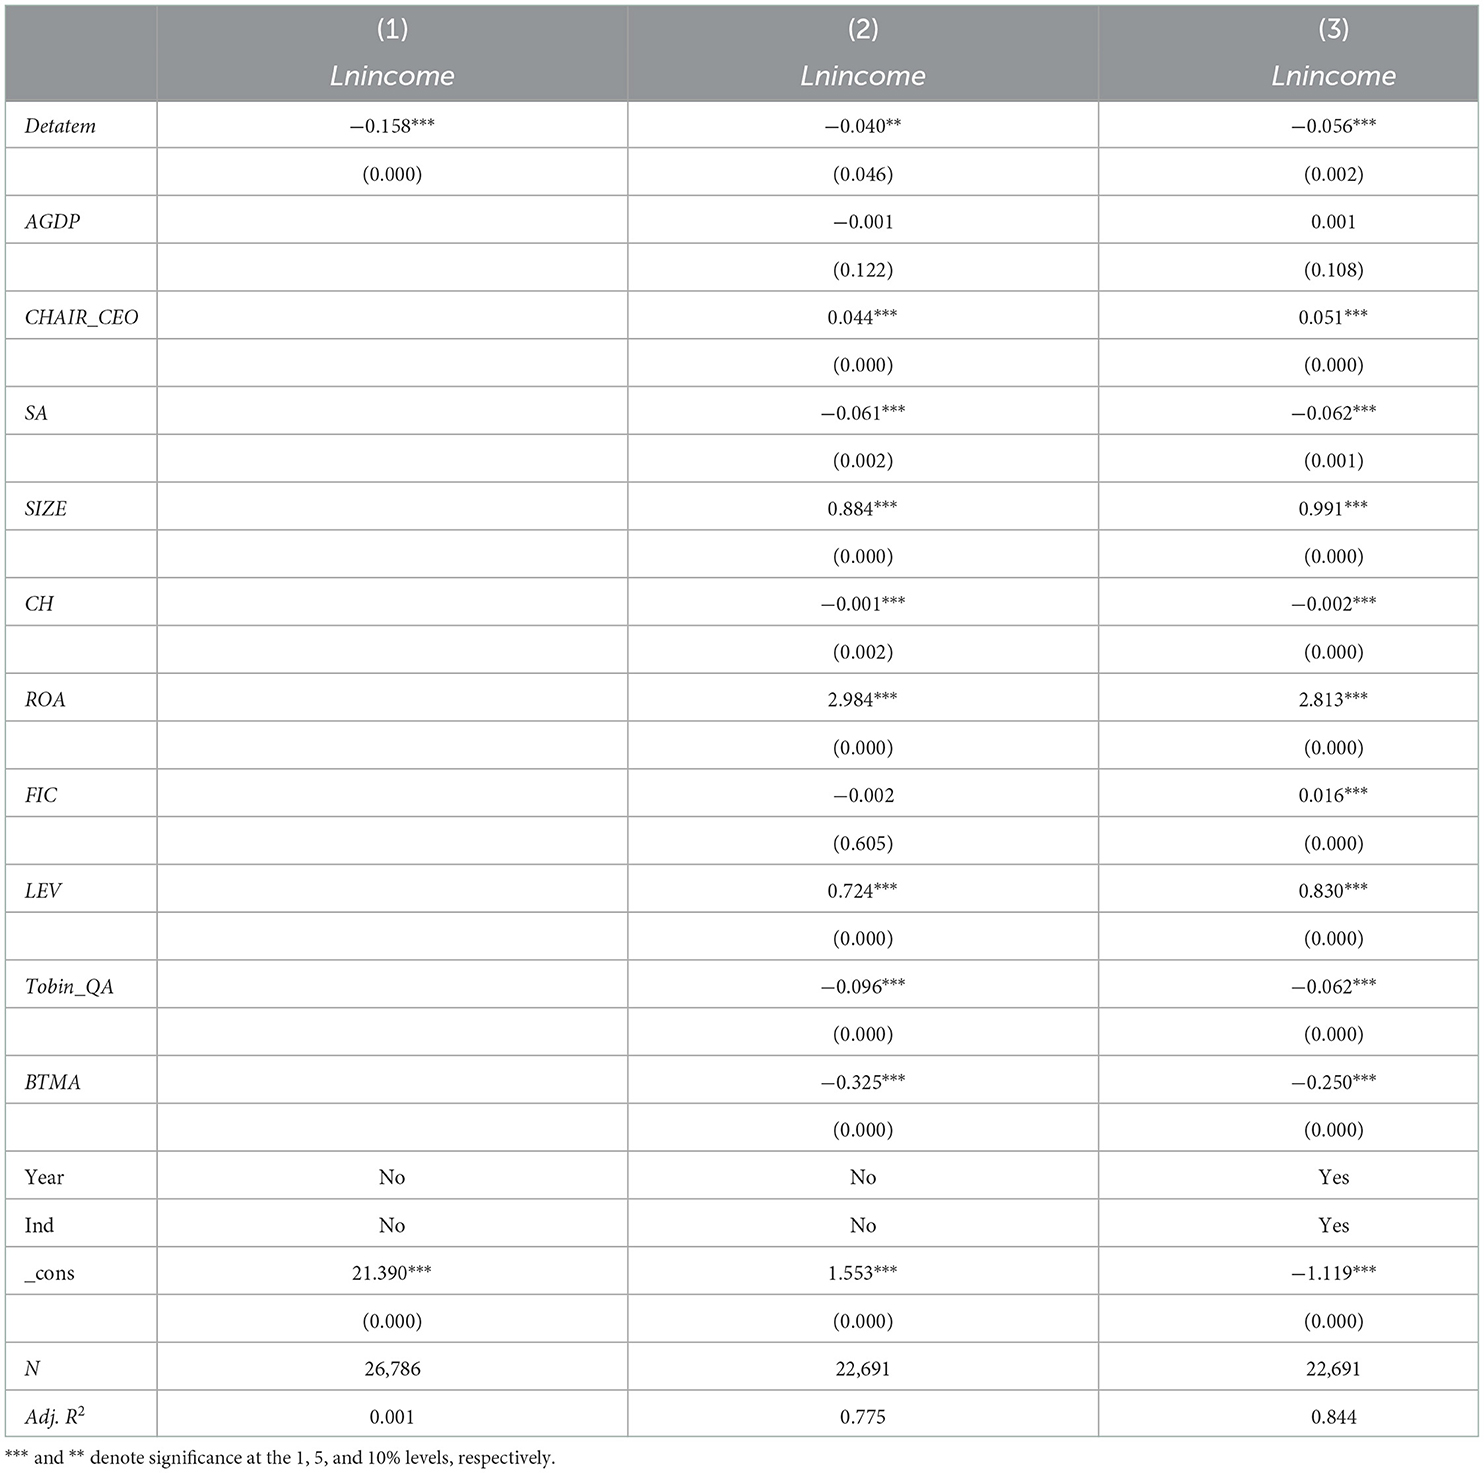
Table 4
| (1) | (2) | (3) | |
|---|---|---|---|
| Lnincome | Lnincome | Lnincome | |
| Detatem | −0.158*** | −0.040** | −0.056*** |
| (0.000) | (0.046) | (0.002) | |
| AGDP | −0.001 | 0.001 | |
| (0.122) | (0.108) | ||
| CHAIR_CEO | 0.044*** | 0.051*** | |
| (0.000) | (0.000) | ||
| SA | −0.061*** | −0.062*** | |
| (0.002) | (0.001) | ||
| SIZE | 0.884*** | 0.991*** | |
| (0.000) | (0.000) | ||
| CH | −0.001*** | −0.002*** | |
| (0.002) | (0.000) | ||
| ROA | 2.984*** | 2.813*** | |
| (0.000) | (0.000) | ||
| FIC | −0.002 | 0.016*** | |
| (0.605) | (0.000) | ||
| LEV | 0.724*** | 0.830*** | |
| (0.000) | (0.000) | ||
| Tobin_QA | −0.096*** | −0.062*** | |
| (0.000) | (0.000) | ||
| BTMA | −0.325*** | −0.250*** | |
| (0.000) | (0.000) | ||
| Year | No | No | Yes |
| Ind | No | No | Yes |
| _cons | 21.390*** | 1.553*** | −1.119*** |
| (0.000) | (0.000) | (0.000) | |
| N | 26,786 | 22,691 | 22,691 |
| Adj. R2 | 0.001 | 0.775 | 0.844 |
Impact of climate change on enterprises' sales revenue.
*** and ** denote significance at the 1, 5, and 10% levels, respectively.
In the published article, there was an error in the legend for Table 5 as published. All the negative signs are not marked. The corrected legend appears below.
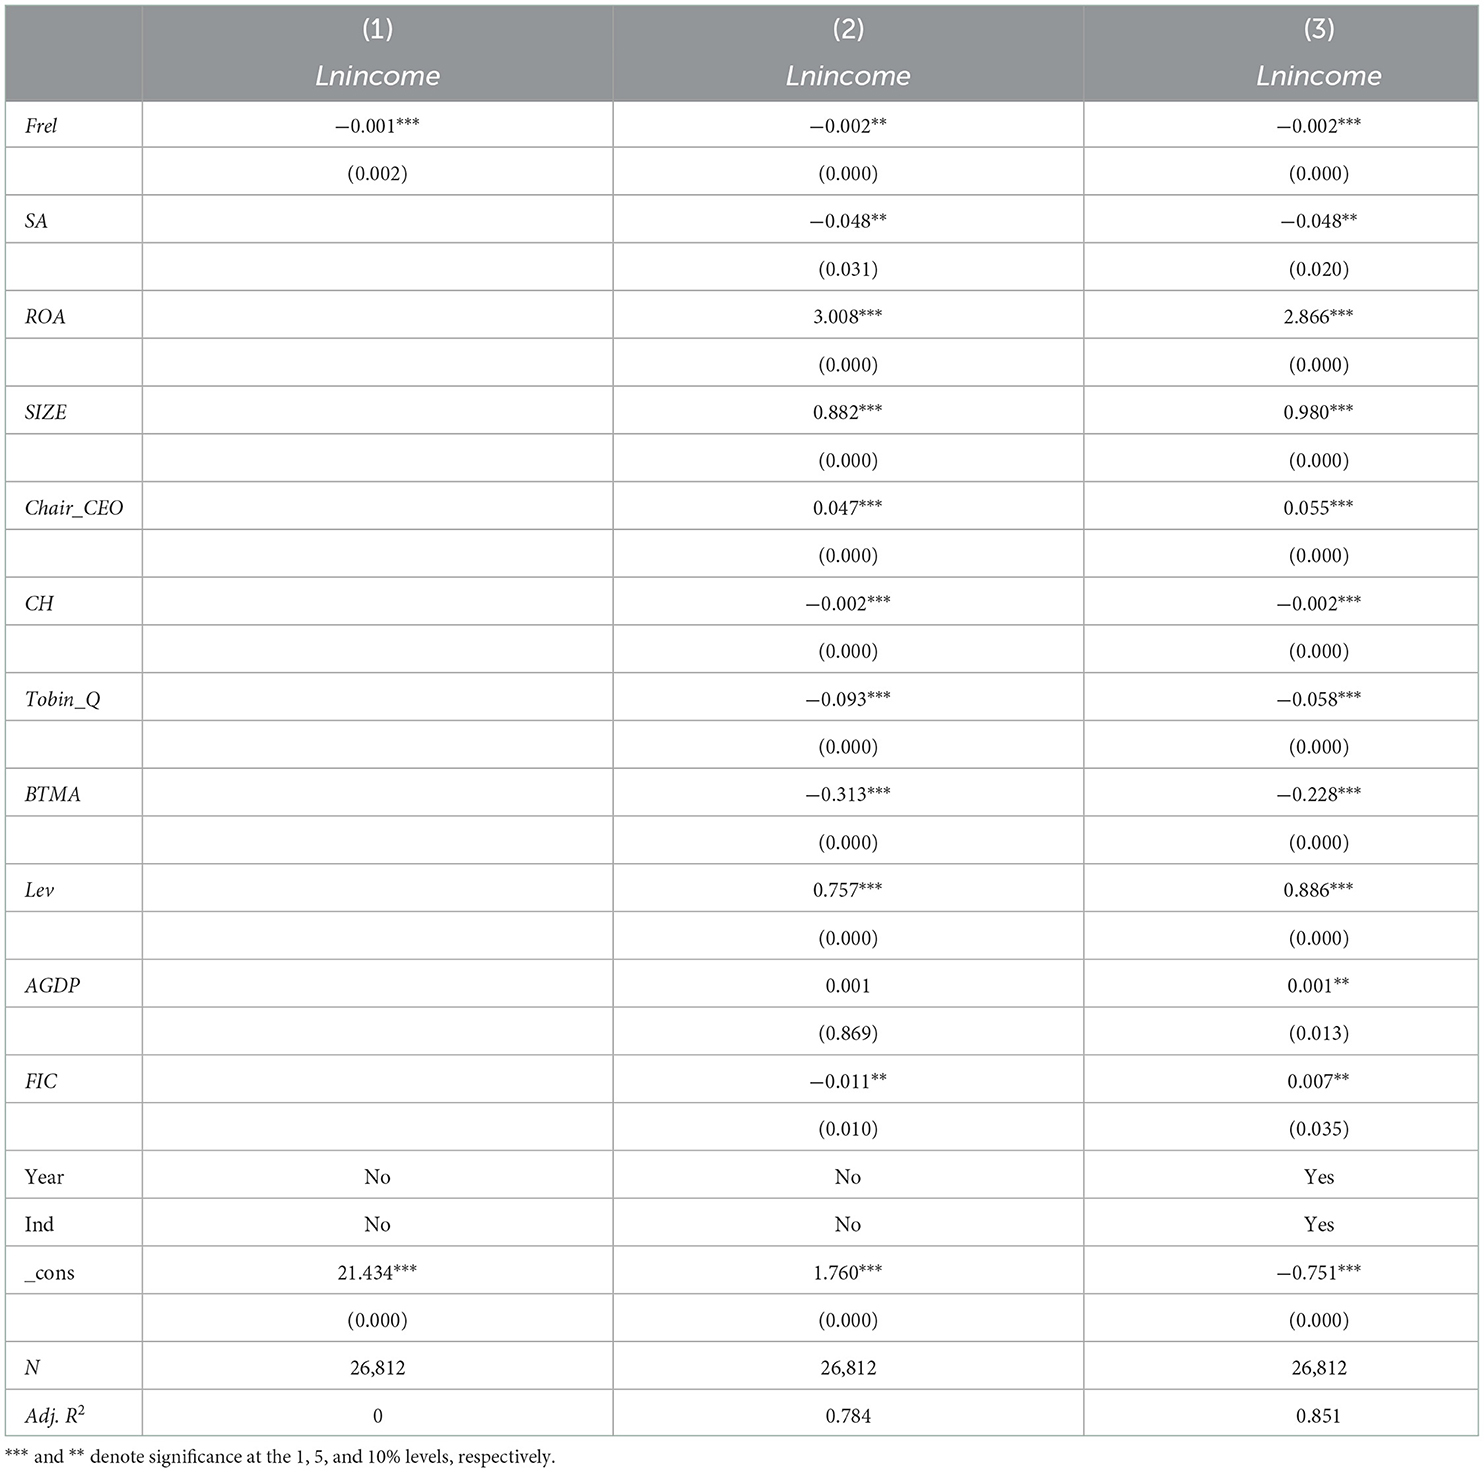
Table 5
| (1) | (2) | (3) | |
|---|---|---|---|
| Lnincome | Lnincome | Lnincome | |
| Frel | −0.001*** | −0.002** | −0.002*** |
| (0.002) | (0.000) | (0.000) | |
| SA | −0.048** | −0.048** | |
| (0.031) | (0.020) | ||
| ROA | 3.008*** | 2.866*** | |
| (0.000) | (0.000) | ||
| SIZE | 0.882*** | 0.980*** | |
| (0.000) | (0.000) | ||
| Chair_CEO | 0.047*** | 0.055*** | |
| (0.000) | (0.000) | ||
| CH | −0.002*** | −0.002*** | |
| (0.000) | (0.000) | ||
| Tobin_Q | −0.093*** | −0.058*** | |
| (0.000) | (0.000) | ||
| BTMA | −0.313*** | −0.228*** | |
| (0.000) | (0.000) | ||
| Lev | 0.757*** | 0.886*** | |
| (0.000) | (0.000) | ||
| AGDP | 0.001 | 0.001** | |
| (0.869) | (0.013) | ||
| FIC | −0.011** | 0.007** | |
| (0.010) | (0.035) | ||
| Year | No | No | Yes |
| Ind | No | No | Yes |
| _cons | 21.434*** | 1.760*** | −0.751*** |
| (0.000) | (0.000) | (0.000) | |
| N | 26,812 | 26,812 | 26,812 |
| Adj. R2 | 0 | 0.784 | 0.851 |
Regression results when using the extreme climate measure.
*** and ** denote significance at the 1, 5, and 10% levels, respectively.
In the published article, there was an error in the legend for Table 6 as published. All the negative signs are not marked. The corrected legend appears below.
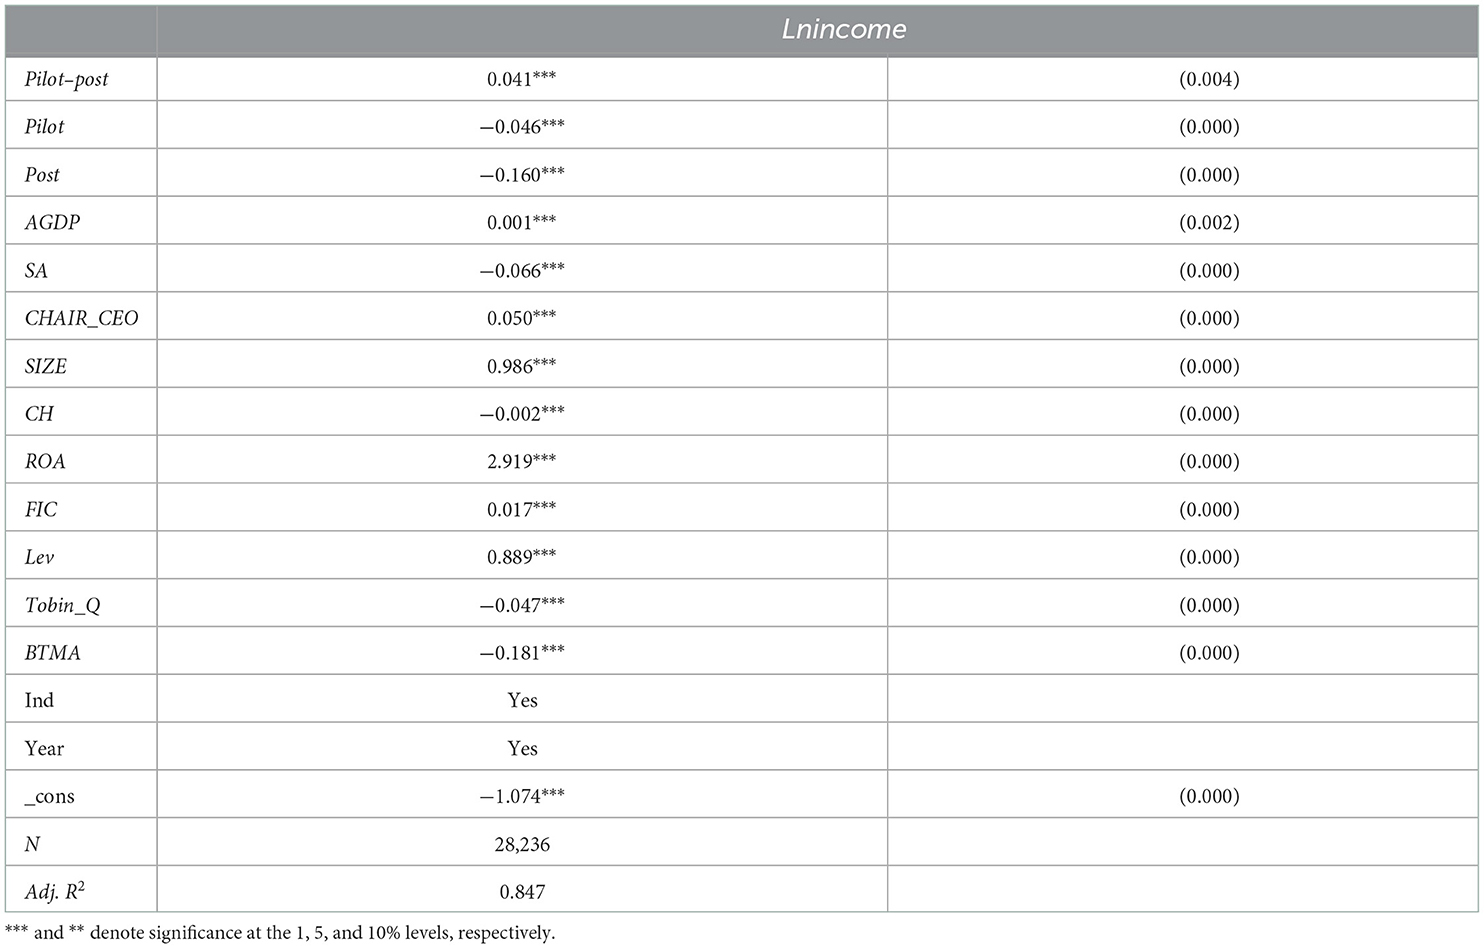
Table 6
| Lnincome | ||
|---|---|---|
| Pilot–post | 0.041*** | (0.004) |
| Pilot | −0.046*** | (0.000) |
| Post | −0.160*** | (0.000) |
| AGDP | 0.001*** | (0.002) |
| SA | −0.066*** | (0.000) |
| CHAIR_CEO | 0.050*** | (0.000) |
| SIZE | 0.986*** | (0.000) |
| CH | −0.002*** | (0.000) |
| ROA | 2.919*** | (0.000) |
| FIC | 0.017*** | (0.000) |
| Lev | 0.889*** | (0.000) |
| Tobin_Q | −0.047*** | (0.000) |
| BTMA | −0.181*** | (0.000) |
| Ind | Yes | |
| Year | Yes | |
| _cons | −1.074*** | (0.000) |
| N | 28,236 | |
| Adj. R2 | 0.847 |
Impact of low-carbon city pilot policy on enterprises' sales revenue.
*** and ** denote significance at the 1, 5, and 10% levels, respectively.
In the published article, there was an error in the legend for Table 7 as published. All the negative signs are not marked. The corrected legend appears below.
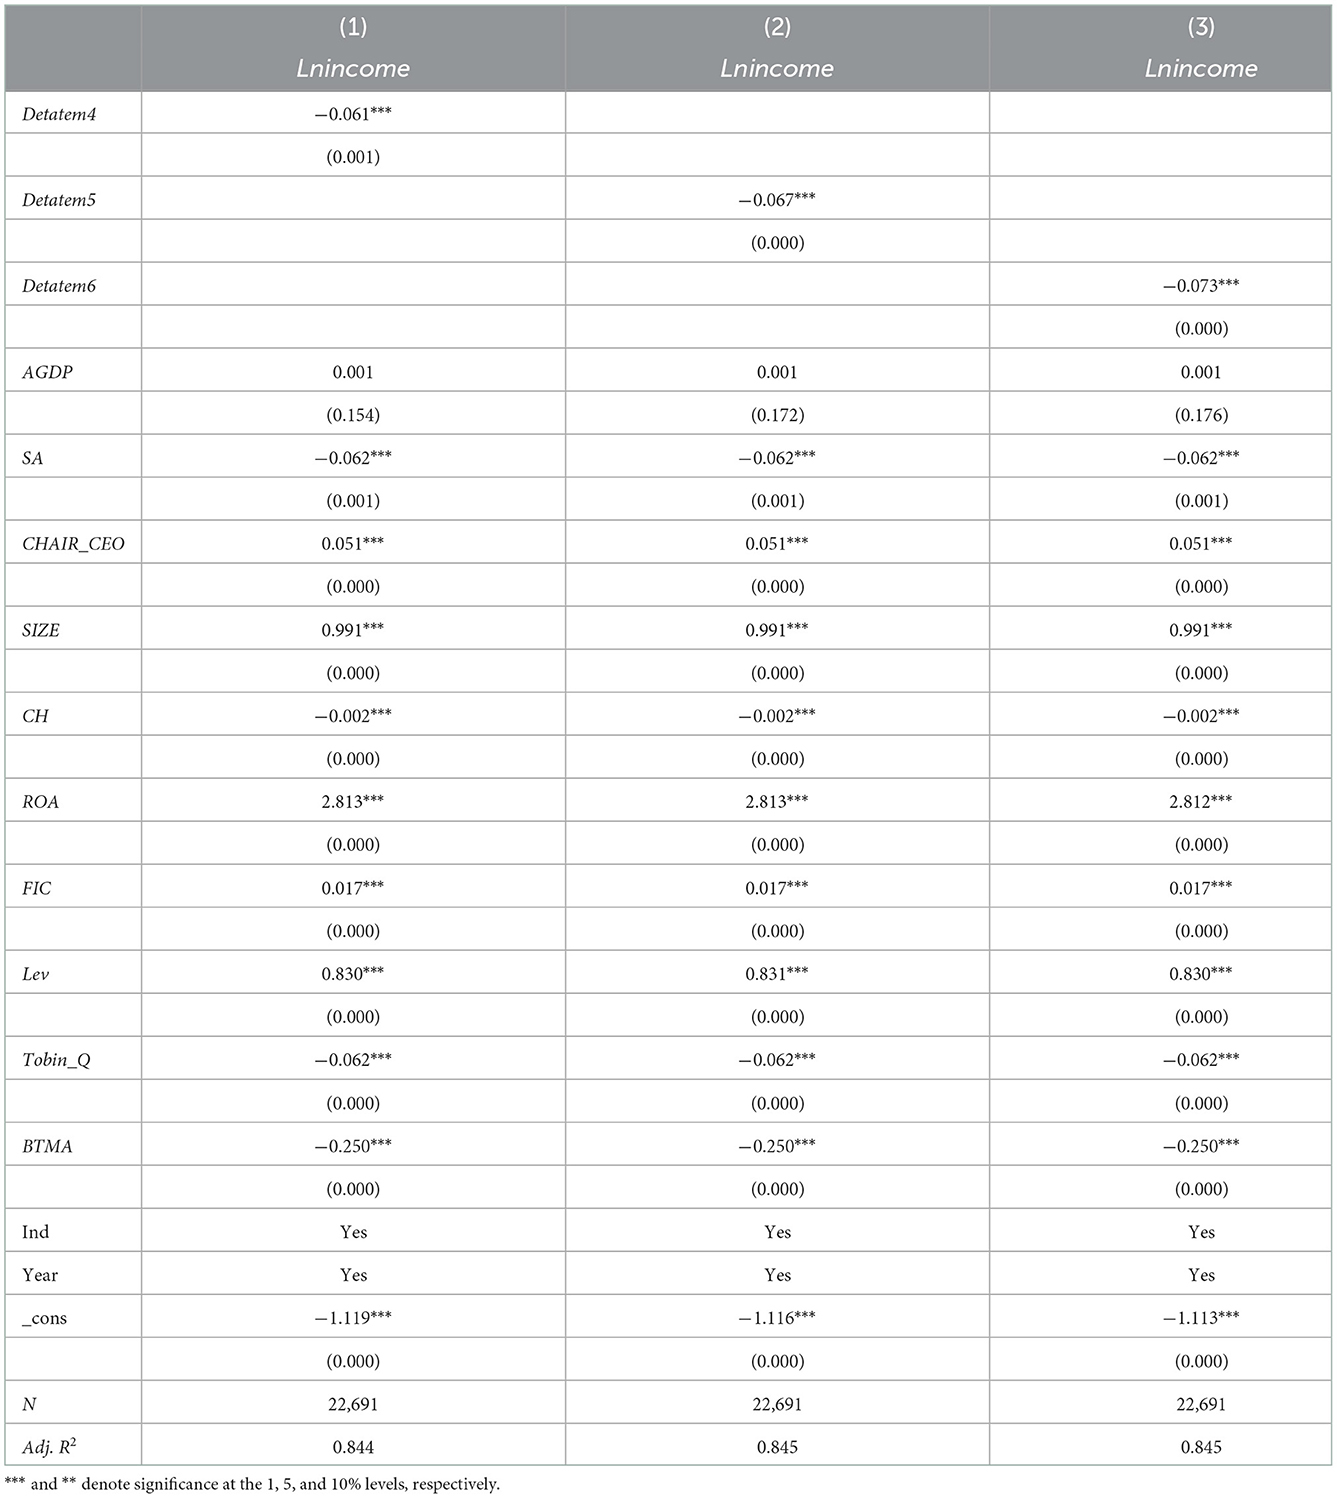
Table 7
| (1) | (2) | (3) | |
|---|---|---|---|
| Lnincome | Lnincome | Lnincome | |
| Detatem4 | −0.061*** | ||
| (0.001) | |||
| Detatem5 | −0.067*** | ||
| (0.000) | |||
| Detatem6 | −0.073*** | ||
| (0.000) | |||
| AGDP | 0.001 | 0.001 | 0.001 |
| (0.154) | (0.172) | (0.176) | |
| SA | −0.062*** | −0.062*** | −0.062*** |
| (0.001) | (0.001) | (0.001) | |
| CHAIR_CEO | 0.051*** | 0.051*** | 0.051*** |
| (0.000) | (0.000) | (0.000) | |
| SIZE | 0.991*** | 0.991*** | 0.991*** |
| (0.000) | (0.000) | (0.000) | |
| CH | −0.002*** | −0.002*** | −0.002*** |
| (0.000) | (0.000) | (0.000) | |
| ROA | 2.813*** | 2.813*** | 2.812*** |
| (0.000) | (0.000) | (0.000) | |
| FIC | 0.017*** | 0.017*** | 0.017*** |
| (0.000) | (0.000) | (0.000) | |
| Lev | 0.830*** | 0.831*** | 0.830*** |
| (0.000) | (0.000) | (0.000) | |
| Tobin_Q | −0.062*** | −0.062*** | −0.062*** |
| (0.000) | (0.000) | (0.000) | |
| BTMA | −0.250*** | −0.250*** | −0.250*** |
| (0.000) | (0.000) | (0.000) | |
| Ind | Yes | Yes | Yes |
| Year | Yes | Yes | Yes |
| _cons | −1.119*** | −1.116*** | −1.113*** |
| (0.000) | (0.000) | (0.000) | |
| N | 22,691 | 22,691 | 22,691 |
| Adj. R2 | 0.844 | 0.845 | 0.845 |
Impact of temperature variation difference on sales revenue.
*** and ** denote significance at the 1, 5, and 10% levels, respectively.
In the published article, there was an error in the legend for Table 8 as published. All the negative signs are not marked. The corrected legend appears below.
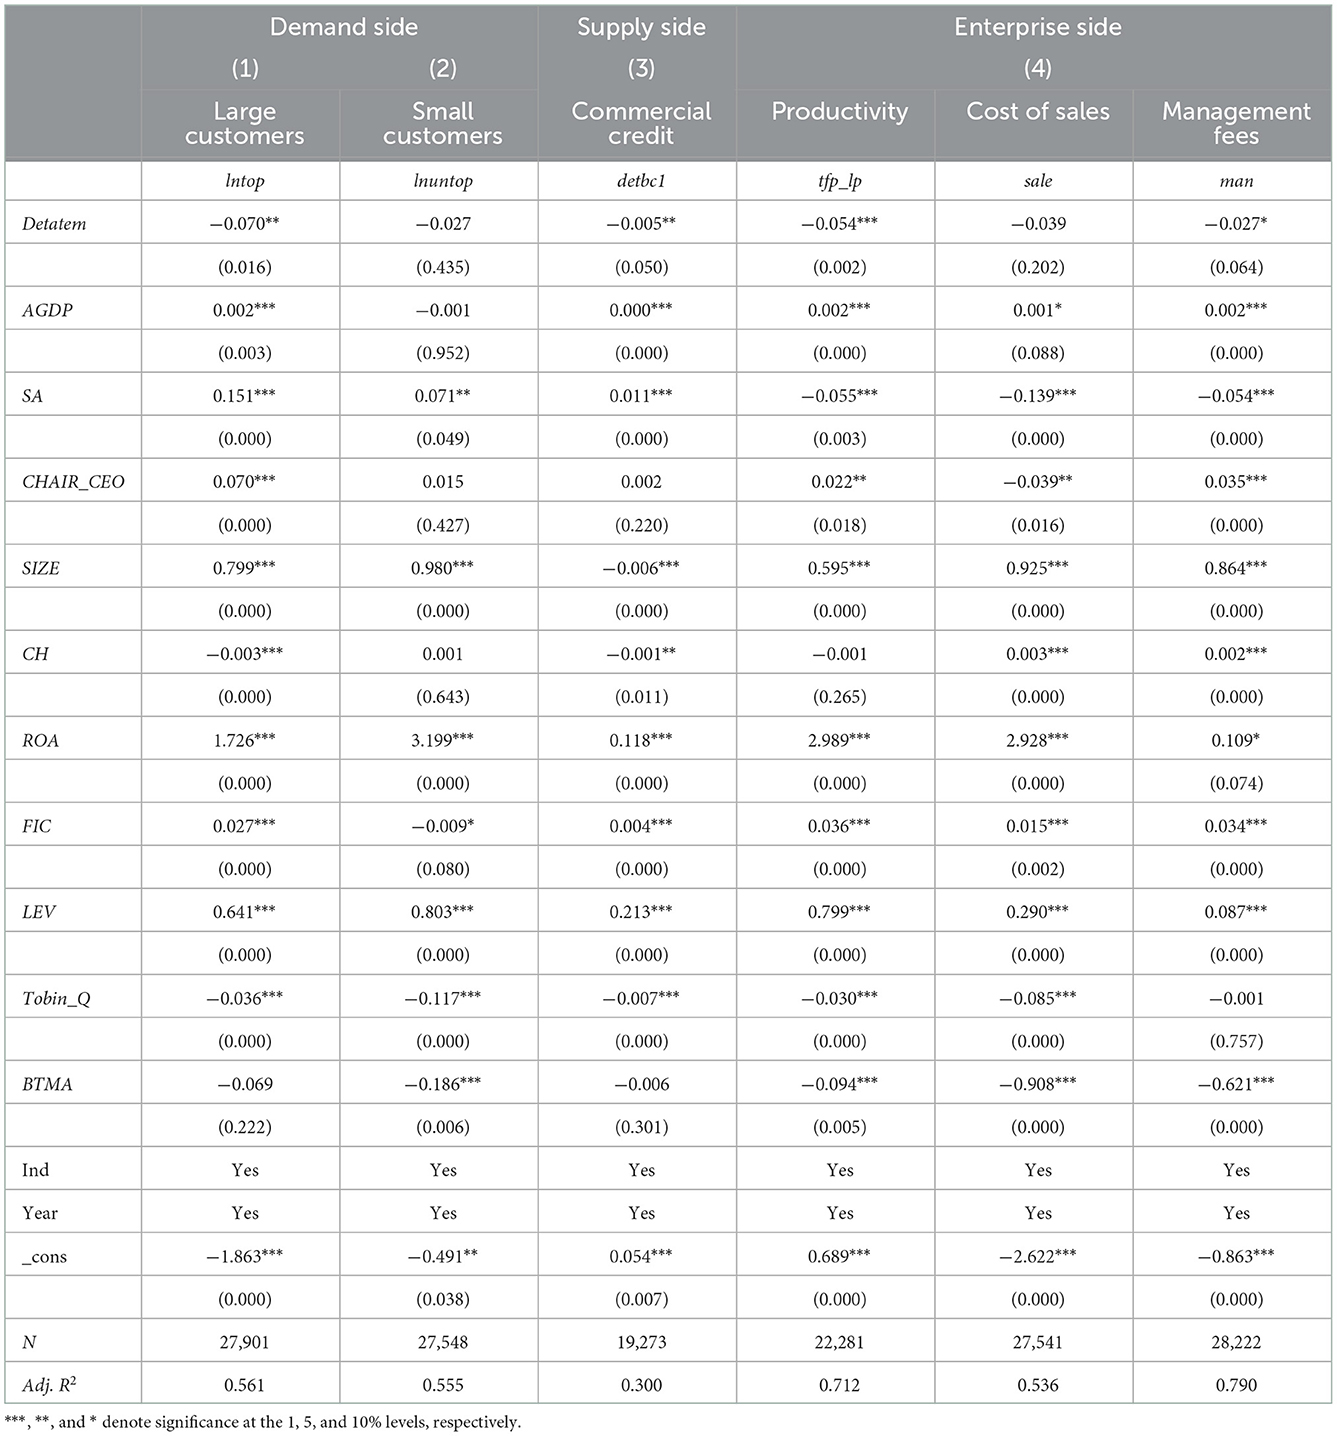
Table 8
| Demand side | Supply side | Enterprise side | ||||
|---|---|---|---|---|---|---|
| (1) | (2) | (3) | (4) | |||
| Large customers | Small customers | Commercial credit | Productivity | Cost of sales | Management fees | |
| lntop | lnuntop | detbc1 | tfp_lp | sale | man | |
| Detatem | −0.070** | −0.027 | −0.005** | −0.054*** | −0.039 | −0.027* |
| (0.016) | (0.435) | (0.050) | (0.002) | (0.202) | (0.064) | |
| AGDP | 0.002*** | −0.001 | 0.000*** | 0.002*** | 0.001* | 0.002*** |
| (0.003) | (0.952) | (0.000) | (0.000) | (0.088) | (0.000) | |
| SA | 0.151*** | 0.071** | 0.011*** | −0.055*** | −0.139*** | −0.054*** |
| (0.000) | (0.049) | (0.000) | (0.003) | (0.000) | (0.000) | |
| CHAIR_CEO | 0.070*** | 0.015 | 0.002 | 0.022** | −0.039** | 0.035*** |
| (0.000) | (0.427) | (0.220) | (0.018) | (0.016) | (0.000) | |
| SIZE | 0.799*** | 0.980*** | −0.006*** | 0.595*** | 0.925*** | 0.864*** |
| (0.000) | (0.000) | (0.000) | (0.000) | (0.000) | (0.000) | |
| CH | −0.003*** | 0.001 | −0.001** | −0.001 | 0.003*** | 0.002*** |
| (0.000) | (0.643) | (0.011) | (0.265) | (0.000) | (0.000) | |
| ROA | 1.726*** | 3.199*** | 0.118*** | 2.989*** | 2.928*** | 0.109* |
| (0.000) | (0.000) | (0.000) | (0.000) | (0.000) | (0.074) | |
| FIC | 0.027*** | −0.009* | 0.004*** | 0.036*** | 0.015*** | 0.034*** |
| (0.000) | (0.080) | (0.000) | (0.000) | (0.002) | (0.000) | |
| LEV | 0.641*** | 0.803*** | 0.213*** | 0.799*** | 0.290*** | 0.087*** |
| (0.000) | (0.000) | (0.000) | (0.000) | (0.000) | (0.000) | |
| Tobin_Q | −0.036*** | −0.117*** | −0.007*** | −0.030*** | −0.085*** | −0.001 |
| (0.000) | (0.000) | (0.000) | (0.000) | (0.000) | (0.757) | |
| BTMA | −0.069 | −0.186*** | −0.006 | −0.094*** | −0.908*** | −0.621*** |
| (0.222) | (0.006) | (0.301) | (0.005) | (0.000) | (0.000) | |
| Ind | Yes | Yes | Yes | Yes | Yes | Yes |
| Year | Yes | Yes | Yes | Yes | Yes | Yes |
| _cons | −1.863*** | −0.491** | 0.054*** | 0.689*** | −2.622*** | −0.863*** |
| (0.000) | (0.038) | (0.007) | (0.000) | (0.000) | (0.000) | |
| N | 27,901 | 27,548 | 19,273 | 22,281 | 27,541 | 28,222 |
| Adj. R2 | 0.561 | 0.555 | 0.300 | 0.712 | 0.536 | 0.790 |
Regression results for the mechanism of action.
***, **, and * denote significance at the 1, 5, and 10% levels, respectively.
In the published article, there was an error in the legend for Table 9 as published. All the negative signs are not marked. The corrected legend appears below.
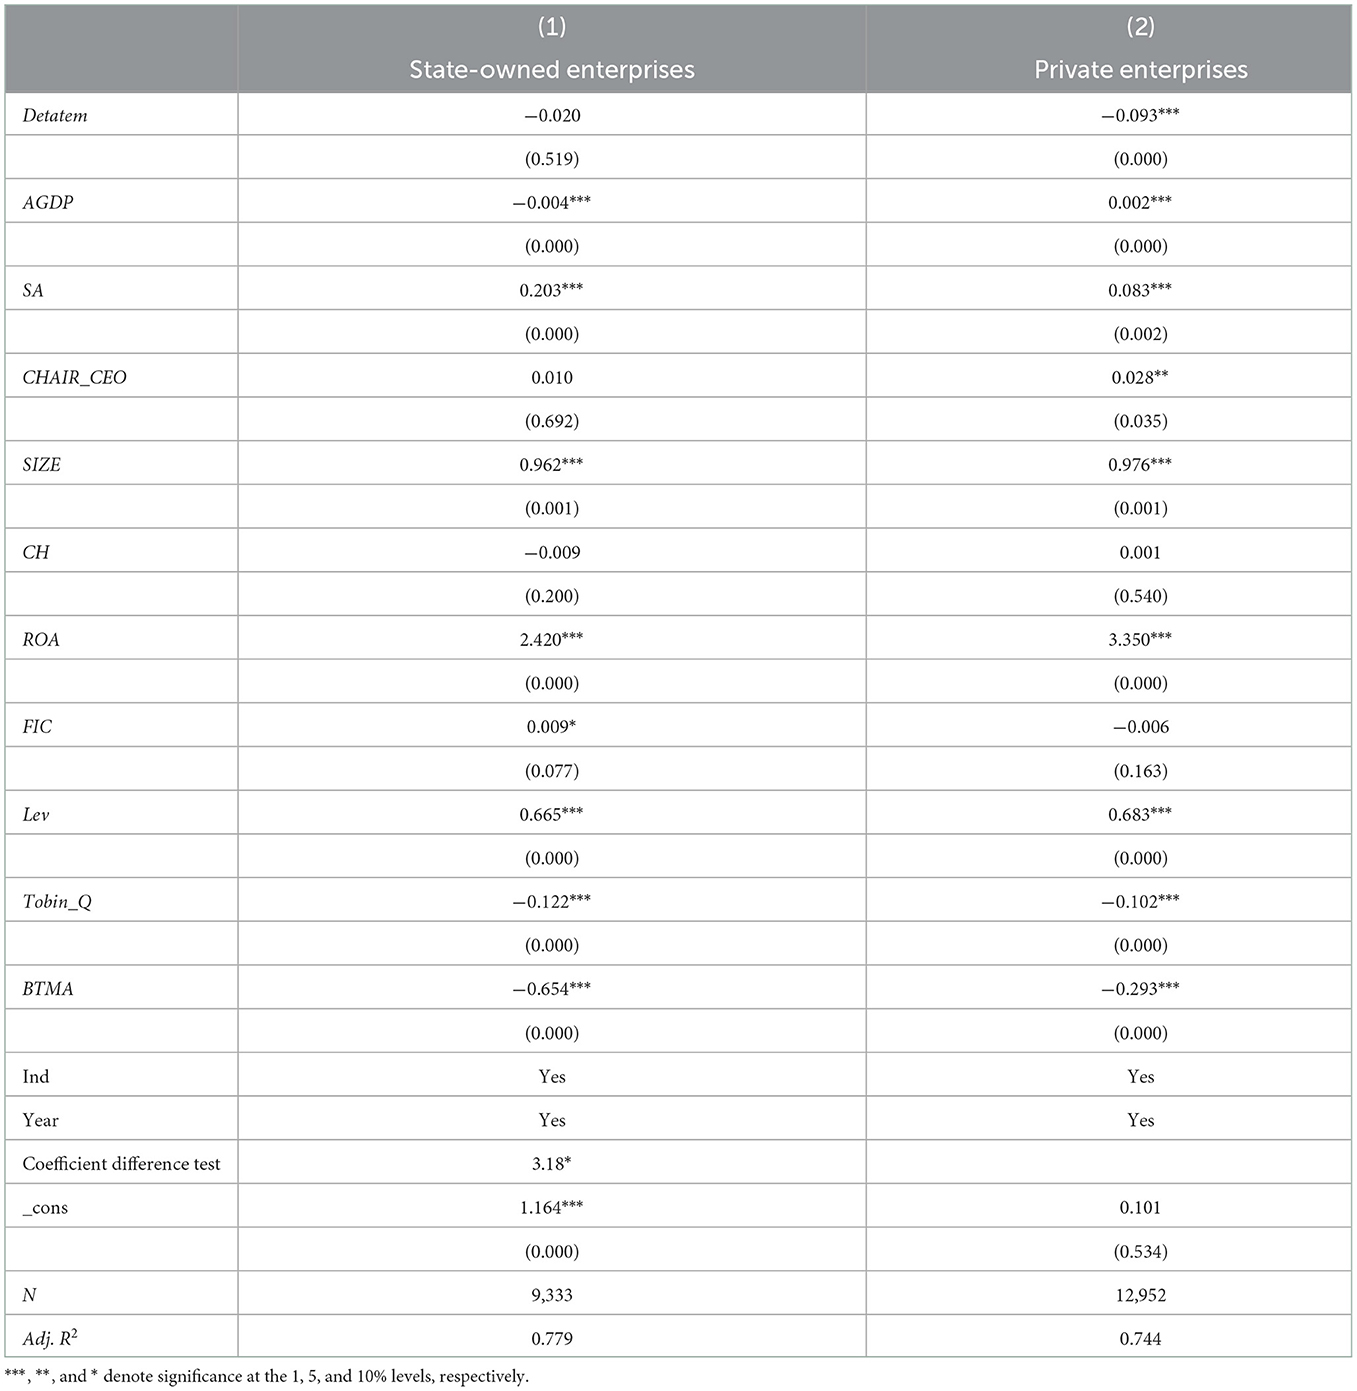
Table 9
| (1) | (2) | |
|---|---|---|
| State-owned enterprises | Private enterprises | |
| Detatem | −0.020 | −0.093*** |
| (0.519) | (0.000) | |
| AGDP | −0.004*** | 0.002*** |
| (0.000) | (0.000) | |
| SA | 0.203*** | 0.083*** |
| (0.000) | (0.002) | |
| CHAIR_CEO | 0.010 | 0.028** |
| (0.692) | (0.035) | |
| SIZE | 0.962*** | 0.976*** |
| (0.001) | (0.001) | |
| CH | −0.009 | 0.001 |
| (0.200) | (0.540) | |
| ROA | 2.420*** | 3.350*** |
| (0.000) | (0.000) | |
| FIC | 0.009* | −0.006 |
| (0.077) | (0.163) | |
| Lev | 0.665*** | 0.683*** |
| (0.000) | (0.000) | |
| Tobin_Q | −0.122*** | −0.102*** |
| (0.000) | (0.000) | |
| BTMA | −0.654*** | −0.293*** |
| (0.000) | (0.000) | |
| Ind | Yes | Yes |
| Year | Yes | Yes |
| Coefficient difference test | 3.18* | |
| _cons | 1.164*** | 0.101 |
| (0.000) | (0.534) | |
| N | 9,333 | 12,952 |
| Adj. R2 | 0.779 | 0.744 |
Climate change, ownership, and sales revenue.
***, **, and * denote significance at the 1, 5, and 10% levels, respectively.
In the published article, there was an error in the legend for Table 10 as published. All the negative signs are not marked. The corrected legend appears below.
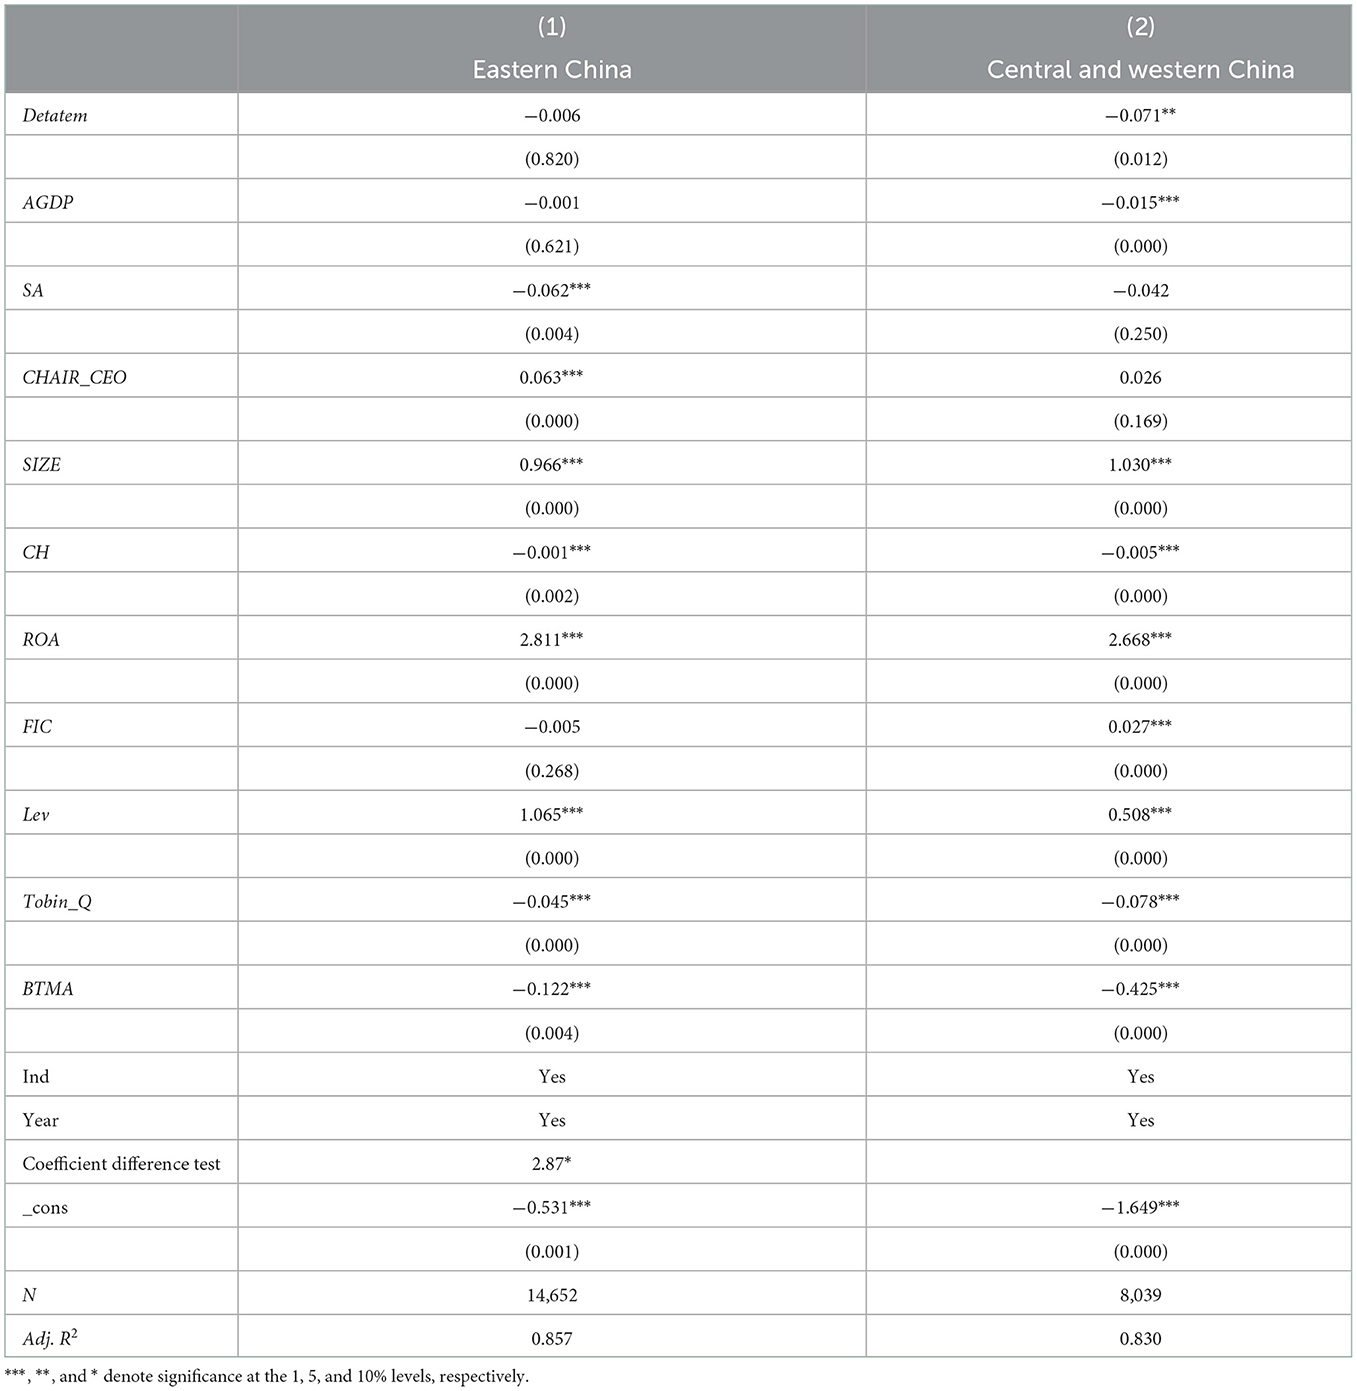
Table 10
| (1) | (2) | |
|---|---|---|
| Eastern China | Central and western China | |
| Detatem | −0.006 | −0.071** |
| (0.820) | (0.012) | |
| AGDP | −0.001 | −0.015*** |
| (0.621) | (0.000) | |
| SA | −0.062*** | −0.042 |
| (0.004) | (0.250) | |
| CHAIR_CEO | 0.063*** | 0.026 |
| (0.000) | (0.169) | |
| SIZE | 0.966*** | 1.030*** |
| (0.000) | (0.000) | |
| CH | −0.001*** | −0.005*** |
| (0.002) | (0.000) | |
| ROA | 2.811*** | 2.668*** |
| (0.000) | (0.000) | |
| FIC | −0.005 | 0.027*** |
| (0.268) | (0.000) | |
| Lev | 1.065*** | 0.508*** |
| (0.000) | (0.000) | |
| Tobin_Q | −0.045*** | −0.078*** |
| (0.000) | (0.000) | |
| BTMA | −0.122*** | −0.425*** |
| (0.004) | (0.000) | |
| Ind | Yes | Yes |
| Year | Yes | Yes |
| Coefficient difference test | 2.87* | |
| _cons | −0.531*** | −1.649*** |
| (0.001) | (0.000) | |
| N | 14,652 | 8,039 |
| Adj. R2 | 0.857 | 0.830 |
Climate change, regional economy, and sales revenue.
***, **, and * denote significance at the 1, 5, and 10% levels, respectively.
In the published article, there was an error in the legend for Table 11 as published. All the negative signs are not marked. The corrected legend appears below.
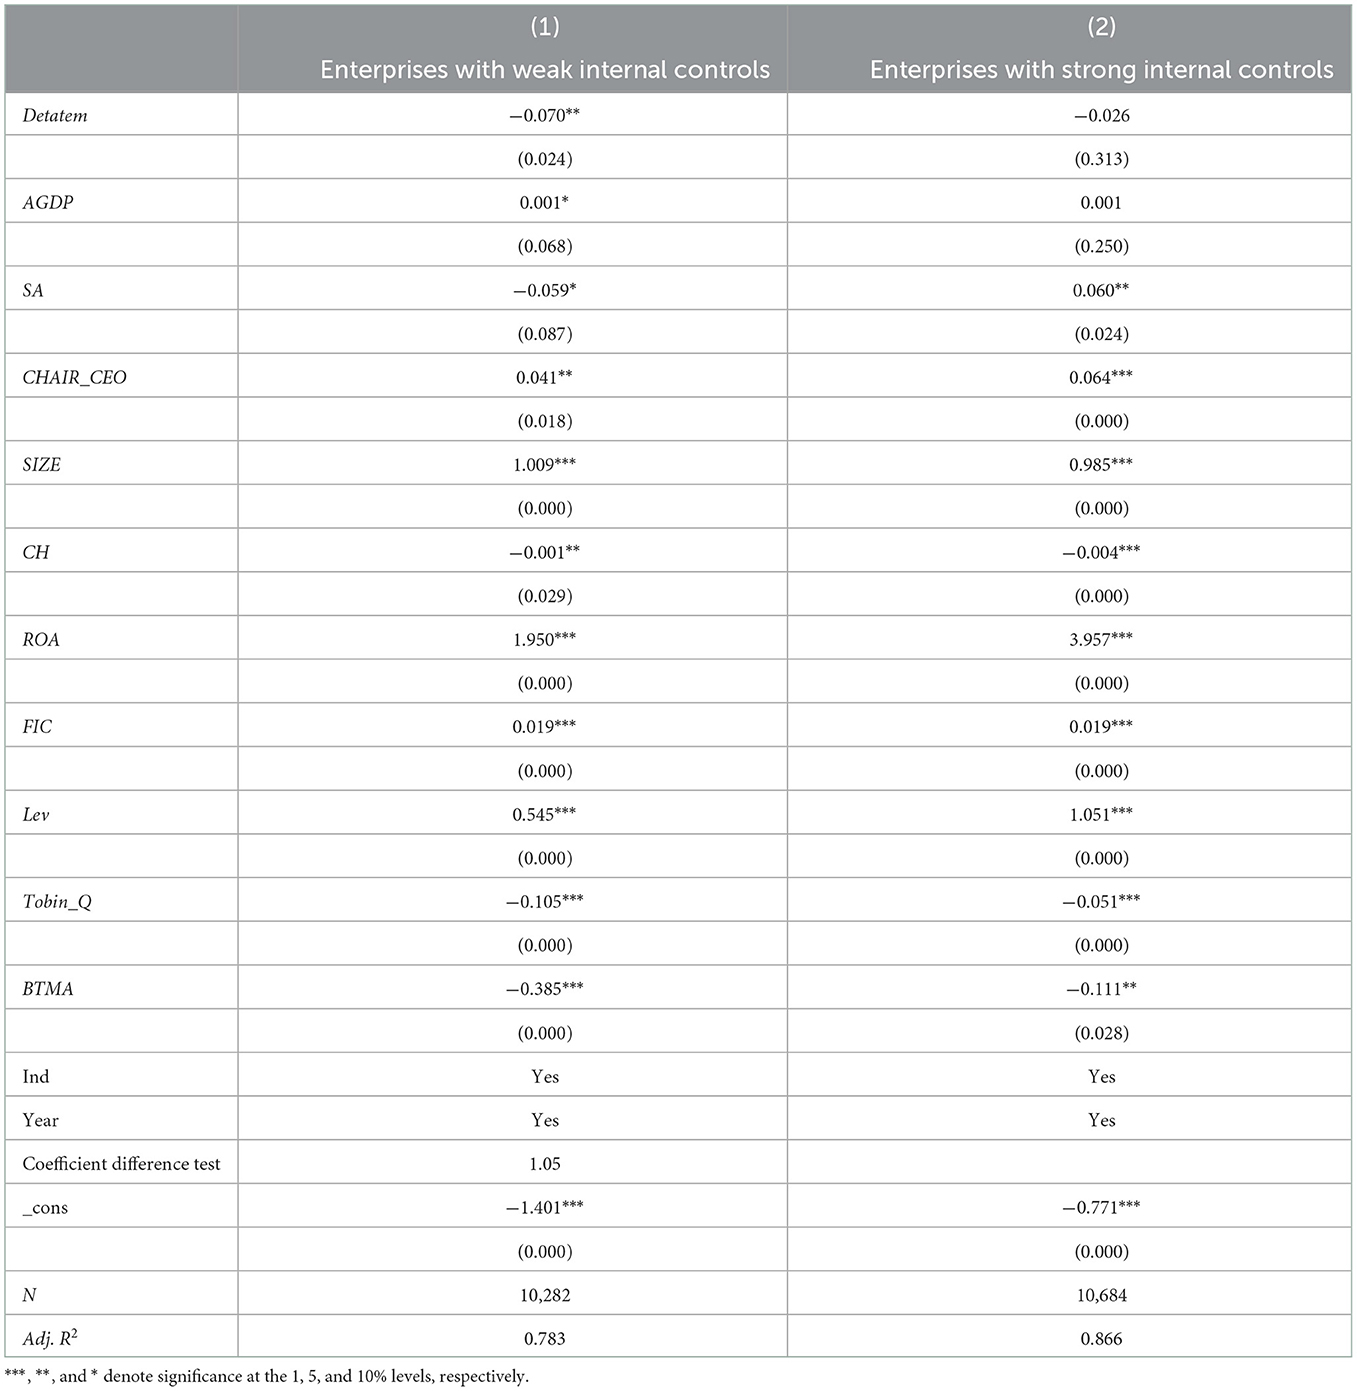
Table 11
| (1) | (2) | |
|---|---|---|
| Enterprises with weak internal controls | Enterprises with strong internal controls | |
| Detatem | −0.070** | −0.026 |
| (0.024) | (0.313) | |
| AGDP | 0.001* | 0.001 |
| (0.068) | (0.250) | |
| SA | −0.059* | 0.060** |
| (0.087) | (0.024) | |
| CHAIR_CEO | 0.041** | 0.064*** |
| (0.018) | (0.000) | |
| SIZE | 1.009*** | 0.985*** |
| (0.000) | (0.000) | |
| CH | −0.001** | −0.004*** |
| (0.029) | (0.000) | |
| ROA | 1.950*** | 3.957*** |
| (0.000) | (0.000) | |
| FIC | 0.019*** | 0.019*** |
| (0.000) | (0.000) | |
| Lev | 0.545*** | 1.051*** |
| (0.000) | (0.000) | |
| Tobin_Q | −0.105*** | −0.051*** |
| (0.000) | (0.000) | |
| BTMA | −0.385*** | −0.111** |
| (0.000) | (0.028) | |
| Ind | Yes | Yes |
| Year | Yes | Yes |
| Coefficient difference test | 1.05 | |
| _cons | −1.401*** | −0.771*** |
| (0.000) | (0.000) | |
| N | 10,282 | 10,684 |
| Adj. R2 | 0.783 | 0.866 |
Climate change, internal controls, and sales revenue.
***, **, and * denote significance at the 1, 5, and 10% levels, respectively.
The authors apologize for this error and state that this does not change the scientific conclusions of the article in any way. The original article has been updated.
Statements
Publisher’s note
All claims expressed in this article are solely those of the authors and do not necessarily represent those of their affiliated organizations, or those of the publisher, the editors and the reviewers. Any product that may be evaluated in this article, or claim that may be made by its manufacturer, is not guaranteed or endorsed by the publisher.
Summary
Keywords
climate change, rising temperatures, sales power, company ability, product selling
Citation
Yu S, Cai C, Zhang S and You P (2023) Corrigendum: Does climate change affect enterprises' ability to sell their products?. Front. Ecol. Evol. 10:1093961. doi: 10.3389/fevo.2022.1093961
Received
09 November 2022
Accepted
20 December 2022
Published
17 January 2023
Volume
10 - 2022
Edited and reviewed by
Federica Cucchiella, University of L'Aquila, Italy
Updates
Copyright
© 2023 Yu, Cai, Zhang and You.
This is an open-access article distributed under the terms of the Creative Commons Attribution License (CC BY). The use, distribution or reproduction in other forums is permitted, provided the original author(s) and the copyright owner(s) are credited and that the original publication in this journal is cited, in accordance with accepted academic practice. No use, distribution or reproduction is permitted which does not comply with these terms.
*Correspondence: Cheng Cai ✉ caicsmile@hbue.edu.cn
This article was submitted to Environmental Informatics and Remote Sensing, a section of the journal Frontiers in Ecology and Evolution
Disclaimer
All claims expressed in this article are solely those of the authors and do not necessarily represent those of their affiliated organizations, or those of the publisher, the editors and the reviewers. Any product that may be evaluated in this article or claim that may be made by its manufacturer is not guaranteed or endorsed by the publisher.