 Min Liu1,2
 Xiaoyong Bai1,3,4*Qiu Tan2Guangjie Luo5Cuiwei Zhao2Luhua Wu1,3,4Fei Chen1,3,4Chaojun Li1,3,4Yujie Yang6Chen Ran1,2Xuling Luo1,2Sirui Zhang1,2
- 1State Key Laboratory of Environmental Geochemistry, Institute of Geochemistry, Chinese Academy of Sciences, Guiyang, Guizhou, China
- 2School of Geography and Environmental Sciences, Guizhou Normal University, Guiyang, China
- 3CAS Center for Excellence in Quaternary Science and Global Change, Xi’an, Shanxi, China
- 4Puding Karst Ecosystem Observation and Research Station, Chinese Academy of Sciences, Anshun, Guizhou, China
- 5Guizhou Provincial Key Laboratory of Geographic State Monitoring of Watershed, Guizhou Education University, Guiyang, China
- 6College of Geography and Environmental Science, Lanzhou University, Lanzhou, Gansu, China
Introduction: Accurate assessment of the net ecosystem productivity (NEP) is very important for understanding the global carbon balance. However, it remains unknown whether climate change (CC) promoted or weakened the impact of human activities (HA) on the NEP from 1983 to 2018.
Methods: Here, we quantified the contribution of CC and HA to the global NEP under six different scenarios based on a boosted regression tree model and sensitivity analysis over the last 40 years.
Results and discussion: The results show that (1) a total of 69% of the areas showed an upward trend in the NEP, with HA and CC controlled 36.33 and 32.79% of the NEP growth, respectively. The contribution of HA (HA_con) far exceeded that of CC by 6.4 times. (2) The CO2 concentration had the largest positive contribution (37%) to NEP and the largest influence area (32.5%). It made the most significant contribution to the NEP trend in the range of 435–440 ppm. In more than 50% of the areas, the main loss factor was solar radiation (SR) in any control area of the climate factors. (3) Interestingly, CC enhanced the positive HA_con to the NEP in 44% of the world, and in 25% of the area, the effect was greater than 50%. Our results shed light on the optimal range of each climatic factor for enhancing the NEP and emphasize the important role of CC in enhancing the positive HA_con to the NEP found in previous studies.
1. Introduction
Terrestrial ecosystems play an most important role in the carbon cycle (Keenan et al., 2016). Vegetation can fix atmospheric carbon through photosynthesis. The net ecosystem productivity (NEP) is the photosynthetic product that is deducted from the photosynthetic product of plant photosynthesis after deducting the consumption of the plant’s autotrophic respiration and the consumption of microbial heterotrophic respiration (Steffen et al., 1998; You et al., 2020). Usually, it is an indicator used to check whether the ecosystem can fix or release carbon from the atmosphere (Grant et al., 2012; Yu et al., 2013; Kong et al., 2022; Wang et al., 2022). In previous studies, it has been generally believed that NEP ≥ 0 represents a carbon sink while NEP < 0 represents a carbon source (Luyssaert et al., 2008; Yu et al., 2014).
The contribution of internal variations in global carbon sinks is currently under debate. Several studies have shown that the global terrestrial carbon sink has gradually increased over the past decade (Keenan et al., 2016; Ballantyne et al., 2017), and it has experienced large inter-annual changes (Fu et al., 2017; Ni et al., 2017). The carbon sink capacity in the semi-arid regions of the world has been increasing during the last 34 years (Zhang L. et al., 2020). The average annual NEP was 0.007 Gt C/yr in China from 1981 to 2000 (Cao et al., 2003). Tao et al. (2007) found that the terrestrial ecosystem generally played the role of a carbon sink from 1981 to 2000 in China. Terrestrial carbon absorption in China accounts for 8–11% of the global carbon sink (Piao et al., 2009). Climatic factors were once seen as important constraints on terrestrial ecosystems. The increase in the CO2 concentration in the atmosphere increases the net carbon uptake (Sitch et al., 2007). And the CO2 concentration is the main climate factor leading to the net carbon absorption in China (Tian et al., 2011; Piao et al., 2012). Elevated CO2 concentrations could increase productivity by increasing the water use efficiency (WUE) of plants in semi-arid areas (Fay et al., 2003; Izaurralde et al., 2011). The increase in the CO2 concentration is positively correlated with the NEP in global (Zhang L. et al., 2020). In addition, climate warming usually increases carbon sequestration by extending the carbon sequestration period (Peng et al., 2013; Keenan et al., 2014). In the same ecosystem, carbon sinks exhibit regular growth and are weak in warm and humid environmental conditions and relatively dry and cold environmental conditions, respectively, suggesting that proper precipitation and temperature are important for increasing the NEP. Global warming may promote the increase in the capacity of carbon sinks in cold regions (Chuai et al., 2018). However, an increase in temperature will reduce the NEP by increasing soil respiration (Bond-Lamberty and Thomson, 2010; Chen S. T. et al., 2012). Therefore, continued warming may impair carbon sinks and may even transform them into carbon sources (Medvigy et al., 2010). Increased precipitation will increase cloud cover and reduce solar radiation (SR), which is very important for vegetation (Mathur, 2014). Previous studies have shown that the monsoon climate system, which is characterized by large changes in precipitation, may be an important driver of the changes in the global carbon cycle (Zhang et al., 2018). The impact of precipitation on the NEP was positively correlated in China (Fang et al., 2001), India (Nayak et al., 2013), Asia (Tian et al., 2003), and other places (Poulter et al., 2014). The severe drought caused by the continuous decrease in precipitation in southwestern China led to a significant reduction in carbon absorption in 2009 and 2010 (Chen S. et al., 2019; Li et al., 2019). In China’s typical karst areas, vegetation carbon and water use efficiency is also an important factor affecting vegetation’s role in climate change and land use (Xiao et al., 2023). Overall, high precipitation and temperature increase the NEP, but excess precipitation and temperature have a negative effect on the NEP. In addition, SR is considered to be an important factor affecting the annual NEP (Zhang et al., 2009; Kitamura et al., 2012). SR is considered to be an important factor contributing to the large carbon sinks of the subtropical forests in southwestern China (Tan et al., 2011). Precipitation (P), Temperature (T), and SR together affect about 10% of the NEP in the semi-arid regions of the world, and drought is a combination of precipitation and soil moisture decline (Zhang L. et al., 2020). As a result, soil moisture is also considered to be one of the important driving factors affecting the NEP (Krishnan et al., 2006; Ru et al., 2018). In ecosystems with limited water, the soil moisture has a greater impact on the NEP than the temperature (Liu et al., 2010), and they all have an important impact on the NEP. In the past, many scholars have paid attention to the impact of climate change on the NEP, but the vegetation carbon caused by human activities should not be ignored (Li et al., 2020). Piao et al. (2010) pointed out that climate change and the restoration of woodland and shrubs through human activities were mainly affected factors to carbon balance in China. In addition, the contributions of the various factors to the NEP may have offsetting and diluting effects.
However, there are two issues that cannot be ignored. First, few previous studies have quantitatively distinguished the impact of each factor on the NEP. In addition, the optimal range of the interactions of the climate factors, the pairwise factors affecting the NEP, and whether climate change impacts the HA to improve the NEP on large scales are not known, which to some extent affects the understanding of global NEP differences in the past 40 years. Thus, in this study, we aimed (1) to study the changes in the carbon sink/source regions, the NEP, and climate factors from 1983 to 2018; (2) to calculate the optimal intervals for the contribution of the climate factors to the NEP; and (3) to identify the controlling areas in which the CC and HA contribution to NEP increasing or decreasing. (4) The optimal interval for the contribution of a single climate factor to the NEP, and the change in the NEP when the two climate factors work together were investigated. (5) Whether CC has increased the positive HA_con to the NEP was analyzed. If yes, where does this enhancement primarily occur? How strong is the enhancement? Understanding the spatial distribution of the global carbon sources/sinks and the mechanisms of influence could enhance our understanding of the global carbon cycle.
2. Materials and methods
2.1. Materials
2.1.1. Gross primary productivity dataset
Based on about 40 years of remote sensing Advanced Very High Resolution Radiometer (AVHRR) data and observations from hundreds of flux sites around the world, a long-term, global, high-resolution series of Gross Primary Productivity (GPP) data was generated from 1982 to 2018 (Wang and Zhang, 2020).1 The resolution is 1 month, and the data unit is gCm–2d–1. Previous research has shown that NIRv was strongly correlated with GPP under various ecosystem and climate conditions based on hundreds of flux points and continuous ground-based observations (Badgley et al., 2019; Baldocchi et al., 2020; Dechant et al., 2020), with determination coefficient (R2) values higher than 0.6, and the mean values of fixed points and verification points were 0.71 and 0.70, respectively, and the root mean square error (RMSE) of the data are 0.02 and 1.95 gCm–2d–1. This dataset can be used for research on global climate change and the carbon cycle (Deng et al., 2021; Sun et al., 2021; Wang et al., 2021; Wu and Jiang, 2022). All of the data were analyzed at the spatial resolution of 0.25° × 0.25°.
2.1.2. Meteorological data
The Precipitation (P) and Temperature (T) data were obtained from GLDAS-2.1 datasets provided by the National Aeronautics and Space Administration (NASA),2 with a spatial resolution of 0.25° from 01/1983 to 12/2018 (Li et al., 2022; Song et al., 2022; Xiong et al., 2022). The SR dataset derived from the THRGPU (Terrestrial Hydrology Research Group of Princeton University).3 The CO2 concentration data were obtained from the Climate Data Store,4 which is an authoritative website that gathers data from several websites, including the European Commission Joint Research Centre, implemented by the ECMWF (European Centre for Medium-Range Weather Forecasts), and the Climate Change Service. The CO2 concentration data were for the period 1979–2020 and have resolution of 3 h. The soil moisture (SM) data were derived from the Global Land Data Assimilation System (GLDAS) and were provided by NASA (see text footnote 2). The four land surface process models, including Noah, contain simulated SM products with various spatiotemporal resolutions based on surface observations and satellite remote sensing monitoring data (Rodell et al., 2004). In this study, the SM products from the Noah (version 2.7.1) model were used, which include four layers of SM data. The SM contents of the average layer (unit: kg/m2) were used. This dataset has been used many times in soil moisture research (Deng et al., 2020).
2.2. Methods
2.2.1. Theil–Sen median trend analysis
The Theil–Sen Median Trend Analysis is a robust non-parametric statistical method for trend calculation (Sen, 1968; Tian et al., 2017). The formulas is as follows:
Where i and j was time series data. The time series was showed an upward trend when SNEP was greater than 0, and vice versa.
The Mann–Kendall test was one of the most widely used non-parametric tests for trend and variation analysis of long-time series data (Mann, 1945; Kendall, 1975). The Mann–Kendall test focuses on the sequence than the number. The purpose was to compare the number of different sequences.
Set the {NEPi }, i = 1983, 1984,…, 2018
Define the Z-statistic as:
n is the number of data in the sequence, and NEPi and NEPj are the NEP value in the ith year and the jth year, respectively. sg is a symbolic function. In this study, the significance of the NEP trend was judged at a confidence level of a = 0.05. The results were divided into significant changes (Z ≥ 1.96 or Z ≤ 1.96) and insignificant changes (−1.96 < Z < 1.96) according to the trend change characteristics and the results. According to the above criteria, we further divided the results into five grades: significant increase, slight increase, basically unchanged, slight decrease, and significant decrease (Table 1).
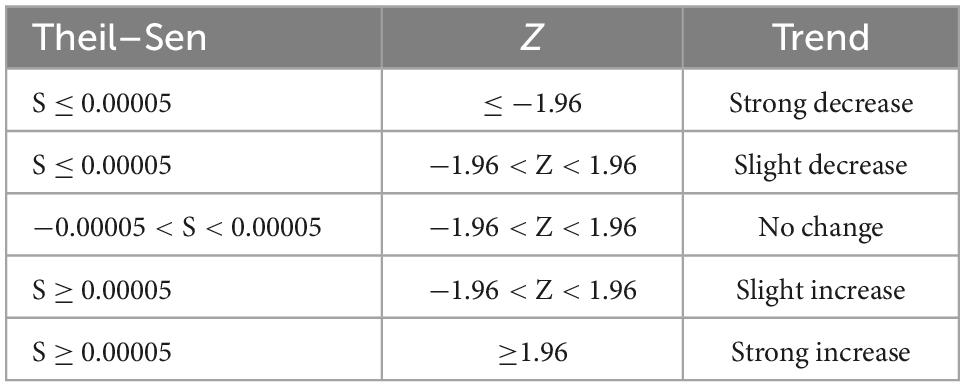
Table 1. The table of trend change rating.
2.2.2. Mann–Kendall mutation test
Mann–Kendall Mutation test was applicable to the analysis of time series data with a continuous increasing or decreasing trend (monotonic trend). It is a nonparametric test that applies to all distributions (i.e., the assumption that the data need not satisfy a normal distribution). This method was usually used to check the reliability of the results of trend analysis. First, create an order column for X with n sample sizes.
Under the assumption of the random independence of the time series, the statistic was defined as follows:
UFk, E (yk), and Var (yk) are the mean values and variances of the cumulative number of yk. When x1, x2,…, xn are independently and interdependently, the computational formula is as follows:
Based on this method, the value passes the 0.05 significance test when UF > 0, indicating a continuous growth trend at the 0.05 significance level. Simultaneously, the UB curve was calculated. If the intersection of the UF and UB curves was within the confidence level interval [−1.96, 1.96], and the specific year of the intersection point was determined, the parameters of the year exhibited a sudden growth state. If the intersection point was not within the test range, the intersection point did not passed the 0.05 test. Therefore, the sudden increase in the parameter in this year did not exhibit a sudden change.
2.2.3. NEP
The concept of the NEP was first proposed by Woodwell et al. (1978). In previous studies, it was usually obtained by subtracting the autotrophic respiration (Ra) and heterotrophic respiration (Rh) from the GPP. The Re is the sum of the Ra and Rh. The GPP data used in this article were obtained through observations from hundreds of flux sites around the world. We refer to the research of Wang et al. (2015). On the small-scale, the calculation models for the NEP are simulated based on the local climate and hydrological conditions (Gong et al., 2017; Zhang X. Z. et al., 2020), and the differentiation of vegetation types is conducted using the statistics of the NEP algorithm (Yuan et al., 2009; Xiao et al., 2013; Chen S. et al., 2019). Considering the complexity of the global scale, we used a more recognized algorithm (Yu et al., 2013; Wang et al., 2015). The optimal approach for the Re was determined through the positive correlation of the spatial coupling between the GPP and Re. The formulae is as follows:
In previous research, it has been confirmed that there is a significant linear relationship between the GPP and Re, and the average Re/GPP ratio is always 0.87 ± 0.04 (Chen et al., 2013, 2015).
Zhu et al. (2014) developed three kinds of assessment schemes to assess the spatial patterns of carbon fluxes based on the results from Yu et al. (2013). The results show that 68% of the per-unit GEP contributed to ER and 29% to NEP in terms of the spatial variations. Therefore, a carbon flux assessment scheme was recommended as the formula (13) (Zhu et al., 2014; Wang et al., 2015). The MAT (average annual temperature) and MAP (average annual temperature) refer to the average annual temperature and average annual Precipitation, respectively. This formula passed the correlation test. It has a high credibility, with correlation coefficients ranging from 0.8 to 0.9 (Zhu et al., 2014).
2.2.4. Statistical analysis
In this study, the least square method was used to determine the linear trend of each pixel.
Where n represents the 36-year time span from 1983 to 2018, NEPi was the annual NEP value of year i, i = 1983, 1984,…, 2018. As same, ΔT,ΔP, ΔSR,ΔSM < cps:it > and < /cps:it > ΔCO2 on behalf of the trends of T, P, SM, SR, and CO2, respectively.
2.2.5. Sensitivity of NEP on climate change and human activities
Various methods have been used to isolate the contribution of factors, such as the residual trend (RESTREND) method (John et al., 2016; Zhou et al., 2018), the LPJ-GUESS ecosystem model (Smith et al., 2014) and Miami models (Krausmann et al., 2009; Zhou et al., 2015, 2017) was used to separate human activity and climate change from multiple influencing factors, Nevertheless, there was high uncertainty in the simulation results (Wu et al., 2020). After comparing various research methods, we finally chose the method from the research of Forzieri (Wang et al., 2014; Forzieri et al., 2018, 2020; Wu et al., 2020), this method assumes a linear interaction between response variables and predictive variables. Firstly, we derived the partial derivative sensitivity terms of NEP to five climate factors (precipitation (P), temperature (T), soil moisture (SM), solar radiation (SR) and CO2 concentration, respectively) by multiple regression method. On the basis of defining the sensitivity of the four climate factors to NEP as the total derivative, the variation of single factor was separately expressed as a function of NEP. The sensitivity of NEP to changes in CC was computed between 1983 and 2018.
Where δPNEP was the P change associated with the long-term change of NEP, In the same way,δSMNEP, , δTNEP and δSRNEP represents the SM, CO2 concentration, T and SR associated to NEP, respectively. Derived from Equation 15, variations in climate factors associated to NEP were expressed by the following equation:
Where ΔNEP, ΔT, ΔP,ΔSR, ΔSMand ΔCO2 represents the linear trend of the NEP, annually averaged T, P, SR, SM and CO2 concentration, respectively (Zhou et al., 2001; Liu et al., 2021). was the sensitivity of P to NEP quantified between 1983 and 2018. The Equation 16 was extended to Equation 18 according to the rules of Equation 17.
The derived signal integrates the bidirectional interactions between P and NEP, the integrates between T and NEP, the integrates between T and NEP. The integrates between SM and NEP, the integrates between CO2 concentration and NEP.
2.2.6. The contribution of climate change and human activities of the NEP
In order to achieve a more accurate quantitative analysis of the contribution of Climate Change (CC_con) and Human Activities (HA_con), the CC_con and HA_con in this table differ from the contribution rates in Equations 15, 17, where the contribution rate represents the population, whereas here it is expressed by cases. Six typical scenarios were used to describe it (Table 2; Zhou et al., 2017; Yan et al., 2019): this paper define NI as the NEP increase of HA and CC, so, the HNI and CNI represents the NEP increase by HA and CC, respectively. The ND was NEP decrease by HA and CC, Breaking it down, the CND was NEP decrease by CC_con and the HND represents the decrease by HA. We have known the contribution of CC and HA to NEP through continuous comparison and analysis.
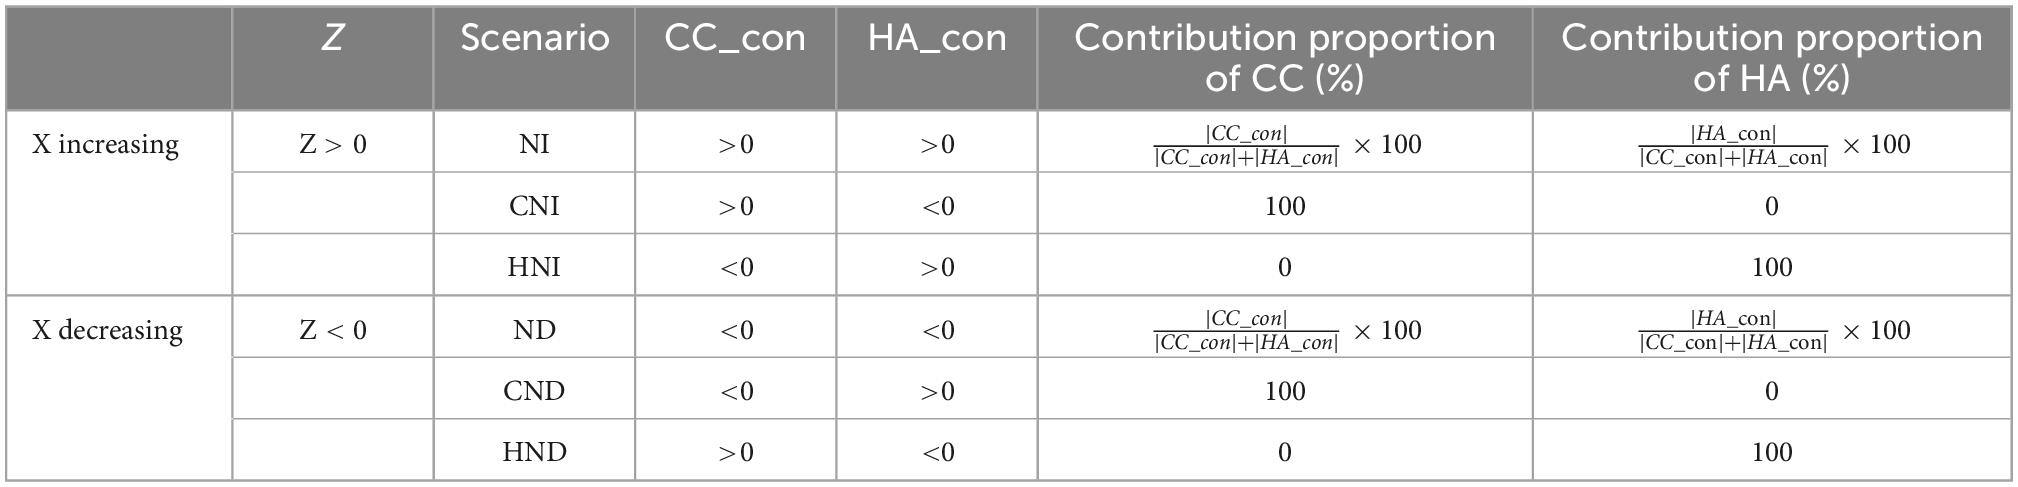
Table 2. Different scenarios for estimate the CC_con and HA_con to NEP increase and decrease.
The relationship is expressed as Equation 18:
Where Z > 0 was represents the NEP increasing, and Z < 0 was represents the NEP decreasing. When ZHAincreasing and ZHA_dreasing combine, that’s HNI, they represent the positive HA_con and the negative HA_con to NEP, respectively. The same, When ZCCincreasing and ZCC_dreasing combine, that’s CNI, they represent the positive and negative CC_con to NEP, respectively.
2.2.7. Boosted regression tree
The boosted regression tree (BRT) machine learning method can effectively select the relevant variables and identify the nonlinear relationship between the input and output based on multivariate regression trees (Elith et al., 2008; Mitchell et al., 2018). The BRT was performed using the gem function in the dismo package in R studio (Pourghasemi and Rahmati, 2017). Nearly 50,000 points were selected to participate in the calculation. Furthermore, the number of trees, the learning rate, and the tree complexity were used to reduce model uncertainly. The highest AUC (area under the curve) of the training data, the optimal parameters of the number of trees, the tree complexity, and the learning rate were selected.
A five-fold cross-validation method was implemented for the BRT model, and we determined the best contribution relationship between the dependent variable (NEP) and all of the climate factors based on this model. We evaluated the accuracy of the model based on the AUC value. When AUC > 0.9, the accuracy of model is excellent; when 0.8 < AUC < 0.9, the accuracy of model is good; and if AUC < 0.7, the accuracy of model is poor (Swets, 1988). In addition, the fit is better if the ratio of the actual to the predicted NEP is close to one, the fitting effect is better. By this model can accurately identify the best contribution of all climate factors on the NEP interval, and the interval was conducted on the basis of 2.2.5 of determining if 2.2.5 part can get is the contribution of each factor to the NEP contribution in the size and spatial distribution, so this model, the precision will be able to get the best contribution of interval, and it is not limited to a single factor.
3. Results
3.1. The trend of NEP
A total of 69% of the areas showed an increase trend of NEP, and 20% exhibited a decrease from 1983 to 2018 based on the Theil–Sen and MK trend analysis results (Figure 1A). The average annual NEP increased from 228.62 g C m–2 yr–1 in 1983 to 256.71 g C m–2 yr–1 in 2018 (Figure 1D). The significant growth of the C sink area was mainly concentrated in the 60–69°N region, and the C source area was located in the 48–65°N region (Figure 1B). These results are similar to those of Chan et al. (2019). In a previous study, Luyssaert et al. (2007) found that the global NEP was 2.1 Pg C yr–1. Piao et al. (2013) reported an average global NBP of 2.0 ± 0.8 Pg C yr–1 during 1980–2009. The growth rate of the global terrestrial carbon sink during 1998–2012 (0.17 ± 0.05 Pg C yr–2) was 3 times that during 1980–1998 (Piao et al., 2018). The respiration of the terrestrial ecosystems was limited to 1.4 ± 0.1 Pg C yr–1 (Mahecha et al., 2010). The global NEP obtained in this study is 3.22–3.71 Pg C yr–1. Results based on the updated time series are relatively closed compared to previous studies. On a regional scale, China’s estimated NEP was determined to be 1.4–1.6 Pg C yr–1 (excluding desert values) in this study, which is slightly lower than the values obtained by Wang et al. (2015) (1.89 Pg C yr–1) and the average NEP obtained by the author by redefining the relationship between NEP and NPP was 1.34 ± 0.12 PgC yr–1. In addition, (Zhu et al., 2014) developed a statistical evaluation scheme to estimate the NEP of China in the 2000s as 1.91 ± 0.15 PgC yr–1. And Wang et al. (2020) estimated that the average annual terrestrial carbon sink in China from 2010 to 2016 was 1.11 ± 0.38 Pg C yr–1. Therefore, the results of this paper have a certain degree of credibility on a regional scale. In the future, with the improvement of relevant results, it is easy to improve the estimation results of NEP synchronously by using the estimation process of this study, such as the study on some provinces in China (Lu et al., 2013; Gong et al., 2017; Zhang X. Z. et al., 2020) and statistics of NEP algorithm for distinguishing vegetation types (Chen S. et al., 2019).
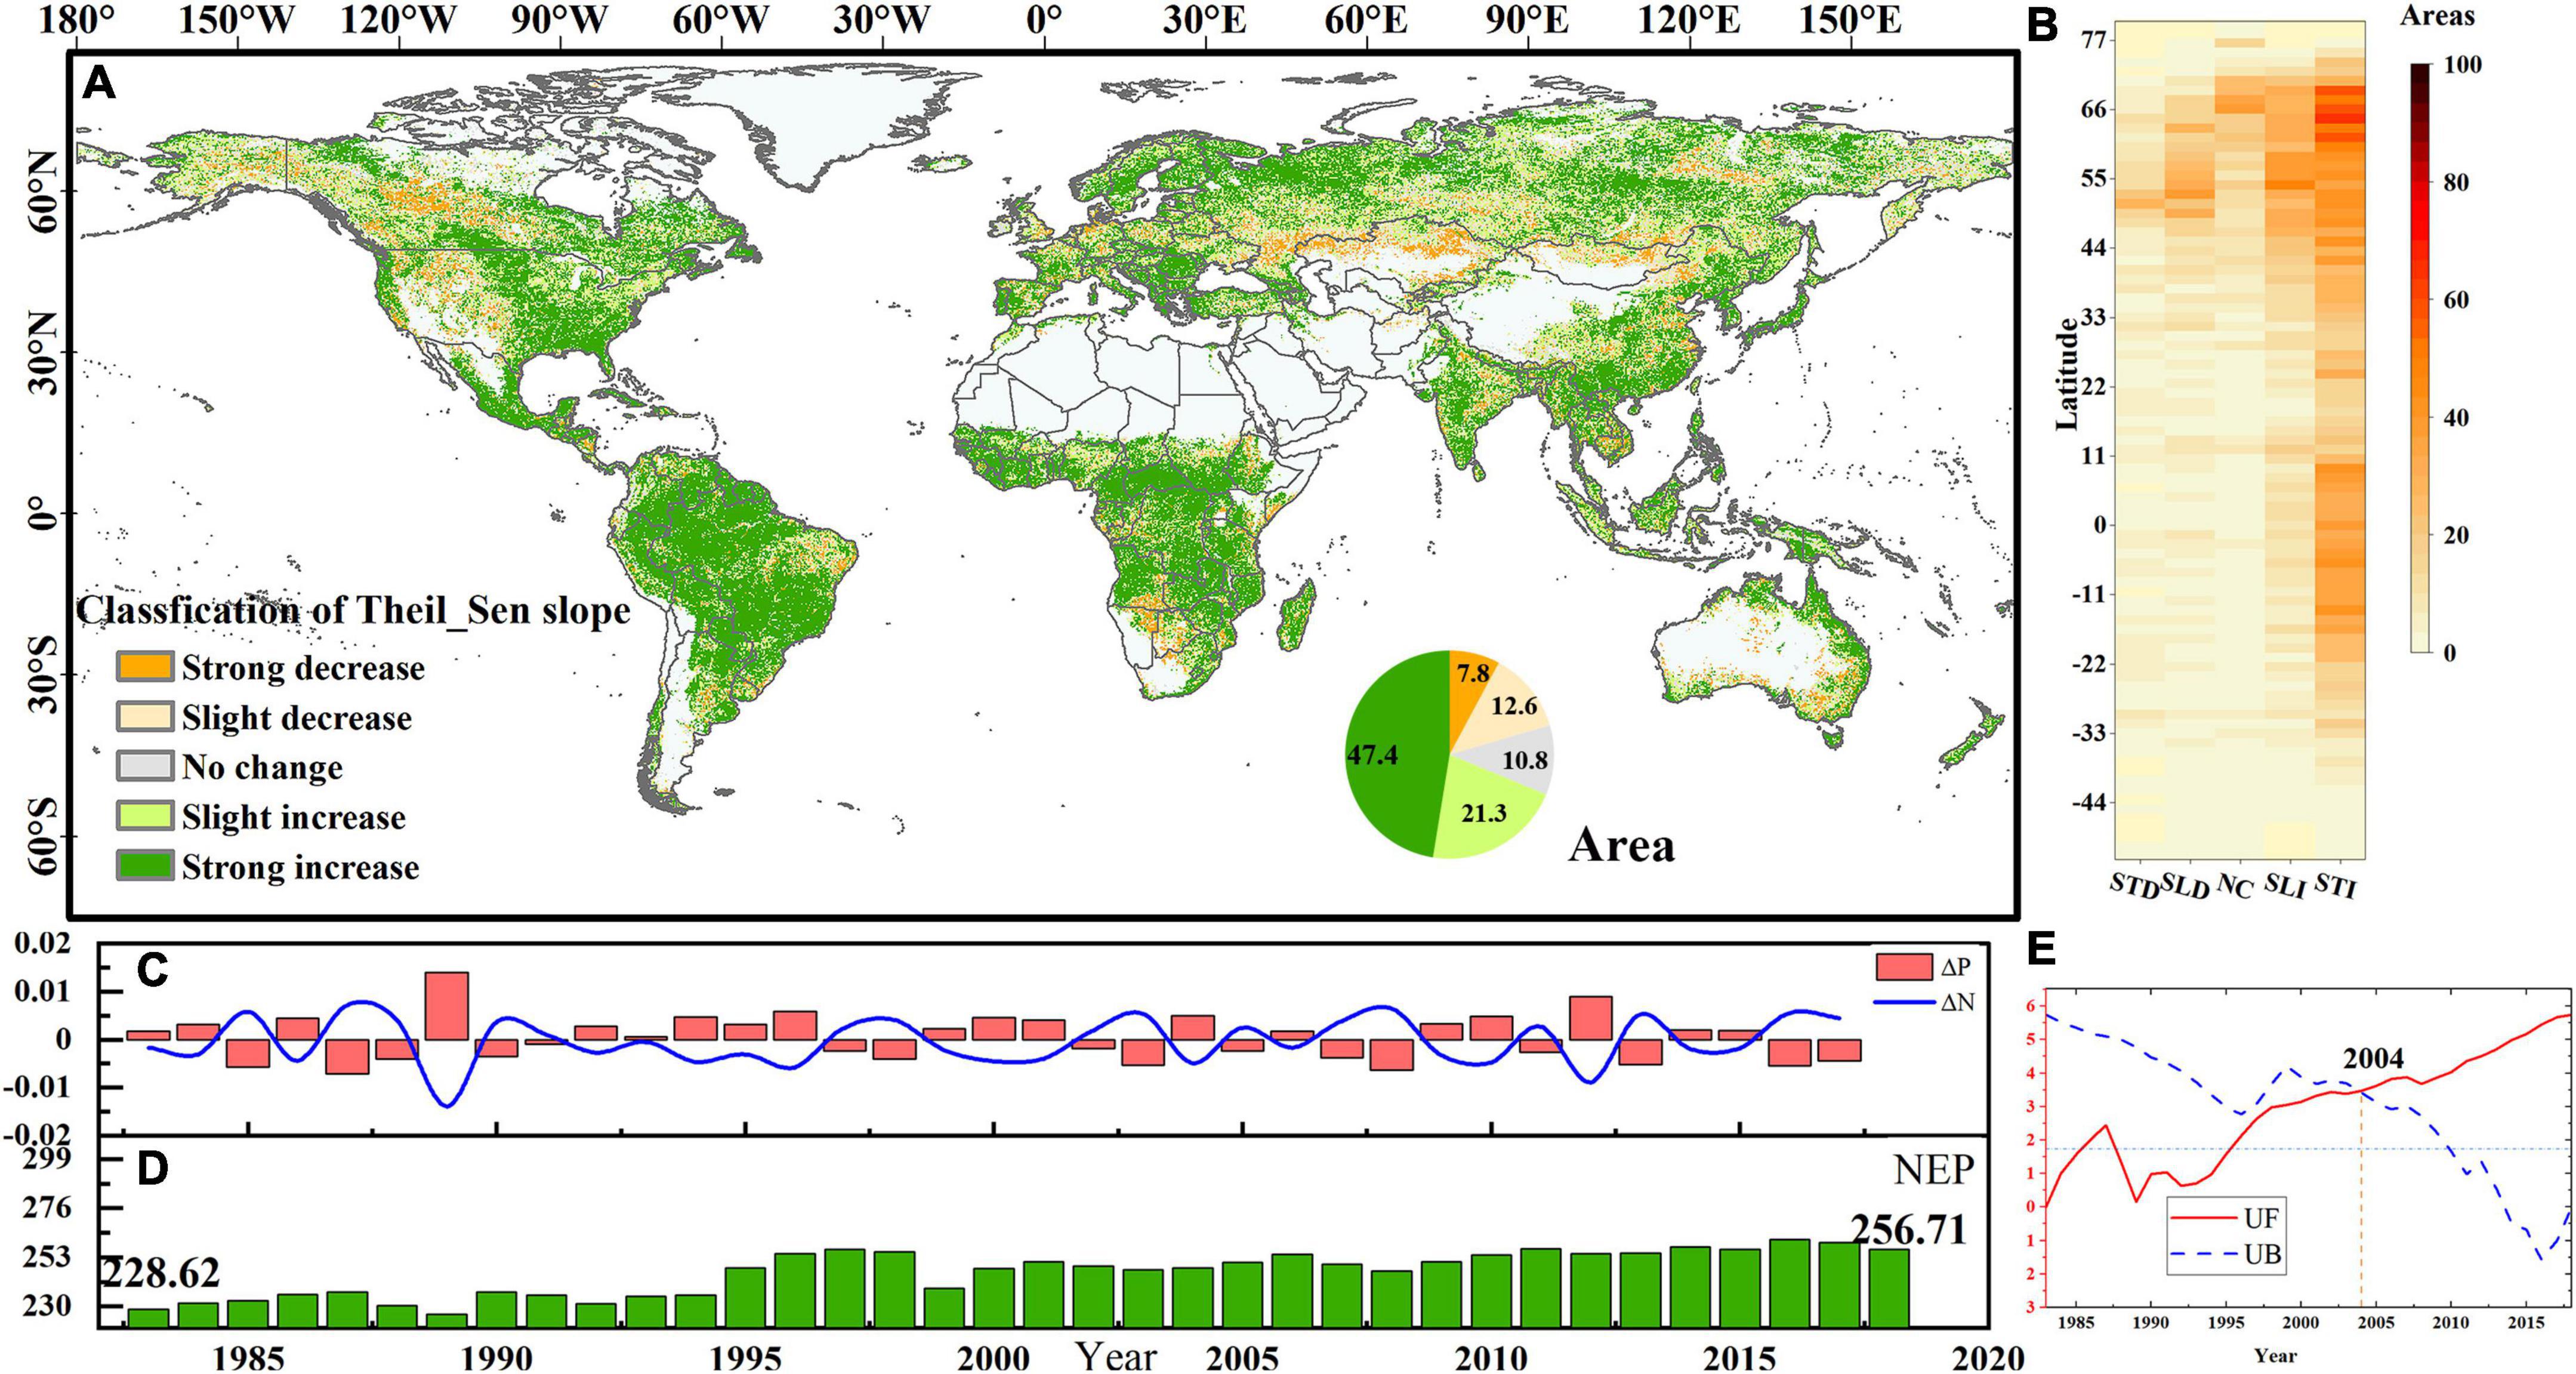
Figure 1. The trend of NEP. (A) Spatial pattern of the Theil–Sen trend of NEP between 1983 and 2018; (B) latitude map of NEP trend in different classification, strong decrease is STD, slight decrease is SLD, no change is NC, strong increase is STI, and slight increase is SLI; (C) the ΔP (the carbon sink areas difference between the current year and the previous year) and ΔN (the carbon source areas difference between the current year and the previous year) and (D) the mean value of NEP; (E) the Mann–Kendall mutation test of NEP.
About 79.4–82.6% of the area served as a Carbon sink from 1983 to 2018 (Supplementary Figure 1), which was 3.9–4.7 times the Carbon source area. The largest increase (1.4%) in the Carbon sink area occurred in 1990 based on the changes in the areas of the Carbon sources and Carbon sinks (Figure 1C). Supplementary Figure 1 and Supplementary Table 1 show the dynamic changes and spatial trends of the NEP, SR, SM, T, P, and CO2.
3.2. Contribution of climate change to the NEP
The spatial distribution of the climatic factors contribution to the NEP based on the sensitivity analysis is shown in Figure 2. The single factor correlation analysis revealed that the NEP has the strongest correlation with P (R = 0.84), followed by temperature (R = 0.56) (Figure 2F). This is similar to the results of Chen et al. (2013), Xiao et al. (2013), and Chen S. et al. (2019). Nonetheless, considering that there may be some autocorrelation problems in the correlation analysis between a single factor and NEP, we analyzed the contribution of each climate factor to NEP through Equation 16, which excluded the interaction between factors and recognized this contribution in space (Figure 2A). The results show that the CO2 concentration had the highest contribution rate (37%), although it made a negative contribution in many areas (Figure 2A). The SR made negative contributions in many areas in India, Africa, and North America, and its negative contribution rate was the highest (−11.7%) (Figure 2D). Although the correlation coefficient between P and NEP was the highest, it made a negative contribution to the NEP (−10.5%; Figure 2B). The negative contribution of T was mainly concentrated in the high latitude regions of the Northern hemisphere (Figure 2E). The SM made a large contribution in the high latitude regions such as Russia (Figure 2C).
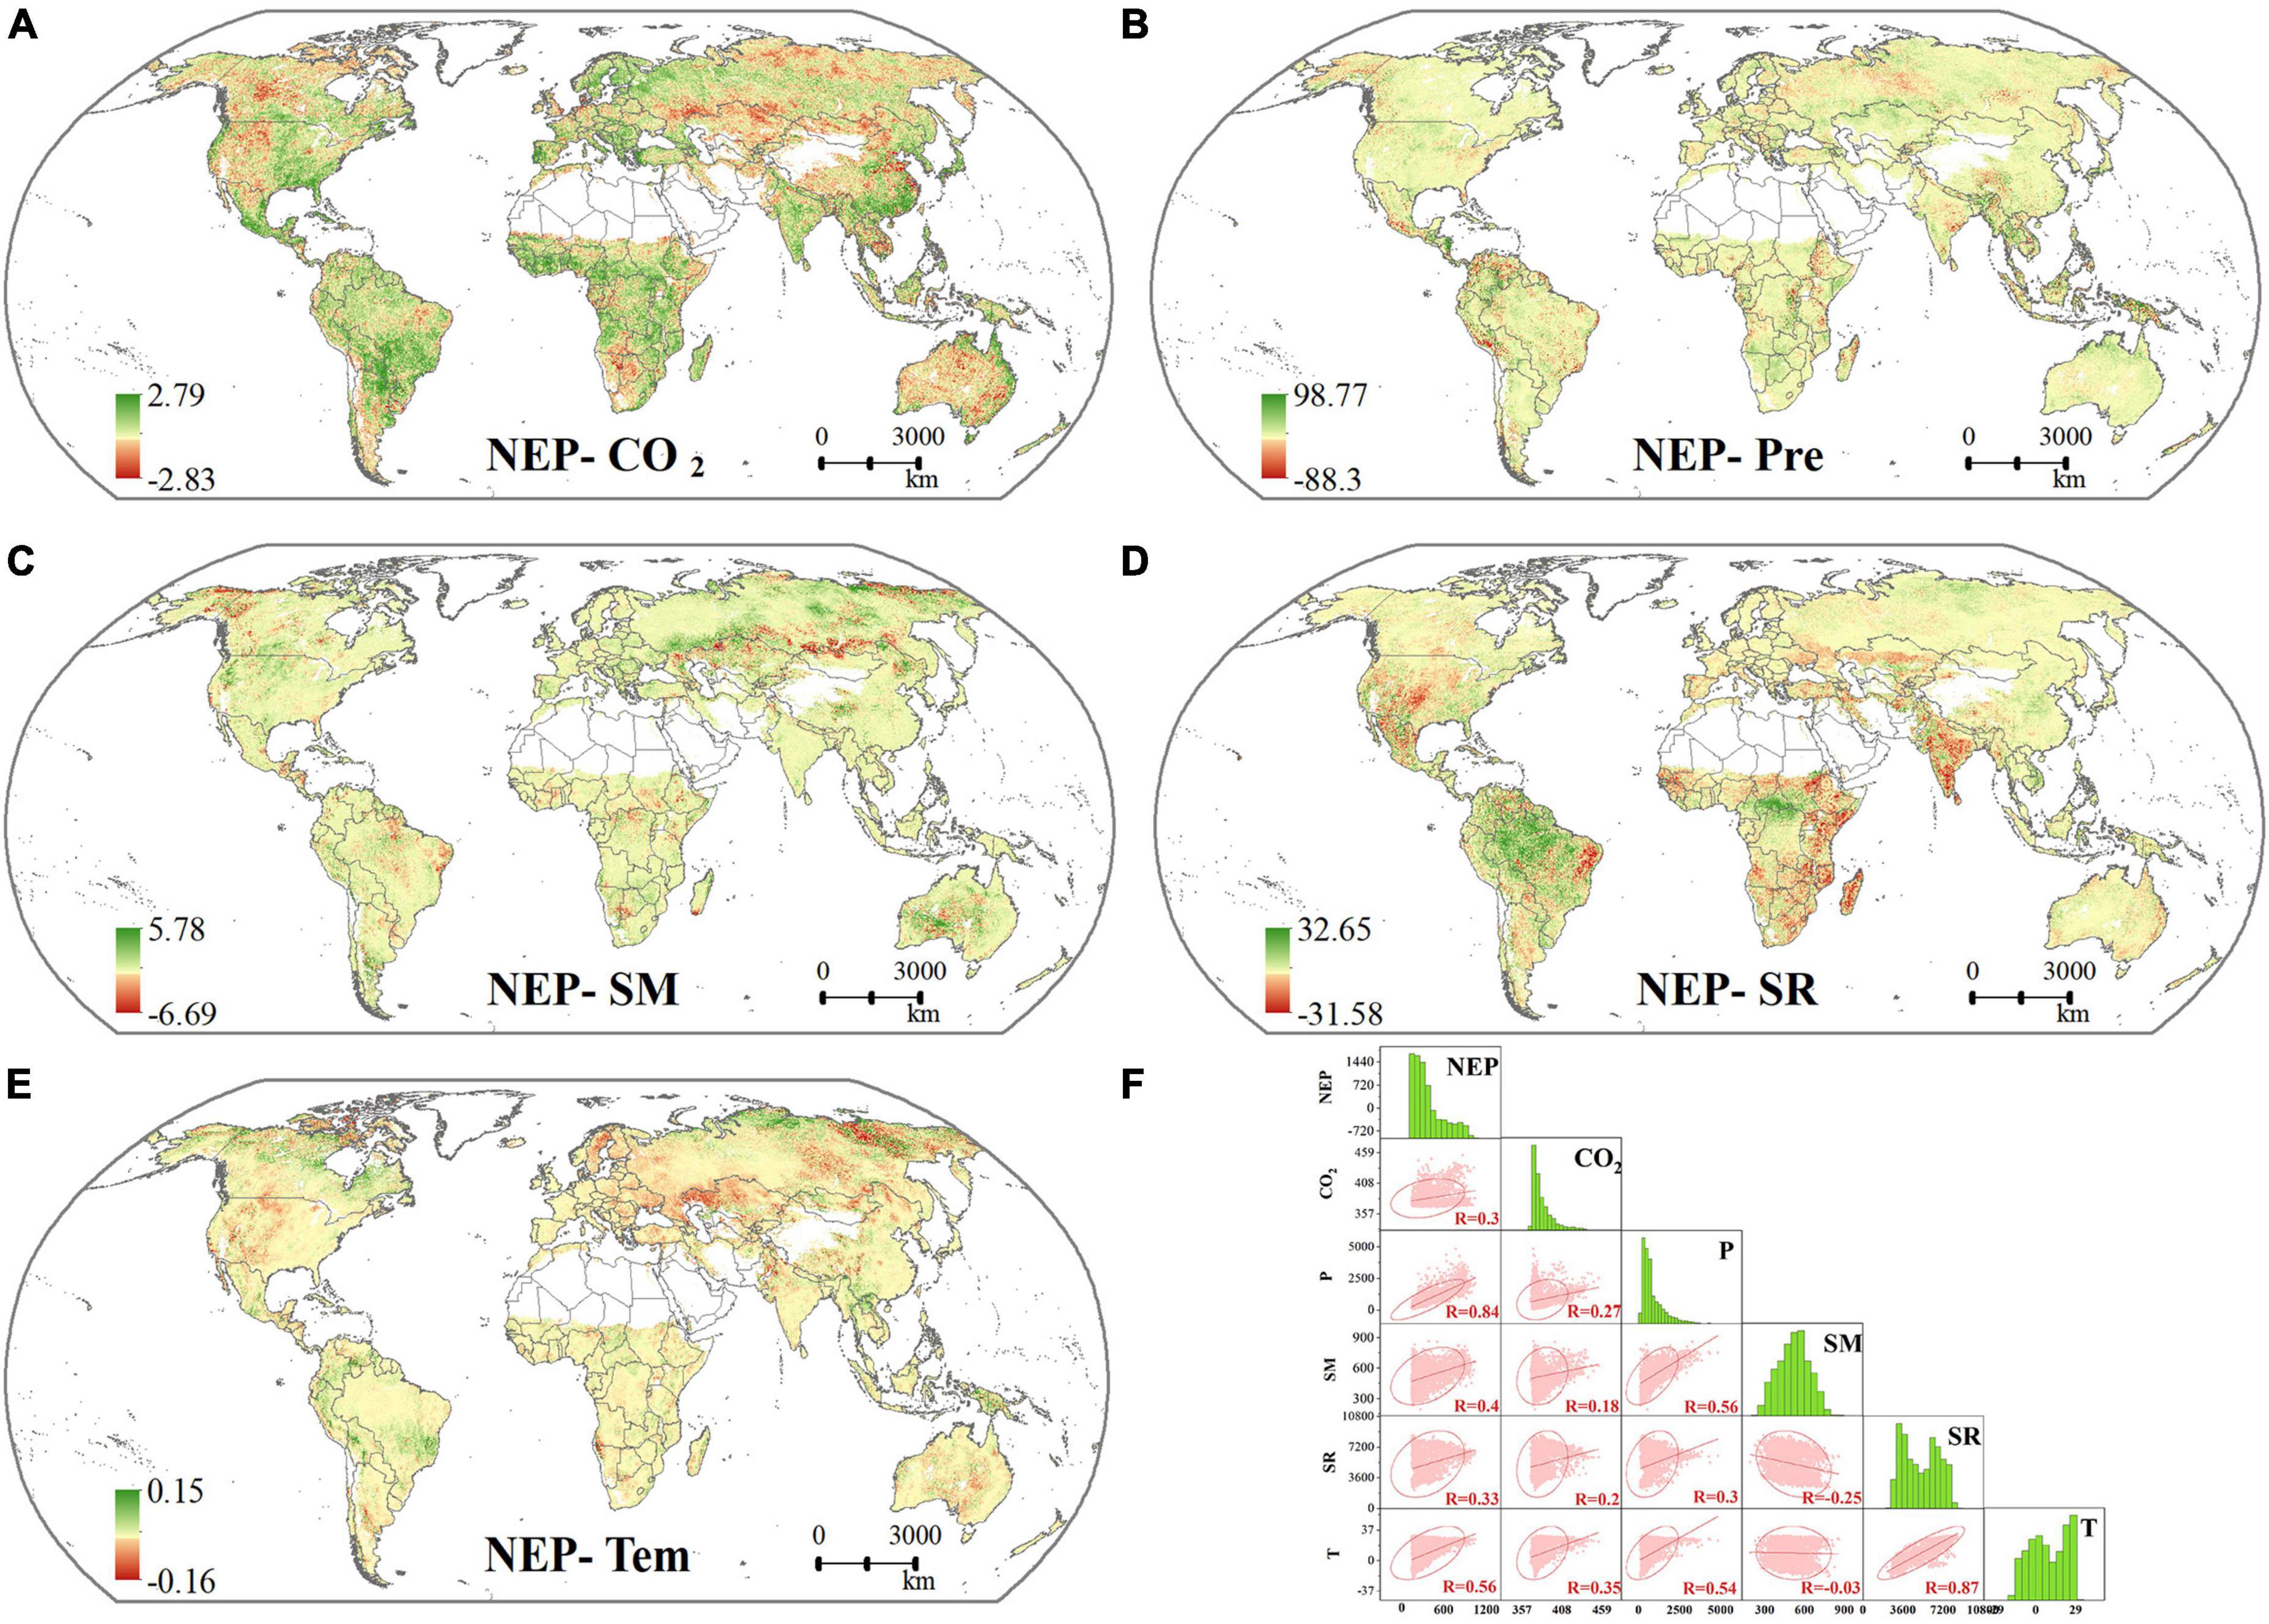
Figure 2. Sensitivity of NEP to climate factor. Sensitivity of NEP to changes in CO2 concentration (A), P (B), SM (C), SR (D), and T (E); correlation analysis between NEP and climate factors (F).
3.3. Main area controlled and main load controlled by climatic factors
In order to identify the factors that play a key role in the NEP in different regions, we explored the major latitudes and regions for each climate factor. The results showed that the CO2 concentration had the largest positive contribution (37%) to NEP and the largest influence area (32.5%; Figure 3). Although the main area controlled by the SR was the next largest, the SR made a negative contribution to the NEP (Figure 3B), and the SR made the lowest contribution to the NEP (−11.7%). Among the other factors, the main region controlled by T was the smallest, and it exhibits a divergent distribution. P mostly played an active role in the mosit and semi-humid terrestrial regions, and the main regions controlled by the SM were mostly located in the Northern Hemisphere. Interestingly, we found that in more than 50% of the areas, the main loss factor was the SR in any area controlled by the climate factors (T, P, SM, and CO2).
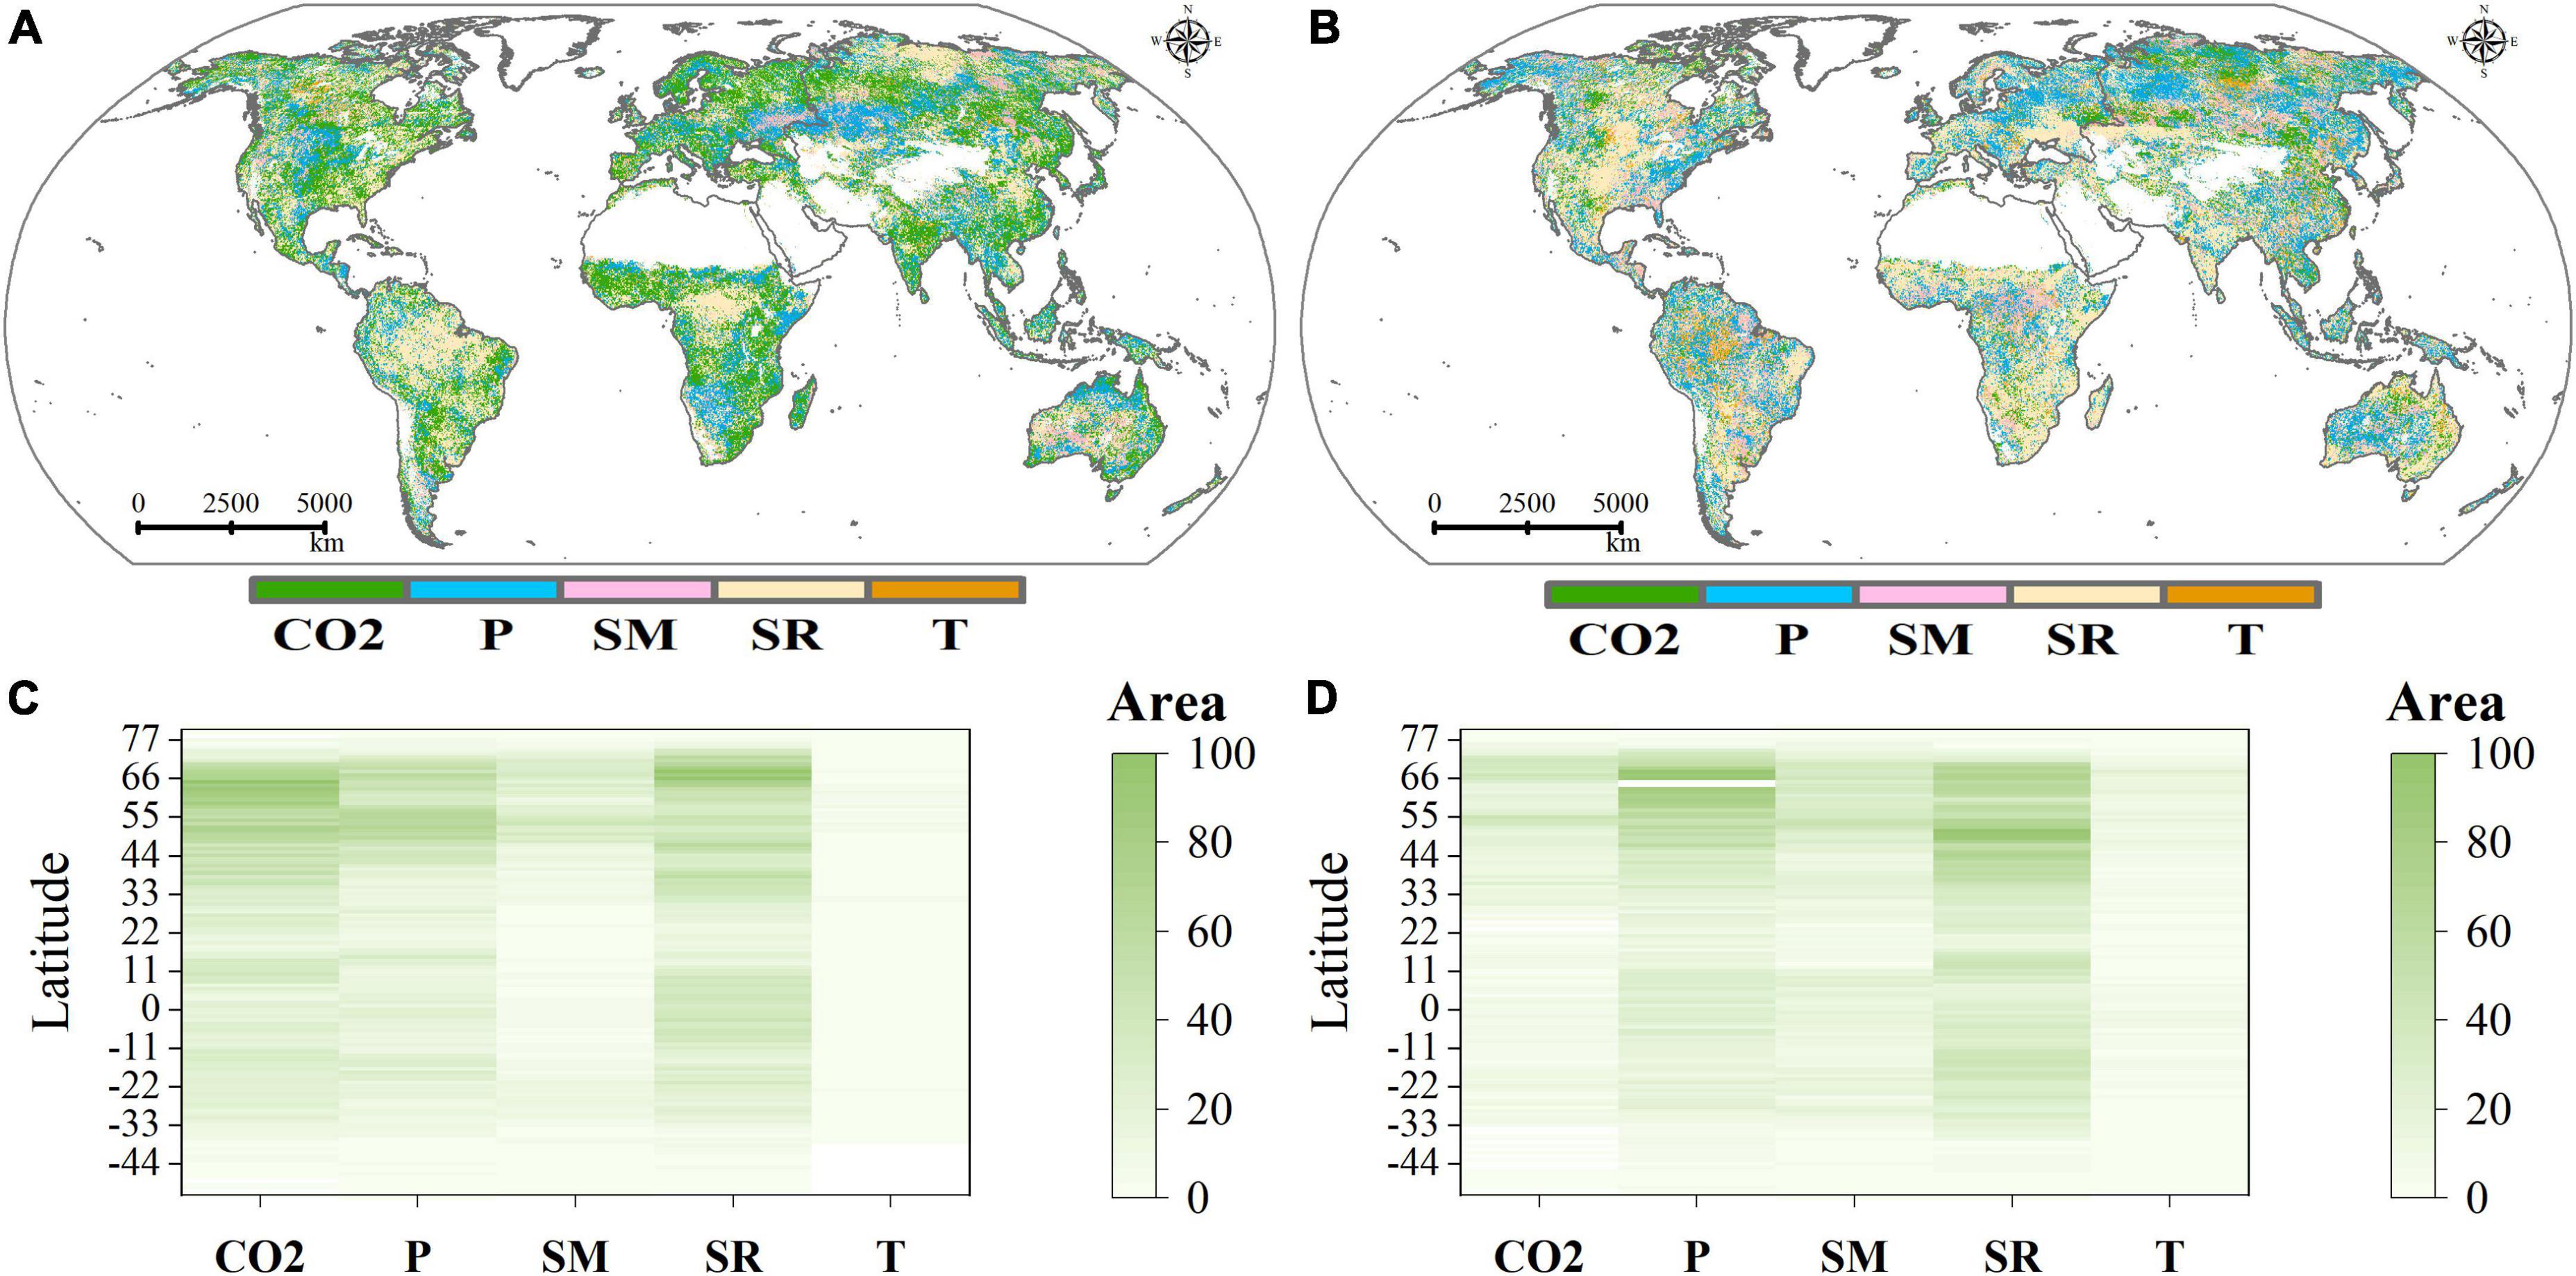
Figure 3. (A) The main controlling factors and (B) the main load controlling factor influencing the NEP. The five driving factors include CO2 concentration, T, P, SR, and SM. (C,D) The contributions of the five driving factors at latitudes of 55°S–80°N.
3.4. Best ranges for climatic factors for the NEP
To explore the changes in the sensitivity of the NEP trend to the climate factors, we used boosting and regression tree (BRT) models to evaluate the optimal interval for the contribution of the climatic factor to the NEP. We adjusted the tree complexity (2, 3, and 4) and the learning rate (0.01, 0.05, and 0.001) to generate the best model (Supplementary Figure 3) according to Equation 6. The prediction accuracy was good when the AUC was 0.875 (i.e., >0.8). The ratio between the actual value and the predicted value was 0.86, which indicates a good prediction accuracy. Therefore, the BRT model was suitable for determining the optimal value of the climate factor for the NEP.
Figure 4 shows the best ranges for two climate factors for the NEP, as well as the optimal contribution interval for a single factor and the NEP calculated based on the BRT model (in the small diagram in Figure 4). In addition, in order to better view the optimal contribution interval of a single factor, a detailed version is listed in Supplementary Figure 3. When the precipitation was greater than 2000 mm and the SR was between 3500 and 7500 (Figure 4F and Supplementary Figures 3B, E), the NEP was relatively stable. An increase in temperature can promote an increase in the NEP, but the upward trend drops sharply after 25°C (Supplementary Figure 3F). However, the NEP is more likely to be lower in the areas with less precipitation. Interestingly, the NEP decreased with increasing SM (Supplementary Figure 3C). There is a well-defined positive gradient with increasing precipitation and temperature. In general, when the temperature was between 16 and 27.7°C, the annual precipitation reached 900 mm, the SR was 4295–7000, the SM was 550–800 kg/m2, the CO2 concentration was greater than 380 ppm, and the NEP was high. The NEP was particularly high when the precipitation was greater than 900 mm, the SR was greater than 5200, and the SM was greater than 350 kg/m2. The CO2 concentration was the most complicated factor, and its contribution to the NEP trend was the most significant between 435 and 440 ppm (Figure 4D). The contribution to the NEP was most significant when the CO2 concentration increased and the precipitation exceeded 1200 mm.
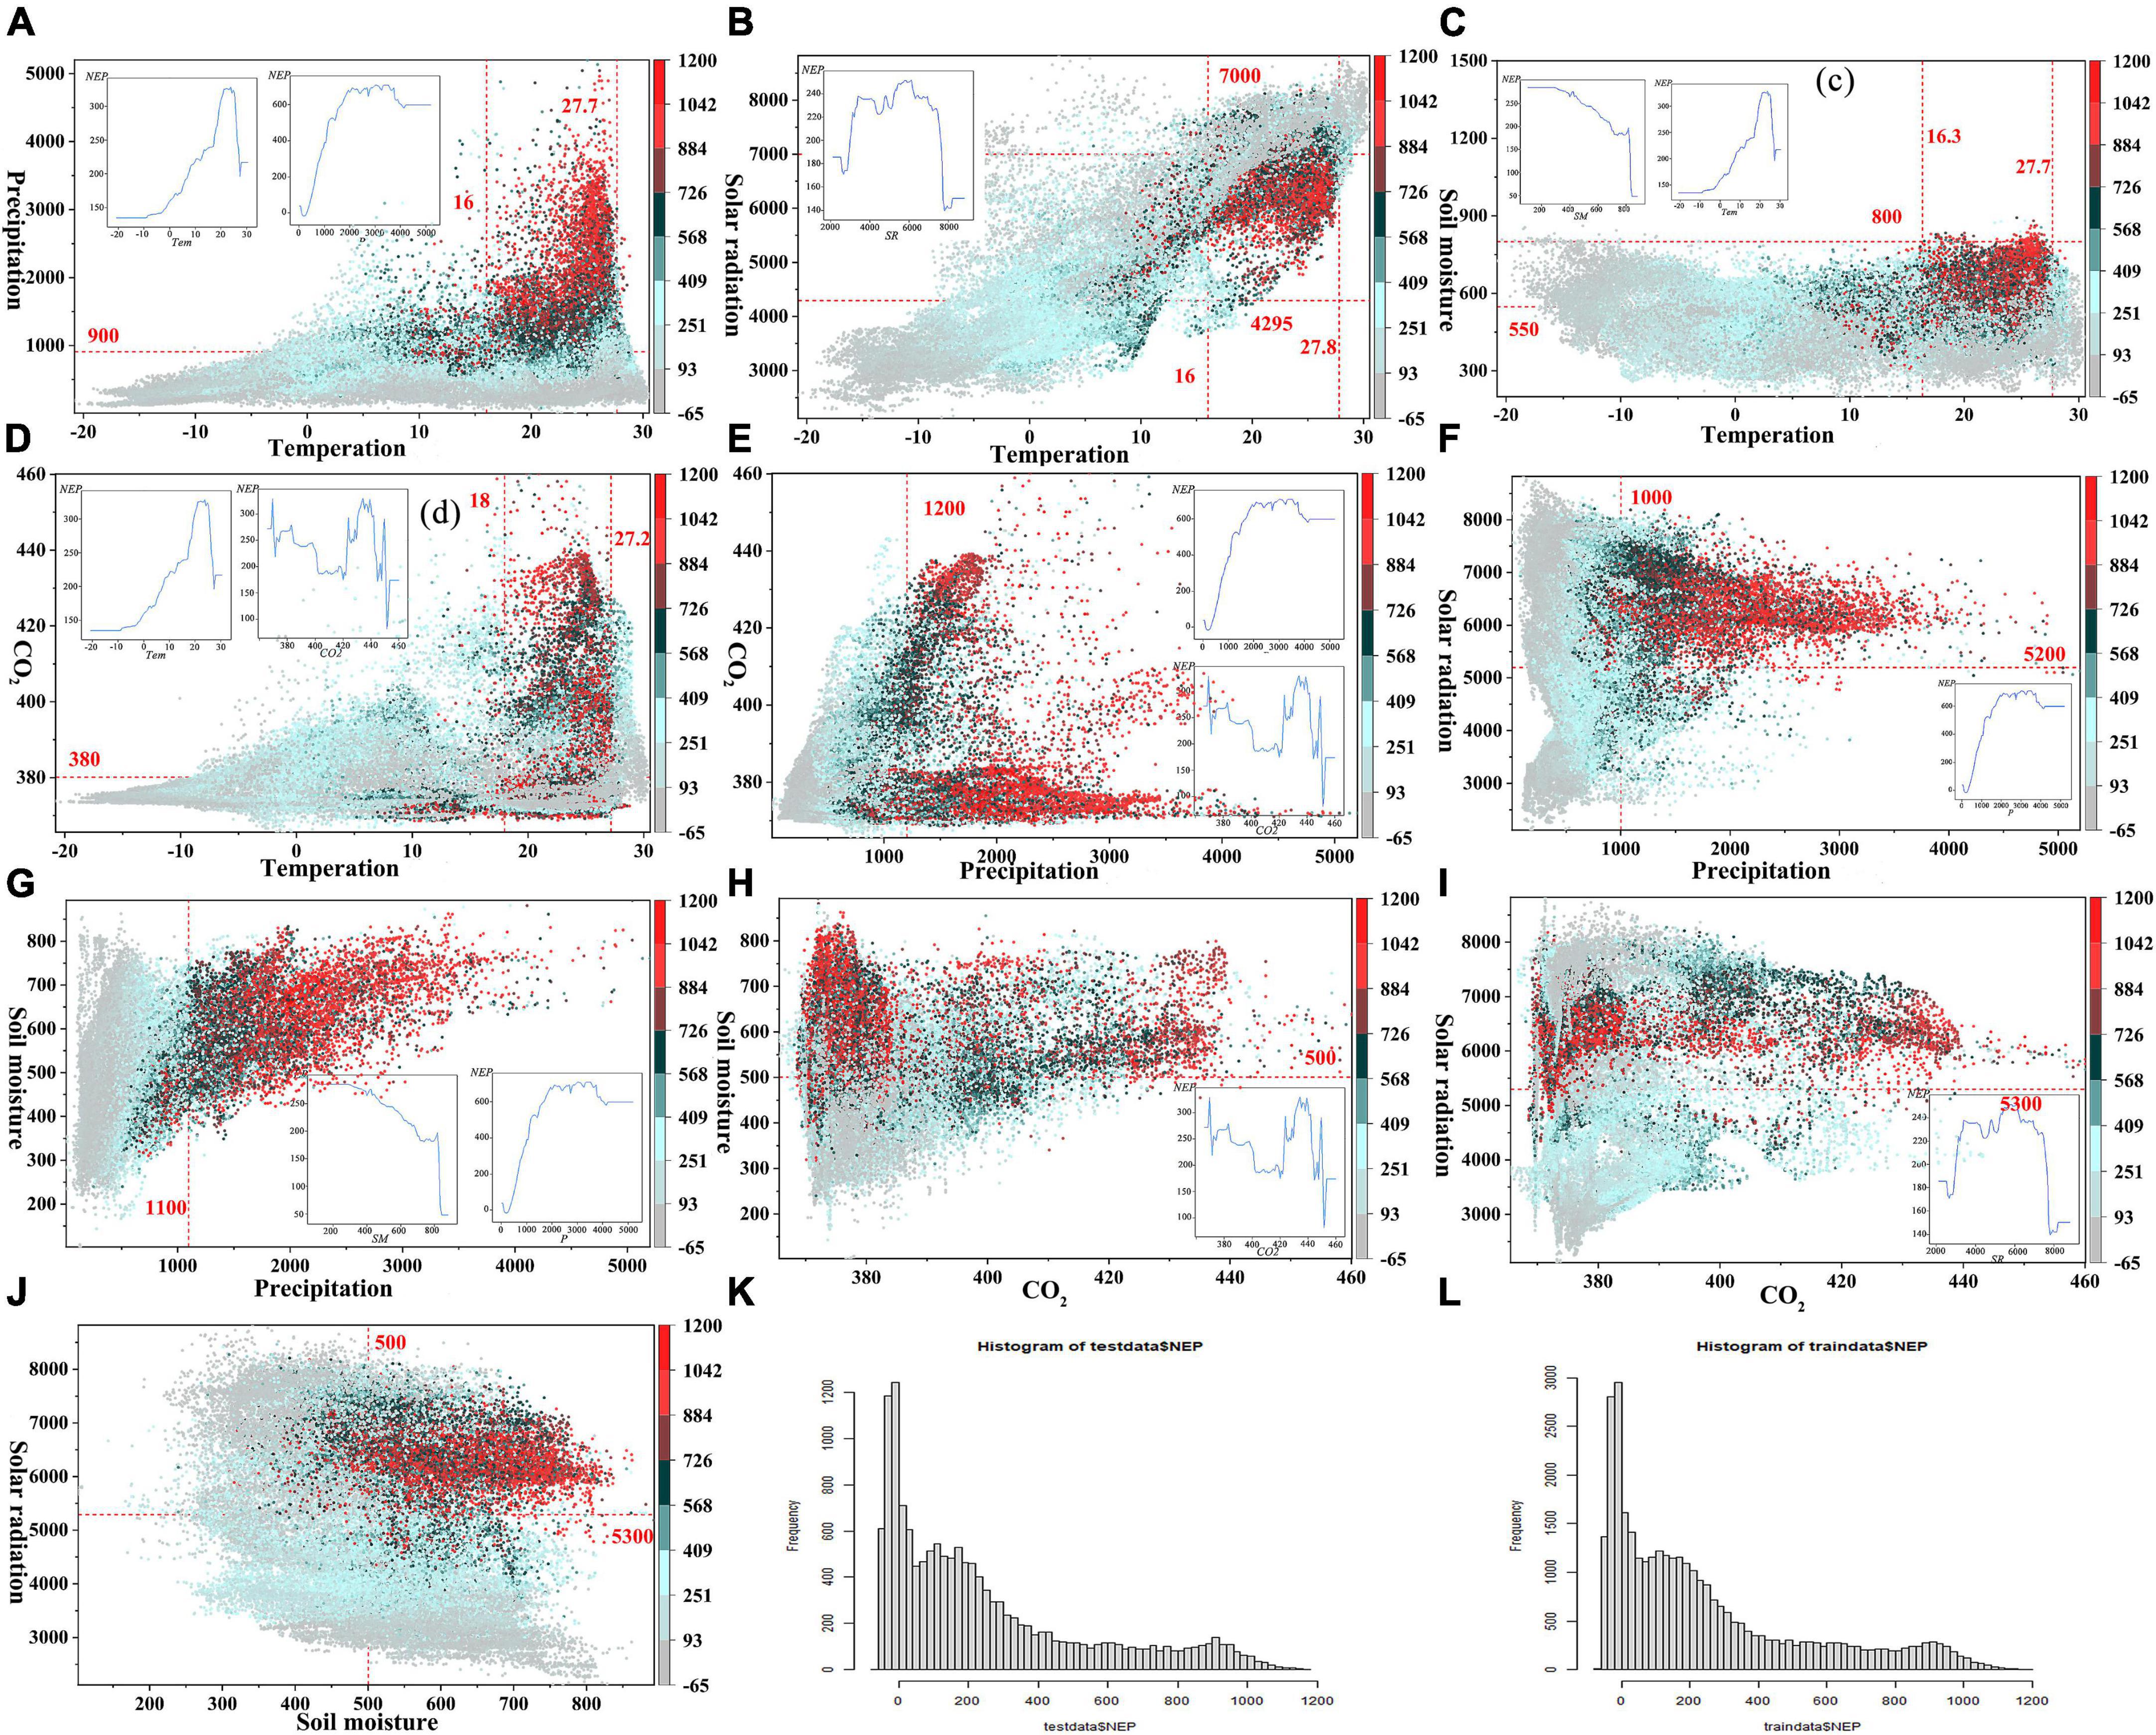
Figure 4. The best contribution interval of each climatic factor to the NEP. Annual NEP in the climate domains based on the (A) T and P; (B) T and SR; (C) T and SM; (D) T and CO2; (E) P and CO2; (F) P and SR; (G) P and SM; (H) CO2 and SM; (I) CO2 and SR; (J) SM and SR; (K) NEP test data; and (L) NEP training data.
3.5. The contribution of human activities and climate change to the NEP
Human activities and CC made positive contributions to the NEP in 57.6 and 60.3% of the area, respectively (Figures 5A, B). The HA_con to the NEP reached 86.48%, far exceeding the CC_con of 13.54% (i.e., by 6.4 times). So, HA was the main factor affecting the NEP.
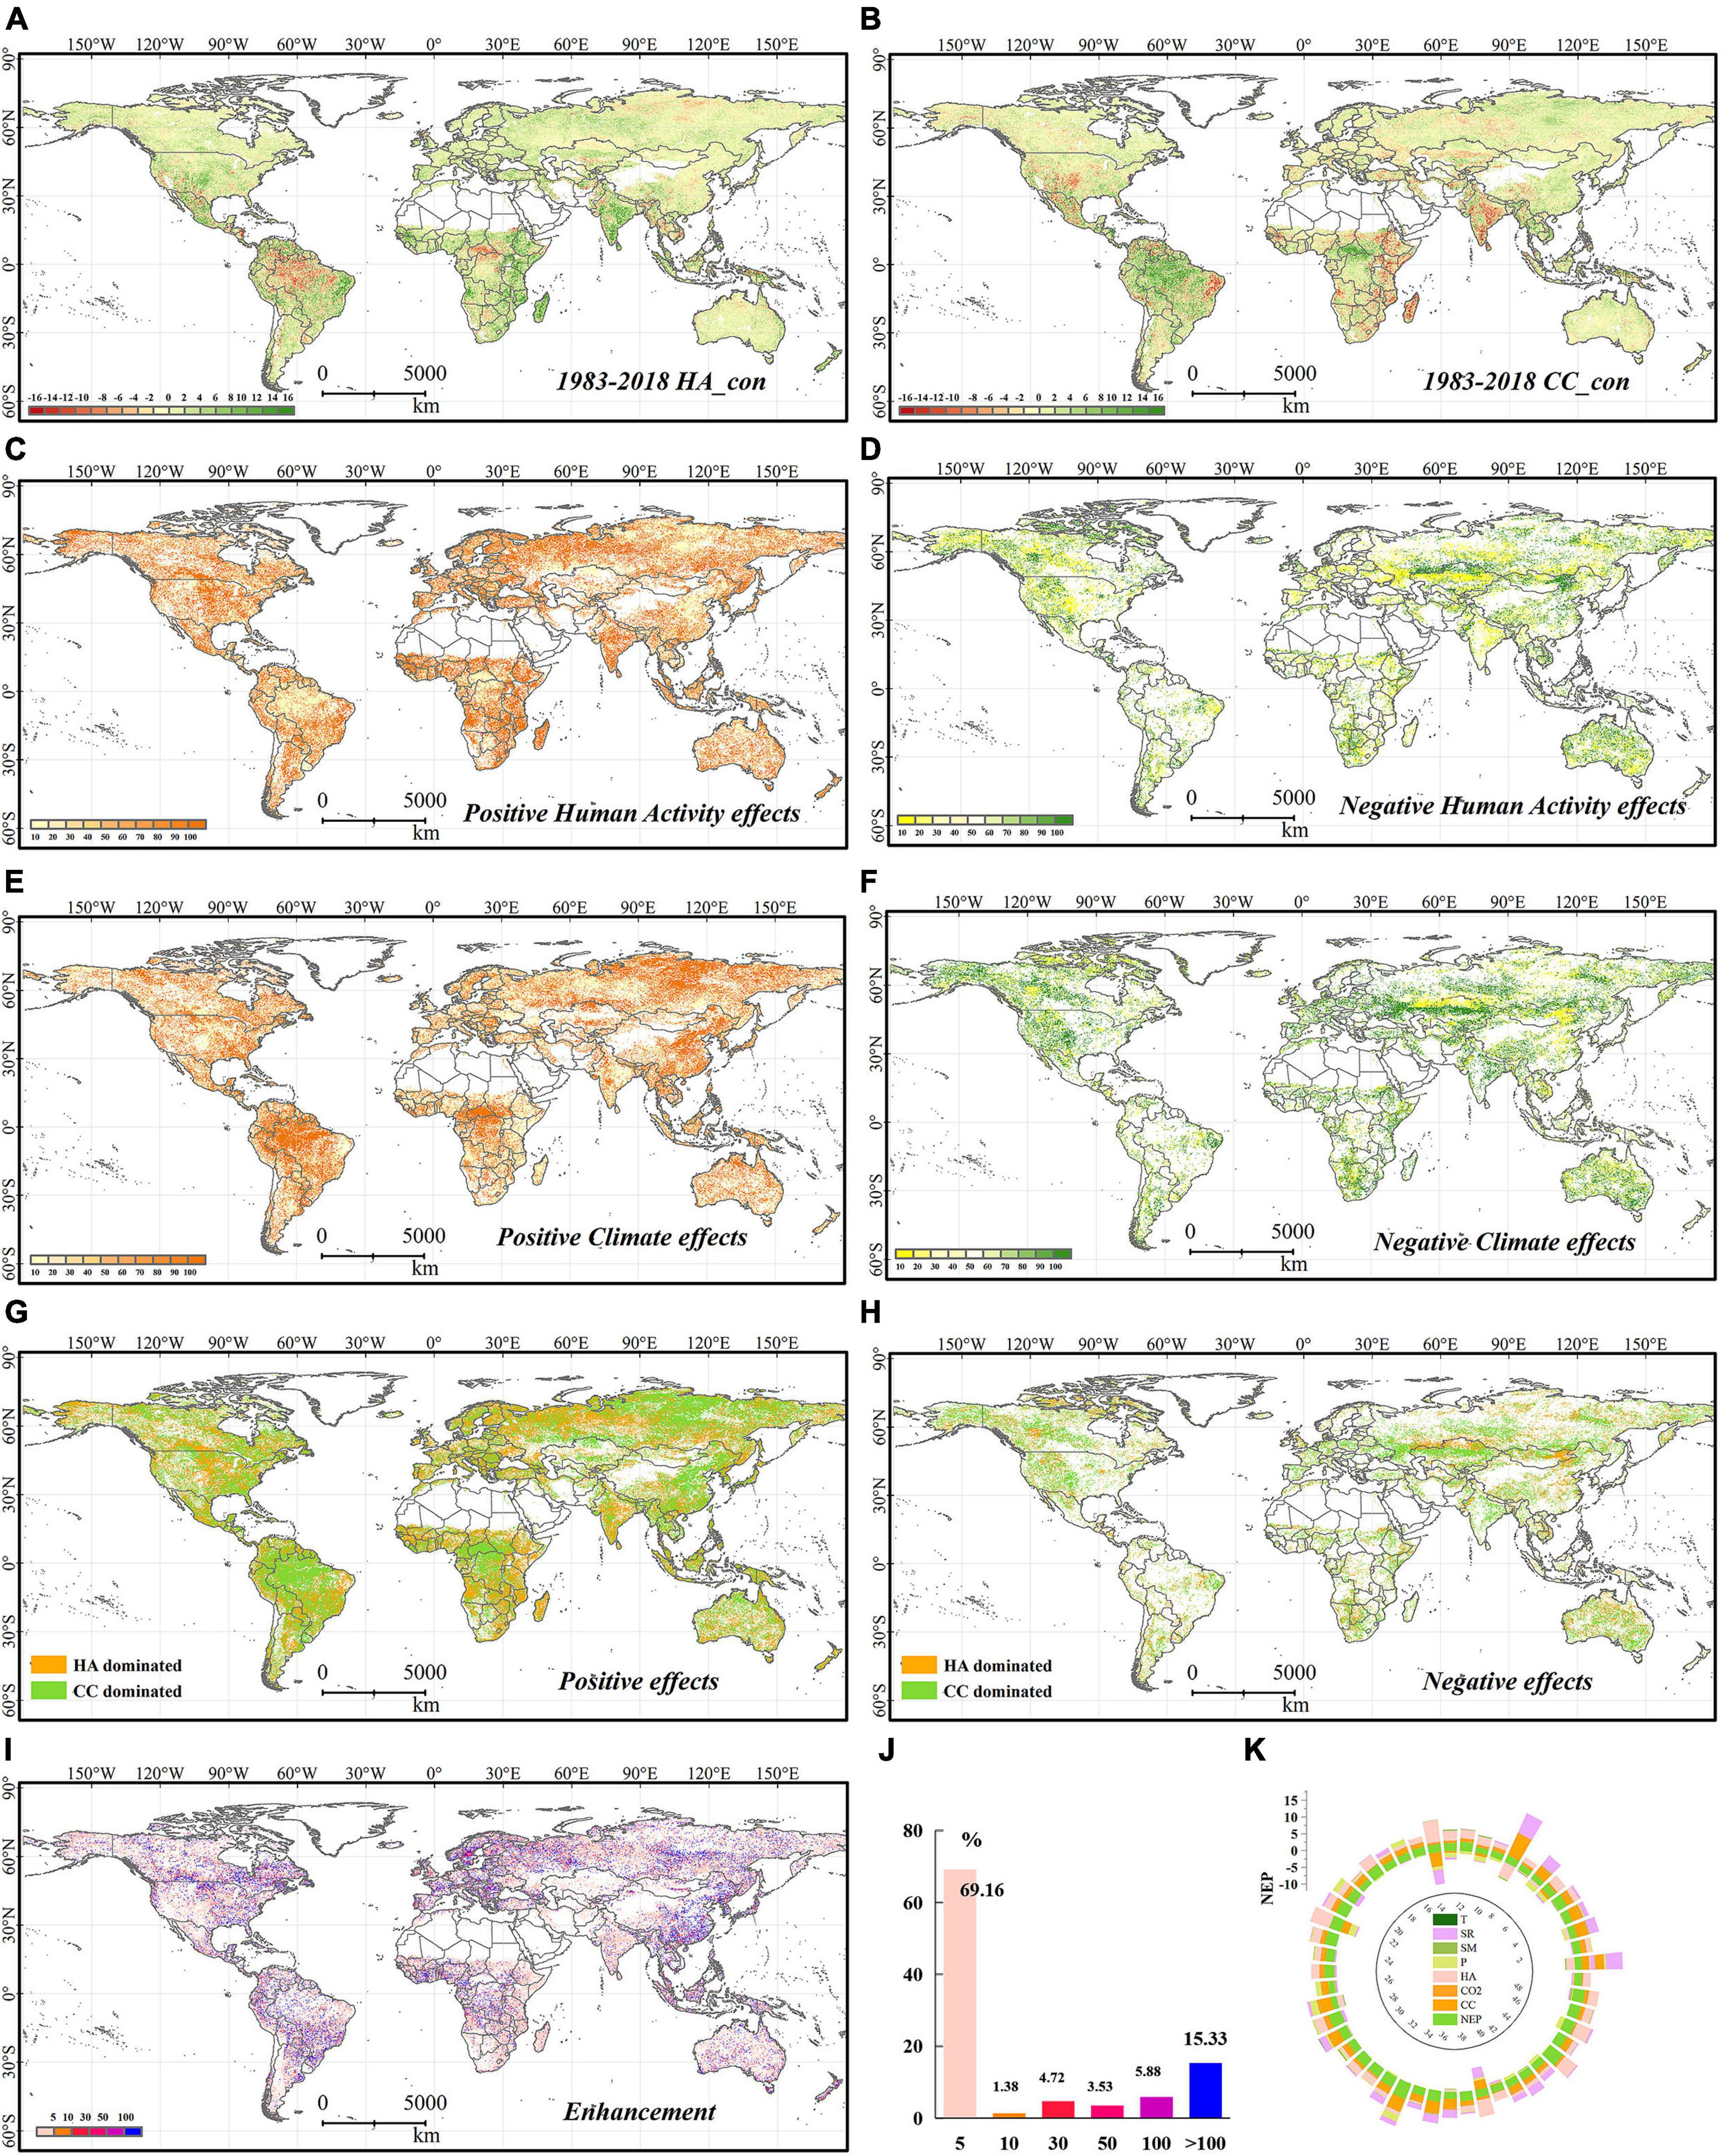
Figure 5. The HA_con (A) and the CC_con (B) to NEP, the CC_con and HA_con to NEP increasing (C,E) and decreasing (D,F); spatial pattern of the CC and HA controlled the increasing (G) and decreasing (H) of the NEP; spatial diagram of the positive of CC_con to HA_con (I); the proportions that CC enhances the HA_con (J); the trend of NEP in the top 50 countries of global (K).
In addition, for the purpose of this study, the CC_con and HA_con were quantitatively analyzed for increasing or decreasing NEP using the method of Table 1. The positive effect of HA_con was obvious in North America and India (Figure 5C), and the NEP in South America, southern-central Africa, northern Asia, and eastern China was mainly due to the CC_con (Figure 5E). Negative HA_con was mainly found in northern Asia, such as northern China, northern Kazakhstan and northern Russia (Figure 5D). In the Europe and Australia, CC_con played a negative role to NEP (Figure 5F). By studying the main controlled areas, the HA and CC controlled 36.33 and 32.79% of the NEP growth areas and controlled 11.76 and 16.13% of the NEP degradation areas (Figures 5G, H) in the world, respectively. In addition, the countries in Figure 5K are ranked according to their NEP trends. Figure 5J shows the proportions that CC enhances the HA_con the NEP and factor contributions for the 167 major countries of the world are shown in Supplementary Table 1. Moreover, when comparing the CC_con and HA_con, we found that the CC_con improved the positive HA_con in 44% of the world. In addition, in one-fifth of the regions, the enhancement effects reached more than half (Figure 5I). Understanding how the CC_con improves the HA_con will help us to further understand what role CC plays in promoting the NEP.
4. Discussion
4.1. Comparison with the driving mechanisms of GPP and NEP
In contrast to the research results, in this study it was found that the CO2 concentration gives the highest contribution to the NEP trend, the T_con was very low and the main regions it controlled was the smallest. This is consistent with the results of previous studies (Chuai et al., 2018; Fernández-Martínez et al., 2019; Zhang L. et al., 2020). The NEP was controlled by a complex interplay between a range of climatic factors. Our further analysis revealed that the main factors driving the GPP were inconsistent with those driving the NEP, but the HA_con was consistentlymuch larger than the CC_con. The HA_con and CC_con to the NEP were 86.48 and 13.54%, respectively, while the GPP was almost entirely controlled by the HA. The CO2 concentration made the largest positive contribution to the GPP (12%), T made the smallest contribution (0.04%), and SR made the largest negative contribution (−11%). Previous studies have shown that the sensitivities of the GPP and NEP to T and SR are not much different (You et al., 2020), and there is no significant relationship between the GPP and P (Chen W. et al., 2019). However, an increase in the annual average T will cause the vegetation growing season to be prolonged and cause an increase in the GPP, and the inter-annual variation in the GPP is not significantly correlated with T on a global scale (Piao et al., 2013). Our study shows that HA had a positive effect on the NEP, and we believe that CC deepened this positive contribution. Overall, assessing the impacts of the climatic factors on the NEP is critical to more accurately predicting the future dynamics of the global carbon cycle and its feedback on the climate system.
4.2. Regional differences
Of the six continents in the world, Australia has the lowest NEP trend and South America the highest (Figure 6). Interestingly, in North America, Africa, and Europe, the NEP was almost entirely controlled by HA, and the main negative contributions of the climatic factors was from the SR. The NEP in South America was entirely controlled by CC, of which the SR_con was 85.42%. HA and CC both contributed positively to the NEP in Australia and Asia, and the HA_con to NEP also contributed positively to the NEP, with values of 85.25 and 81.25%, respectively. SR made a major negative contribution on these two continents, with values of −81.25 and −13.11%, respectively. Among climate factors, the CO2 concentration had the highest positive contribution to the NEP on all six continents except South America.
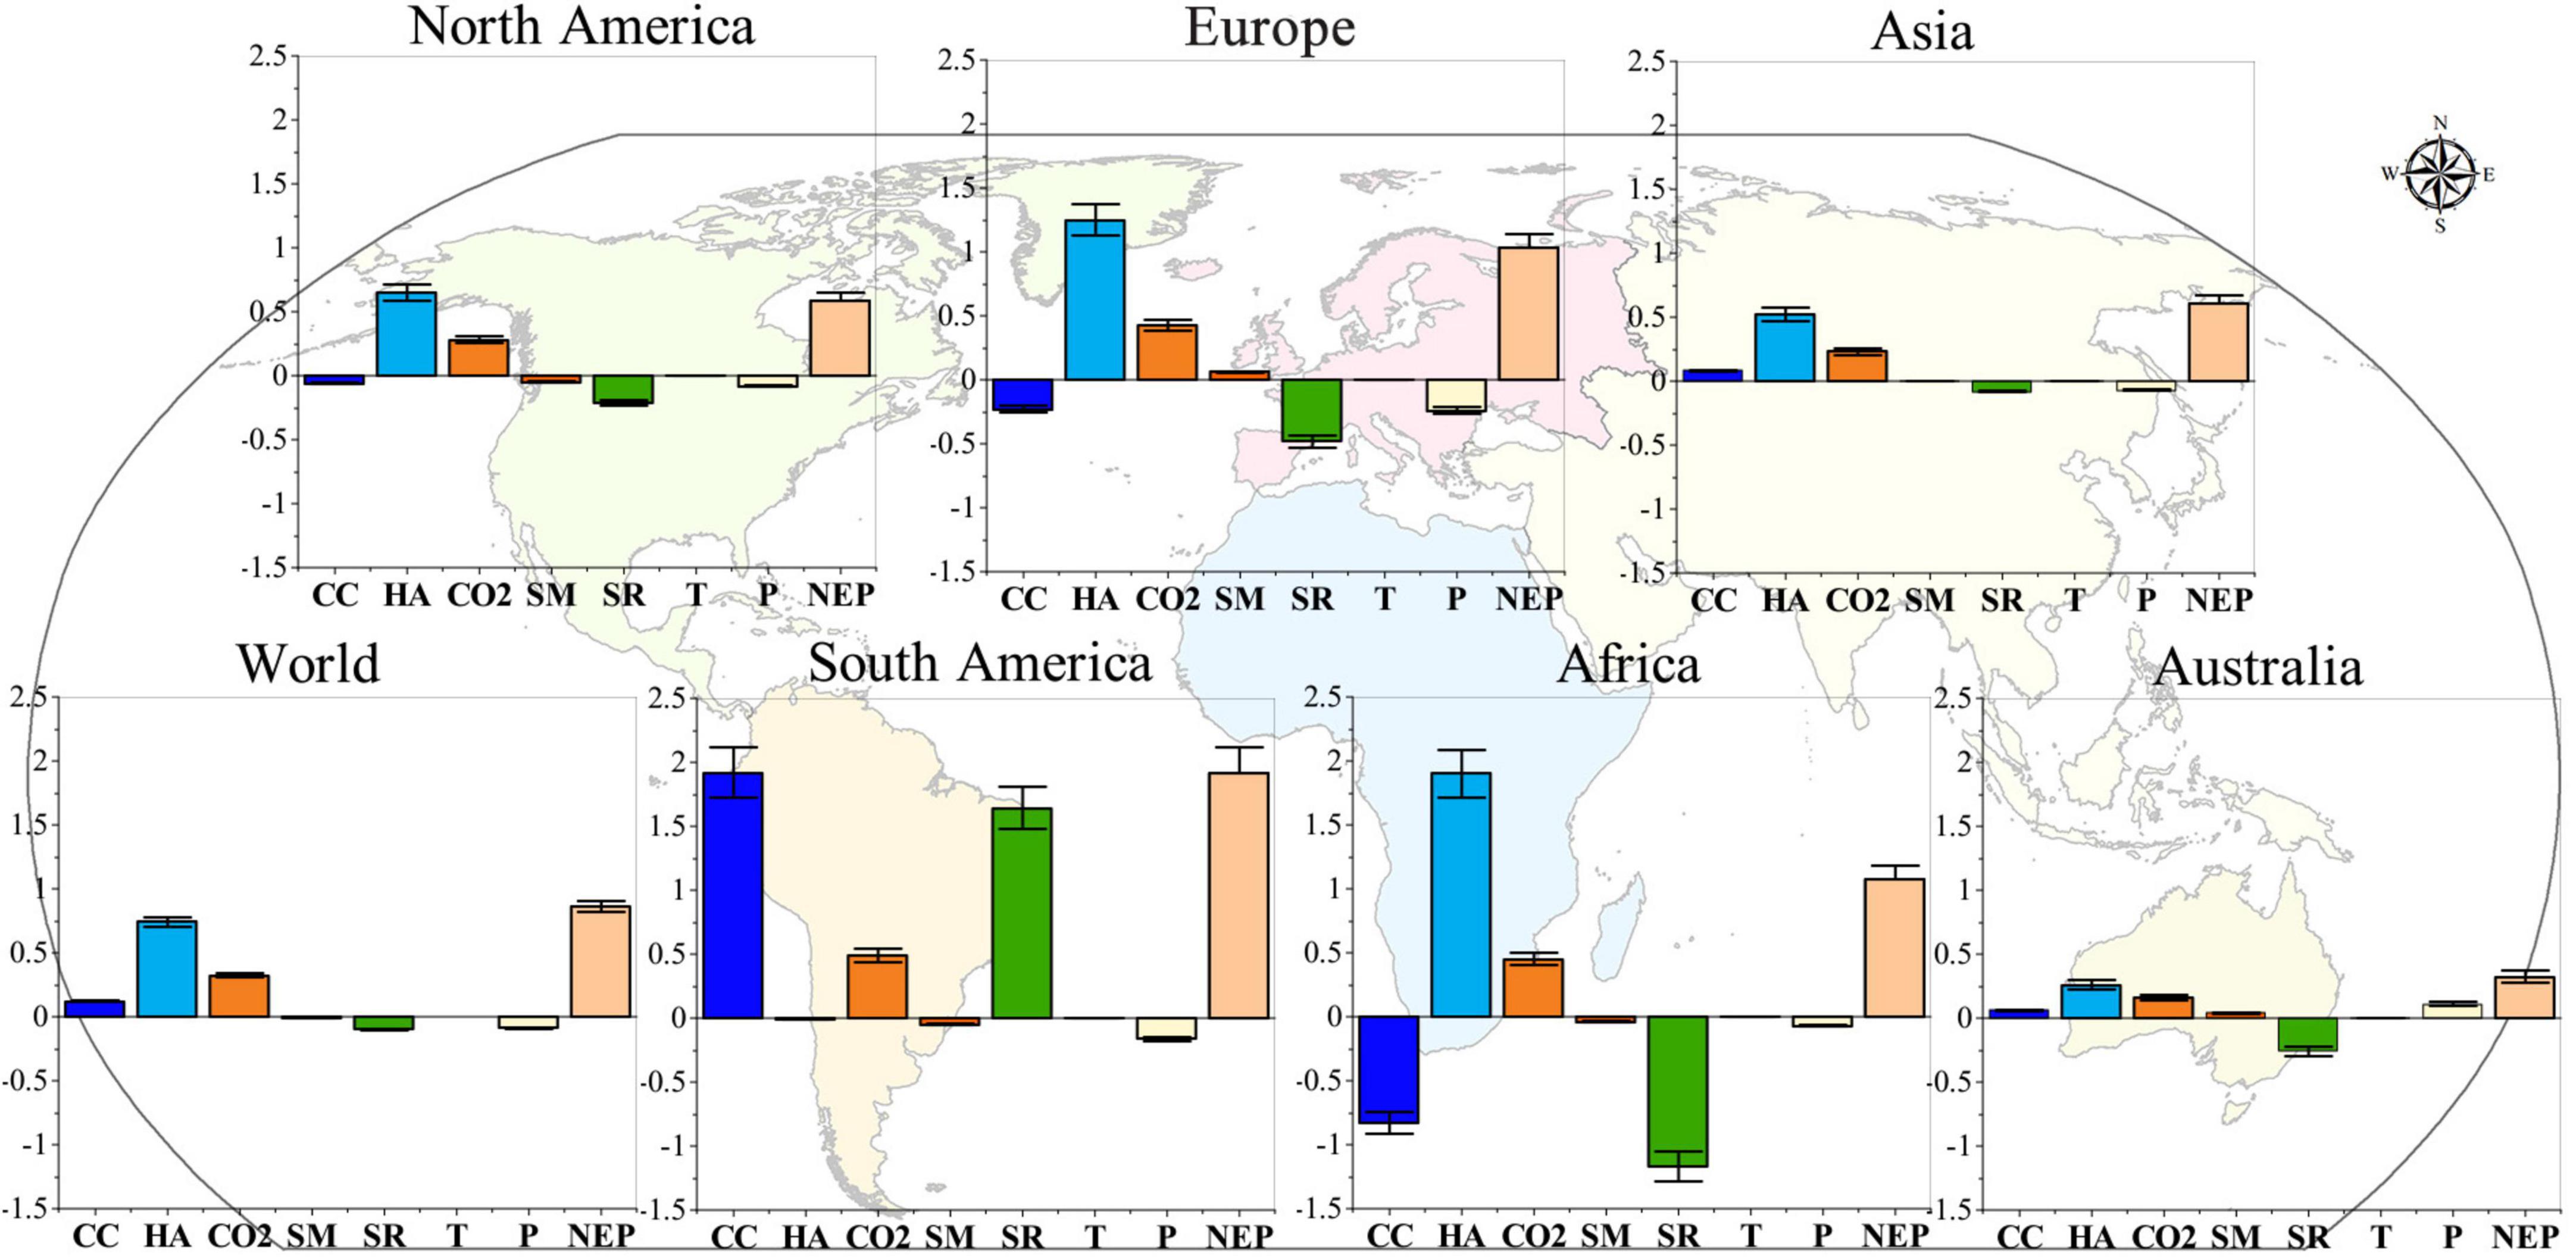
Figure 6. The HA_con and CC_con to NEP in the world and six continents.
Among the top seven countries in terms of land area in the world (Russia, Canada, China, the United States, Brazil, Australia, and India) (Figure 6), CC played the absolute dominant role in the NEP trend in Brazil, and the SR_con was the largest. CC also contributes positively to the NEP trend in China, with CO2 concentration contributed 42.55%, while the opposite was true for the rest of the countries, where HA_con was the strongest. SR made the largest negative contribution to the NEP in India, Australia and the United States. Russia had the strongest negative P_con. The CO2_con for the seven major countries was 43–59%. The CO2 concentration contributed only made a small negative contribution in 10 of the 167 major countries in the world.
4.3. Uncertainties
Overall, the limitations of this study are mainly reflected in the following: Firstly, although climate factors (T, P, CO2, SR, and SM) are closely related to NEP, some natural factors, such as forest age, vegetation type and growing season length, also have a definite impact on NEP (Tang et al., 2014; Migliavacca et al., 2015), which is the direction of our next research. In addition, considering that most of the factors causing nitrogen deposition are man-made factors, such as unreasonable fertilization in farmland, poor management of livestock and poultry manure in livestock farms, coal burning, and automobile exhaust emissions, which will increase the emission of man-made reactive nitrogen into the atmosphere, nitrogen deposition can be summarized in human activities from this perspective. Even though the role of N deposition on NEP has been mentioned in much literature, some studies have shown that the increase in global N deposition since 1981 has only weakly affected the Carbon sink area (Nadelhoffer et al., 1999; Chen H. et al., 2012; Chen J. M. et al., 2019). And, since the 21st century, nitrogen deposition has increased from 316.16 to 331.88, with little overall change. Therefore, the role of nitrogen deposition in HA is included in this paper. This involves the inclusion of other factors (including nitrogen deposition) in the scope of HA in this paper (although we believe that most of the causes of nitrogen deposition are still caused by human activities) will increase the contribution rate of HA to a certain extent, such as food collection, timber harvesting, burning of plant residues, fires (Yin et al., 2020), water erosion and other geological processes that cause carbon leakage. However, this paper is limited by the difficulty of obtaining data and the lack of long-term monitoring of human activities (such as ecological engineering and timber logging), which leads to the inadequacy of this part. Of course, in the next study it will be very necessary to include the effect of nitrogen deposition in the study of long time series. This is also a direction for our further research on how to more carefully quantify the contribution of various factors in human activities to the NEP. We believe that it is of scientific importance to clarify the main limiting factors affecting regional NEP. There are certain uncertainties in the generation of the GPP data products from the modeling results. These errors can be caused by a number of factors, including roughness of the meteorological data and different resolutions of this pixels. In addition, in this study, the spatial data used for the analysis were unified in a 0.25° space due to the limitations of the data. An attempt to evaluate with more fine-resolution multi-source data and measurements will be made in further studies. These limitations should be overcome in future studies. In addition, it is necessary to explore NEP and climate change on the monthly and quarterly scales. Moreover, since the important impact of CO2 concentration on NEP has been obtained in this paper, it is instructive to clarify how the dynamic contribution of CO2 concentration can be used to achieve the goal of carbon neutrality in different future emission scenarios.
In general, in this study, the global NEP from 1983 to 2018 was evaluated, the responses of the NEP to CC and HA were discussed, and detailed analysis was performed on different continents in 167 countries. Despite these uncertainties, this study is critical to improving the understanding of the carbon cycle, and it provides a theoretical understanding of how CC enhances the positive contributions of HA in the context of a changing climate.
5. Conclusion
In this study, the change in the global NEP and its responses to climate change and human activities over the last 40 years were assessed based on sensitivity analysis and BRT models. We choose temperature (T), precipitation (P), solar radiation (SR), soil moisture (SM), and CO2 concentration as the most important climatic factors. A regression model and sensitivity analysis were used to evaluate the CC_con and HA_con to the NEP under six different scenarios on the global scale. The results of this study enhance our knowledge of the CC and HA to the global NEP. The conclusions of this study are as follows.
(1) The NEP increased in 69% of the world between 1983 and 2018, about 79.4–82.6% of the area served as a Carbon sink, i.e., 3.9–4.7 times greater than the carbon source area. And HA and CC controlled 36.33 and 32.79% of the NEP growth, respectively. However, the contribution of HA far exceeded that of CC (i.e., by 6.4 times).
(2) The CO2 concentration had the largest positive contribution (37%) to NEP and the largest influence area (32.5%). Our paper use the BRT models to evaluate the optimal interval that the contribution of climate factor to NEP. We have further measured the optimal contribution interval of each factor, providing a more accurate guide to global NEP. It made the most significant contribution to the NEP trend in the range of 435–440 ppm. In more than 50% of the areas, the main loss factor was SR in any of the areas controlled by the climatic factors. HA and CC controlled 37.33 and 34.79% of the NEP growth, respectively. However, the contribution of HA far exceeded that of CC (i.e., by 6.4 times).
(3) The CC_con and HA_con have been identified in different countries, interestingly, CC improved the positive HA_con to the NEP in 44% of the world. Moreover, in 25% of the area, the enhancement effect reached more than 50%.
Our results clarify a long-standing problem and emphasize the important role of CC to the NEP. Therefore, this study quantitatively distinguishes the influence of each factor on NEP, and determined the best range of climate factor interaction. It is also understood that CC can affect HA to improve NEP on a large scale compared with previous studies.
Data availability statement
The original contributions presented in this study are included in this article/Supplementary material, further inquiries can be directed to the corresponding author.
Author contributions
XB designed the research. ML wrote the manuscript with support of QT, CZ, and LW. FC, YY, GL, and CR performed the data processing and picture making. CL, XL, and SZ performed the language editors and references. All authors contributed to the interpretation of the results and the writing of the manuscript.
Funding
This research work was supported jointly by the Western Light Cross-team Program of Chinese Academy of Sciences (No. xbzg-zdsys-202101), National Natural Science Foundation of China (No. 42077455), the Central Government Leading Local Science and Technology Development (QianKeZhongYinDi [2021]4028), Strategic Priority Research Program of the Chinese Academy of Sciences (Nos. XDB40000000 and XDA23060100), Guizhou Provincial Science and Technology Projects (No. 2022-198), High-level innovative talents in Guizhou Province (GCC[2022]015-1), and Opening Fund of the State Key Laboratory of Environmental Geochemistry (Nos. SKLEG2022206 and SKLEG2022208).
Conflict of interest
The authors declare that the research was conducted in the absence of any commercial or financial relationships that could be construed as a potential conflict of interest.
Publisher’s note
All claims expressed in this article are solely those of the authors and do not necessarily represent those of their affiliated organizations, or those of the publisher, the editors and the reviewers. Any product that may be evaluated in this article, or claim that may be made by its manufacturer, is not guaranteed or endorsed by the publisher.
Supplementary material
The Supplementary Material for this article can be found online at: https://www.frontiersin.org/articles/10.3389/fevo.2022.1101135/full#supplementary-material
Footnotes
- ^ https://data.tpdc.ac.cn
- ^ https://www.nasa.gov/
- ^ http://hydrology.princeton.edu/home.php
- ^ https://ads.atmosphere.copernicus.eu
References
Badgley, G., Anderegg, L. D., Berry, J. A., and Field, C. B. (2019). Terrestrial gross primary production: Using NIRV to scale from site to globe. Glob. Change Biol. 25, 3731–3740. doi: 10.1111/gcb.14729
Baldocchi, D., Ryu, Y., Dechant, B., Eichelmann, E., Hemes, K., Ma, S., et al. (2020). Outgoing near infrared radiation from vegetation scales with canopy photosynthesis across a spectrum of function, structure, physiological capacity and weather. J. Geophys. Res. Biogeosci. 125:e2019JG005534.
Ballantyne, A., Smith, W., Anderegg, W., Kauppi, P., Sarmiento, J., Tans, P., et al. (2017). Accelerating net terrestrial carbon uptake during the warming hiatus due to reduced respiration. Nat. Clim. Change 7, 148–152. doi: 10.1038/nclimate3204
Bond-Lamberty, B., and Thomson, A. (2010). Temperature-associated increases in the global soil respiration record. Nature 464, 579–582. doi: 10.1038/nature08930
Cao, M. K., Prince, S. D., Li, K. R., Tao, B., Small, J., and Shao, X. (2003). Response of terrestrial C uptake to climate interannual variability in China. Glob. Change Biol. 9, 536–546. doi: 10.1186/s13021-022-00215-9
Chen, H., Mo, J. M., Zhang, W., Lu, X. K., and Huang, J. (2012). Effects of nitrogen deposition on carbon sequestration in forest ecosystems. Acta Ecol. Sin. 32, 6864–6879. doi: 10.5846/stxb201109171363
Chen, S. T., Huang, Y., Zou, J. W., Shi, Y. S., Lu, Y. Y., Zhang, W., et al. (2012). Interannual variability in soil respiration from terrestrial ecosystems in China and its response to climate change. Sci. China Earth Sci. 55, 2091–2098. doi: 10.1007/s11430-012-4464-6
Chen, J. M., Ju, W., Ciais, P., Viovy, N., Liu, R., Liu, Y., et al. (2019). Vegetation structural change since 1981 significantly enhanced the terrestrial carbon sink. Nat. Commun. 10:4259. doi: 10.1038/s41467-019-12257-8
Chen, S., Zou, J., Hu, Z., and Lu, Y. (2019). Climate and vegetation drivers of terrestrial carbon fluxes: A global data synthesis. Adv. Atmos. Sci. 36, 679–696. doi: 10.1007/s00376-019-8194-y
Chen, W., Zhu, D., Huang, C., Ciais, P., and Zeng, N. (2019). Negative extreme events in gross primary productivity and their drivers in china during the past three decades. Agric. For. Meteorol. 275, 47–58. doi: 10.1016/j.agrformet.2019.05.002
Chen, Z., Yu, G. R., Zhu, X. J., Wang, Q., Niu, S., and Hu, Z. (2015). Covariation between gross primary production and ecosystem respiration across space and the underlying mechanisms: A global synthesis. Agric. For. Meteorol. 203, 180–190.
Chen, Z., Yu, G., Ge, J., Sun, X., Hirano, T., Saigusa, N., et al. (2013). Temperature and precipitation control of the spatial variation of terrestrial ecosystem carbon exchange in the Asian region. Agric. For. Meteorol. 182-183, 266–276. doi: 10.1016/j.agrformet.2013.04.026
Chuai, X. W., Qi, X. X., Zhang, X. Y., Li, J. S., and Yuan, Y. (2018). Monitoring using terrestrial ecosystem C sinks/sources and their response to climate change in China. Land Degrad. Dev. 29, 3489–3502. doi: 10.1002/ldr.3117
Dechant, B., Ryu, Y., Badgley, G., Zeng, Y., Berry, J. A., Zhang, Y., et al. (2020). Canopy structure explains the relationship between photosynthesis and sun-induced chlorophyll fluorescence in crops. Remote Sens. Environ. 241:111733.
Deng, Y. H., Wang, S. J., Bai, X. Y., Luo, G., Wu, L., Cao, Y., et al. (2020). Variation trend of global soil moisture and its cause analysis. Ecol. Indic. 110:105939. doi: 10.1016/j.ecolind.2019.105939
Deng, Y., Li, X., Shi, F., and Hu, X. (2021). Woody plant encroachment enhanced global vegetation greening and ecosystem water-use efficiency. Glob. Ecol. Biogeogr. 30, 2337–2353. doi: 10.1111/geb.13386
Elith, J., Leathwick, J. R., and Hastie, T. (2008). A working guide to boosted regression trees. J. Anim. Ecol. 77, 802–813. doi: 10.1111/j.1365-2656.2008.01390.x
Fang, J., Piao, S., Tang, Z., Peng, C., and Ji, W. (2001). Interannual variability in net primary production and precipitation. Science 293:1723. doi: 10.1126/science.293.5536.1723a
Fay, P. A., Carlisle, J. D., Knapp, A. K., Blair, J. M., and Collins, S. L. (2003). Productivity responses to altered rainfall patterns in a C4-dominated grassland. Oecologia 137, 245–251. doi: 10.1007/s00442-003-1331-3
Fernández-Martínez, M., Sardans, J., Chevallier, F., Ciais, P., Obersteiner, M., Vicca, S., et al. (2019). Global trends in carbon sinks and their relationships with CO2 and temperature. Nat. Clim. Change 9, 73–79. doi: 10.1038/s41558-018-0367-7
Forzieri, G., Alkama, R., Miralles, D. G., and Cescatti, A. (2018). Satellites reveal contrasting responses of regional climate to the widespread greening of earth. Science 1727, 1180–1184.
Forzieri, G., Miralles, D. G., Ciais, P., Alkama, R., and Cescatti, A. (2020). Increased control of vegetation on global terrestrial energy fluxes. Nat. Clim. Change 10, 356–362. doi: 10.1038/s41558-020-0717-0
Fu, Z., Dong, J., Zhou, Y., Stoy, P., and Niu, S. (2017). Long term trend and interannual variability of land carbon uptake–the attribution and processes. Environ. Res. Lett. 12:014018. doi: 10.1088/1748-9326/aa5685
Gong, J., Zhang, Y., and Qian, C. Y. (2017). Spatial-temporal changes of net ecosystem productivity in the Belongjiang River Basin, Gansu Province. Acta Ecol. Sin. 15, 5121–5128.
Grant, R. F., Baldocchi, D. D., and Ma, S. (2012). Ecological controls on net ecosystem productivity of a seasonally dry annual grassland under current and future climates: Modelling with ecosys. Agric. For. Meteorol. 152, 189–200. doi: 10.1016/j.agrformet.2011
Izaurralde, R. C., Thomson, A. M., Morgan, J. A., Fay, P. A., Polley, H. W., and Hatfield, J. L. (2011). Climate impacts on agriculture: Implications for forage and rangeland production. Agron. J. 103, 371–381. doi: 10.2134/agronj2010.0304
John, R., Chen, J. Q., Kim, Y., Ou-Yang, Z., Xiao, J., Park, H., et al. (2016). Differentiating anthropogenic modification and precipitation-driven change on vegetation productivity on the Mongolian Plateau. Landsc. Ecol. 31, 547–566.
Keenan, T. F., Prentice, I. C., Canadell, J. G., Williams, C. A., Wang, H., Raupach, M., et al. (2016). Recent pause in the growth rate of atmospheric CO2 due to enhanced terrestrial C uptake. Nat. Commun. 7:13428. doi: 10.1038/ncomms13428
Keenan, T., Gray, J., Friedl, M., Toomey, M., Bohrer, G., Hollinger, D., et al. (2014). Net carbon uptake has increased through warming-induced changes in temperate forest phenology. Nat. Clim. Change 4, 598–604. doi: 10.1038/nclimate2253
Kitamura, K., Nakai, Y., Suzuki, S., Ohtani, Y., Yamanoi, K., and Sakamoto, T. (2012). Interannual variability of net ecosystem production for a broadleaf deciduous forest in Sapporo, Northern Japan. J. For. Res. 17, 323–332. doi: 10.1007/s10310-012-0335-4
Kong, R., Zhang, Z. X., Huang, R. C., Tian, J., Feng, R., and Chen, X. (2022). Projected global warming-induced terrestrial ecosystem carbon across China under SSP scenarios. Ecol. Indic. 139:108963. doi: 10.1016/j.ecolind.2022.108963
Krausmann, F., Haberl, H., Erb, K., Wiesinger, M., Gaube, V., and Gingrich, S. (2009). What determines geographical patterns of the global human appropriation of net primary production? J. Land Use Sci. 4, 15–33. doi: 10.1093/nsr/nwaa145
Krishnan, P., Black, T. A., Grant, N. J., Barr, A. G., Hogg, E. H., Jassal, R. S., et al. (2006). Impact of changing soil moisture distribution on net ecosystem productivity of a boreal aspen forest during and following drought. Agric. For. Meteorol. 139, 208–223. doi: 10.1016/j.agrformet.2006.07.002
Li, C. J., Bai, X. Y., Tan, Q., Luo, G., Wu, L., Chen, F., et al. (2022). High-resolution mapping of the global silicate weathering carbon sink and its long-term changes. Glob. Change Biol. 28, 4377–4394. doi: 10.1111/gcb.16186
Li, X., Li, Y., Chen, A., Gao, M., Slette, I. J., and Piao, S. (2019). The impact of the 2009/2010 drought on vegetation growth and terrestrial carbon balance in Southwest China. Agric. For. Meteorol. 269–270, 239–248. doi: 10.1016/j.agrformet.2019.01.036
Li, Z., Chen, Y., Zhang, Q., and Li, Y. (2020). Spatial patterns of vegetation C sinks and sources under water constraint in central Asia. J. Hydrol. 590:125355. doi: 10.1016/j.jhydrol.2020.125355
Liu, M., Bai, X., Tan, Q., Luo, G., Zhao, C., Wu, L., et al. (2021). Monitoring impacts of ecological engineering on ecosystem services with geospatial techniques in karst areas of SW China. Geocarto Int. 10, 1–25. doi: 10.1080/10106049.2021.190
Liu, W., Zhang, Z., and Wan, S. (2010). Predominant role of water in regulating soil and microbial respiration and their responses to climate change in a semiarid grassland. Glob. Change Biol. 15, 184–195. doi: 10.1111/j.1365-2486.2008.01728.x
Lu, F., Zhang, Y., and Qin, Y. (2013). Spatial pattern of carbon source and sink in provincial regions of China. Prog. Geogr. 32:9.
Luyssaert, S., Jung, M., Richardson, A. D., Reichstein, M., Papale, D., Piao, S. L., et al. (2007). CO2 balance of boreal, temperate, and tropical forests derived from a global database. Glob. Change Biol. 13, 2509–2537. doi: 10.1111/j.1365-2486.2007.01439.x
Luyssaert, S., Schulze, E., Börner, A., Knohl, A., Hessenmöller, D., Law, B. E., et al. (2008). Old-growth forests as global carbon sinks. Nature 455, 213–215. doi: 10.1038/nature07276
Mahecha, M. D., Reichstein, M., Carvalhais, N., Lasslop, G., Lange, H., Seneviratne, S. I., et al. (2010). Global convergence in the temperature sensitivity of respiration at ecosystem level. Science 329, 838–840. doi: 10.1126/science.1189587
Mann, H. B. (1945). Nonparametric tests against trend. Econometrica 13, 245–259. doi: 10.2307/1907187
Mathur, M. (2014). Functional dynamics of energy variables and their impacts on growth and population attributes of a woody perennial at arid wasteland. Aust. J. Bot. 62, 490–498. doi: 10.1071/BT14180
Medvigy, D., Wofsy, S. C., Munger, J. W., and Moorcroft, P. R. (2010). Responses of terrestrial ecosystems and C budgets to current and future environmental variability. Proc. Natl. Acad. Sci. U.S.A. 107, 8275–8280. doi: 10.1073/pnas.0912032107
Migliavacca, M., Reichstein, M., Richardson, A. D., Colombo, R., Sutton, M. A., Lasslop, G., et al. (2015). Semiempirical modeling of abiotic and biotic factors controlling ecosystem respiration across eddy covariance sites. Glob. Change Biol. 17, 390–409. doi: 10.1111/j.1365-2486.2010.02243.x
Mitchell, M., Johansen, K., Maron, M., McAlpine, C. A., Wu, D., and Rhodes, J. R. (2018). Identification of fine scale and landscape scale drivers of urban aboveground carbon stocks using high-resolution modeling and mapping. Sci. Total Environ. 622–623, 57–70. doi: 10.1016/j.scitotenv.2017.11.255
Nadelhoffer, K., Emmett, B., Gundersen, P., Kjønaas, O., Koopmans, C., and Schleppi, P. (1999). Nitrogen deposition makes a minor contribution to carbon sequestration in temperate forests. Nature 398, 145–148. doi: 10.1038/18205
Nayak, R. K., Patel, N. R., and Dadhwal, V. K. (2013). Inter-annual variability and climate control of terrestrial net primary productivity over India. Int. J. Climatol. 33, 132–142. doi: 10.1002/joc.3414
Ni, S. L., Fu, Z., Luo, Y. Q., Stoy, P., Keenan, T. F., Poulter, B., et al. (2017). Interannual variability of ecosystem C exchange: From observation to prediction. Glob. Ecol. Biogeogr. 26, 1225–1237. doi: 10.1111/geb.12633
Peng, S., Piao, S., Ciais, P., Myneni, R., Chen, A., Chevallier, F., et al. (2013). Asymmetric effects of daytime and night-time warming on Northern Hemisphere vegetation. Nature 501, 88–92. doi: 10.1038/nature12434
Piao, S. L., Huang, M., Liu, Z., Wang, X., Ciais, P., Canadell, J., et al. (2018). Lower land-use emissions responsible for increased net land carbon sink during the slow warming period. Nat. Geosci. 11, 739–743. doi: 10.1038/s41561-018-0204-7
Piao, S. L., Ito, A., Li, S. G., Huang, Y., Ciais, P., Wang, X. H., et al. (2012). The carbon budget of terrestrial ecosystems in East Asia over the last two decades. Biogeosciences 9, 4025–4066. doi: 10.5194/bg-9-3571-2012
Piao, S. L., Sitch, S., Ciais, P., Friedlingstein, P., Peylin, P., Wang, X., et al. (2013). Evaluation of terrestrial carbon cycle models for their response to climate variability and to CO2 trends. Glob. Change Biol. 19, 2117–2132. doi: 10.1111/gcb.12187
Piao, S., Fang, J., Ciais, P., Peylin, P., Huang, Y., Sitch, S., et al. (2010). The carbon balance of terrestrial ecosystems in China. China Basic Sci. 458, 1009–1013.
Piao, S., Fang, J., Ciais, P., Peylin, P., Huang, Y., Sitch, S., et al. (2009). The carbon balance of terrestrial ecosystems in China. Nature 458, 1009–1013. doi: 10.1038/nature07944
Poulter, B., Frank, D., Ciais, P., Myneni, R. B., Andela, N., Bi, J., et al. (2014). Contribution of semi-arid ecosystems to interannual variability of the global carbon cycle. Nature 509, 600–603. doi: 10.1038/nature13376
Pourghasemi, H. R., and Rahmati, O. (2017). Prediction of the landslide susceptibility: Which algorithm, which precision? CATENA 162, 177–192. doi: 10.1016/j.catena.2017.11.022
Rodell, M., Houser, P. R., Jambor, U., Gottschalck, J., Mitchell, K., Meng, C., et al. (2004). The global land data assimilation system. Bull. Am. Meteorol. Soc. 85:381. doi: 10.1175/BAMS-85-3-381
Ru, J., Zhou, Y., Hui, D., Zheng, M., and Wan, S. (2018). Shifts of growing-season precipitation peaks decrease soil respiration in a semiarid grassland. Glob. Change Biol. 24, 1001–1011. doi: 10.1111/gcb.13941
Sen, P. K. (1968). Estimates of the regression coefficient based on Kendall’s Tau. J. Am. Stat. Assoc. 63, 1379–1389. doi: 10.1080/01621459.1968.10480934
Sitch, S., Cox, P. M., Collins, W. J., and Huntingford, C. (2007). Indirect radiative forcing of climate change through ozone effects on the land-carbon sink. Nature 448, 791–794. doi: 10.1038/nature06059
Smith, B., Wårlind, D., Arneth, A., Hickler, T., Leadley, P., and Siltberg, J. (2014). Implications of incorporating n cycling and n limitations on primary production in an individual-based dynamic vegetation model. Biogeosciences 11, 2027–2054.
Song, F. J., Wang, S., Bai, X. Y., Wu, L., Wang, J., Li, C., et al. (2022). A new indicator for global food security assessment: Harvested area rather than cropland area. Chin. Geogr. Sci. 32, 204–217. doi: 10.1007/s11769-022-1264-6
Steffen, W., Noble, N., Canadell, J., Apps, M., Schulze, E., and Jarvis, P. G. (1998). The terrestrial carbon cycle: Implications for the Kyoto. Protoc. Sci. 280:1393. doi: 10.1126/science.280.5368.1393
Sun, H., Bai, Y., Lu, M., Wang, J., Tuo, Y., Yan, D., et al. (2021). Drivers of the water use efficiency changes in China during 1982–2015. Sci. Total Environ. 799:149145. doi: 10.1016/j.scitotenv.2021.149145
Swets, J. (1988). Measuring the accuracy of diagnostic systems. Science 240, 1285–1293. doi: 10.1126/science.3287615
Tan, Z. H., Zhang, Y. P., Schaefer, D., Yu, G. R., Liang, N. S., and Song, Q. H. (2011). An old-growth subtropical Asian evergreen forest as a large C sink. Atmos. Environ. 45, 1548–1554. doi: 10.1016/j.atmosenv.2010.12.041
Tang, J., Luyssaert, S., Richardson, A. D., Kutsch, W., and Janssens, I. (2014). Steeper declines in forest photosynthesis than respiration explain age-driven decreases in forest growth. Proc. Natl. Acad. Sci. U.S.A. 111, 8856–8860. doi: 10.1073/pnas.1320761111
Tao, B., Cao, M. K., Li, K. R., Gu, F., Ji, J., Mei, H., et al. (2007). Spatial patterns of terrestrial net ecosystem productivity in China during 1981–2000. Sci. China Ser. D Earth Sci. 50, 745–753. doi: 10.1007/s11430-007-0022-z
Tian, H. Q., Jerry, M., Lu, C. Q., Kicklighter, D., Liu, M., Ren, W., et al. (2011). China’s terrestrial carbon balance: Contributions from multiple global change factors. Glob. Biogeochem. Cycles 25:GB1007. doi: 10.1029/2010GB003838
Tian, H., Melillo, J. M., Kicklighter, D. W., Pan, S., Liu, J., and McGuire, A. D. (2003). Regional carbon dynamics in monsoon Asia and its implications for the global carbon cycle. Glob. Planet. Change 37, 201–217. doi: 10.1016/S0921-8181(02)00205-9
Tian, Y. C., Bai, X. Y., Wang, S. J., Qin, L., and Li, Y. (2017). Spatial-temporal changes of vegetation cover in Guizhou Province, Southern China. Chin. Geogr. Sci. 27, 25–38. doi: 10.1007/s11769-017-0844-3
Wang, C., Zhao, W., and Zhang, Y. (2022). The change in net ecosystem productivity and its driving mechanism in a mountain ecosystem of arid regions, Northwest China. Remote Sens. 14:4046. doi: 10.3390/rs14164046
Wang, J., Feng, L., Palmer, P. I., Liu, Y., Fang, S., Bösch, H., et al. (2020). Large Chinese land carbon sink estimated from atmospheric carbon dioxide data. Nature 586, 720–723.
Wang, Q., Han, Z., Zhu, X., and Yu, G. (2015). Primary estimation of Chinese terrestrial C sequestration during 2001–2010. Sci. Bull. 60, 577–590. doi: 10.1007/s11434-015-0736-9
Wang, S., and Zhang, Y. (2020). Long-term (1982-2018) global gross primary production dataset based on NIRv. Natl. Tibetan Plateau Data Center doi: 10.6084/m9.figshare.12981977.v2
Wang, S., Zhang, Y., Ju, W., Qiu, B., and Zhang, Z. (2021). Tracking the seasonal and inter-annual variations of global gross primary production during last four decades using satellite near-infrared reflectance data. Sci. Total Environ. 755:142569. doi: 10.1016/j.scitotenv.2020.142569
Wang, X., Piao, S., Ciais, P., Friedlingstein, P., Myneni, R. B., Cox, P., et al. (2014). A two-fold increase of carbon cycle sensitivity to tropical temperature variations. Nature 506, 212–215. doi: 10.1038/nature12915
Woodwell, G. M., Whittaker, R. H., Reiners, W. A., Likens, G., Delwiche, C., and Botkin, D. (1978). The biota and the world carbon budget. Science 199, 141–146. doi: 10.1126/science.199.4325.141
Wu, L. H., Wang, S. J., Bai, X. Y., Tian, Y., Luo, G., Wang, J., et al. (2020). Climate change weakens the positive effect of human activities on karst vegetation productivity restoration in southern China. Ecol. Indic. 115:106392.
Wu, X., and Jiang, D. (2022). Probabilistic impacts of compound dry and hot events on global gross primary production. Environ. Res. Lett. 17:034049.
Xiao, B. Q., Bai, X. Y., Zhao, C. W., Tan, Q., Li, Y., Luo, G., et al. (2023). Responses of carbon and water use efficiencies to climate and land use changes in China’s karst areas. J. Hydrol. 617:128968. doi: 10.1016/j.jhydrol.2022.128968
Xiao, J. F., Sun, G., Chen, J. Q., Chen, H., Chen, S., and Dong, G. (2013). Carbon fluxes, evapotranspiration, and water use efficiency of terrestrial ecosystems in China. Agric. For. Meteorol. 182–183, 76–90. doi: 10.1016/j.agrformet.2013.08.007
Xiong, L., Bai, X. Y., Zhao, C. W., Li, Y., Tan, Q., Luo, G., et al. (2022). High-resolution data sets for global carbonate and silicate rock weathering carbon sinks and their change trends. Earths Future 10:e2022EF002746. doi: 10.1029/2022EF002746
Yan, Y. C., Liu, X. P., Wen, Y. Y., and Ou, J. M. (2019). Quantitative analysis of the contributions of climatic and human factors to grassland productivity in Northern China. Ecol. Indic. 103, 542–553.
Yin, Y., Bloom, A. A., Worden, J., Saatchi, S., Yang, Y., Williams, M., et al. (2020). Fire decline in dry tropical ecosystems enhances decadal land carbon sink. Nat. Commun. 11:1900.
You, Y. F., Wang, S. Y., Pan, N. Q., Ma, Y., and Liu, W. (2020). Growth stage-dependent responses of Carbon fixation process of alpine grasslands to climate change over the Tibetan Plateau, China. Agric. For. Meteorol. 291:108085. doi: 10.1016/j.agrformet.2020.108085
Yu, G. R., Chen, Z., Piao, S. L., Peng, C., Ciais, P., Wang, Q., et al. (2014). High carbon dioxide uptake by subtropical forest ecosystems in the East Asian monsoon region. Proc. Natl. Acad. Sci. U.S.A. 111, 4910–4915. doi: 10.1073/pnas.1317065111
Yu, G. R., Zhu, X. J., Fu, Y. L., He, H. L., Wang, Q., Wen, X., et al. (2013). Spatial patterns and climate drivers of carbon fluxes in terrestrial ecosystems of China. Glob. Change Biol. 19, 798–810. doi: 10.1111/gcb.12079
Yuan, W. P., Luo, Y. Q., Richardson, A. D., Oren, R., Luyssaert, S., Janssens, I. A., et al. (2009). Latitudinal patterns of magnitude and interannual variability in net ecosystem exchange regulated by biological and environmental variables. Glob. Change Biol. 15, 2905–2920. doi: 10.1111/.1365-2486.2009.01870.x
Zhang, L., Ren, X., Wang, J., He, H., Wang, S., Wang, M., et al. (2018). Interannual variability of terrestrial net ecosystem productivity over China: Regional contributions and climate attribution. Environ. Res. Lett. 14:014003. doi: 10.1088/1748-9326/aaec95
Zhang, L., Xiao, J., Zheng, Y., Li, S., and Zhou, Y. (2020). Increased Carbon uptake and water use efficiency in global semi-arid ecosystems. Environ. Res. Lett. 15:034022. doi: 10.1088/1748-9326/ab68ec
Zhang, X. Z., Li, Y., Zhang, C. Q., and Liu, H. B. (2020). Analysis of changes in net ecosystem productivity in the shiyang river basin from 2000 to 2014. J. Lanzhou Univ. (Nat. Sci. Ed.) 486–492. doi: 10.13885/j.issn.0455-2059.2020.04.008
Zhang, Y. J., Xu, M., Chen, H., and Adams, J. (2009). Global pattern of NPP to GPP ratio derived from MODIS data: Effects of ecosystem type, geographical location and climate. Glob. Ecol. Biogeogr. 18, 280–290.
Zhou, L., Tucker, C. J., Kaufmann, R. K., Slayback, D., Shabanov, N. V., and Myneni, R. B. (2001). Variations in northern vegetation activity inferred from satellite data of vegetation index during 1981 to 1999. J. Geophys. Res. Atmos. 106, 20069–20083. doi: 10.1029/2000JD000115
Zhou, S., Yu, B., Schwalm, C. R., Ciais, P., Zhang, Y., and Fisher, J. B. (2017). Response of water use efficiency to global environmental change based on output from terrestrial biosphere models. Glob. Biogeochem. Cycles 31, 1639–1655. doi: 10.1002/2017GB005733
Zhou, W., Gang, C., Zhou, F., Li, J., Dong, X., and Zhao, C. (2015). Quantitative assessment of the individual contribution of climate and human factors to desertification in Northwest China using net primary productivity as an indicator. Ecol. Indic. 48, 560–569. doi: 10.1016/j.ecolind.2014.08.043
Zhou, X., Yamaguchi, Y., and Arjasakusuma, S. (2018). Distinguishing the vegetation dynamics induced by anthropogenic factors using vegetation optical depth and AVHRR NDVI: A cross-border study on the Mongolian Plateau. Sci. Total Environ. 616, 730–743. doi: 10.1016/j.scitotenv.2017.10.253
Keywords: climate change, NEP, human activity, CO2 concentration, boosted regression tree
Citation: Liu M, Bai X, Tan Q, Luo G, Zhao C, Wu L, Chen F, Li C, Yang Y, Ran C, Luo X and Zhang S (2023) Climate change enhanced the positive contribution of human activities to net ecosystem productivity from 1983 to 2018. Front. Ecol. Evol. 10:1101135. doi: 10.3389/fevo.2022.1101135
Received: 17 November 2022; Accepted: 28 December 2022;
Published: 19 January 2023.
Edited by:
Guoqi Wen, Laval University, CanadaReviewed by:
Hui Yang, Chinese Academy of Geological Sciences, ChinaLili Jiang, Key Laboratory of Tibetan Environment Changes and Land Surface Processes, Institute of Tibetan Plateau Research (CAS), China
Copyright © 2023 Liu, Bai, Tan, Luo, Zhao, Wu, Chen, Li, Yang, Ran, Luo and Zhang. This is an open-access article distributed under the terms of the Creative Commons Attribution License (CC BY). The use, distribution or reproduction in other forums is permitted, provided the original author(s) and the copyright owner(s) are credited and that the original publication in this journal is cited, in accordance with accepted academic practice. No use, distribution or reproduction is permitted which does not comply with these terms.
*Correspondence: Xiaoyong Bai,  YmFpeGlhb3lvbmdAdmlwLnNrbGVnLmNu