 Olivia M. Smith1
 Eric G. Chapman2
 Michael S. Crossley1
 David W. Crowder3
 Zhen Fu3James D. Harwood4Andrew S. Jensen5
 Karol L. Krey3
 Christine A. Lynch3
 Gretchen B. Snyder3
 William E. Snyder1*
- 1Department of Entomology, University of Georgia, Athens, GA, United States
- 2Department of Entomology, University of Kentucky, Lexington, KY, United States
- 3Department of Entomology, Washington State University, Pullman, WA, United States
- 4Institute of Plant and Environment Protection, Beijing Academy of Agriculture and Forestry Sciences, Beijing, China
- 5Northwest Potato Research Consortium, Olathe, CO, United States
Generalist predators’ complex feeding relationships make it difficult to predict their contribution to pest suppression. Alternative prey can either distract predators from attacking pests, weakening biocontrol, or provide food that support larger predator communities to enhance it. Similarly, predator species might both feed upon and complement one another by occupying different niches. Here, we use molecular gut-content analysis to examine predation of western flower thrips (Frankliniella occidentalis) by two generalist predatory bugs, Geocoris sp. and Nabis sp. We collected predators from conventional and organic potato fields that differed in arthropod abundance and composition, so that we could draw correlations between abundance and biodiversity of predators and prey, and thrips predation. We found that alternative prey influenced the probability of detecting Geocoris predation of thrips through a complex interaction. In conventionally-managed potato fields, thrips DNA was more likely to be detected in Geocoris as total abundance of all arthropods in the community increased. But the opposite pattern was found in organic fields, where the probability of detecting thrips predation by Geocoris decreased with increasing total arthropod abundance. Perhaps, increasing abundance (from a relatively low baseline) of alternative prey triggered greater foraging activity in conventional fields, but drew attacks away from thrips in organic fields where prey were consistently relatively bountiful. The probability of detecting Geocoris predation of thrips generally increased with increasing thrips density, but this correlation was steeper in organic than conventional fields. For both Geocoris and Nabis, greater Nabis abundance correlated with reduced probability of detecting thrips DNA; for Nabis this was the only important variable. Nabis is a common intraguild predator of the smaller Geocoris, and is highly cannibalistic, suggesting that predator-predator interference increased with more Nabis present. Complex patterns of thrips predation seemed to result from a dynamic interaction with alternative prey abundance, alongside consistently negative interactions among predators. This provides further evidence that alternative prey and predator interference must be studied in concert to accurately predict the contributions of generalists to biocontrol.
Introduction
The ability of generalist predators to switch among different prey species often is exploited in conservation biological control (Symondson et al., 2002). For example, plantings of wildflowers or other perennial refuges can provide pollen, nectar, and habitat for prey that can help build predator abundance and diversity (Patt et al., 1997; Blitzer et al., 2012; Balzan et al., 2016; Gurr et al., 2017). However, to be effective, predators must willingly leave the refuge and move into adjacent crop fields (Blaauw and Isaacs, 2012). For example, Middleton and MacRae (2021) found that several kilometers of wildflower plantings around potato (Solanum tuberosum L.) fields yielded a dramatic >50% increase in predator abundances in the refuge. However, these natural enemies did not readily leave the refuge for the cropping fields such that predation of Colorado potato beetle (Leptinotarsa decemlineata Say) eggs was not increased (Middleton and MacRae, 2021). A seemingly simpler approach would be to increase abundance of prey other than pests in the cropping field itself, so that predators can be conserved in-place (Agustí et al., 2003). Settle et al. (1996) found that plant thatch and reduced insecticide applications allowed generalist predator populations to build in Indonesian rice paddies, feeding on detritus-feeding prey, before plants emerged and were colonized by herbivores; the predators then switched to attacking pests as detritivores declined and herbivores increased (see also Brust, 1994; Stoner et al., 1996; Johnson et al., 2004). However, here too success is not guaranteed. For example, Halaj and Wise (2002) found that adding straw mulch to cucurbit plantings built densities of detritus-feeding prey and greatly enhanced generalist predator abundance, but pest control was not improved because the predators never switched to attacking herbivores. These examples highlight that alternative prey can indirectly enhance the biocontrol effectiveness of generalists in some situations, but disrupt it in others (Eubanks and Denno, 2000a,b; Harmon and Andow, 2004; Koss and Snyder, 2005; Symondson et al., 2006).
Another complexity when considering generalist predators as biocontrol agents, is that they often feed on one another in addition to pests (Rosenheim, 1998; Paul et al., 2020). Intraguild predation is most disruptive when a predator both infrequently feeds on the pest and heavily attacks the pest’s key natural enemy (Finke and Denno, 2004; Ives et al., 2005). It is important to note that biological control can be disrupted even when predators do not commonly feed on one another, if a predator species reduces its foraging activity to avoid becoming a victim of intraguild predation (Preisser et al., 2005, 2007). Often, prey and predator abundance and diversity interact to determine how often intraguild predation occurs (Finke and Denno, 2002). When predator abundance is relatively high and herbivores are uncommon, intraguild predation offers a way for predators to escape food limitation (Hironori and Katsuhiro, 1997). However, when prey is relatively plentiful, generalists might often encounter and kill herbivorous or detritus-feeding prey rather than natural enemies (Lucas et al., 1998). More broadly, a high diversity of other prey might allow predators to move into separate feeding niches that lead to fewer predator-predator encounters, and thus less intraguild predation (Schmitz et al., 1997; Letourneau et al., 2009; Schmitz, 2009; Dainese et al., 2017; Jonsson et al., 2017; Greenop et al., 2018). Of course, in the field, abundances of alternative prey and intraguild predators might widely vary from site to site and throughout the year, leading to complex indirect effects on pest suppression by generalists (Snyder, 2019).
Here, we use molecular gut-content analysis to track predation of herbivorous western flower thrips (Frankliniella occidentalis) by the predatory bugs Geocoris sp. and Nabis sp. [molecular identification failed to reveal a confident species determination for either predator; Krey et al. (2021)] in potato (S. tuberosum) fields. The crops were managed by growers using organic or conventional management practices, which creates site-to-site differences in predator and prey communities (Koss et al., 2005; Crowder et al., 2010; Krey et al., 2021). Both predator taxa are generalists that presumably feed on a broad diversity of arthropods, with thrips typically being among the most abundant herbivores at our study sites (Krey et al., 2021). Our central hypotheses were that (1) greater arthropod abundance and/or diversity would increasingly draw attacks away from thrips, reducing the probability of detecting thrips predation by Geocoris and Nabis, but that (2) this could be counteracted by reduced predator-predator interference in fields with more robust arthropod communities, indirectly enhancing foraging efficiency by the generalists.
Materials and Methods
Our project had three complementary components. First, we developed a species-specific PCR primer that allowed detection of DNA of F. occidentalis. Second, we surveyed densities of Nabis and Geocoris predators, thrips, and other arthropods that might serve as prey, in organic and conventional potato fields managed by cooperating commercial growers (see Krey et al., 2021). Third, during these arthropod community surveys we used molecular gut content analysis to test a subsample of Nabis and Geocoris adults for the presence of F. occidentalis DNA, using model fitting to attempt to link detection of thrips DNA to management and arthropod community metrics.
Primer Design
To design primers to test for F. occidentalis consumption, all of the thrips cytochrome c oxidase subunit I (COI) sequences available on GenBank were downloaded with the search criterion “thrips and (coi or co1 or cox1)” which resulted in ∼567 hits (search conducted in September, 2011). We also generated 34 COI barcode sequences from thrips specimens collected in Washington potato fields. After removal of duplicate sequences and sequences that would not align (using MUSCLE; Edgar, 2004) with the barcode region (Hebert et al., 2003), and adding ours, we were left with an alignment that included 530 operational taxonomic units (OTU). After using maximum likelihood (Garli 0.95, default settings; Zwickl, 2006) to build a tree from these terminals, OTUs were arranged in the data set in a similar fashion to the relationships shown in the maximum likelihood tree. This facilitated easy searches for DNA sites that were different from the other species (especially closely-related ones), and therefore potentially specific to F. occidentalis. Seven pairs of primers were initially designed such that the 3′ base was as unique to F. occidentalis as possible. Primer properties (e.g., self-complementarity, melting temperature, % GC-content) were examined using Primer3 (Rozen and Skaletsky, 1998). Initial testing showed that one pair worked better than the others, so we optimized it for amplification of F. occidentalis (see below). The primers we identified were Frank-84-F (5′- CTTTTAAACTATTTATTAGAAATGAC-3′) and Frank-323-R (5′ GTTCCTGCACCATCTTTTGAT-3′) (from 12 COI alleles we generated from F. occidentalis; GenBank accession numbers: MZ677036-MZ677047). The numbers in the primer names reflect the position of the 5′ base relative to an alignment of the barcode region of COI (Hebert et al., 2003) amplified using the Folmer et al. (1994) COI primers. These primers produce a 240 bp amplicon.
Study System
Potato fields in eastern Washington state host a diversity of herbivores. Key pests that are the subject of insecticide applications are the green peach aphid [Myzus persicae (Sulzer)], which is an important virus vector, and the Colorado potato beetle which is a defoliator (Koss et al., 2005). Western flower thrips and a diverse group of leafhoppers are among the most abundant herbivores in these fields (Krey et al., 2021), and are sometimes, although relatively rarely, controlled using insecticides (Kaur, 2021). The detritus-feeding fly Scaptomyza pallida (Zetterstedt) reaches remarkable abundances in these fields, often making up >50% of all arthropods, and appears to be a key alternative prey for generalist predators (Krey et al., 2021). Geocoris are among the most abundant natural enemies, sometimes making up >50% of all predators (Koss et al., 2005). Nabis are less abundant, typically representing ca. 10% of the predator community, but are relatively large predators that attack larger insects such as Geocoris (Krey et al., 2021). Other common predators include coccinellid and carabid beetles and a diverse community of spiders (Koss et al., 2005; Crowder et al., 2010; Krey et al., 2021).
Previously, we described arthropod communities in the same fields considered here, while examining predation of aphids by the same predator individuals (Krey et al., 2021). We found that abundances of Nabis and Geocoris, and also total predator abundance, predator richness, and overall arthropod richness, were significantly higher in organic than conventional fields (Krey et al., 2021). All other arthropod community attributes that we considered (i.e., abundances of aphids [all adults were M. persicae], western flower thrips, Colorado potato beetles, and S. pallida; total arthropod abundance; and predator evenness) did not significantly differ between organic and conventional potato fields (Krey et al., 2021).
Arthropod Survey and Predator Collections in Commercial Potato Fields
We sampled from 6 organic and 6 conventional fields in the first year (2009), 9 organic and 8 conventional fields in the second year (2010), and 6 organic and 6 conventional fields in the third year (2011), with all fields managed by cooperating growers in the Columbia Basin of central Washington in Adams, Benton and Grant counties (see Krey et al., 2017, 2021). All organic fields met organic standards defined by the United States Department of Agriculture, and were the standard ca. 50 ha circles, under center pivot irrigation, typical of the region. In this region, potatoes are rotated with other crops such that no field was sampled twice. Predators were collected in July–early August of each year, which is the approximate midpoint of the growing season (Krey et al., 2017), from 50 haphazardly selected plants using a D-vac suction-sampling device using previously described methods (e.g., Koss et al., 2005; Krey et al., 2017, 2021). Briefly, we haphazardly identified 5 groups of 10 potato plants per field, walking in a zigzag pattern from the field edge toward the center of the field, for sampling. We held the collecting cone over each plant, gently shaking the foliage for 20 s and changed collecting bags between each group of 10 plants (Koss et al., 2005). D-vac bags containing arthropods were immediately placed on dry ice, and up to 80 individuals of Geocoris and Nabis were removed using forceps, placed individually in 95% EtOH in 1.5-mL microcentrifuge tubes on ice for transport, and then transferred to a −80°C freezer to await DNA extraction; Chapman et al. (2010) found that this methodology avoids contamination of predators with prey DNA.
Following the removal of predators for gut-content analysis, all other remaining arthropods from each D-vac bag were retained from vacuum samples and stored in a −20°C freezer before being sorted to allow us to describe overall prey community structure (predators removed from samples for gut-content analysis were included in predator-density estimates for each field). Arthropods were generally identified to family, but sometimes to genus or species for pests, as described in Krey et al. (2017). D-vac bags were washed with a 10% bleach solution and air-dried before being re-used, to further minimize the risk of cross-contamination of DNA from one sampling period to another.
Molecular Gut-Content Analysis
In total, we tested between 5 and 71 Geocoris per field (mean = 48.7 ± 2.32 SE) and between 1 and 82 Nabis per field (mean = 30.5 ± 2.73 SE). Total DNA was extracted from these crushed field-collected predators using the QIAGEN DNeasy Blood & Tissue Kit following the manufacturer’s animal tissue protocol (QIAGEN Inc., Chatsworth, CA, United States). PCRs (25 μL) consisted of 1× Takara buffer (Takara Bio Inc., Shiga, Japan), 0.2 mM of each dNTP, 0.25 mM of each primer, 0.625 U Takara Ex Taq™ (Takara Bio Inc., Shiga, Japan), and template DNA (3 μL of total DNA). PCRs were carried out in Bio-Rad PTC-200 and C1000 thermal cyclers (Bio-Rad Laboratories, Hercules, CA, United States). The optimized thermal cycling protocol was an initial denaturation at 94°C, followed by 45 cycles of 94°C for 45 s (denaturing), 53°C for 45 s (annealing) and 72°C for 30 s (extension). Electrophoresis was used to confirm amplification using 10 μL of PCR product in 1.5% SeaKem agarose (Lonza, Rockland, ME, United States) stained with GelRed (0.1 mg/μL; Phenix Research, Chandler, NC, United States).
Data Analyses
We used the extensive literature on ecological interactions among arthropods in potato fields in our study region, described above, to construct a set of putative models (Supplementary Table 1). Based on this known arthropod community structure and interaction network, the factors we considered in our modeling effort were (i) abundances of the key possible prey species M. persicae, L. decemlineata, F. occidentalis, and S. pallida; (ii) abundances of the focal predators Geocoris sp. and Nabis sp.; (iii) total abundance, species richness, and evenness of predators; and (iv) total abundance, richness, and evenness of all arthropods (Supplementary Table 1). Richness was calculated as the sum of species and evenness using the metric Evar, without rarefaction, as described in Crowder et al. (2012). We examined the impact of arthropod community metrics and farming system on the probability of detecting predation of western flower thrips by Geocoris and Nabis using GLMMs with a binomial distribution and logit link function in the glmmTMB package in R (Brooks et al., 2017). Models included random effects of field and year. First, we made a simple comparison of the likelihood that thrips DNA was detected in Nabis and Geocoris predators collected from organic versus conventional farms. Next, we constructed 35 candidate models that tested the relative importance of each of the arthropod community metrics and their potential additive and interactive effects with farming system (Supplementary Table 1). We z-score transformed arthropod community metrics prior to running our models. We checked assumptions using the DHARMa package in R and did not detect any issues (e.g., overdispersion) (Hartig, 2021). While we considered all combinations of arthropod community metrics and farming system, we did not consider all possible combinations of arthropod community metrics because (1) they are often highly correlated, which would cause multicollinearity issues (Supplementary Figure 1), and (2) the possible candidate model set considering all possible combinations is quite large. We then ranked models based on Akaike Information Criterion (AICc) and identified those that were most supported (ΔAICc < 2.0) (Burnham and Anderson, 2002). Briefly, AICc is a statistical technique intended to select a “best” model among a series of candidate models. AICc has a second order bias correction for AIC [AICc = AIC + (2K (K + 1)/(n − K − 1)] for when sample sizes are small but converges to AIC as sample sizes increase. Change (Δ) in AICc values are on a continuous scale of information relative to other models in the set, where low Δ values have higher relative support (Burnham and Anderson, 2002; Burnham et al., 2011). We assessed multicollinearity for candidate models using the performance package in R (Lüdecke et al., 2020). Multicollinearity was not an issue (VIF < 5).
Results
Western Flower Thrips Primer
Western flower thrips primers were tested for specificity against 174 invertebrate morphospecies including: Araneae (14), Chilopoda (1), Coleoptera (29), Diptera (32), Hemiptera (40), Hymenoptera (36), Lepidoptera (6), Neuroptera (6), Orthoptera (1), Thysanoptera (1), Gastropoda (6) and Nematoda (2), 93 of which were collected from WA potato fields during this study (Supplementary Table 2). PCR of DNA extractions from all of these invertebrate species failed to produce an amplicon with the thrips primers. Examining an alignment of the primers and thrips COI sequences, at least one of these primers has a mismatch at the 1st or 2nd position of the 3′ end in all thrips species closely-related to F. occidentalis. A mismatch within the first two bases at the 3′ end of a primer usually prevents successful extension in PCR, as was confirmed while developing a general aphid COI primer using the same PCR reagents used herein (Chapman et al., 2010). Furthermore, there is a 3-base (single codon) deletion in COI that occurred early in the evolution of the thrips suborder Terebrantia, which contains ∼40% of extant thrips species (see Buckman et al., 2013), and includes F. occidentalis. The reverse primer (Frank-323-R) spans this region such that there is a 3-base insertion in insects outside of the Terebrantia relative to the primer. This insertion occurs between the 1st and 2nd 3′ bases and is probably the main reason that these primers did not amplify any of the taxa in Supplementary Table 2. Given these mismatches and the completely negative non-target test results above, we can be reasonably assured that our primer is specific to the strain of western flower thrips that occurs in Washington potatoes and false positives are reasonably accounted for. False negatives are difficult to address because they are difficult to define. A false negative could arise from (1) a meal of a prey item that has a mutation that stops the primer from annealing or extending (apparently rare from the above testing) or (2) collecting a predator after the DNA in their gut contents has degraded past the point of detectability with our primers. The latter could arise after a variable time period after feeding depending on meal size and metabolic rate of the predator between the time of feeding and collection. Therefore, the rate at which we have detected feeding should be considered a lower bound on the actual predation rate.
Factors Impacting Predation
When ignoring arthropod community attributes or abundance of particular species, and making a simple comparison between organic and conventional potato fields, we found no differences in the probability of detection of western flower thrips DNA in Geocoris [β = −0.33 ± 0.34 (SE), P = 0.33; Figure 1A] nor Nabis [β = −0.21 ± 0.48 (SE), P = 0.66; Figure 1B] collected in the two farming systems.
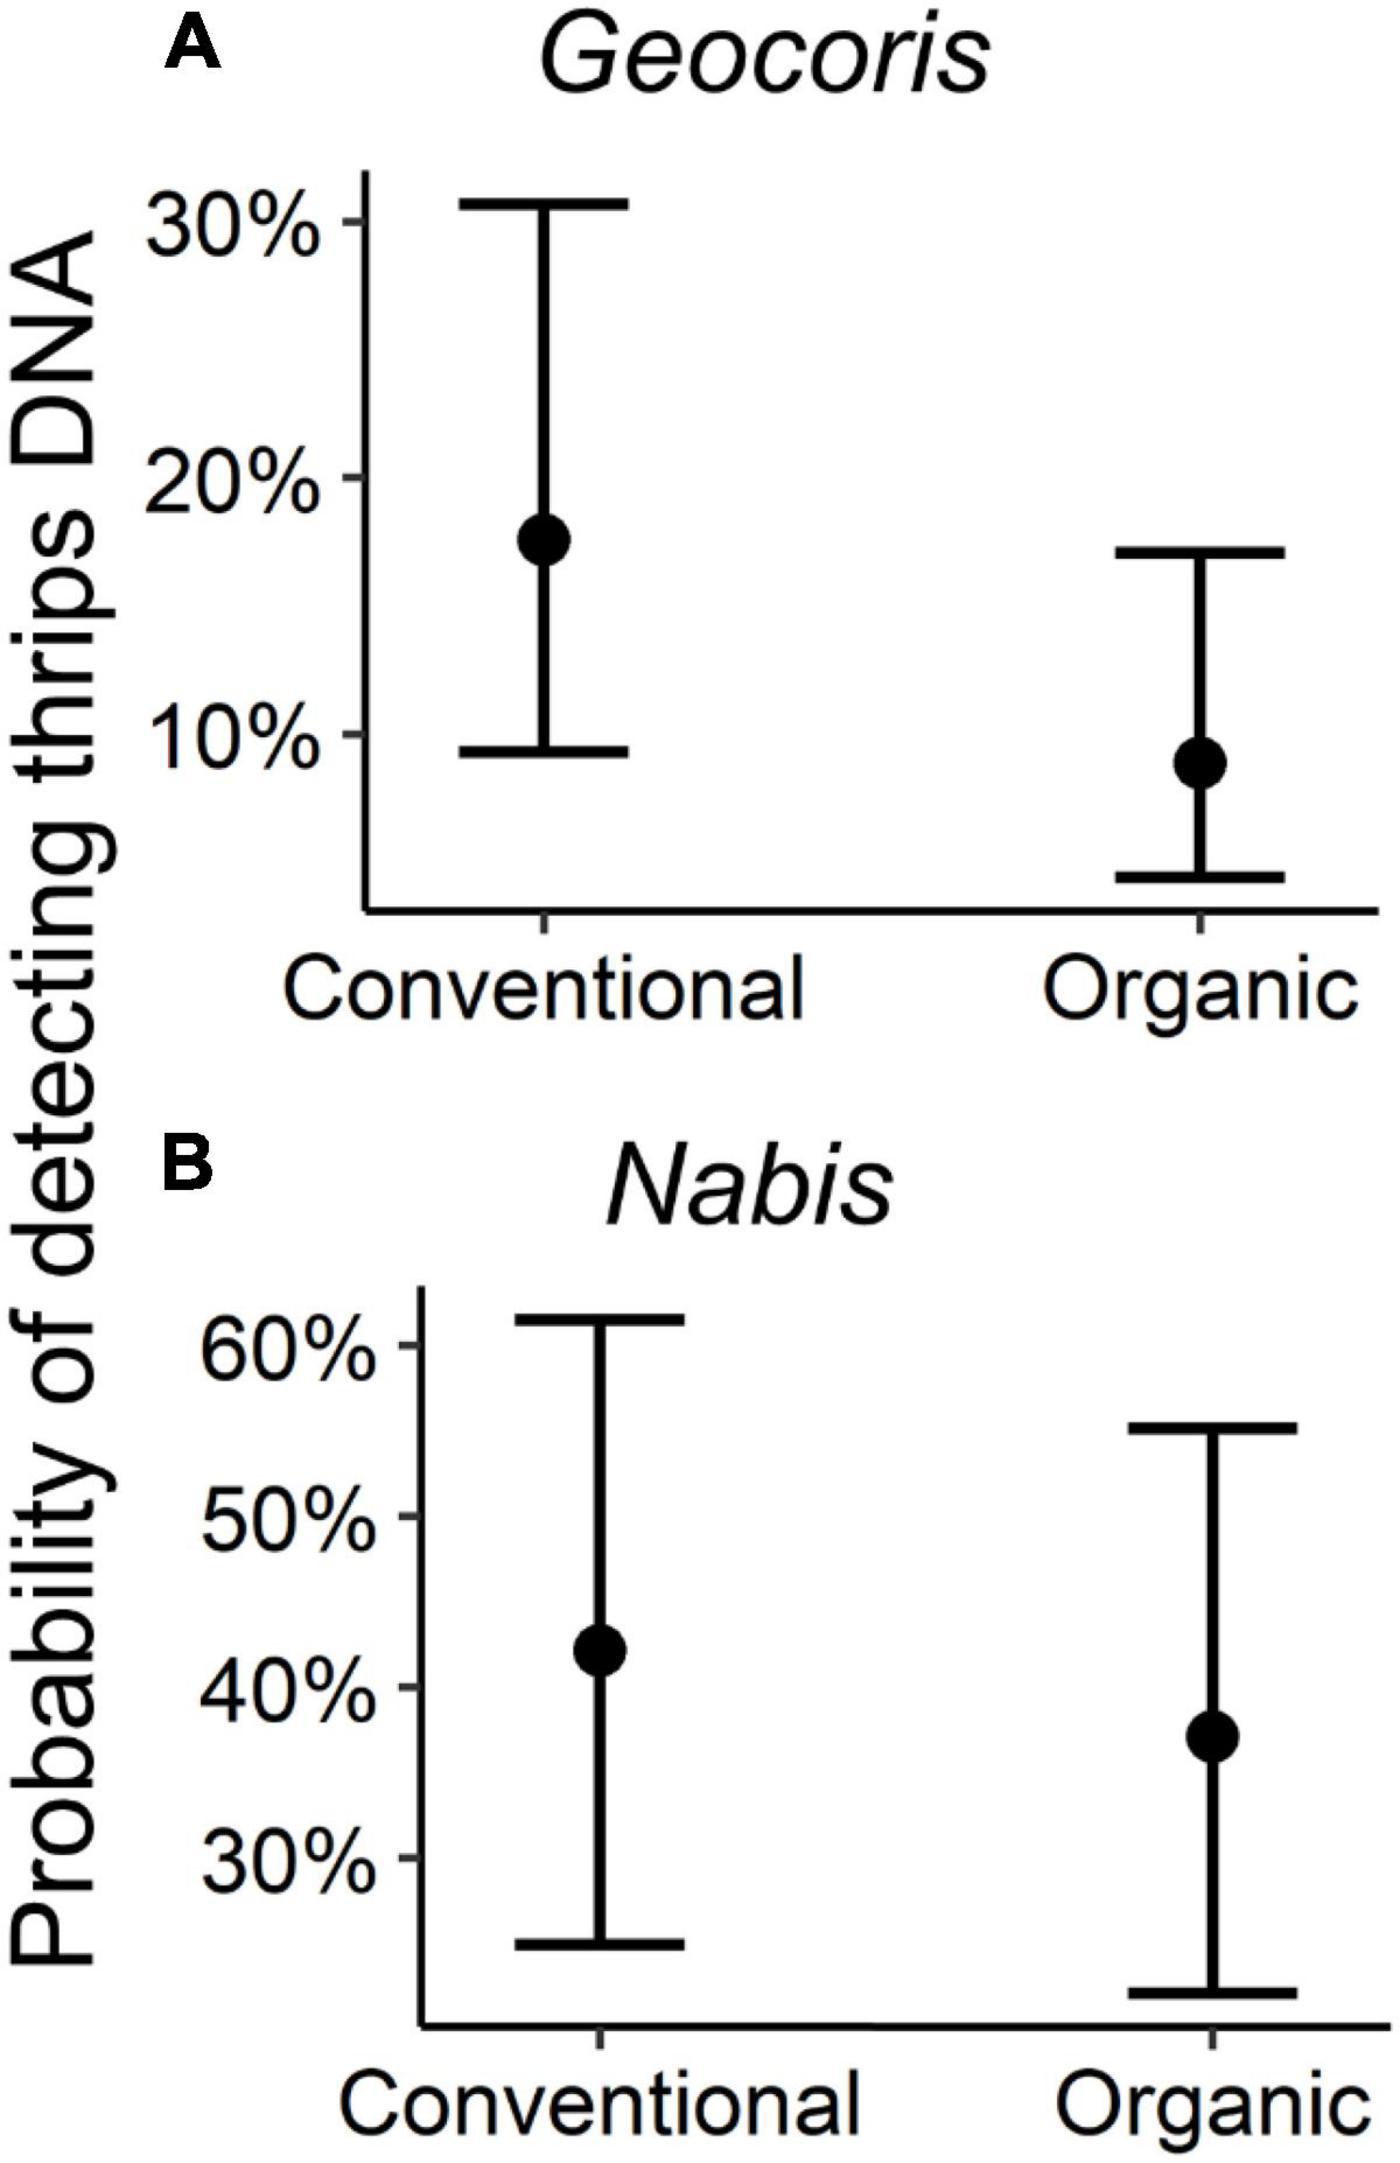
Figure 1. Probability of detection of western flower thrips DNA in (A) Geocoris and (B) Nabis by farming system. Figure shows the predicted values from the models including farming system alone using the “plot_model” function in the sjPlot package in R. Bars show 95% confidence interval.
However, we did find evidence for impacts of intraguild predation when examining our full model set. For probability of detection of western flower thrips DNA in Geocoris, three models had high support (i.e., ΔAICc < 2.0; Table 1). The best-supported model included an interaction between management (organic versus conventional) and thrips abundance, with probability of detection consistently increasing at sites with more thrips but with a steeper relationship in organic than conventional fields (Table 1 and Figure 2A). The second-best model suggested there was a decreasing probability of thrips detection in Geocoris with increasing Nabis abundance (Table 1 and Figure 3A). The third best-supported included an interaction between farm management and total arthropod abundance, with the probability of thrips detections increasing in conventional fields with relatively higher arthropod abundance, but the probability of thrips detection decreasing in organic fields with relatively higher arthropod abundance (Table 1 and Figure 2B).
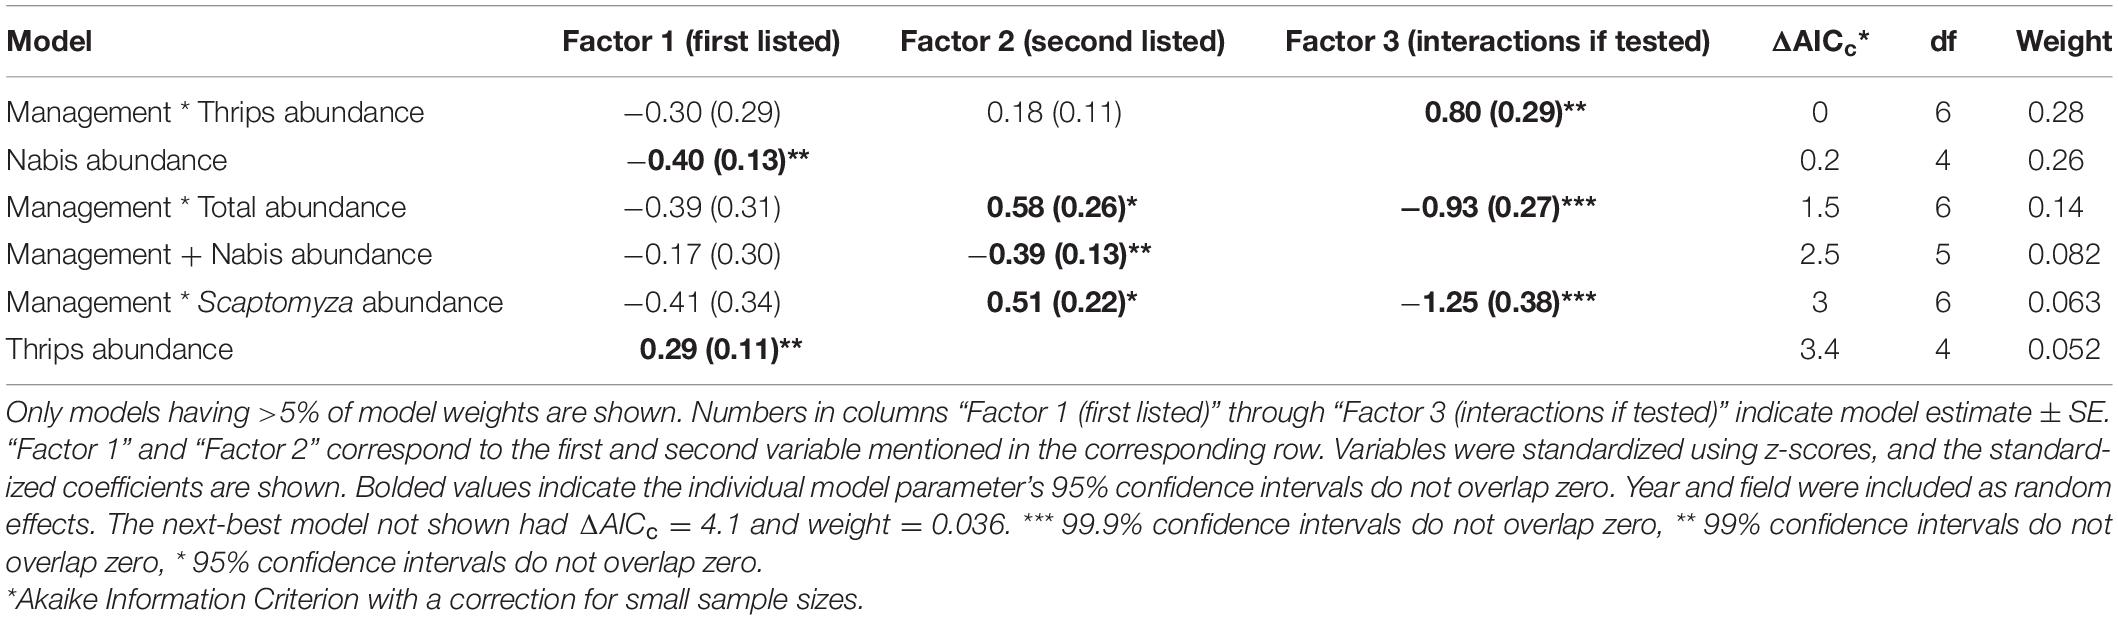
Table 1. Model selection results for arthropod community and farm management (conventional = 0, organic = 1) that influence the probability of detecting thrips DNA in Geocoris guts.
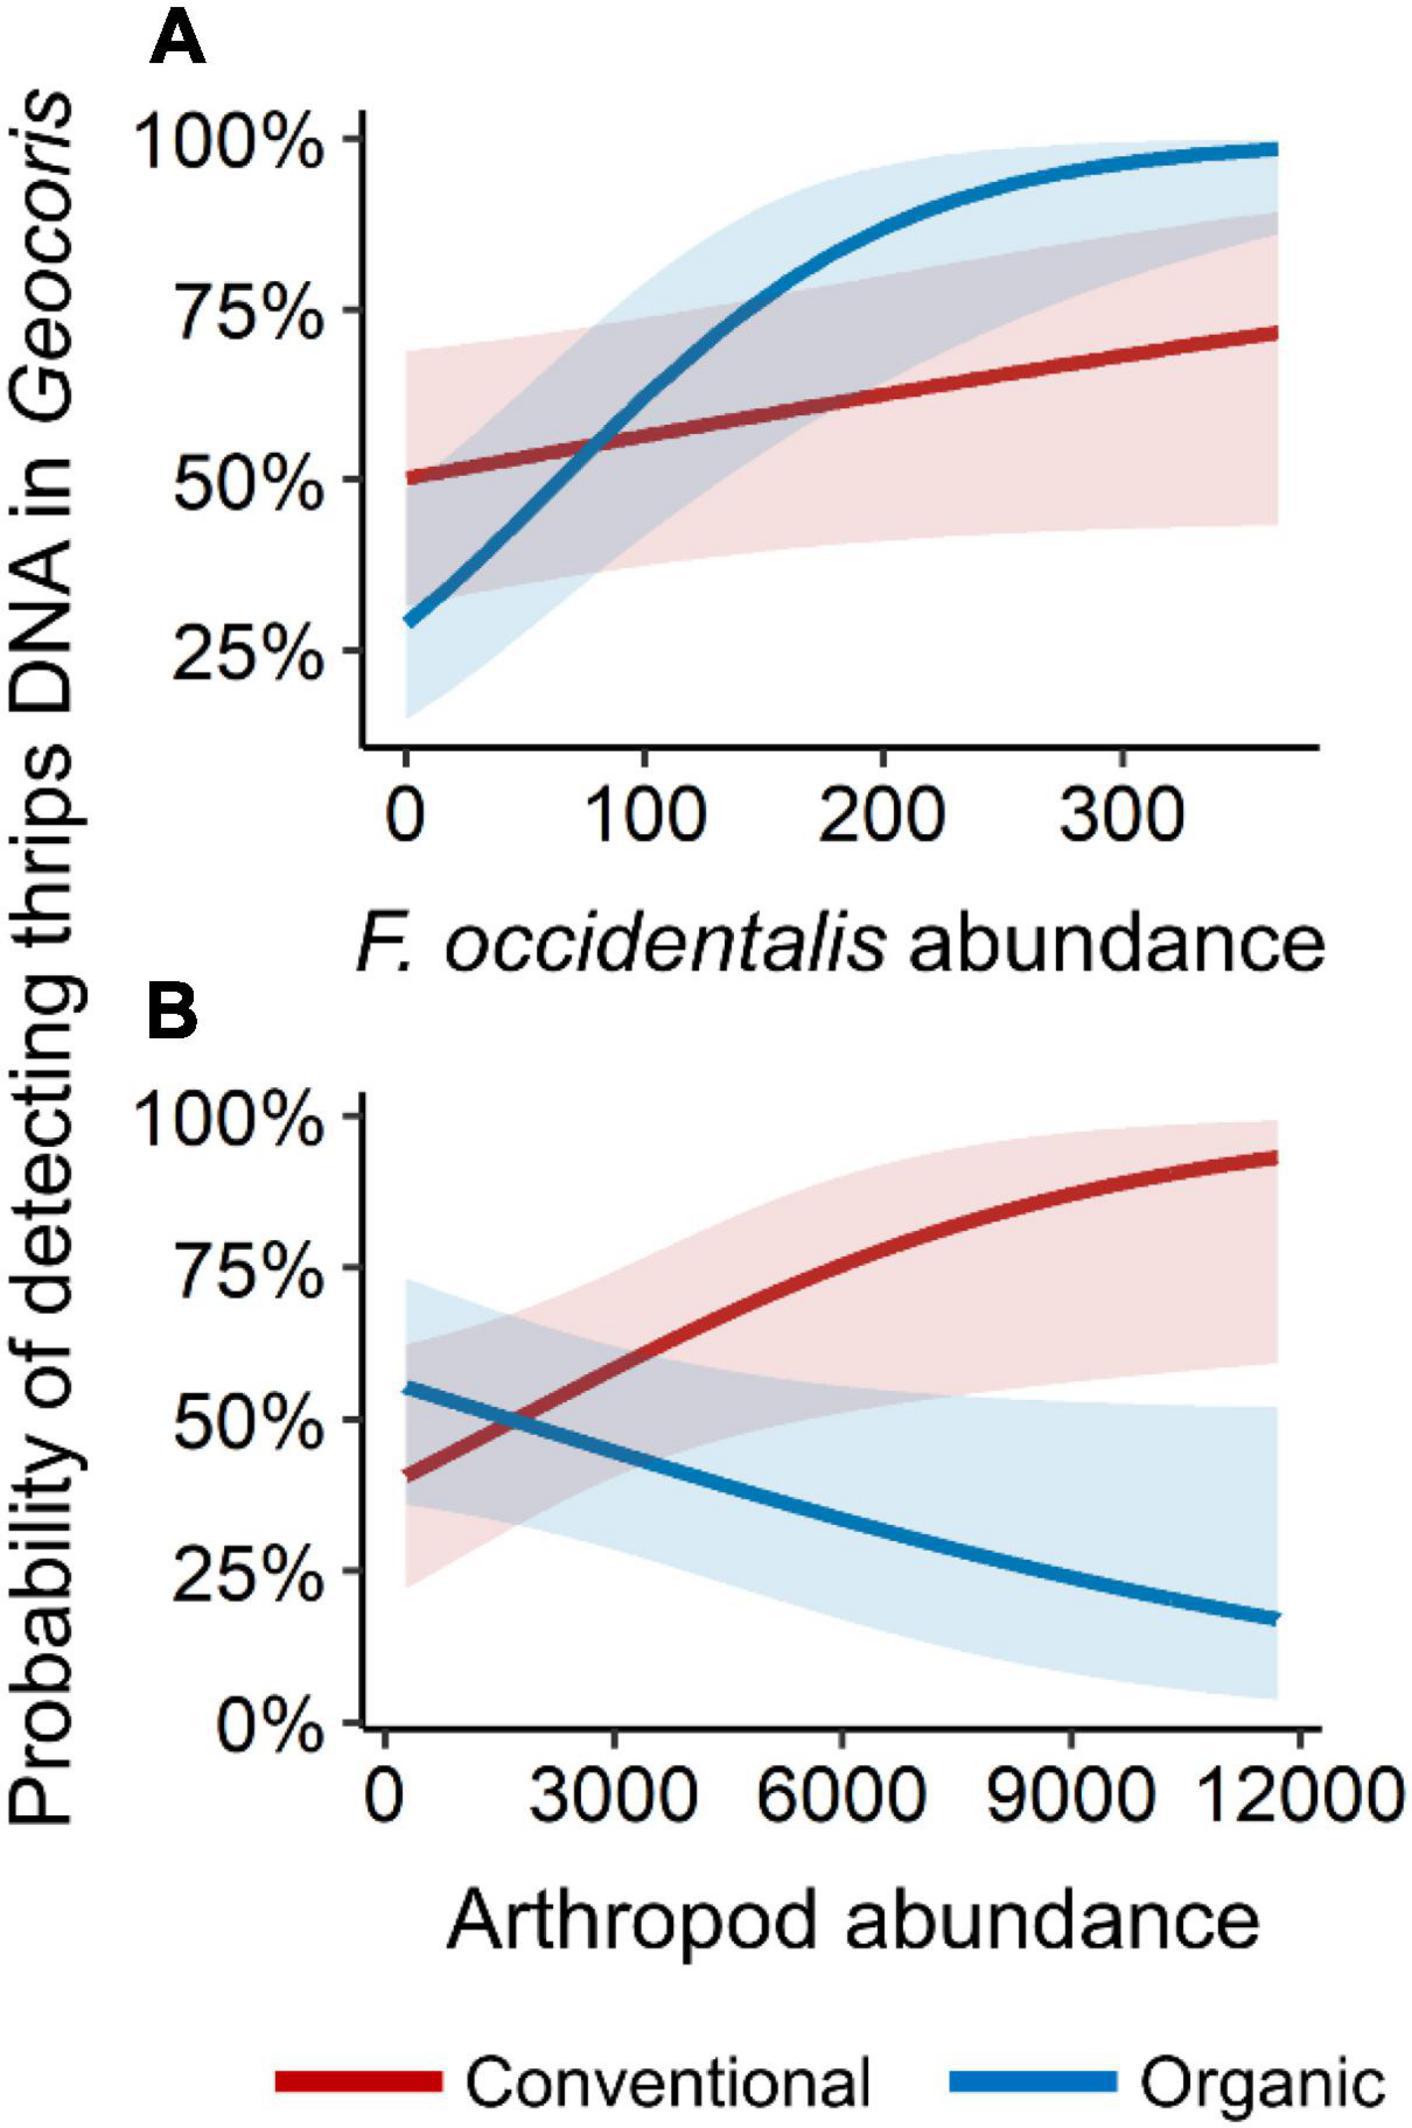
Figure 2. Probability of detection of western flower thrips DNA in Geocoris versus (A) western flower thrips abundance and (B) total arthropod abundance. Figure shows the predicted values from the best-supported models using the “plot_model” function in the sjPlot package in R. Red lines indicate conventional fields (red bands are 95% confidence intervals) and blue lines indicate organic fields (blue bands are 95% confidence intervals). X-variables were standardized in the candidate model set but are plotted on the original scale for visualization.
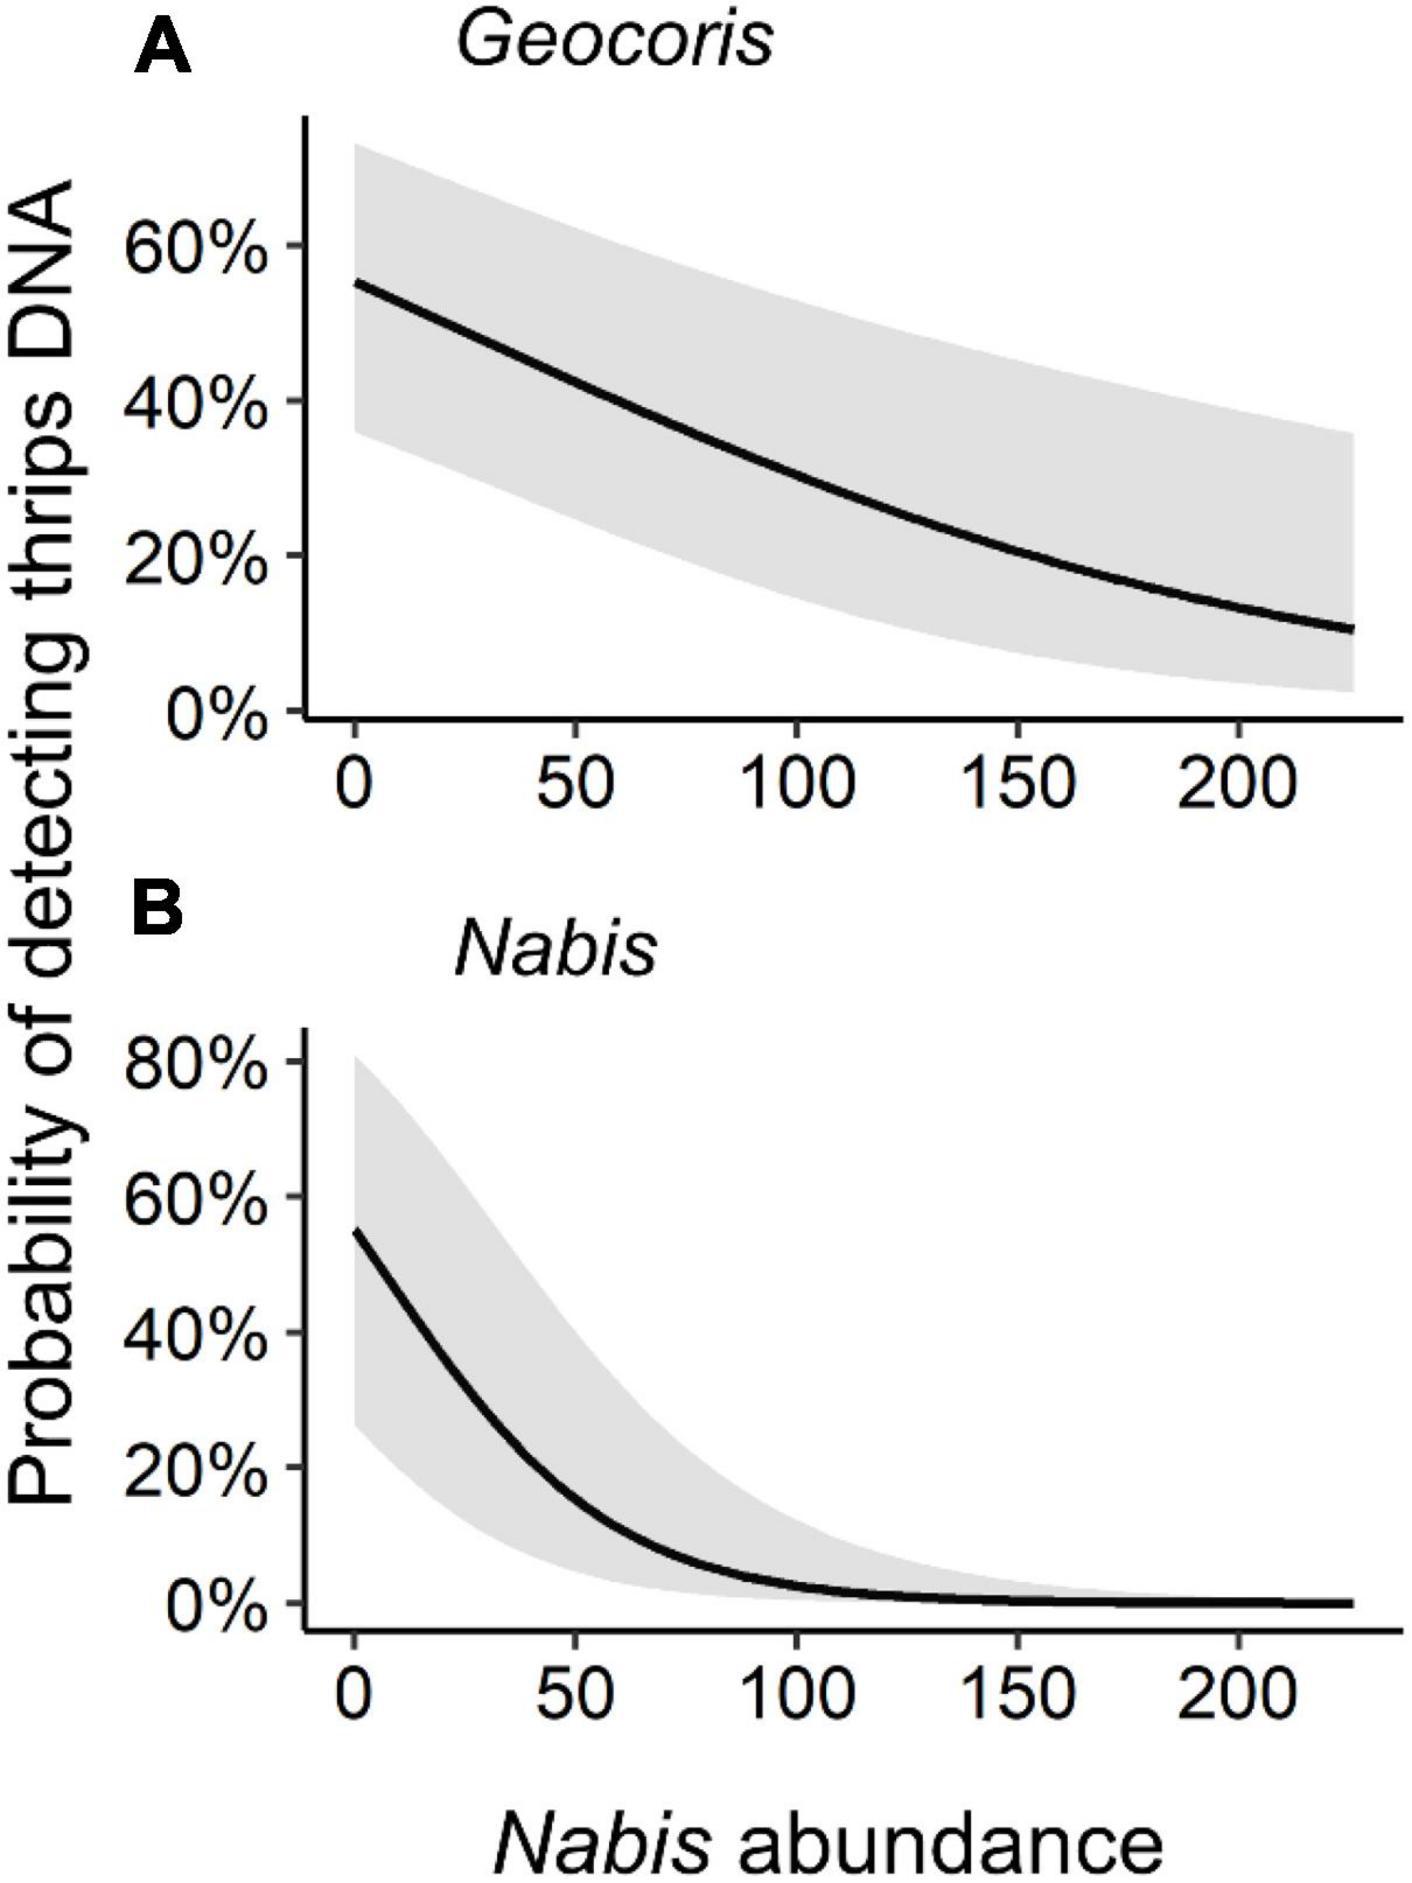
Figure 3. Probability of detection of western flower thrips DNA in (A) Geocoris and (B) Nabis by Nabis abundance. Gray bands are 95% confidence interval. Figure shows the predicted values from the best-supported models using the “plot_model” function in the sjPlot package in R. X-variables were standardized in the candidate model set but are plotted on the original scale for visualization.
Patterns were relatively straightforward for detection of western flower thrips DNA in Nabis. Here, both well-supported models included Nabis abundance, with the probability of thrips DNA detection decreasing as Nabis abundance increased (Table 2 and Figure 3B).
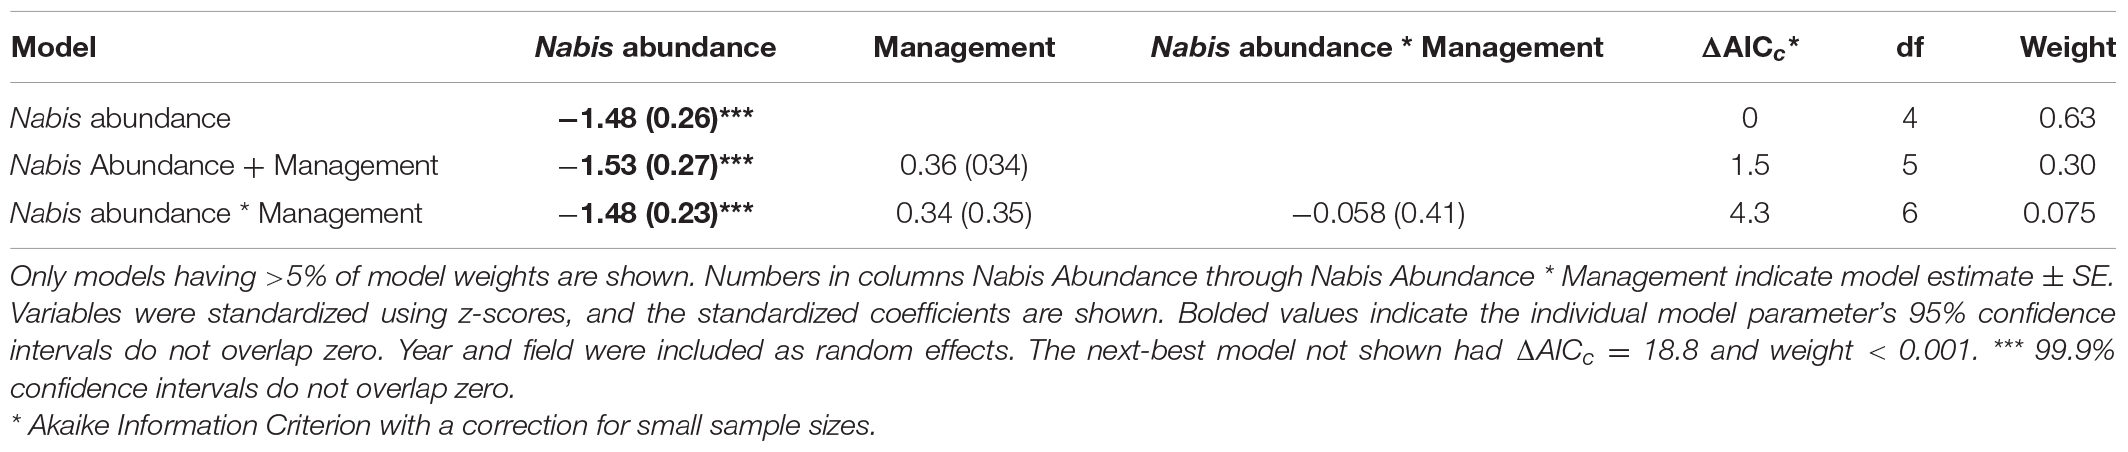
Table 2. Model selection results for arthropod community and farm management (conventional = 0, organic = 1) that influence the probability of detecting thrips DNA in Nabis guts.
Discussion
A simple comparison of predators collected from organic versus conventional fields did not show any significant difference in the probability of detection of western flower thrips DNA in either Geocoris or Nabis (Figure 1). However, this did not mean that farming system had no impact. Our model fitting efforts that considered several aspects of arthropod community structure alongside management, revealed several interesting interactions. Geocoris foraging in conventional fields were more likely to have thrips DNA detections with increasing total arthropod abundance (Figure 2B). The opposite pattern was found in organic fields, however, with greater arthropod abundance correlated with a lower probability of detection of thrips predation by Geocoris. One possible explanation is that, at the relatively low prey abundance and diversity typical of conventional potato fields (Krey et al., 2021), increases in prey trigger greater Geocoris foraging activity that leads a greater chance that they will find and eat thrips. In contrast, the plentiful prey in organic fields may instead draw attacks away from thrips as Geocoris feast on other prey. Another possibility is that very low arthropod abundances in conventional fields correlated with recent insecticide applications, with sublethal effects reducing overall predator foraging (Stark et al., 1995; Biondi et al., 2013). In either case, observations of Geocoris foraging behavior under low and high prey conditions, and in the presence versus absence of insecticide residue, would be needed to discern between these possible explanations. For Geocoris we also observed an interaction between western flower thrips abundance and the probability of detecting thrips DNA (Figure 2A). However, greater thrips abundance correlated with greater probability of thrips DNA detection, with the interaction perhaps simply resulting from a steeper relationship in organic than conventional fields (Figure 2A). In future work, it may be helpful to separate thrips collected in suction samples into life stages, or conduct open-field observations of predator foraging, to further delineate which thrips life stages were present and being attacked by which predator species. A final possibility is that organic fields were weedier, which might have complicated predator foraging to alter feeding relationships (e.g., Blubaugh et al., 2021) in organic versus conventional potato fields.
Interestingly, for both predator species, the probability of detection of thrips predation generally decreased in fields with higher Nabis abundance. This is consistent with greater predator-predator interference where Nabis was more abundant, leading either to reduced overall foraging or a switch away from predation on thrips. Previous work suggests that either explanation is possible. Nabis is an effective intraguild predator of Geocoris (Snyder et al., 2006), and also is highly cannibalistic (Takizawa and Snyder, 2011), such that predators might face heightened risk when foraging where Nabis is abundant. Geocoris in these fields do appear to feed more heavily on detritus-feeding S. pallida flies, rather than attacking aphids, in fields where other predator species are relatively more abundant; this suggests a feeding-niche shift when the threat of intraguild predation is higher (Krey et al., 2021). Altogether, these findings suggest another case where the contribution of generalist predators to biocontrol is reduced by altered foraging to reduce the risk of intraguild predation (e.g., Prasad and Snyder, 2006; Hosseini et al., 2021).
Molecular gut content analysis allows the inference of predation patterns under open field conditions, where predator-prey interactions naturally occur, without the constraints of caging or other artificial manipulations (King et al., 2008). However, the method does have its limitations that must be acknowledged. We could not discern how many thrips of what stages were consumed, if they were alive when consumed, or if the predator had eaten another natural enemy that had itself eaten thrips. Of course, scavenging or intraguild predation do not contribute to thrips suppression and might well weaken it (Juen and Traugott, 2005). All of the results reported here result from models that look for correlations among factors that differ among sites, but were not directly manipulated. It then remains uncertain whether the correlations reported here reflect true cause-effect relationships. Additionally, arthropod community metrics are often highly correlated (Supplementary Figure 1), making it difficult to isolate individual effects. Clearly, additional experimental work, ideally alongside observations of predator foraging behavior, are needed to further elucidate possible feeding relationships in this arthropod community. This would be particularly powerful if enough different fields could be sampled to construct and test the fit of Structural Equation Models, which could include explicit examination of indirect interactions suggested above (e.g., Blubaugh et al., 2021). Unfortunately, logistical constraints prevented us from sampling more fields in the study presented here.
Organic farming relies on natural processes, wherever possible, as an alternative to chemical interventions to control pests. This approach consistently leads to higher arthropod diversity in organic than conventional fields, including among natural enemies (Bengtsson et al., 2005; Hole et al., 2005; Crowder et al., 2010, 2012). Yet, pest abundance also generally is higher in organic fields, and greater natural pest suppression is not always apparent (Hilbeck and Kennedy, 1996; Macfadyen et al., 2009a,b; Schmidt et al., 2014; Muneret et al., 2018; Cloyd, 2020). The findings presented here suggest ecological complexities that might contribute to these general patterns. First, at the higher arthropod abundances typical of organic fields, growing abundance of possible prey correlated with reduced probability of detecting thrips DNA in Geocoris. Second, greater abundance of Nabis generally correlated with reduced probability of detection of thrips DNA in both Geocoris and Nabis. Higher predator abundance in organic fields, then, might lead to greater predator-predator interference that defuses any gains for pest suppression. So, robust arthropod communities may not necessarily translate into more effective biological control.
Conclusion
The effectiveness of generalist predators as biological control agents has long been questioned (DeBach and Rosen, 1991; Symondson et al., 2002). This is because the same polyphagy that allows predators to build their populations on detritus-feeding or other non-pest prey, can sometimes also distract them from attacking key herbivores (Harmon and Andow, 2004). Likewise, predators that feed heavily on other natural enemies might disrupt, rather than strengthen, net pest suppression (Rosenheim, 1998; Venzon et al., 2001; Finke and Denno, 2004; Janssen et al., 2007). We found evidence that these two disruptive interactions might reinforce one another, as detection of thrips DNA in predators was reduced both in the presence of abundant arthropod prey and with increasing abundance of predators perhaps drawn to those prey. This reinforces the complexity of feedbacks that might be seen in open field situations, where prey and predator abundance interact with one another in complex ways (Paul et al., 2020). Molecular gut content analysis, despite its limitations, may be a particularly powerful tool to detect these relationships against the high background arthropod diversity typical of real agricultural fields.
Data Availability Statement
The datasets presented in this study can be found in online repositories. The names of the repository/repositories and accession number(s) can be found below: https://www.ncbi.nlm.nih.gov/genbank/, MZ677017 – MZ677025, https://www.ncbi.nlm.nih.gov/genbank/, MZ677026 – MZ677035, and https://www.ncbi.nlm.nih.gov/genbank/, MZ677036 – MZ677047. Raw arthropod abundance and diversity, and gut content, data are provided in the Supplementary Material of this article.
Author Contributions
OS and WS led writing of the initial draft. EC and JH led molecular work. OS and MC led data analysis. DC, ZF, KK, CL, and GS led field work. All authors contributed to manuscript editing and revision.
Funding
This work was supported by the Washington State Potato Commission, the Washington State Commission on Pesticide Registration, the United States Department of Agriculture (USDA) Risk Avoidance and Mitigation Program (USDA-RAMP-2009-03174), and the USDA National Institute of Food and Agriculture Specialty Crop Research Initiative (USDA-SCRI-2015-09273).
Conflict of Interest
The authors declare that the research was conducted in the absence of any commercial or financial relationships that could be construed as a potential conflict of interest.
Publisher’s Note
All claims expressed in this article are solely those of the authors and do not necessarily represent those of their affiliated organizations, or those of the publisher, the editors and the reviewers. Any product that may be evaluated in this article, or claim that may be made by its manufacturer, is not guaranteed or endorsed by the publisher.
Acknowledgments
We thank the cooperating growers for their willing participation in this research. Carmen K. Blubaugh provided helpful comments on the project and assisted with data preparation. We thank Michael J. Sharkey for identifying the Hymenoptera taxa that we used to test the thrips primers.
Supplementary Material
The Supplementary Material for this article can be found online at: https://www.frontiersin.org/articles/10.3389/fevo.2022.752159/full#supplementary-material
References
Agustí, N., Shayler, S. P., Harwood, J. D., Vaughan, I. P., Sunderland, K. D., and Symondson, W. O. C. (2003). Collembola as alternative prey sustaining spiders in arable ecosystems: prey detection within predators using molecular markers. Mol. Ecol. 12, 3467–3475. doi: 10.1046/j.1365-294x.2003.02014.x
Balzan, M. V., Bocci, G., and Moonen, A. C. (2016). Utilisation of plant functional diversity in wildflower strips for the delivery of multiple agroecosystem services. Entomol. Exp. Appl. 158, 304–319. doi: 10.1111/eea.12403
Bengtsson, J., Ahnström, J., and Weibull, A.-C. (2005). The effects of organic agriculture on biodiversity and abundance: a meta-analysis. J. Appl. Ecol. 42, 261–269. doi: 10.1111/j.1365-2664.2005.01005.x
Biondi, A., Zappalà, L., Stark, J. D., and Desneux, N. (2013). Do biopesticides affect the demographic traits of a parasitoid wasp and its biocontrol services through sublethal effects? PLoS One 8:e76548. doi: 10.1371/journal.pone.0076548
Blaauw, B. R., and Isaacs, R. (2012). Larger wildflower plantings increase natural enemy density, diversity, and biological control of sentinel prey, without increasing herbivore density. Ecol. Entomol. 37, 386–394. doi: 10.1111/j.1365-2311.2012.01376.x
Blitzer, E. J., Dormann, C. F., Holzschuh, A., Klein, A. M., Rand, T. A., and Tscharntke, T. (2012). Spillover of functionally important organisms between managed and natural habitats. Agric. Ecosyst. Environ. 146, 34–43. doi: 10.1098/rspb.2016.0896
Blubaugh, C. K., Asplund, J. S., Smith, O. M., and Snyder, W. E. (2021). Does the “Enemies Hypothesis” operate by enhancing natural enemy evenness? Biol. Control 152:104464.
Brooks, M. E., Kristensen, K., van Benthem, K. J., Magnusson, A., Berg, C. W., Nielsen, A., et al. (2017). glmmTMB balances speed and flexibility among packages for zero-inflated generalized linear mixed modeling. R J. 9, 378–400.
Brust, G. E. (1994). Natural enemies in straw-mulch reduce Colorado potato beetle populations and damage in potato. Biol. Control 4, 163–169. doi: 10.1006/bcon.1994.1026
Buckman, R. S., Mound, L. A., and Whiting, M. A. (2013). Phylogeny of thrips (Insecta: Thysanoptera) based on five molecular loci. Syst. Entomol. 38, 123–133. doi: 10.1111/j.1365-3113.2012.00650.x
Burnham, K. P., and Anderson, D. R. (2002). Model Selection and Multimodel Inference: A Practical Information-Theoretic Approach, 2nd Edn. New York, NY: Springer-Verlag.
Burnham, K. P., Anderson, D. R., and Huyvaert, K. P. (2011). AIC model selection and multimodal inference in behavioral ecology: some background, observations, and comparisons. Behav. Ecol. Sociobiol. 65, 23–35. doi: 10.1007/s00265-010-1029-6
Chapman, E. G., Romero, S. A., and Harwood, J. D. (2010). Maximizing collection and minimizing risk: does vacuum suction sampling increase the likelihood for misinterpretation of food web connections? Mol. Ecol. Resour. 10, 1023–1033. doi: 10.1111/j.1755-0998.2010.02857.x
Cloyd, R. A. (2020). How effective is conservation biological control in regulating insect pest populations in organic crop production systems? Insects 11:744. doi: 10.3390/insects11110744
Crowder, D. W., Northfield, T. D., Gomulkiewicz, R., and Snyder, W. E. (2012). Conserving and promoting evenness: organic farming and fire-based wildland management as case studies. Ecology 93, 2001–2007. doi: 10.1890/12-0110.1
Crowder, D. W., Northfield, T. D., Strand, M. R., and Snyder, W. E. (2010). Organic agriculture promotes evenness and natural pest control. Nature 466, 109–112. doi: 10.1038/nature09183
Dainese, M., Schneider, G., Krauss, J., and Steffan-Dewenter, I. (2017). Complementarity among natural enemies enhances pest suppression. Sci. Rep. 7:8172. doi: 10.1038/s41598-017-08316-z
DeBach, P., and Rosen, D. (1991). Biological Control by Natural Enemies, 2nd Edn. New York, NY: Cambridge Univ. Press.
Edgar, R. C. (2004). MUSCLE: multiple sequence alignment with high accuracy and high throughput. Nucleic Acids Res. 32, 1792–1797. doi: 10.1093/nar/gkh340
Eubanks, M. D., and Denno, R. F. (2000a). Health food versus fast food: the effects of prey quality and mobility on prey selection by a generalist predator and indirect interactions among prey species. Ecol. Entomol. 25, 140–146. doi: 10.1046/j.1365-2311.2000.00243.x
Eubanks, M. D., and Denno, R. F. (2000b). Host plants mediate omnivore-herbivore interactions and influence prey suppression. Ecology 81, 936–947. doi: 10.1890/0012-9658(2000)081[0936:HPMOHI]2.0.CO;2
Finke, D. L., and Denno, R. F. (2002). Intraguild predation diminished in complex-structured vegetation: implications for prey suppression. Ecology 83, 643–652. doi: 10.1007/s00442-006-0443-y
Finke, D. L., and Denno, R. F. (2004). Predator diversity dampens trophic cascades. Nature 429, 407–410. doi: 10.1038/nature02554
Folmer, O., Black, M., Hoeh, W. R., Lutz, R., and Vrijenhoek, R. (1994). DNA primers for amplification of mitochondrial cytochrome c oxidase subunit I from diverse metazoan invertebrates. Mol. Mar. Biol. Biotechnol. 3, 294–299.
Greenop, A., Woodcock, B. A., Wilby, A., Cook, S. M., and Pywell, R. F. (2018). Functional diversity positively affects prey suppression by invertebrate predators: a meta-analysis. Ecology 9, 1771–1782. doi: 10.1002/ecy.2378
Gurr, G. M., Wratten, S. D., Landis, D. A., and You, M. (2017). Habitat management to suppress pest populations: progress and prospects. Annu. Rev. Entomol. 62, 91–109. doi: 10.1146/annurev-ento-031616-035050
Halaj, J., and Wise, D. H. (2002). Impact of a detrital subsidy on trophic cascades in a terrestrial grazing food web. Ecology 83, 3141–3151. doi: 10.1890/0012-9658(2002)083[3141:IOADSO]2.0.CO;2
Harmon, J. P., and Andow, D. A. (2004). Indirect effects between shared prey: predictions for biological control. BioControl 49, 605–626. doi: 10.1007/s10526-004-0420-5
Hartig, F. (2021). DHARMa: Residual Diagnostics for Hierarchical (Multi-Level/Mixed) Regression Models. R Package Version 0.4.4. Available online at: https://CRAN.R-project.org/package=DHARMa (accessed January 21, 2021).
Hebert, P. D. N., Cywinska, A., Ball, S. L., and de Waard, J. R. (2003). Biological identifications through DNA barcodes. Proc. R. Soc. B 270, 313–321. doi: 10.1098/rspb.2002.2218
Hilbeck, A., and Kennedy, G. G. (1996). Predators feeding on the Colorado potato beetle in insecticide-free plots and insecticide-treated commercial potato fields in eastern North Carolina. Biol. Control 6, 272–282. doi: 10.1006/bcon.1996.0034
Hironori, Y., and Katsuhiro, S. (1997). Cannibalism and interspecific predation in two predatory ladybirds in relation to prey abundance in the field. Entomophaga 42, 163–163. doi: 10.1127/archiv-hydrobiol/126/1992/163
Hole, D. G., Perkins, A. J., Wilson, J. D., Alexander, I. H., Grice, P. V., and Evans, A. D. (2005). Does organic farming benefit biodiversity? Biol. Conserv. 122, 113–130. doi: 10.1016/j.biocon.2004.07.018
Hosseini, M., Mehrparvar, M., Zytynska, S. E., Hatano, E., and Weisser, W. W. (2021). Aphid alarm pheromone alters larval behavior of the predatory gall midge, Aphidoletes aphidimyza and decreases intraguild predation by anthocorid bug, Orius laevigatus. Bull. Entomol. Res. 111, 445–453. doi: 10.1017/S0007485321000122
Ives, A. R., Cardinale, B. J., and Snyder, W. E. (2005). A synthesis of subdisciplines: predator-prey interactions, and biodiversity and ecosystem functioning. Ecol. Lett. 8, 102–116. doi: 10.1111/j.1461-0248.2004.00698.x
Janssen, A., Sabelis, M. W., Magalhães, S., Montserrat, M., and Van der Hammen, T. (2007). Habitat structure affects intraguild predation. Ecology 88, 2713–2719. doi: 10.1890/06-1408.1
Johnson, J. M., Hough-Goldstein, J. A., and Vangessel, M. J. (2004). Effects of straw mulch on pest insects, predators, and weeds in watermelons and potatoes. Environ. Entomol. 33, 1632–1643. doi: 10.1603/0046-225X-33.6.1632
Jonsson, M., Kaartinen, R., and Straub, C. S. (2017). Relationships between natural enemy diversity and biological control. Curr. Opin. Insect Sci. 20, 1–6. doi: 10.1016/j.cois.2017.01.001
Juen, A., and Traugott, M. (2005). Detecting predation and scavenging by DNA gut-content analysis: a case study using a soil insect predator-prey system. Oecologia 142, 344–352. doi: 10.1007/s00442-004-1736-7
Kaur, N. (ed.). (2021). Pacific Northwest Insect Management Handbook. Corvallis, OR: Oregon State University.
King, R. A., Read, D. S., Traugott, M., and Symondson, W. O. C. (2008). Molecular analysis of predation: a review of best practice for DNA-based approaches. Mol. Ecol. 17, 947–963. doi: 10.1111/j.1365-294X.2007.03613.x
Koss, A. M., and Snyder, W. E. (2005). Alternative prey disrupt biocontrol by a guild of generalist predators. Biol. Control 32, 243–251. doi: 10.1016/j.biocontrol.2004.10.002
Koss, A. M., Jensen, A. S., Schreiber, A., Pike, K. S., and Snyder, W. E. (2005). A comparison of predator and pest communities in Washington potato fields treated with broad-spectrum, selective or organic insecticides. Environ. Entomol. 34, 87–95. doi: 10.1603/0046-225X-34.1.87
Krey, K. L., Blubaugh, C. K., Chapman, E. G., Lynch, C. M., Snyder, G. B., Jensen, A. S., et al. (2017). Generalist predators consume spider mites despite the presence of alternative prey. Biol. Control 115, 157–164. doi: 10.1016/j.biocontrol.2017.10.007
Krey, K. L., Smith, O. M., Chapman, E. G., Crossley, M. S., Crowder, D. W., Fu, Z., et al. (2021). Prey and predator biodiversity mediate aphid consumption by generalists. Biol. Control 160:104650. doi: 10.1016/j.biocontrol.2021.104650
Letourneau, D. K., Jedlicka, J. A., Bothwell, S. G., and Moreno, C. R. (2009). Effects of natural enemy biodiversity on the suppression of arthropod herbivores in terrestrial ecosystems. Annu. Rev. Ecol. Evol. Syst. 40, 573–592. doi: 10.1038/nature12911
Lucas, E., Coderre, D., and Brodeur, J. (1998). Intraguild predation among aphid predators: characterization and influence of extraguild prey densities. Ecology 79, 1084–1092.
Lüdecke, D., Makowski, D., and Waggoner, P. (2020). Performance: Assessment of Regression Models Performance. R Packag. Version 0.4.4.
Macfadyen, S., Gibson, R., Raso, D., Sint, M., Traugott, J., and Memmott, J. (2009a). Parasitoid control of aphids in organic and conventional farming systems. Agric. Ecosyst. Environ. 133, 14–18. doi: 10.1890/12-1819.1
Macfadyen, S., Gibson, R., Polaszek, A., Morris, R. J., Craze, P. G., Planqué, R., et al. (2009b). Do differences in food web structure between organic and conventional farms affect the ecosystem service of pest control? Ecol. Lett. 12, 229–238. doi: 10.1111/j.1461-0248.2008.01279.x
Middleton, E., and MacRae, I. V. (2021). Wildflower plantings in commercial agroecosystems promote generalist predators of Colorado potato beetle. Biol. Control 152:104463.
Muneret, L., Mitchell, M., Seufert, V., Aviron, S., Djoudi, E. A., Pétillon, J., et al. (2018). Evidence that organic farming promotes pest control. Nat. Sustain. 1, 361–368. doi: 10.1038/s41893-018-0102-4
Patt, J. M., Lashomb, J. H., and Hamilton, G. C. (1997). Impact of strip-insectary interplanting with flowers on conservation biological control of the Colorado potato beetle. Adv. Hortic. Sci. 11, 175–181.
Paul, K. B., Yurkowski, D. J., Lees, K. J., and Hussey, N. E. (2020). Measuring the occurrence and strength of intraguild predation in modern foodwebs. Food Webs 25:e00165.
Prasad, R. P., and Snyder, W. E. (2006). Polyphagy complicates conservation biological control that targets generalist predators. J. Appl. Ecol. 43, 343–352.
Preisser, E. L., Bolnick, D. I., and Benard, M. F. (2005). Scared to death? The effects of intimidation and consumption in predator-prey interactions. Ecology 86, 501–509.
Preisser, E. L., Orrock, J. L., and Schmitz, O. J. (2007). Predator hunting mode and habitat domain alter nonconsumptive effects in predator-prey interactions. Ecology 88, 2744–2751. doi: 10.1890/07-0260.1
Rosenheim, J. A. (1998). Higher-order predators and the regulation of insect herbivore populations. Annu. Rev. Entomol. 43, 421–447. doi: 10.1146/annurev.ento.43.1.421
Rozen, S., and Skaletsky, H. J. (1998). Primer3’. Available online at https://bioinfo.ut.ee/primer3-0.4.0/ (accessed October 1, 2011).
Schmidt, J. M., Barney, S. K., Williams, M. A., Bessin, R. T., Coolong, T. W., and Harwood, J. D. (2014). Predator–prey trophic relationships in response to organic management practices. Mol. Ecol. 23, 3777–3789. doi: 10.1111/mec.12734
Schmitz, O. J. (2009). Effects of predator functional diversity on grassland ecosystem function. Ecology 90, 2339–2345. doi: 10.1890/08-1919.1
Schmitz, O. J., Beckerman, A. P., and O′Brien, K. M. (1997). Behaviorally mediated trophic cascades: effects of predation risk on food web interactions. Ecology 78, 1388–1399. doi: 10.1890/0012-9658(1997)078[1388:bmtceo]2.0.co;2
Settle, W. H., Ariawan, H., Astuti, E. T., Cahyana, W., Hakim, A. L., Hindayana, D., et al. (1996). Managing tropical rice pests through conservation of generalist natural enemies and alternative prey. Ecology 77, 1975–1988. doi: 10.2307/2265694
Snyder, W. E. (2019). Give predators a complement: conserving natural enemy biodiversity to improve biocontrol. Biol. Control 135, 73–82.
Snyder, W. E., Snyder, G. B., Finke, D. L., and Straub, C. S. (2006). Predator biodiversity strengthens herbivore suppression. Ecol. Lett. 9, 789–796. doi: 10.1111/j.1461-0248.2006.00922.x
Stark, J. D., Jepson, P. C., and Mayer, D. F. (1995). Limitations to use of topical toxicity data for predictions of pesticide side effects in the field. J. Econ. Entomol. 88, 1081–1088.
Stoner, K. A., Ferrandino, F. J., Gent, M. P. N., Elmer, W. H., and Lamonida, J. A. (1996). Effects of straw mulch, spent mushroom compost, and fumigation on the density of Colorado potato beetle (Coleoptera: Chyrsomelidae) in potatoes. J. Econ. Entomol. 89, 1267–1280. doi: 10.1093/jee/89.5.1267
Symondson, W. O. C., Cesarini, S., Dodd, P. W., Harper, G. L., Bruford, M. W., Glen, D. M., et al. (2006). Biodiversity vs. biocontrol: positive and negative effects of alternative prey on control of slugs by carabid beetles. Bull. Entomol. Res. 96, 637–645. doi: 10.1017/ber2006467
Symondson, W. O. C., Sunderland, K. D., and Greenstone, M. H. (2002). Can generalist predators be effective biocontrol agents? Annu. Rev. Entomol. 47, 561–594. doi: 10.1146/annurev.ento.47.091201.145240
Takizawa, T., and Snyder, W. E. (2011). Predator biodiversity increases the survivorship of juvenile predators. Oecology 166, 723–730. doi: 10.1007/s00442-010-1891-y
Venzon, M., Janssen, A., and Sabelis, M. W. (2001). Prey preference, intraguild predation and population dynamics of an arthropod food web on plants. Exp. Appl. Acarol. 25, 785–808. doi: 10.1023/a:1020443401985
Keywords: alternative prey, predator interference, complementarity, biodiversity and biocontrol, organic farming
Citation: Smith OM, Chapman EG, Crossley MS, Crowder DW, Fu Z, Harwood JD, Jensen AS, Krey KL, Lynch CA, Snyder GB and Snyder WE (2022) Alternative Prey and Predator Interference Mediate Thrips Consumption by Generalists. Front. Ecol. Evol. 10:752159. doi: 10.3389/fevo.2022.752159
Received: 02 August 2021; Accepted: 12 January 2022;
Published: 23 February 2022.
Edited by:
Christopher Williams, Liverpool John Moores University, United KingdomReviewed by:
Raphael Didham, Commonwealth Scientific and Industrial Research Organisation (CSIRO), AustraliaInga Reich, MKO - Planning & Environmental Consultants, Ireland
Copyright © 2022 Smith, Chapman, Crossley, Crowder, Fu, Harwood, Jensen, Krey, Lynch, Snyder and Snyder. This is an open-access article distributed under the terms of the Creative Commons Attribution License (CC BY). The use, distribution or reproduction in other forums is permitted, provided the original author(s) and the copyright owner(s) are credited and that the original publication in this journal is cited, in accordance with accepted academic practice. No use, distribution or reproduction is permitted which does not comply with these terms.
*Correspondence: William E. Snyder, d2VzbnlkZXJAdWdhLmVkdQ==